Article

Experimental Study of Pore-Scale Water Flooding with Phase Change Based on a Microfluidic Model in Volatile Carbonate Reservoirs

1
State Key Laboratory of Petroleum Resources and Prospecting, China University of Petroleum (Beijing), Beijing 102249, China
2
College of Petroleum Engineering, China University of Petroleum (Beijing), Beijing 102249, China
*
Author to whom correspondence should be addressed.
Appl. Sci. 2023, 13(11), 6642; https://doi.org/10.3390/app13116642
Submission received: 12 January 2023 / Revised: 21 February 2023 / Accepted: 22 February 2023 / Published: 30 May 2023
(This article belongs to the Special Issue Development and Production of Oil Reservoirs)

Abstract

:
Carbonate reservoirs usually have strong heterogeneity, with complex pore structure and well-developed natural fractures. During reservoir development, when the formation pressure is lower than the bubble point pressure of crude oil, the fluid undergoes phase change and degassing. This leads to the subsequent waterflooding displacement under the oil–gas two-phase condition, also followed by a secondary phase change of oil and gas caused by the increase in formation pressure. In this paper, the glass etching model is used to carry out microfluidic experiments. The porous carbonate model and the fractured porous carbonate model are designed to simulate the process of depletion development and waterflooding development. In the process of depletion development, it can be observed that the crude oil degassing and gas phase occurrence areas of the porous model are in the order of the large pore throat area first, followed by the small pore throat area. And the crude oil degassing and gas phase occurrence order in the fractured porous model is as follows: fractures, large pore throat area and, finally, small pore throat area. In the process of converting to the waterflooding development, the early stage of the replacement reflects the obvious characteristic of “displace oil but not gas”; with the replenishment of formation energy, the gas redissolution area expands from the mainstream to other areas, and the waterflooding mobilization increases. The characteristics of oil, gas and water flow in different stages of carbonate reservoirs with different pore-fracture characteristics that are clarified, and the characteristics of fluid migration and the distribution under the condition of oil and gas coexisting and water flooding after crude oil degassing are explored, and the water displacement mechanism of volatile carbonate reservoirs with different pressure levels is revealed.

1. Introduction

Carbonate reservoirs are an important part of worldwide oil and gas resources. This type of reservoir usually has strong heterogeneity [1,2,3], with a complex pore structure and well-developed natural fractures. During reservoir development [4,5,6,7], the fluid undergoes phase change and degassing when the formation pressure is lower than the bubble point pressure of crude oil. This leads to the subsequent waterflooding displacement under oil and gas two-phase condition, also followed by a secondary phase change of oil and gas caused by the increasing of formation pressure [8,9,10]. Understanding the oil and gas migration mechanism and how the flow behavior of water drives the phase change of oil and gas is important for waterflooding, especially for achieving economic and efficient development of volatile carbonate reservoirs.
Wang applied the two-dimensional etched glass micropore model, through visualization technology, to study the characteristics of the gas–liquid phase change in condensate gas on a micro level [11]. As the pressure decreased, the anti-condensate liquid first appeared in the small pores and the tip of the blind pore, then gradually filled the larger pores. When the pressure dropped to the maximum anti-condensate pressure of the condensate gas, the evaporation of the anti-condensate liquid in the pores was reduced. It reflected the role of porous media adsorption and capillary aggregation. Song carried out physical simulation experiments by using two capillary models (lipophilic and hydrophilic) and a planar glass bead porous media-filling model to study the mechanism of gas–liquid seepage accompanied by phase change [12]. It is found that the pipe radius and seepage velocity have an influence on the oil–gas ratio during gas–liquid seepage accompanied by the phase change under low-pressure conditions. If the capillary radius grows longer and the seepage velocity increases, the gas–liquid ratio will be raised, but the absolute pressure reduction will be small. It is found that the suitable water injection time is when the formation pressure is reduced to more than 87% of the bubble point pressure. Alizadeh demonstrated capillary interactions between flowing bubbles and previously captured oil phases (three-phase ganglion dynamics) by using an etched glass microfluidic pore network model and a micro-core oil-flooding device, integrated with microcomputer tomography (CT) imaging equipment [13]. It enabled some of the crude oil to be mobilized and significantly improved oil recovery [14,15]. Based on the pore network experiment of the sandfill core and the simulation parameters measured by the experiment, Chen used the gas–water seepage model to predict the relative permeability and capillary force of the gas–water phase under different temperature and pressure conditions [16]. The size of filling sand particles, injection pressure and temperature had different effects on the gas–liquid seepage characteristics at different stages. Zhao carried out experiments on the properties of crude oil PVT and core displacement [17,18], based on characteristics of crude oil phase and reservoirs. They discovered the influence of crude oil phase transition on the seepage characteristics and development effects of reservoirs with different fracturing degrees, and suggested that water injection should be appropriately started as soon as possible when developing weak volatile carbonate reservoirs [19]. Chen studied the law of near-critical fluid phase transition and the law of physical property change through conventional fluid PVT experiments and reservoir production dynamic analysis [20]. It was found that the near-critical fluid while developing volatile reservoirs is in an unbalanced phase transition system. A degassing lag effect occurred in the production process. When the system pressure is reduced to the same value, the degassing speed during high-pressure falling speed is smaller than during low-pressure falling speed, and it is much smaller than the degassing speed during the equilibrium phase transition.
In recent years, scholars at home and abroad have adopted a variety of experimental methods, including etched glass experiments, plane sand filling experiments, CT scanning technology and PVT experiments, to study the phase transition process of formation fluids in the process of developing oil and gas reservoirs [21,22,23,24,25,26,27,28]. Most of their studies are about the gas–liquid seepage, but there are fewer studies on the oil–gas–water seepage experiments and mechanisms [29,30]. In this paper, the glass etching model is used to carry out microfluidic experiments to observe the phase transition and the occurrence state of gas in the process of crude oil degassing under microscopic conditions, and the sequence and process of injected water entering fractures and large and small throat. The characteristics of oil-, gas- and water-flow in different stages of carbonate rocks with different pore-fracture characteristics are clarified, the characteristics of fluid migration and distribution under the condition of oil and gas coexisting with water flooding after crude oil degassing is explored, and the water displacement mechanism of weakly volatile carbonate reservoirs with different pressure levels is revealed.

2. Experimental Material

2.1. Simulated Live Oil Fluid

In order to simulate the real groundwater flooding process, live oil was used in the experiment, considering that the formation pressure dropped below saturation pressure accompanied by crude oil degassing. For experiments where the pressure is below the saturation pressure, firstly, one needs to prepare live oil, and the main instrument used to prepare live oil is the live oil sampler.
Oil used for configuration: In this experiment 99.7 anhydrous kerosene was used and dyed red with Sudan III dye. Kerosene has a viscosity of 2.5 mPa·s, a density of 0.8 g/cm3, a freezing point of −47 °C, a boiling range of 180–310 °C, and an average molecular weight of 200–250. Gas used for configuration: In this experiment, the carbon dioxide cylinder is compressed into the piston sampler at 20 °C (room temperature). Water used for experiments: The displacement solution used in this experiment is a mixture of distilled water and glycerin, and dyed blue with methyl blue dye. Distilled water viscosity 1 mPa·s, density 1 g/cm3, freezing point 0 °C, boiling point 100 °C, molecular weight 18; Glycerol viscosity 1412 mPa·s, density 1.26 g/cm3, melting point 18 °C, boiling point 291 °C, molecular weight 92.
The main steps of configuration are as follows: firstly, pour 1 L kerosene into the sampler, cover the lid, and start filling water at the other end until the oil comes out of the sampler. Then, inject carbon dioxide gas into the sample-preparation end. After the injection is completed, inject water into the water-injection end to make the pressure rise to about 6 MPa and stop water injection. Finally, open the swing device, swinging around for one day, after which the oil can be configured. The prepared live oil is transferred to the PVT instrument, and its physical property parameters are further measured. The saturation pressure is 1.3 Mpa, and the dissolved gas–oil ratio is 30 m3/m3.

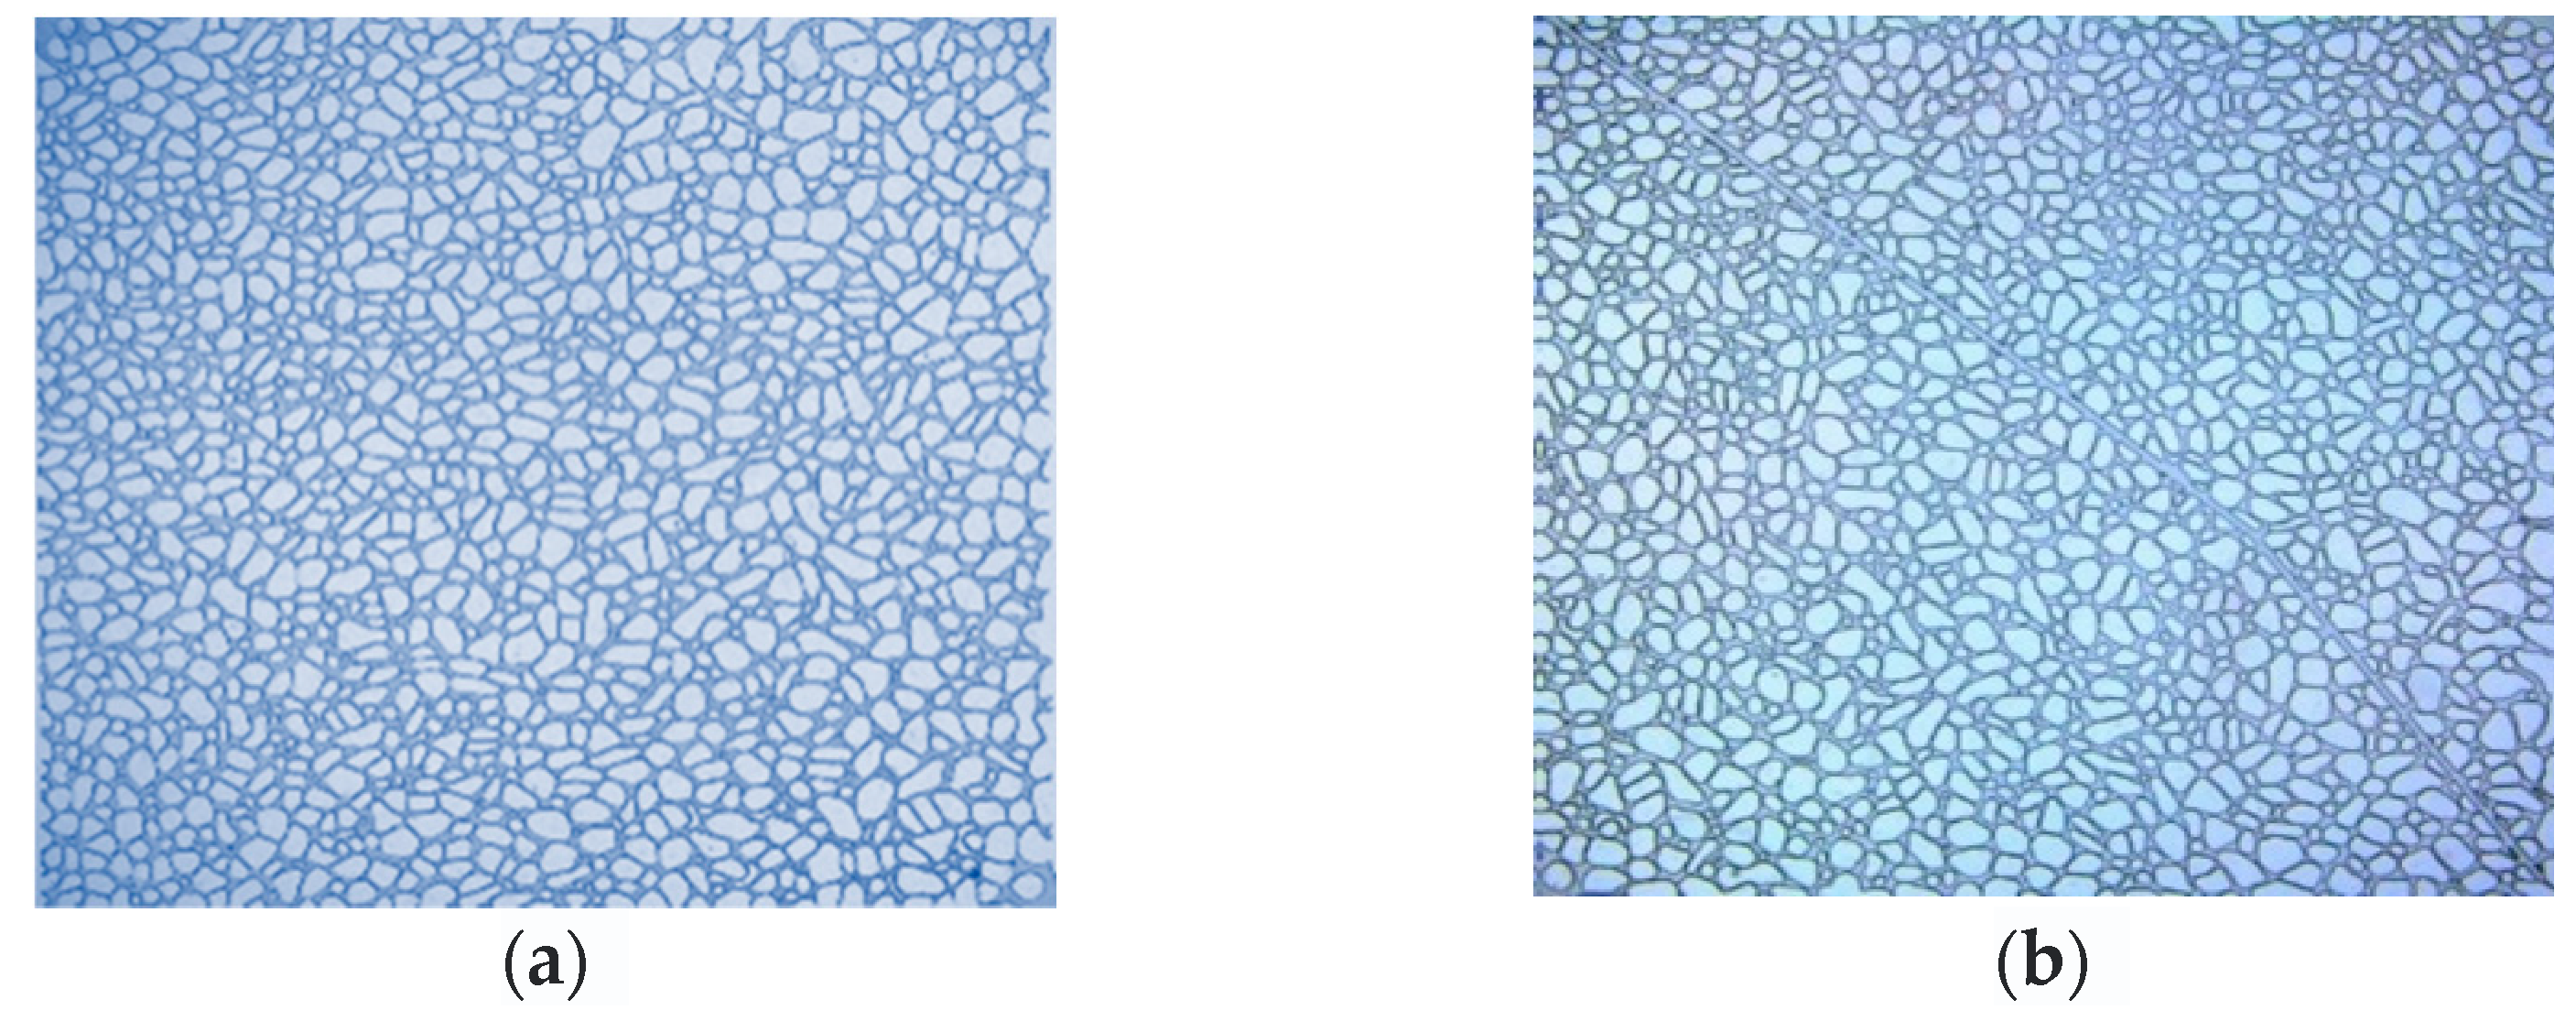
2.2. Microfluidic Model Design

The microfluidic model of the microfluidic experiment selects the glass etching model, which has the advantages of relatively simple production, easy operation and easy observation. Meanwhile, according to the experimental scheme, two types of microfluidic models are required for microfluidic experiments, including the porous carbonate model and the fractured porous carbonate model, in which the fractures of the fractured porous carbonate model are parallel to the mainstream line. Therefore, it is necessary to select the casting thin section data of typical wells in the actual oilfield to design the microfluidic model.

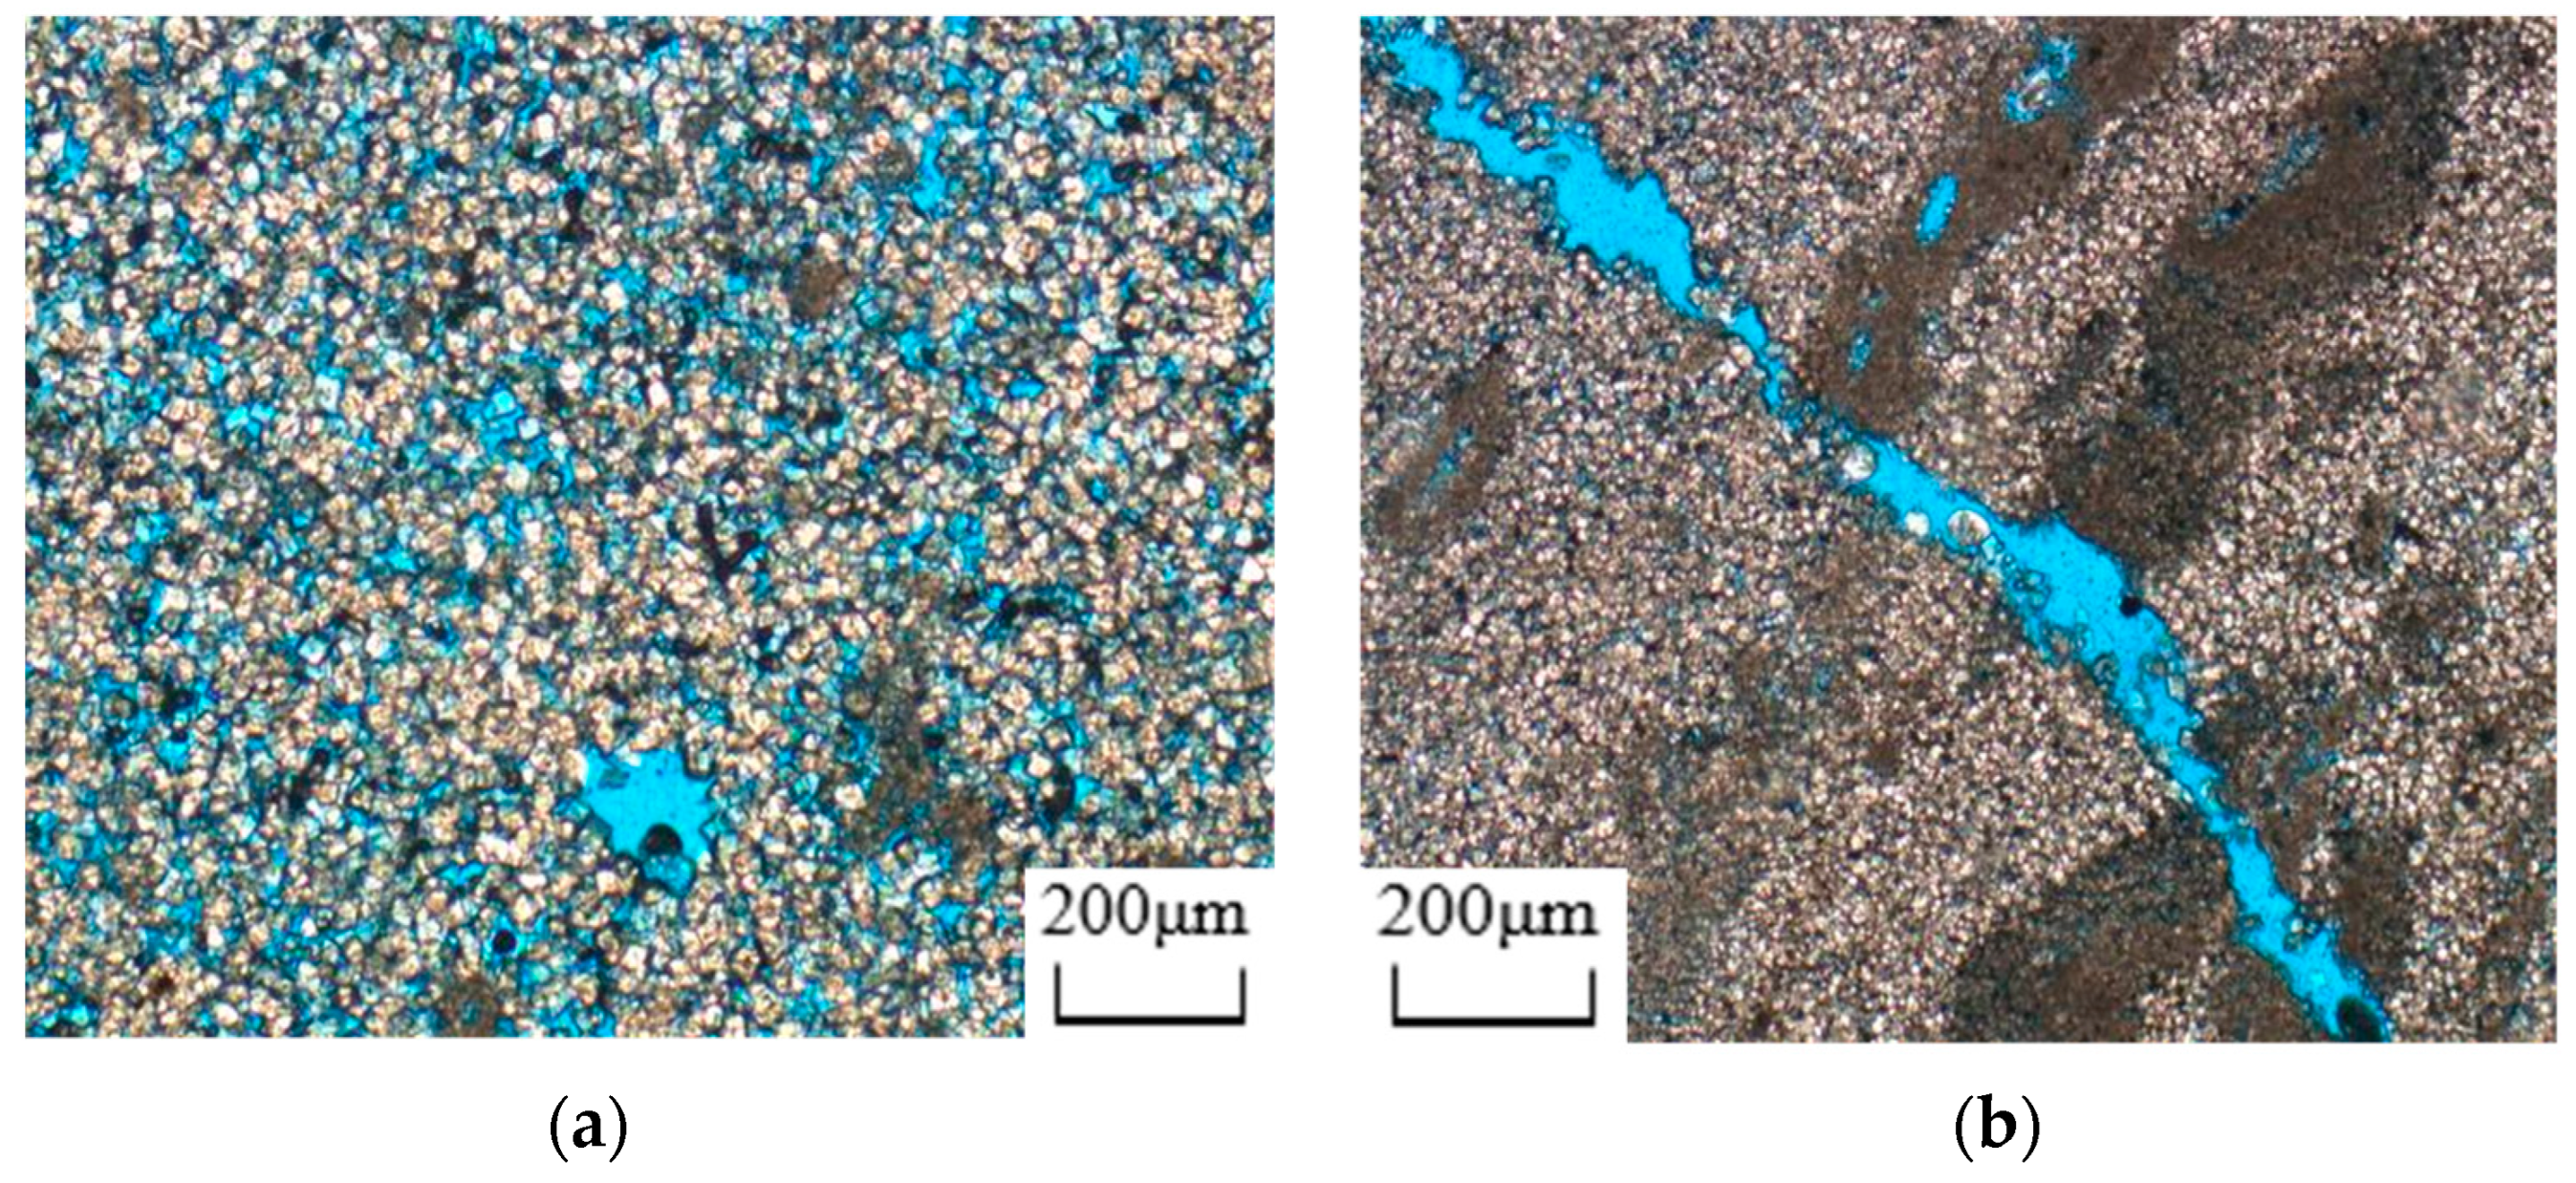
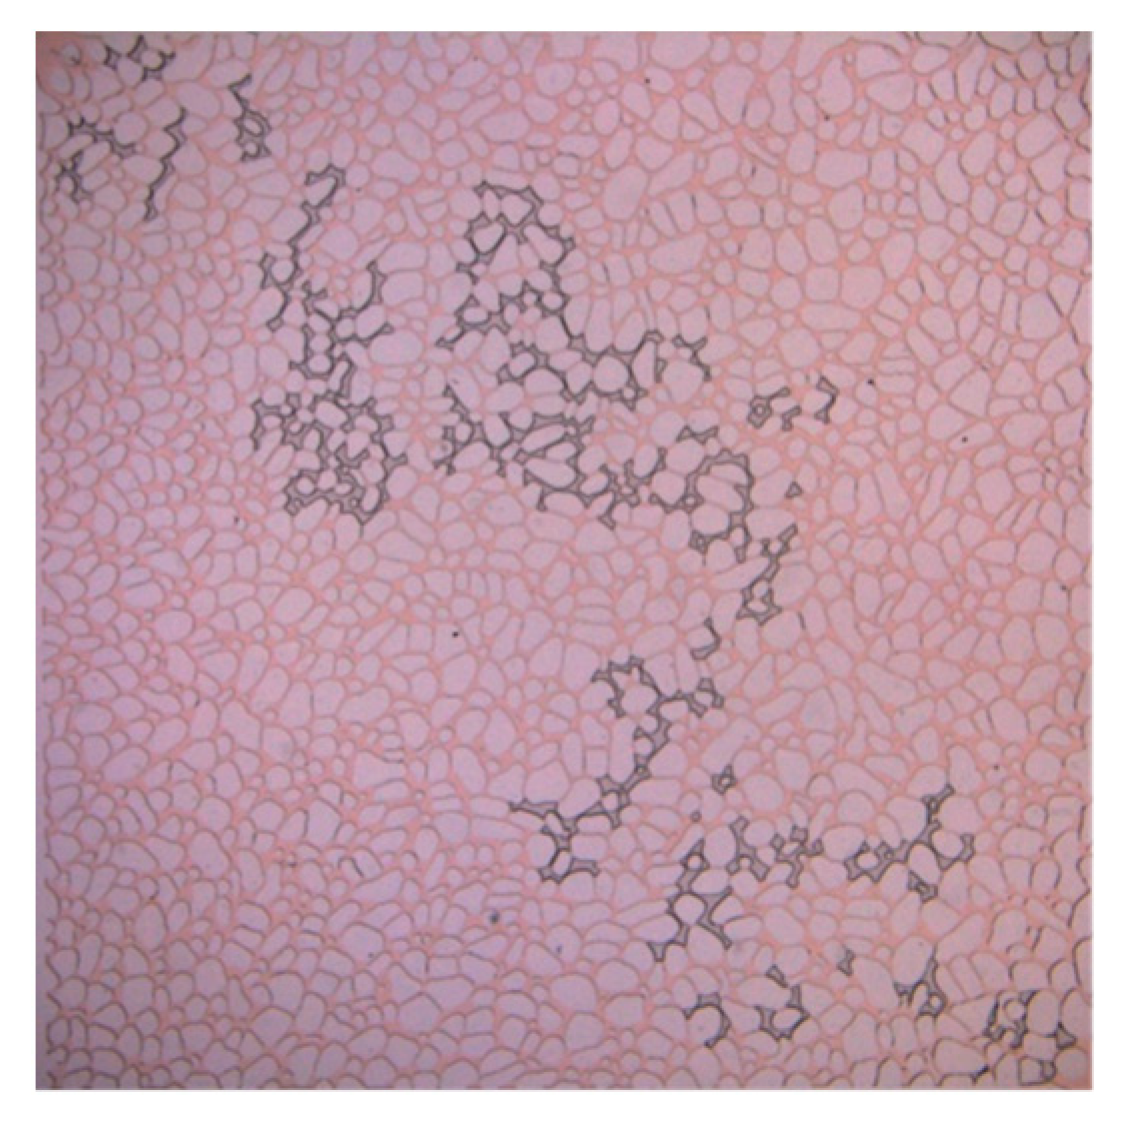
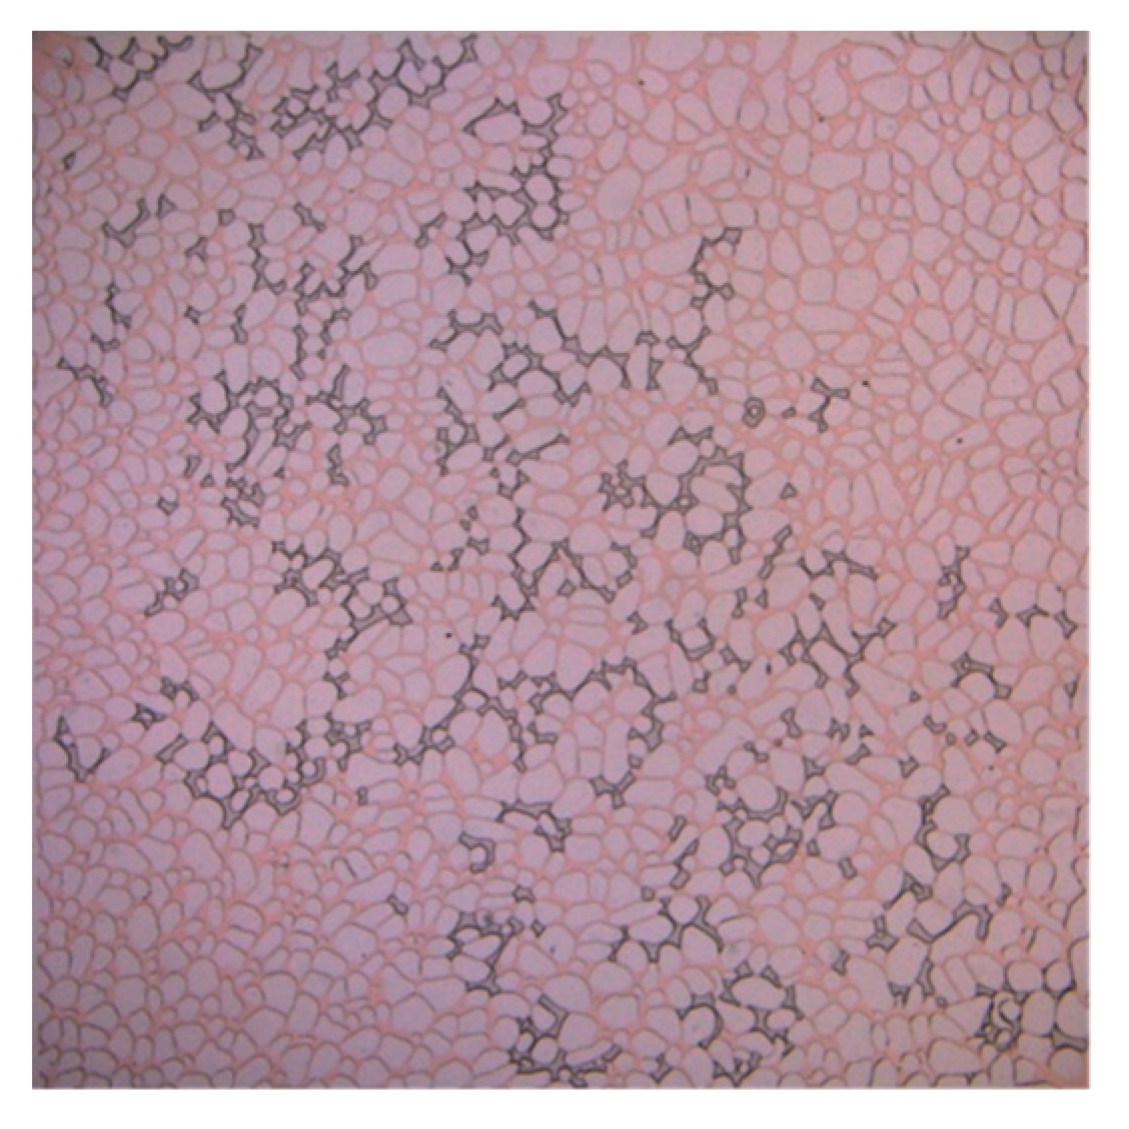
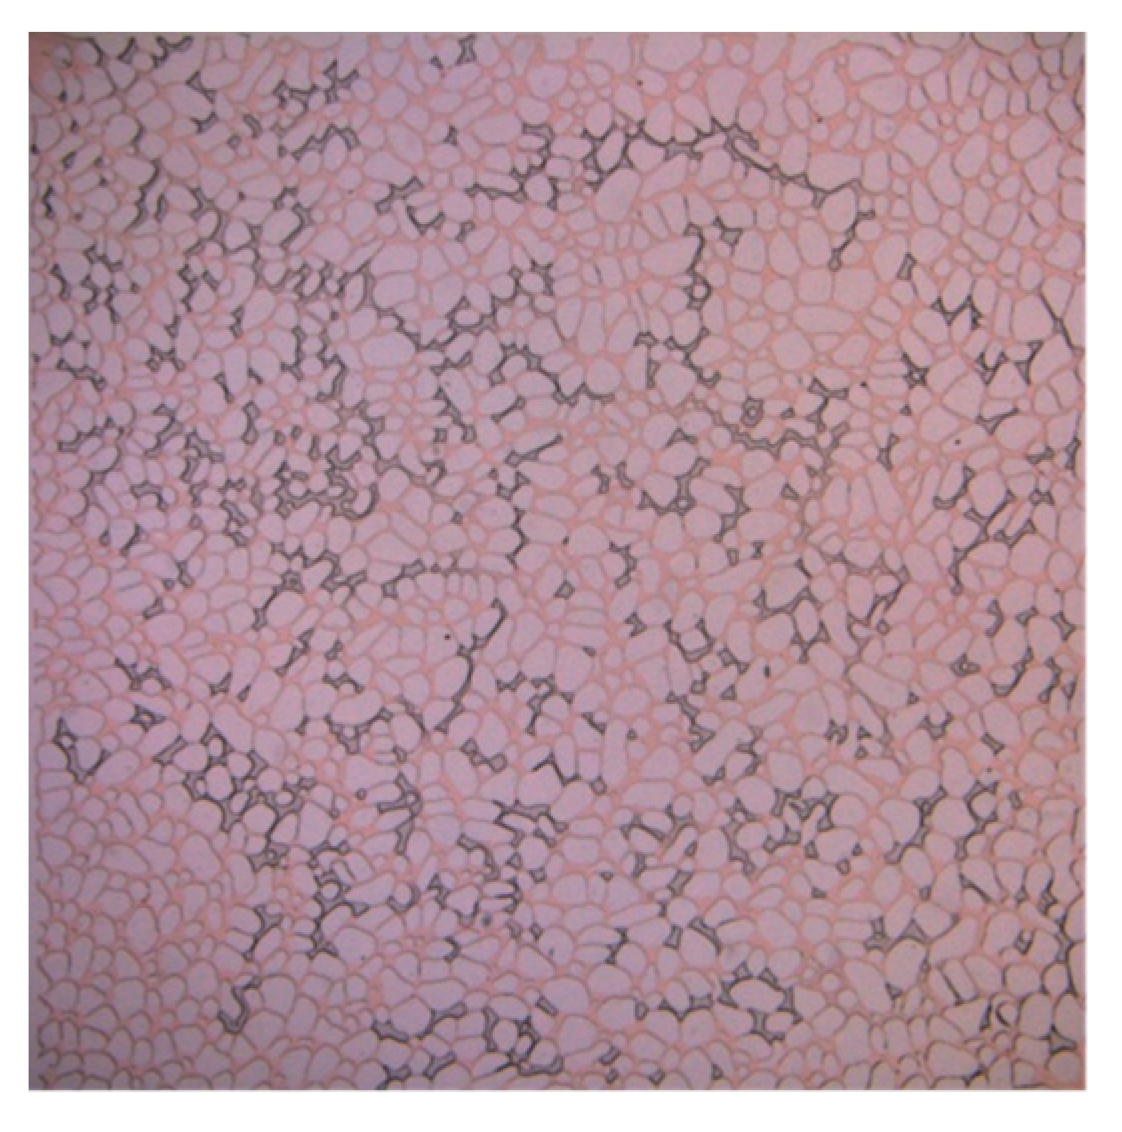
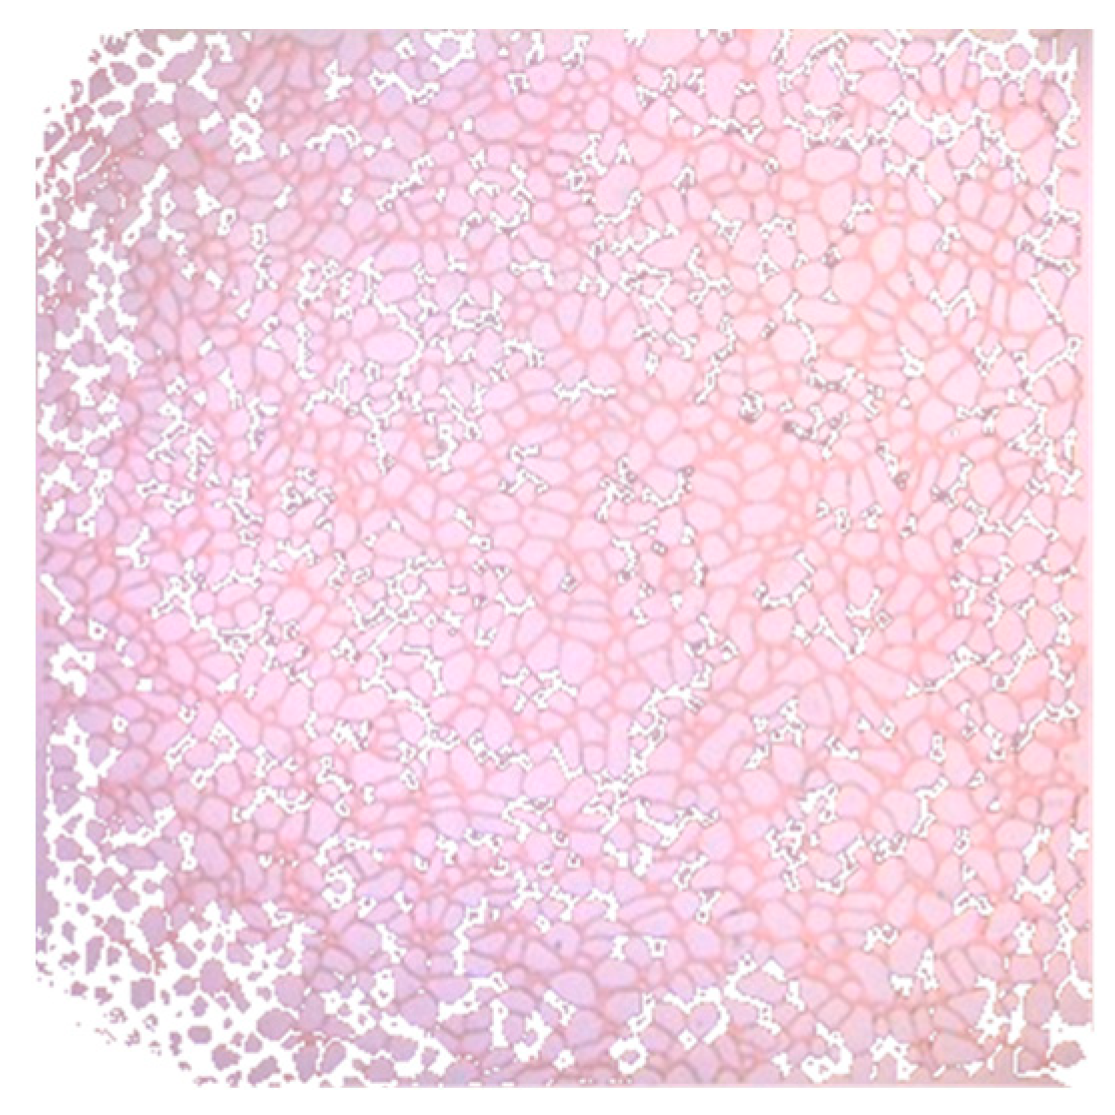
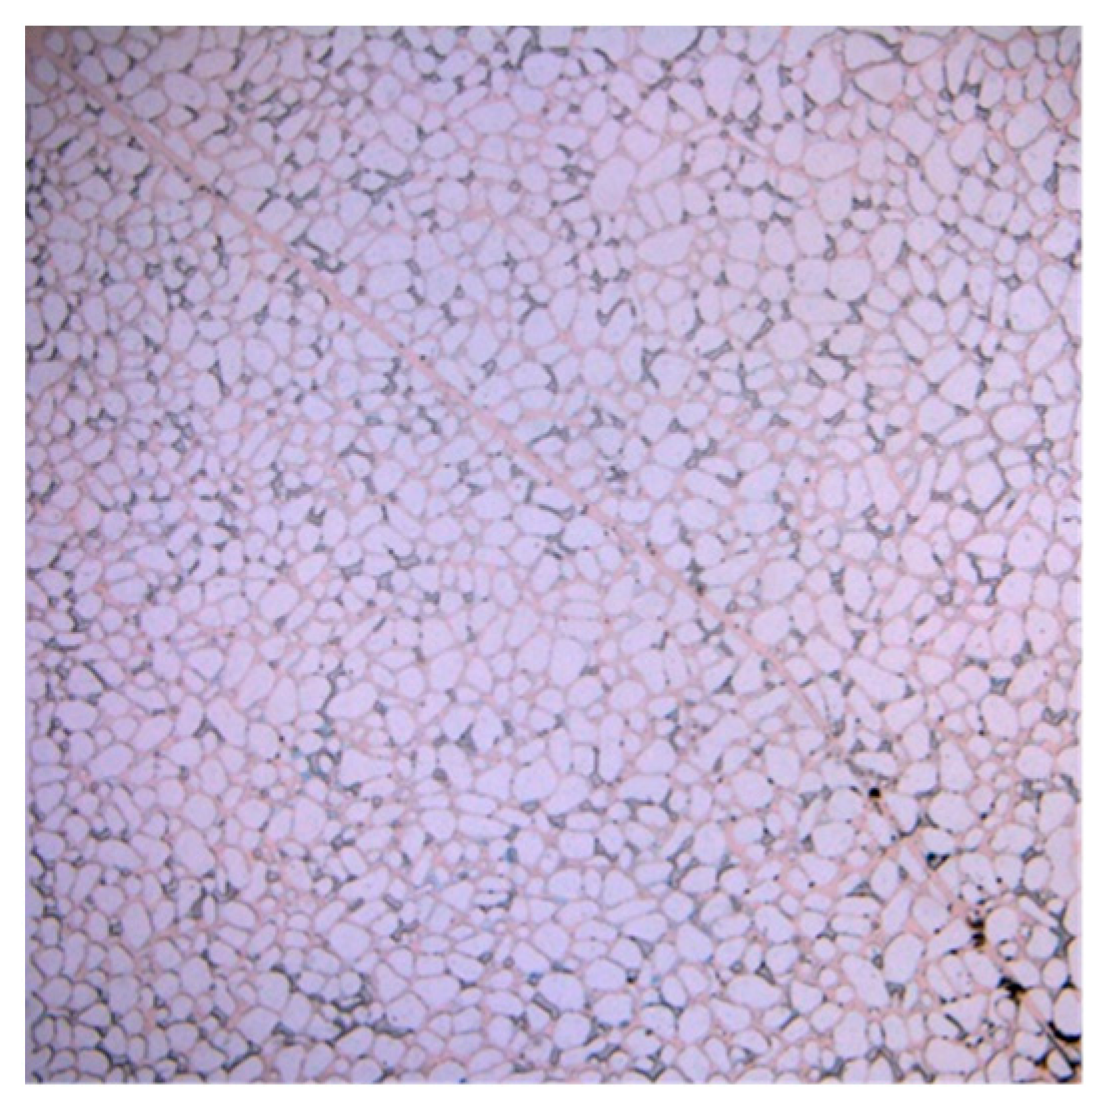
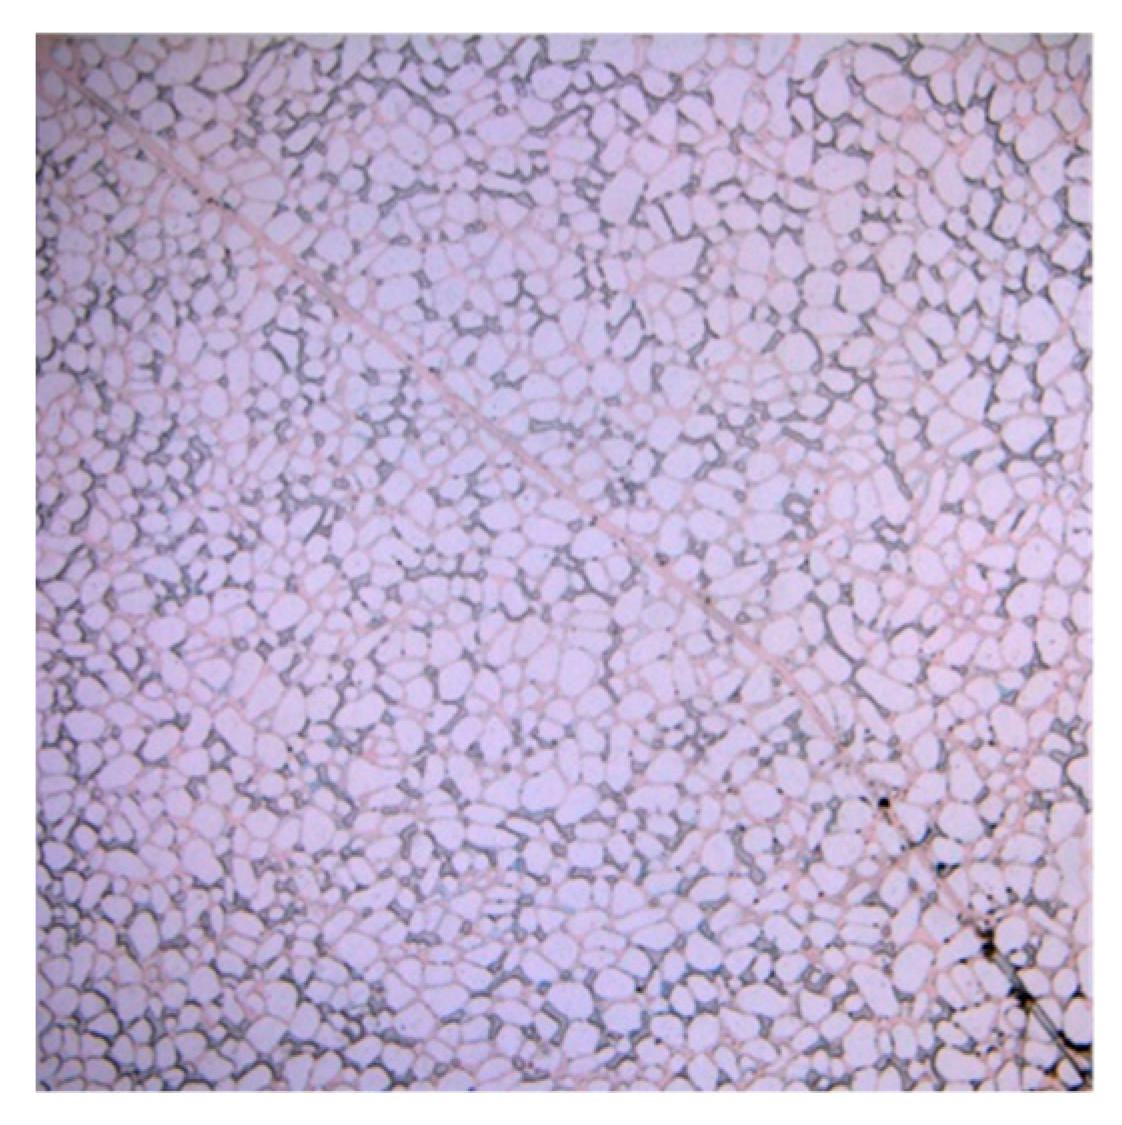
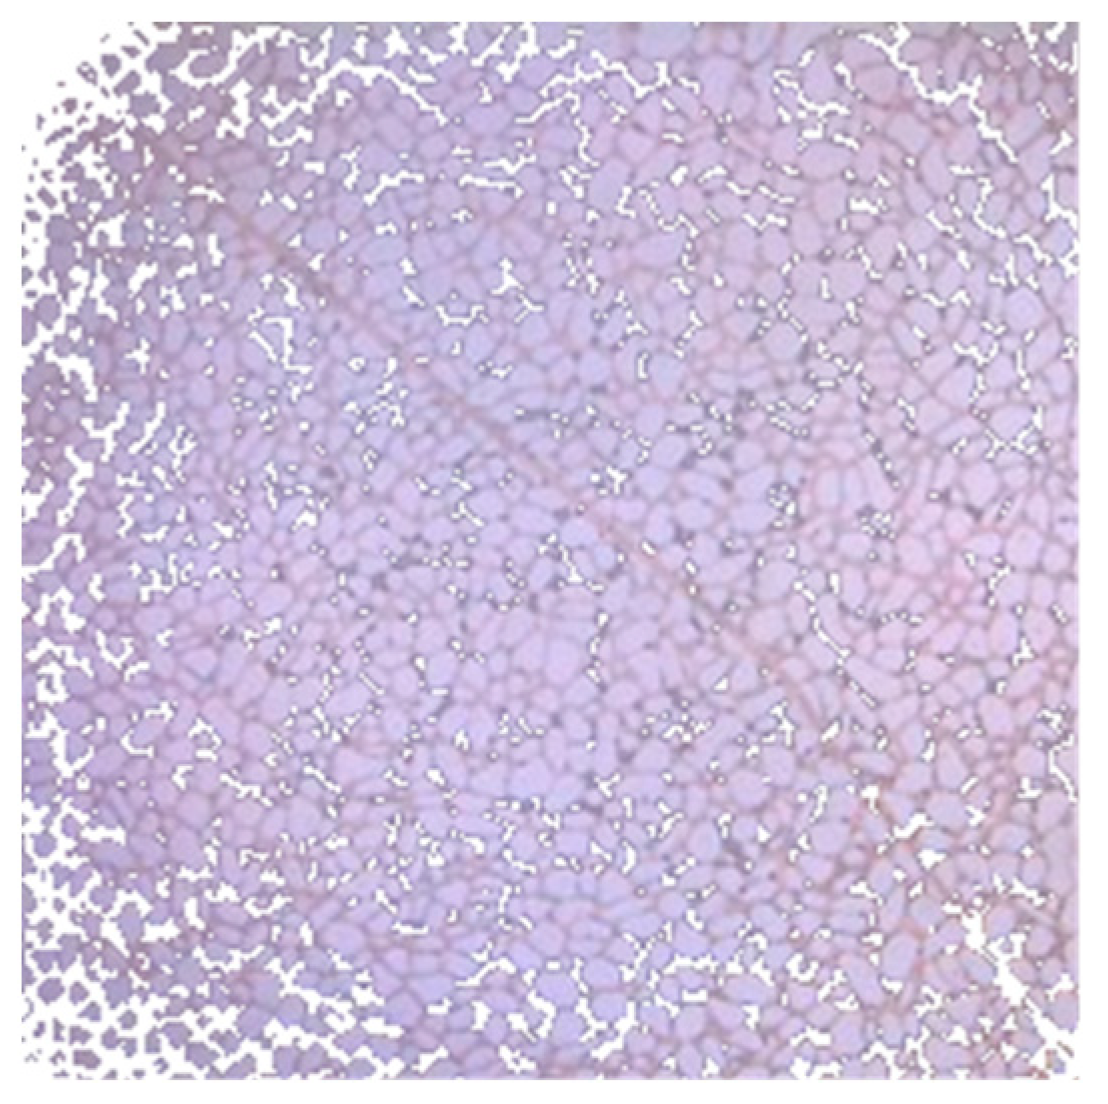
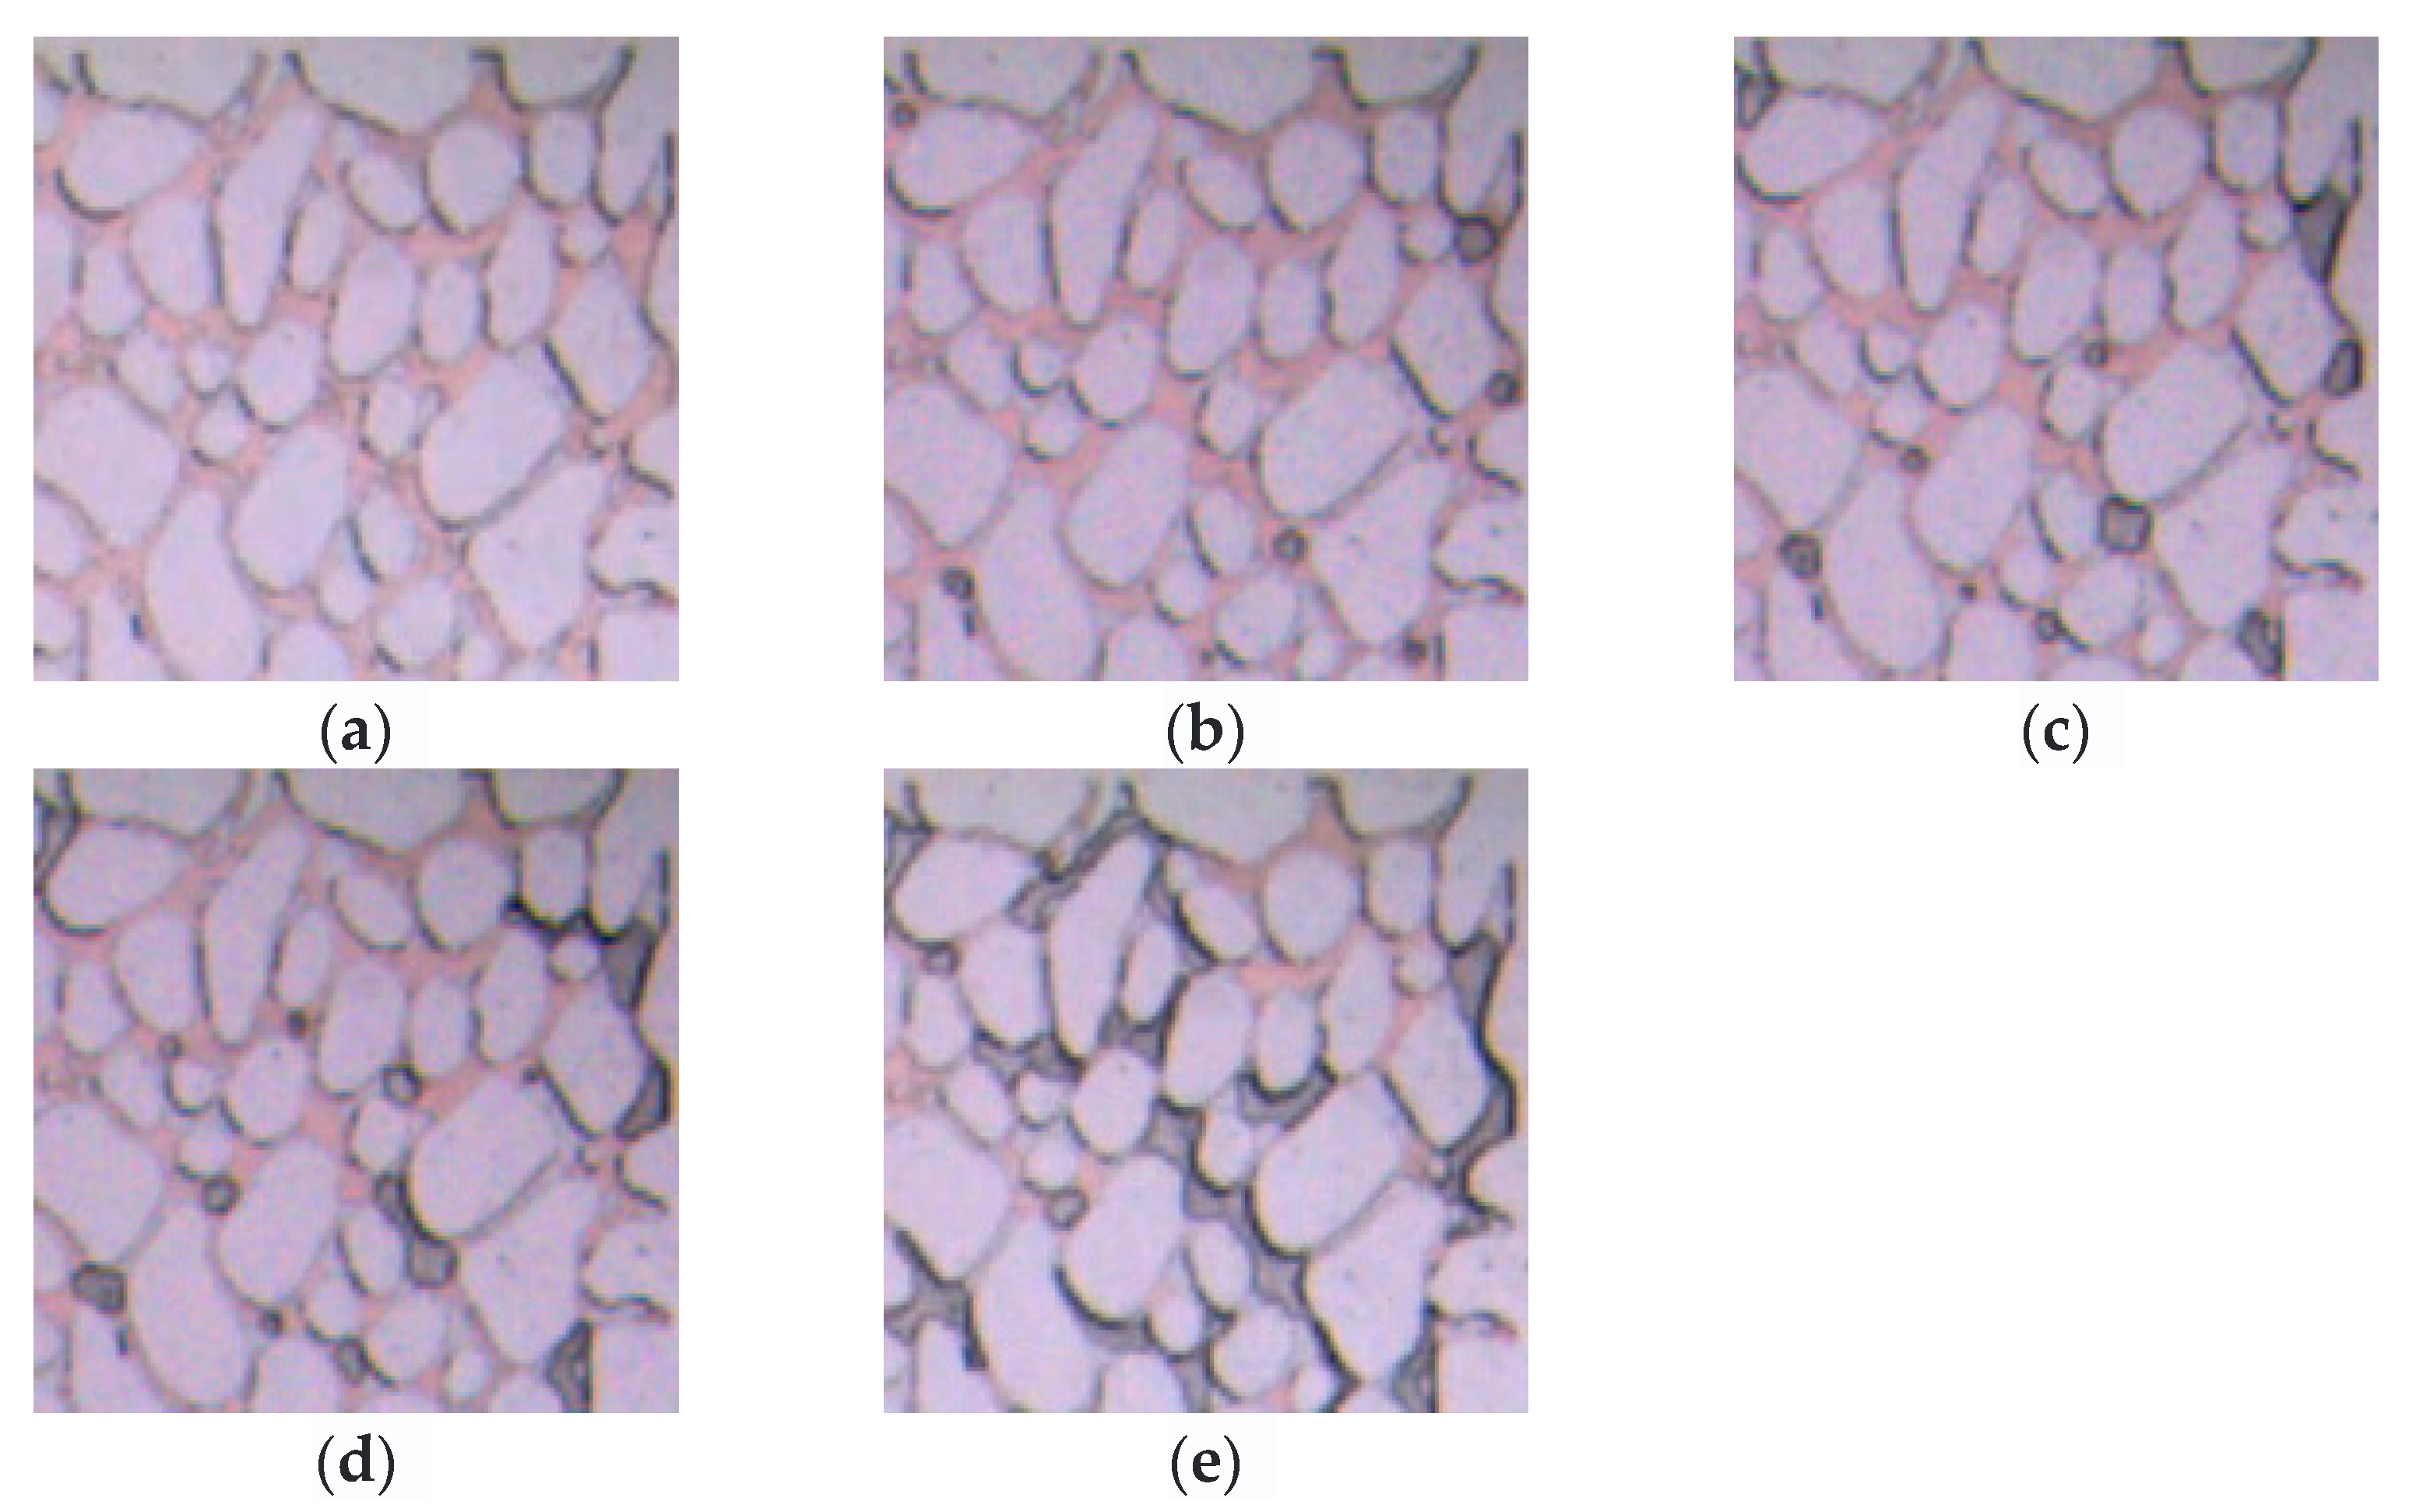
2.2.1. Casting Thin Section Selection

The cast thin section photo of a typical well was selected as the reference unit for pores and fractures, as shown in Figure 1. The test results of the cast thin section are shown in Table 1. The pore reference unit etched the pore carbonate model, and the fracture pore carbonate model was etched after splicing the pore reference unit and the fracture reference unit, and the fracture width was set as 0.17 mm, the average fracture width of the actual oilfield. The low permeability sandstone model is etched by the cast thin section photographs of the sandstone oil field with a permeability similar to the actual oil field.

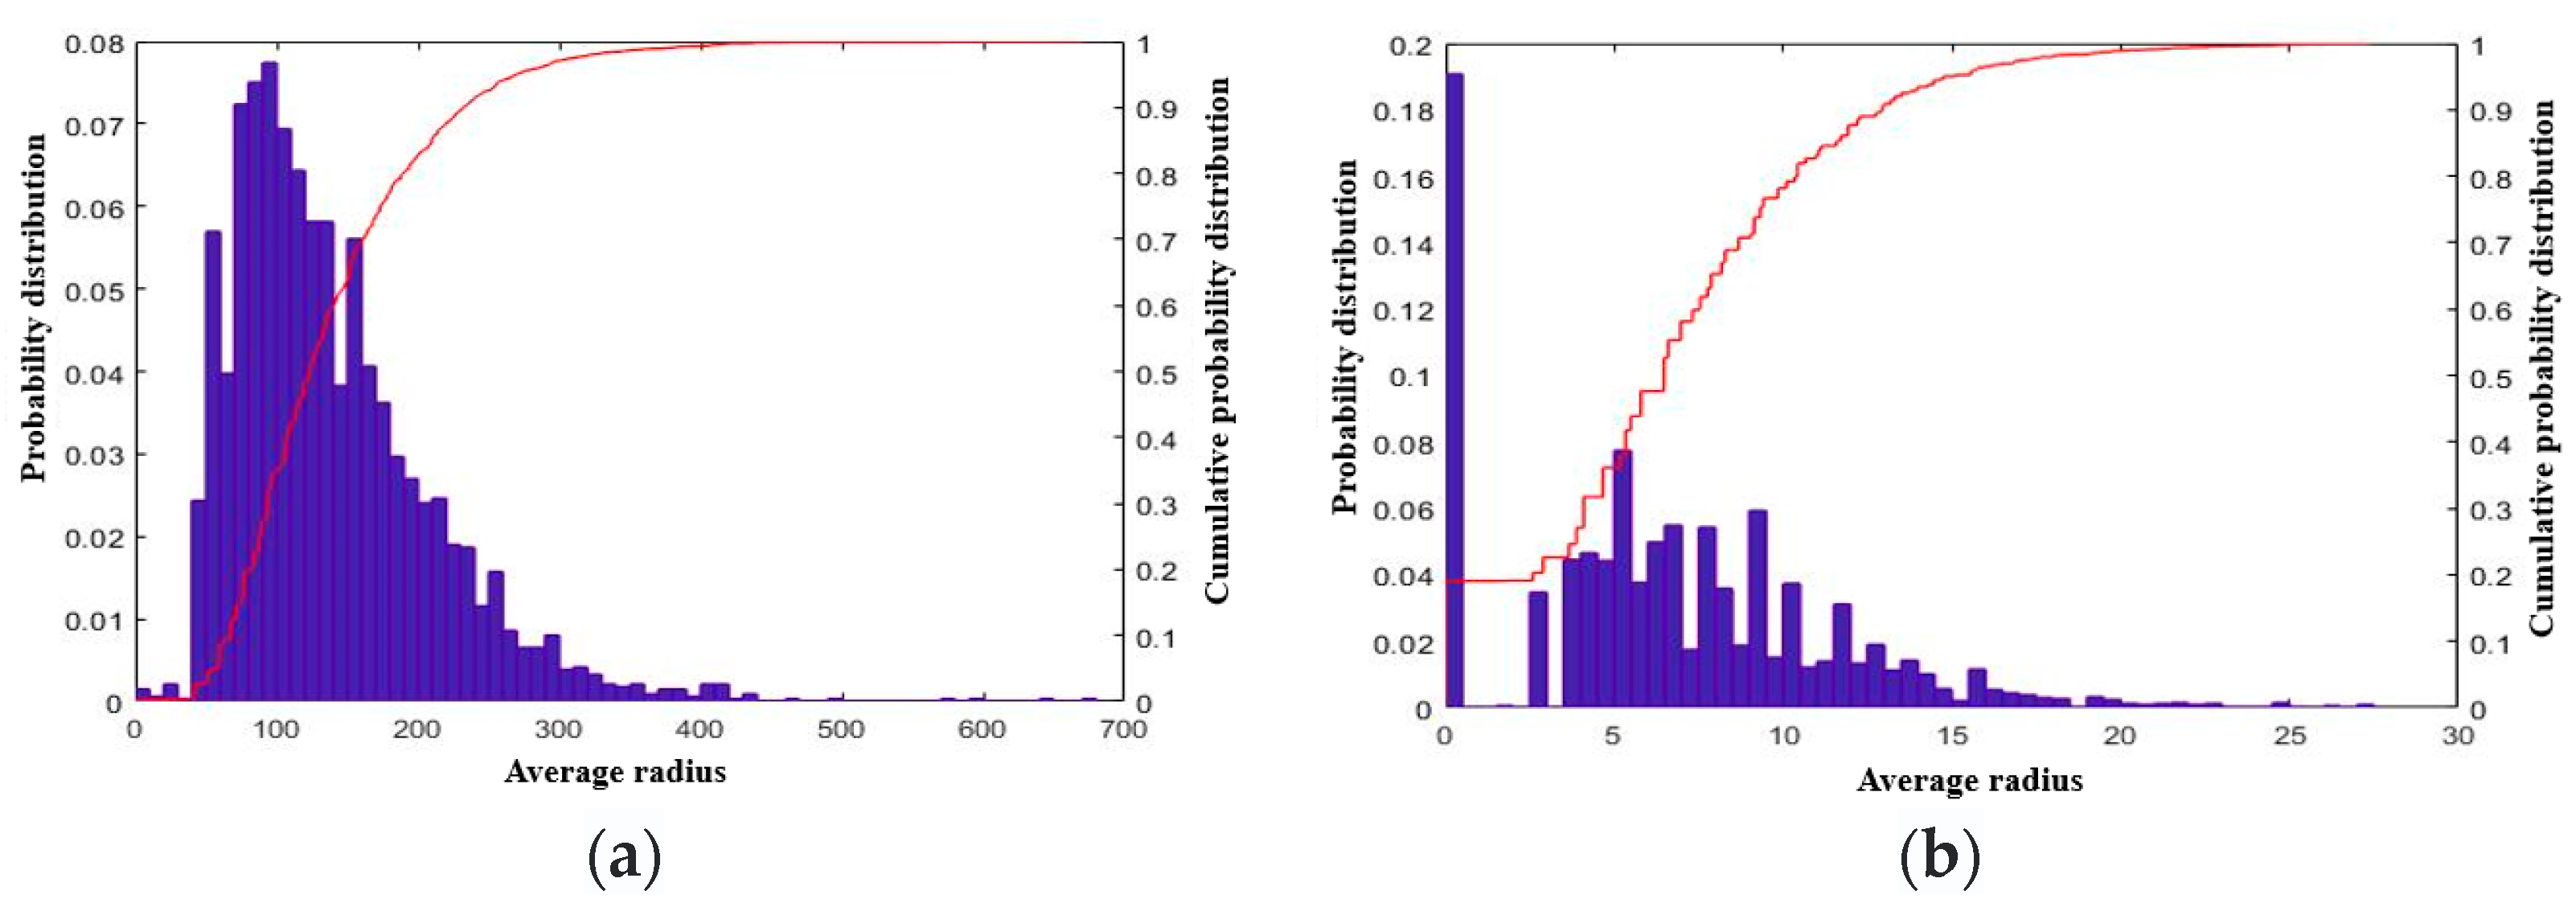
2.2.2. Analysis of Pore Throat Structure Characteristics

Pore and throat structure characteristics of the carbonate reservoir pore reference unit are analyzed through pore and throat structure extraction. Pore radius distribution and throat radius distribution are shown in Figure 2. The carbonate reservoirs in the target area have a wide pore radius distribution with a maximum pore diameter of 754.29 μm and a minimum pore diameter of 10.57 μm, and a concentrated pore radius distribution ranging from 200 μm to 400 μm.
Based on the real core casting sheet, combined with the extracted pore throat features, a microscopic numerical model was established, and then the physical model was made by wet etching. The manufacturing process includes the following: UV exposure, photoresist removal, chromium removal, HF etching and encapsulation.
The physical models are shown in Figure 3, respectively. The pore throat parameters of the model are summarized in Table 2.

3. Experimental Equipment and Key Processes

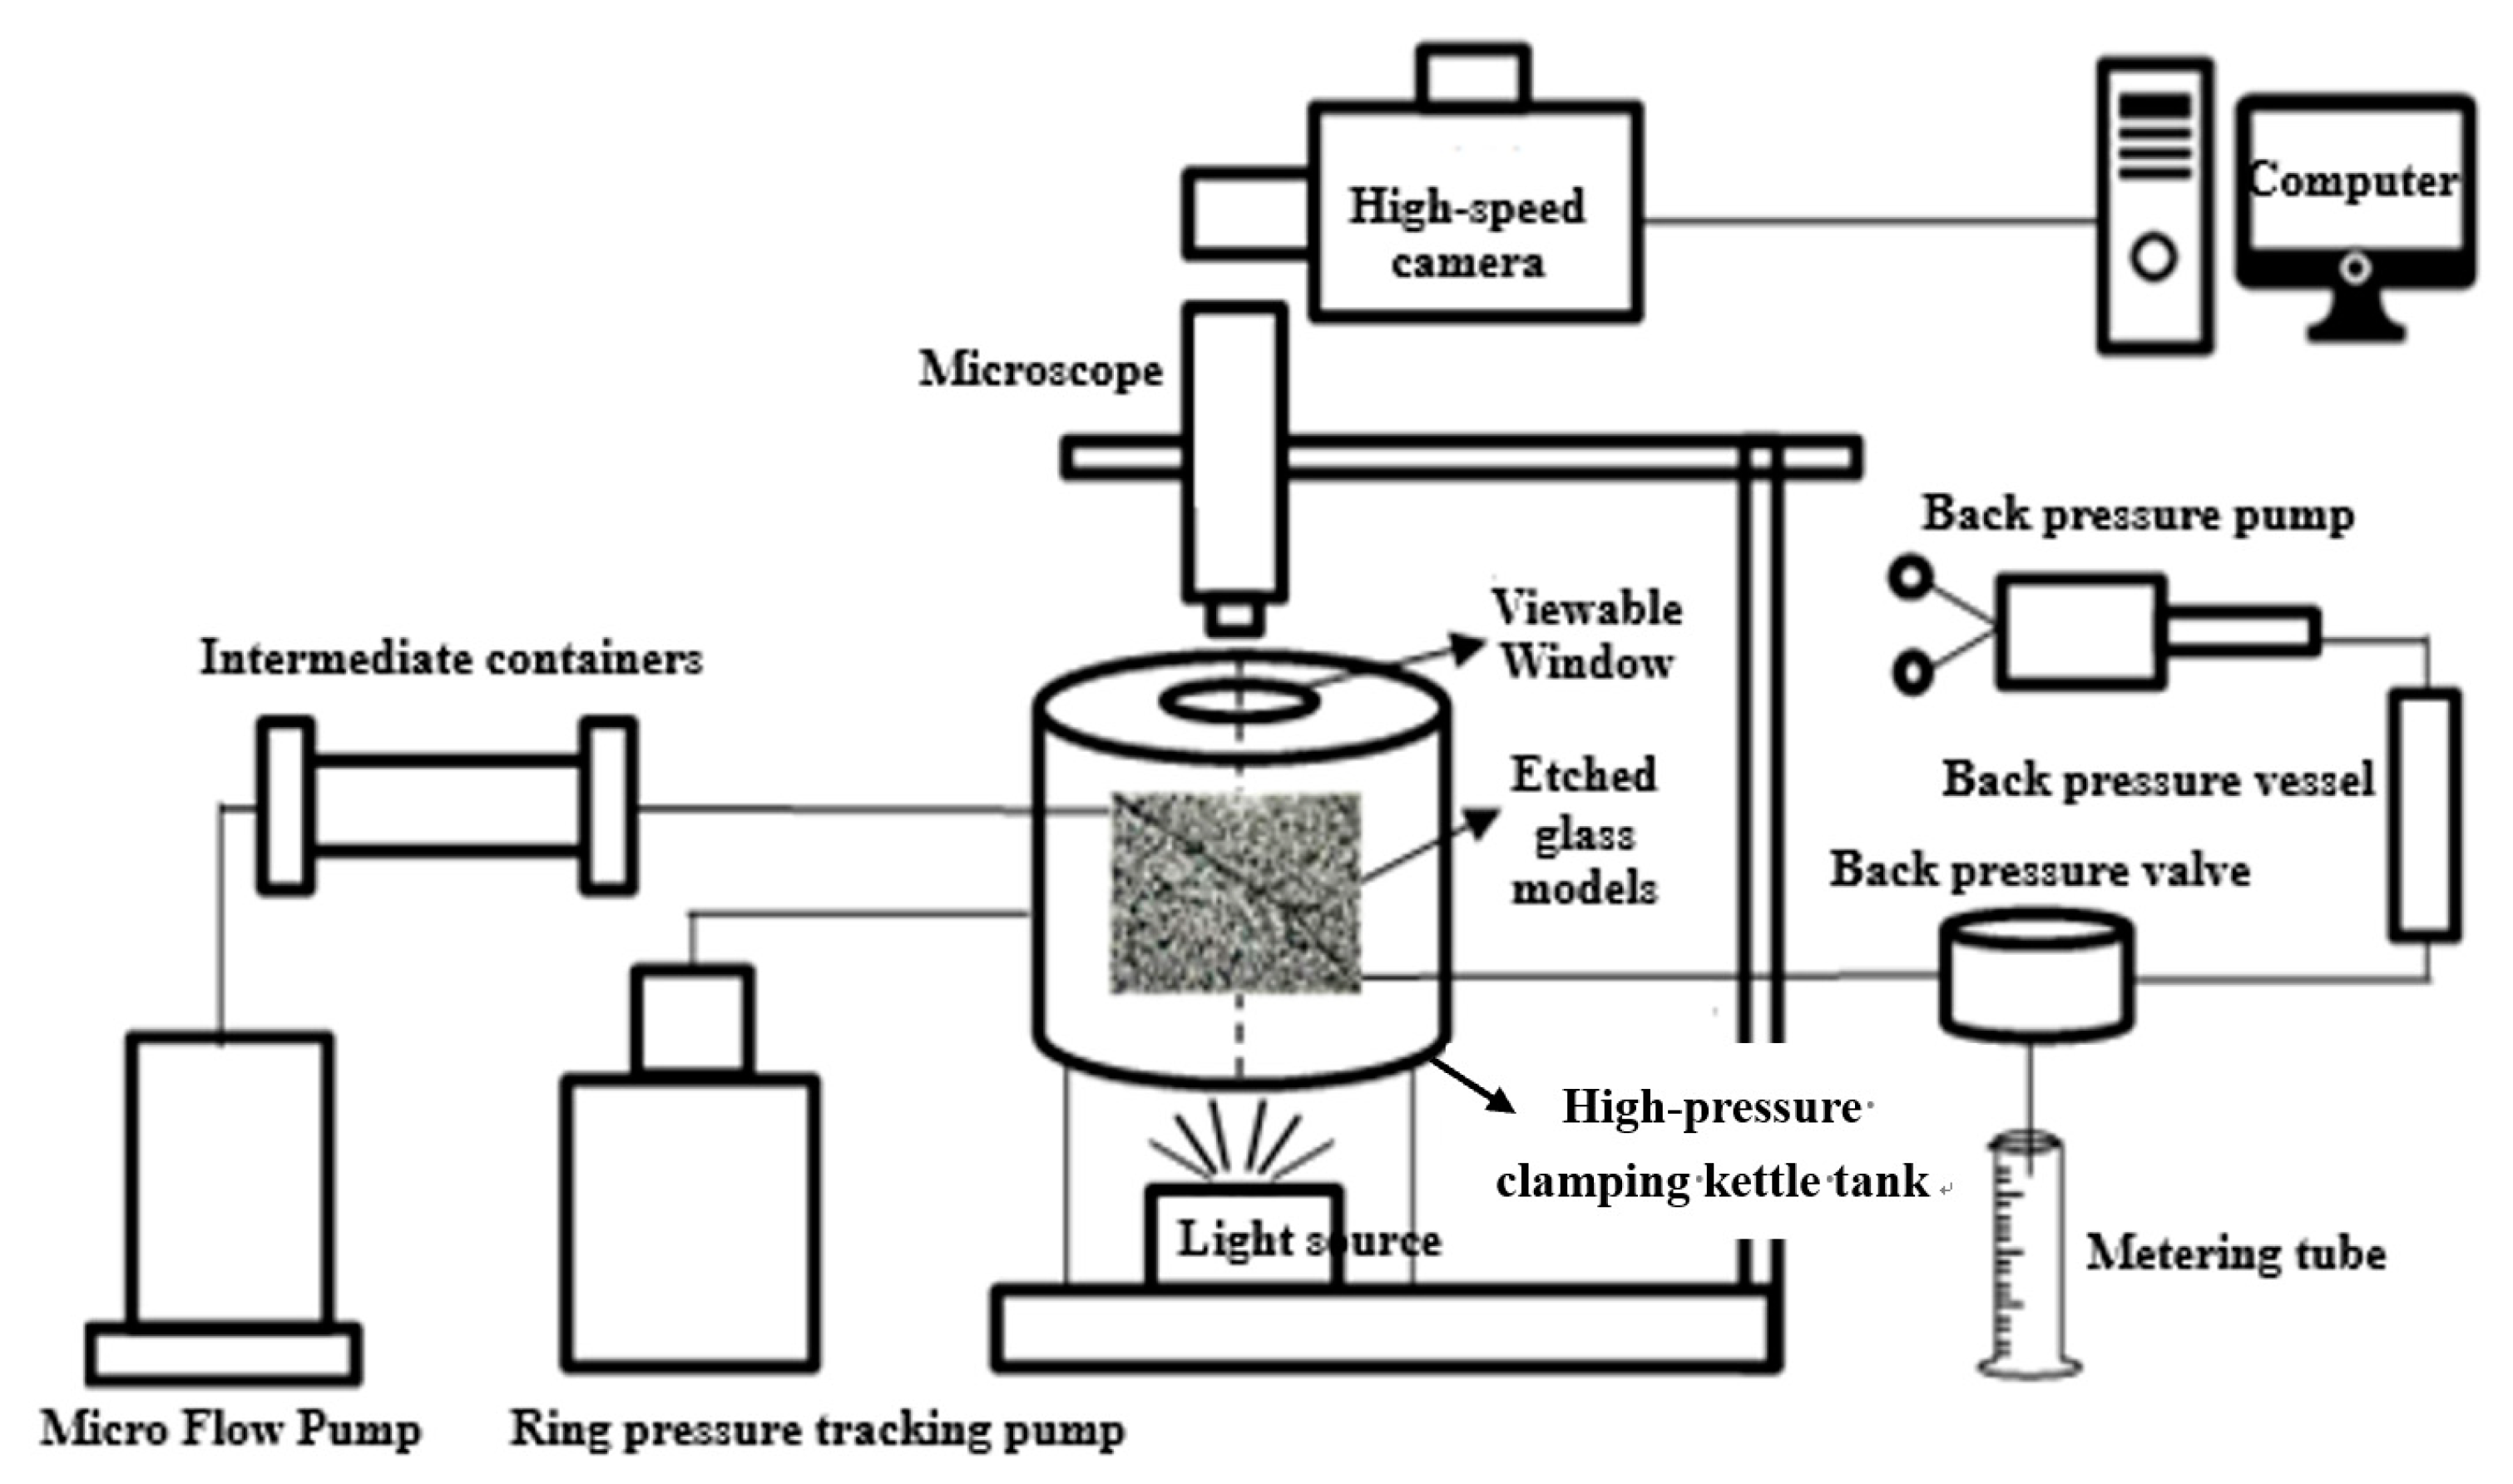
3.1. Experimental Equipment

The experimental platform is mainly composed of a microflow injection pump, a microflow control model, a high-pressure clamping kettle, an intermediate vessel, a circular pressure tracking pump, a back-pressure pump, back-pressure gauge, a back-pressure buffer container, a back-pressure valve, a type microscope, a computer and other equipment, as shown in Figure 4.
The difference between the microfluidic experimental platform whose pressure is below the saturated pressure and the water–oil displacement microfluidic experimental platform is mainly the use of back-pressure system and high-pressure clamping kettle. This is because the oil degassing process needs to be simulated in the water drive experiment where the pressure is below saturated pressure, and the absolute pressure level is high (higher than the pressure tolerance level of the microfluidic model). Therefore, a high-pressure clamping kettle tank is used, and the back-pressure system that can be adjusted arbitrarily is established. The model confining pressure is reasonably tracked and set according to the injection pressure and the pressure tolerance level of the microfluidic model.

3.2. Experimental Procedure

(1) Preparation before experiment: use kerosene and carbon dioxide to configure and simulate the formation of crude oil in a high-pressure sampler piston, which is dyed by Sudan III stain. After configuration, we use the PVT barrel and capillary viscosity meter to measure the simulation of the physical properties of the oil. These mainly include crude oil viscosity, saturation pressure, dissolved gas ratio, volume factor and other parameters. According to the similarity criterion, the displacement system with consistent viscosity was configured with distilled water, and the displacement system was stained with methyl blue dye;
(2) Assembly of microfluidic model: the microfluidic model is installed in the high-pressure clamping kettle, and the microscope is highly focused by adjusting the brightness of the bottom light source so that the high-precision microscope can collect clear channel images;
(3) Vacuumization: vacuumize the annular space and the model at the same time, vacuumize the microfluidic model and experimental pipeline for 2 h, and close the inlet and outlet valves;
(4) Saturated oil: A back-pressure pump is used to control the back pressure up to the saturation pressure, then a flow injection pump is used to gradually raise the pressure of the intermediate container, with oil simulating the formation of crude oil, to more than saturation pressure. Inject water into the annular space until the fluid flows out from the export of the annular space, then connect the oil sample and the model to the saturated oil. The microflow injection pump pumps the saturated oil with a rate that is not higher than 0.02 mL/min until the model is filled with oil, and the confining pressure is adjusted to a level slightly higher than that of the injection pressure;
(5) Step-down and degassing: close the switch at the inlet end of the clamping kettle, adjust the back-pressure pump to reduce the back pressure to a level that is below the saturation pressure. Then observe the simulated oil step-down and degassing process, and collect images at the frequency of 100 frames/s;
(6) Water flooding: open the switch at the inlet end of the clamping kettle, set the microflow injection pump to carry out water flooding at the speed of 0.002 mL/min, and collect images at the frequency of 100 frames/s during the displacement process. When the remaining oil in the pore and throat of the model no longer changes, the displacement will be stopped;
(7) Pressure relief of the system: After the experiment, keep the injection pump open and gradually release the back pressure, and the whole experimental system synchronously relieves the pressure until the pressure returns to normal.

4. Experimental Results and Analysis

The gas phase behavior, water flooding characteristics and residual oil distribution of the pore carbonate model and the fracture pore carbonate model were analyzed, respectively, in the failure development stage and the water flood development stage. The specific experimental results are as follows.

4.1. Dynamic Occurrence Law of Oil and Gas in Depletion Stage

4.1.1. Microfluidic Experiment of Porous Carbonate Reservoir

The porous carbonate reservoir model after being saturated with oil is shown in Figure 5. Adjust the back pressure to simulate the depletion development stage. When the pressure reaches the set pressure, the simulated oil in the model begins to degas. The first degassing area is around the production well and the large pore throat area in the model, as shown in Figure 6. At this time, with pressure propagation, the dissolved gas of the crude oil in the small pore throat region does not escape, but exists in the liquid phase.
The gas phase migration of the porous carbonate model is shown in Figure 7. The gas in the large pore throat keeps expanding, merging and migrating. Meanwhile, due to the existence of bubbles in the large pore throat, the pore throat in the area where degassing does not occur is the main migration channel; that is, the small pore throat is the main gas migration channel. When the gas passes through the small pore throat, it provides conditions for the aggregation of gas molecules in the small pore throat; that is, auxiliary gas nucleation. As the volume of the released gas increases, the gas phase in the small pore throat gradually expands, merges and migrates. The degassing area of the porous carbonate model is shown in Figure 8.
At the end of depletion development, the escaped gas exists in both the large and small pore throats. The remaining oil distribution of the porous carbonate reservoir for exhaustion development is shown in Figure 9. According to threshold segmentation calculation, the displacement efficiency of the microfluidic model of the porous carbonate reservoir in the depletion development stage is 37.80%, as shown in Figure 10.

4.1.2. Microfluidic Experiment of Fractured Porous Carbonate Reservoir with Fracture Parallel to Mainstream Line

The fractured porous carbonate reservoir model after being saturated with oil is shown in Figure 11. Adjust the back pressure to simulate the depletion development stage, and the degassing process can be divided into three stages, according to the analysis of the experimental results.
In the first stage, when the pressure reaches the set pressure, degassing occurs first near the production well. Because fractures are developed around the well, a large amount of crude oil is degassing first along the fractures, and at the same time, crude oil in the matrix near the fractures is degassed. At this time, the fractures are the main oil-producing and gas-producing channels, as shown in Figure 12.
In the second stage, the degassing range in the matrix is extended from the near-slit matrix to the large pore throat region in the matrix, as shown in Figure 13. In addition, gas migration occurs in the matrix with increasing deaeration, as shown in Figure 14.
In the third stage, the gas in the large pore throat keeps expanding, merging and migrating. Meanwhile, due to the existence of bubbles in the large pore throat and serious Jamin effect, the migration channel is mainly the pore throat in the area where degassing does not occur; that is, the small pore throat is the main gas migration channel, as shown in Figure 15. This provides conditions for bubble nucleation in the small pore throat region, and degassing occurs in the small pore region, as shown in Figure 16.
According to the three stages of gas phase evolution, the degassing sequence of the fractured porous carbonate reservoir is fracture, large pore throat region and small pore throat region. The locations of the gas phase increase in the same order. Gas phase state and position and its change rule is that in the early depletion stage, the gas phase occurs in fractures near the matrix, and rapidly forms a continuous gas phase in fractures. In the middle depletion stage, the occurrence position extends from fractures near the matrix to the large pore throat region. At the same time, the continuous gas phase forms and migrates in the matrix, the occurrence position extends to fractures, the large pore throat region and the small pore throat region.
The distribution of the remaining oil of the microfluidic model of the fractured porous carbonate reservoir in the depletion development stage is shown in Figure 17. According to threshold segmentation calculation, the displacement efficiency of the microfluidic model of the fractured porous carbonate reservoir in the depletion stage is 33.12%, as shown in Figure 18.

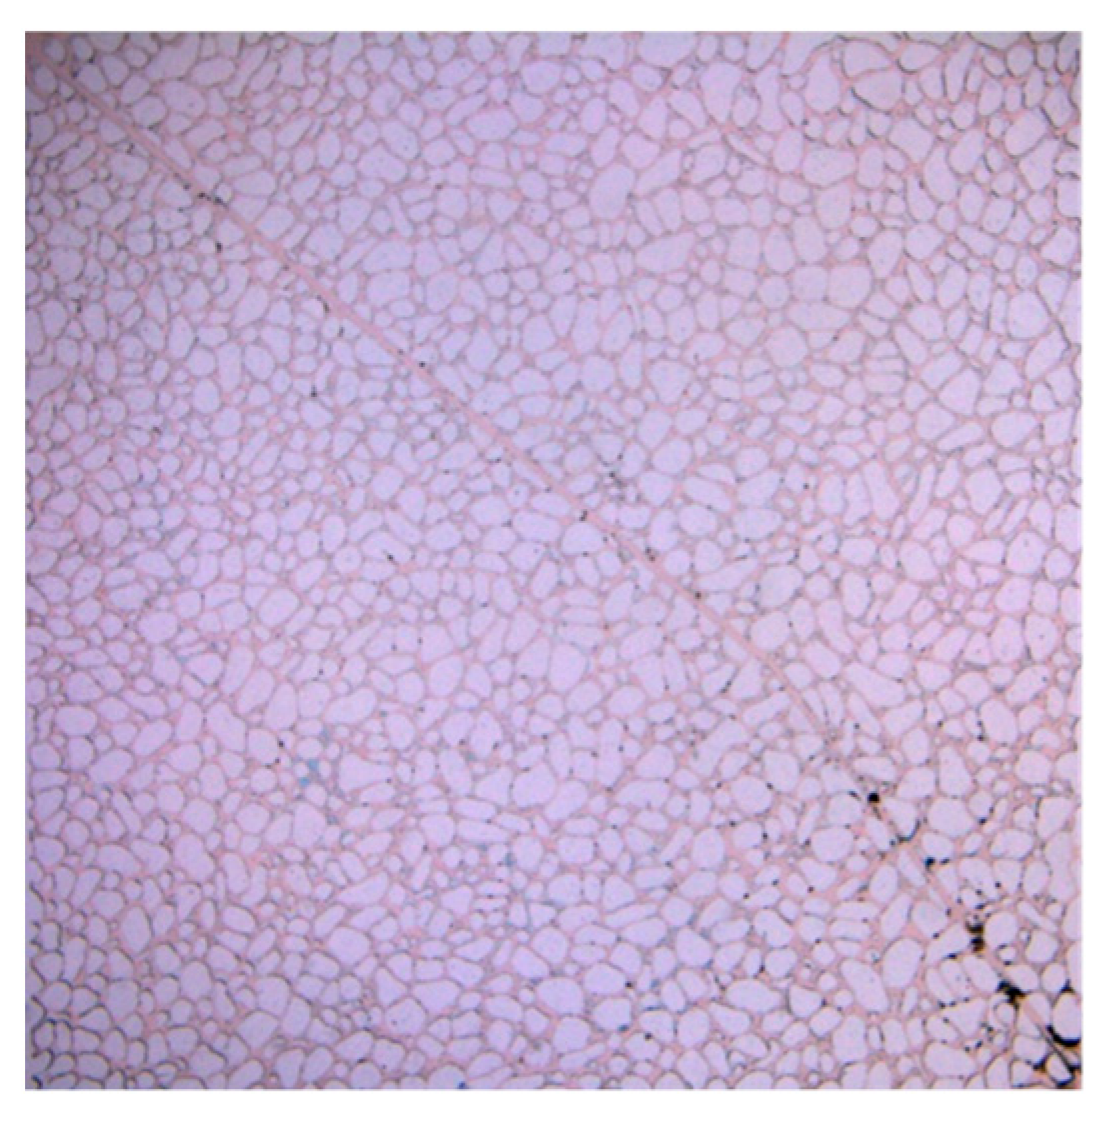
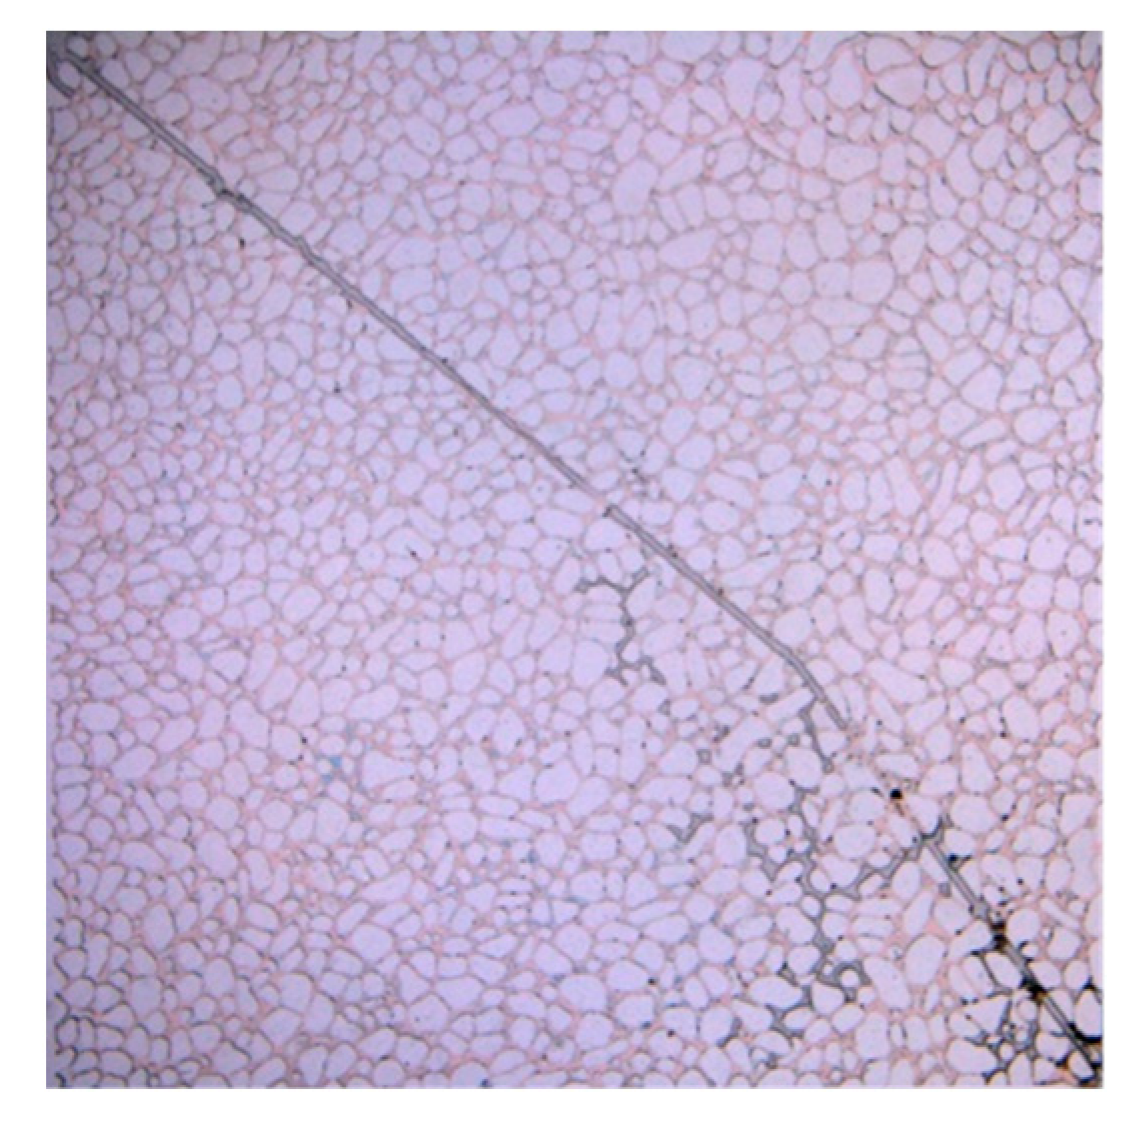
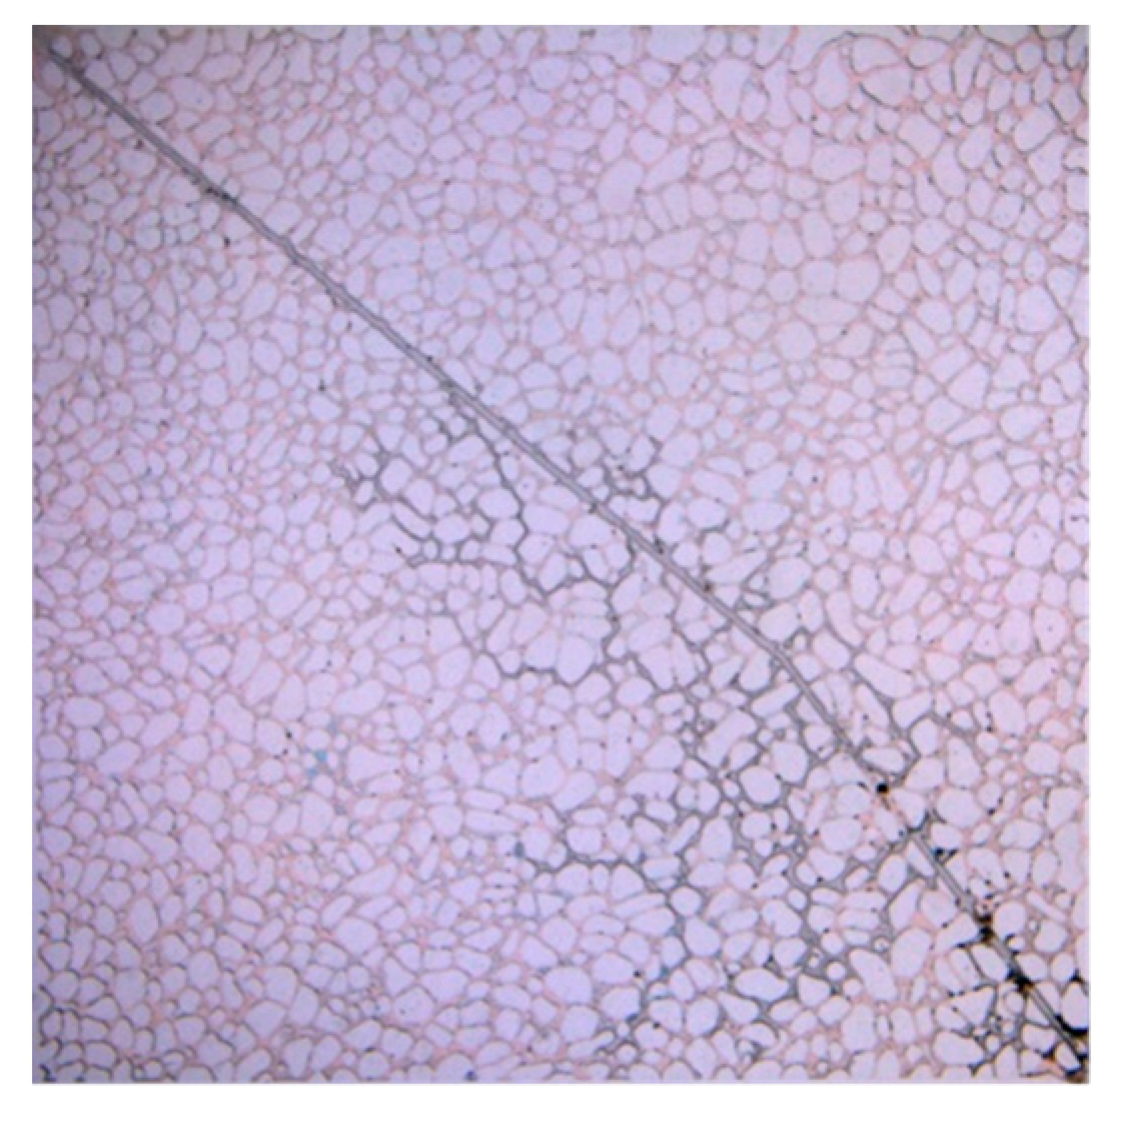
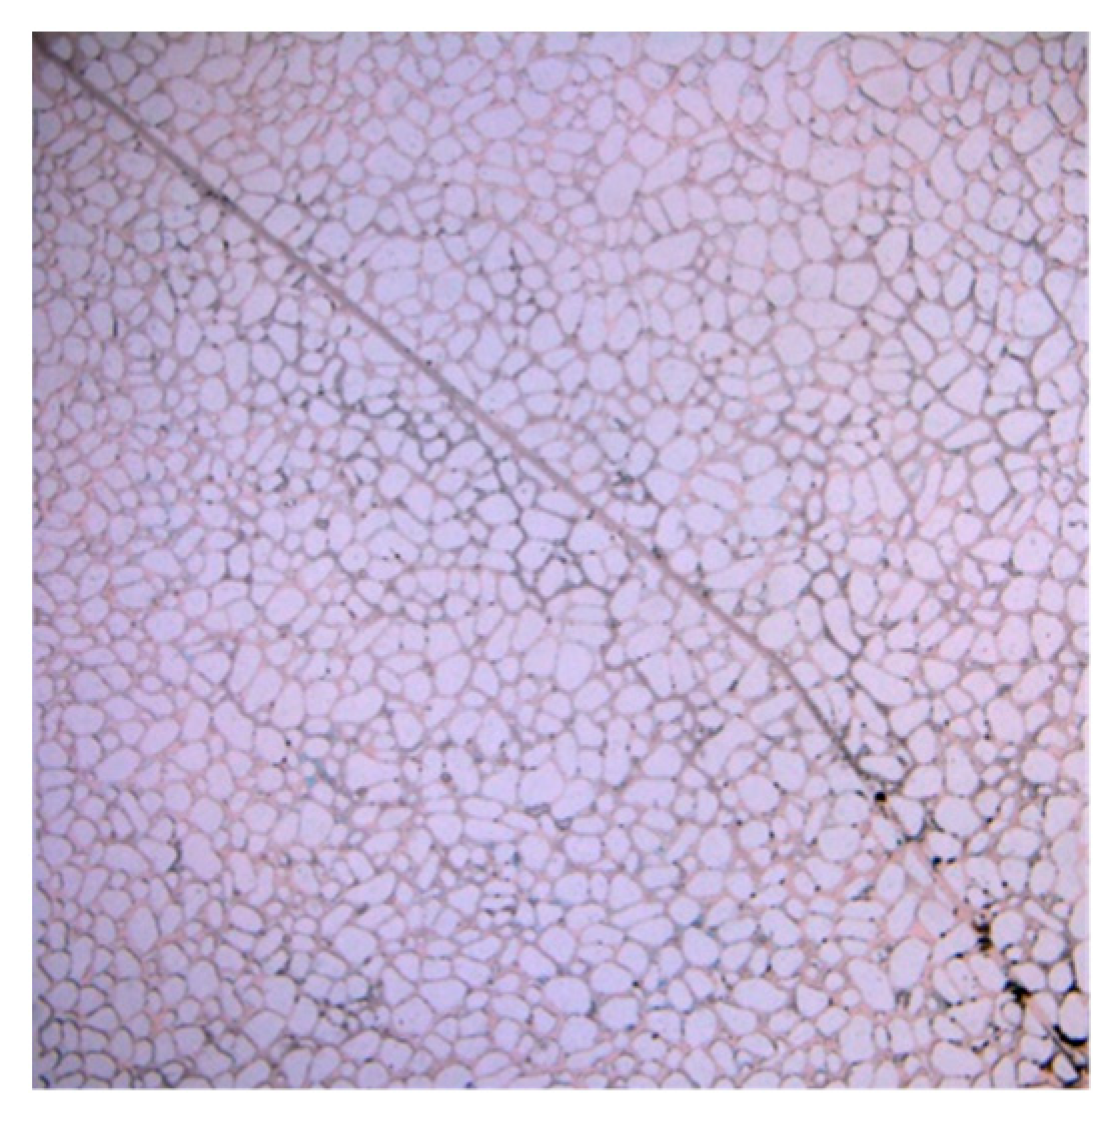
4.1.3. Evolution Process of Gas Phase

Through the simulation of the depletion development of the porous carbonate reservoir and the fractured porous carbonate reservoir, it is found that gas in dissolved crude oil undergoes a series of changes, such as nucleation, growth and the merger of bubbles in the porous media, as shown in Figure 19.
Nucleation: when the pressure is lower than the bubble point pressure, the dissolved gas begins to separate from the oil phase, forming a bubble core. The bubble is bound to the pore wall and does not flow with the oil flow. Expansion: the pressure continues to reduce, the solubility of the gas becomes less and less, through diffusion into the formed bubble core, so that the bubble continues to expand. Coalescence: in the process of bubble expansion, multiple adjacent bubbles begin to contact and merge to form large bubbles. Migration: Large bubbles continue to coalesce and eventually form a continuously flowing gas phase.
From the evolution of bubbles, it can be seen that bubbles in porous media need to go through a series of processes from generation to migration, and the evolution time is greatly affected by the size of the pore throat and the fractures in the porous media. At the same time, in the evolution process of the gas phase, nucleation is not only affected by pressure, oil-dissolved gas is just an internal cause of degassing: whether or not the oil will degas still depends on the external conditions, the degassing of the external cause. This is because the oil-dissolved gas can also exist in liquid oil, and the gas migration process without a degassing area can also be used as the external cause of bubble nucleation, which can be used to gather the dissolved gas molecules in the undergassed region.

4.2. Law of Water-Driven Oil and Gas Mobilization in Waterflood Development Stage

4.2.1. Microfluidic Experiment of Porous Carbonate Reservoir

After the porous carbonate reservoir model changes from depletion development to waterflooding development, the injection water preferentially selects the large pore throat containing only simulated oil as the flow channel in the early stage of displacement. This displacement process shows an obvious characteristic of “displace the oil, not the gas”. This is due to the large flow resistance of gas in the pore throat and the serious Jamin effect. There is a great difference on the waterflooding front between the early displacement stage and the waterflooding stage when the pressure is higher than saturated pressure. The waterflooding front of the waterflooding model is channeling seriously along the large pores, without the stage of advancing as a 1/4 arc, as shown in Figure 20. When water-breakthrough happens, the waterflooding results of the model are shown in Figure 21, and the sweep coefficient is only 0.14.
As water is injected to restore the formation pressure, as shown in Figure 22, the released gas dissolves and water drive mobilization increases. Figure 23 shows the distribution of the remaining oil in the porous carbonate reservoir model after depletion and water injection. According to threshold segmentation calculation, the oil displacement efficiency of the microfluidic model of the porous carbonate reservoir after depletion and water injection development is 88.82%, as shown in Figure 24.

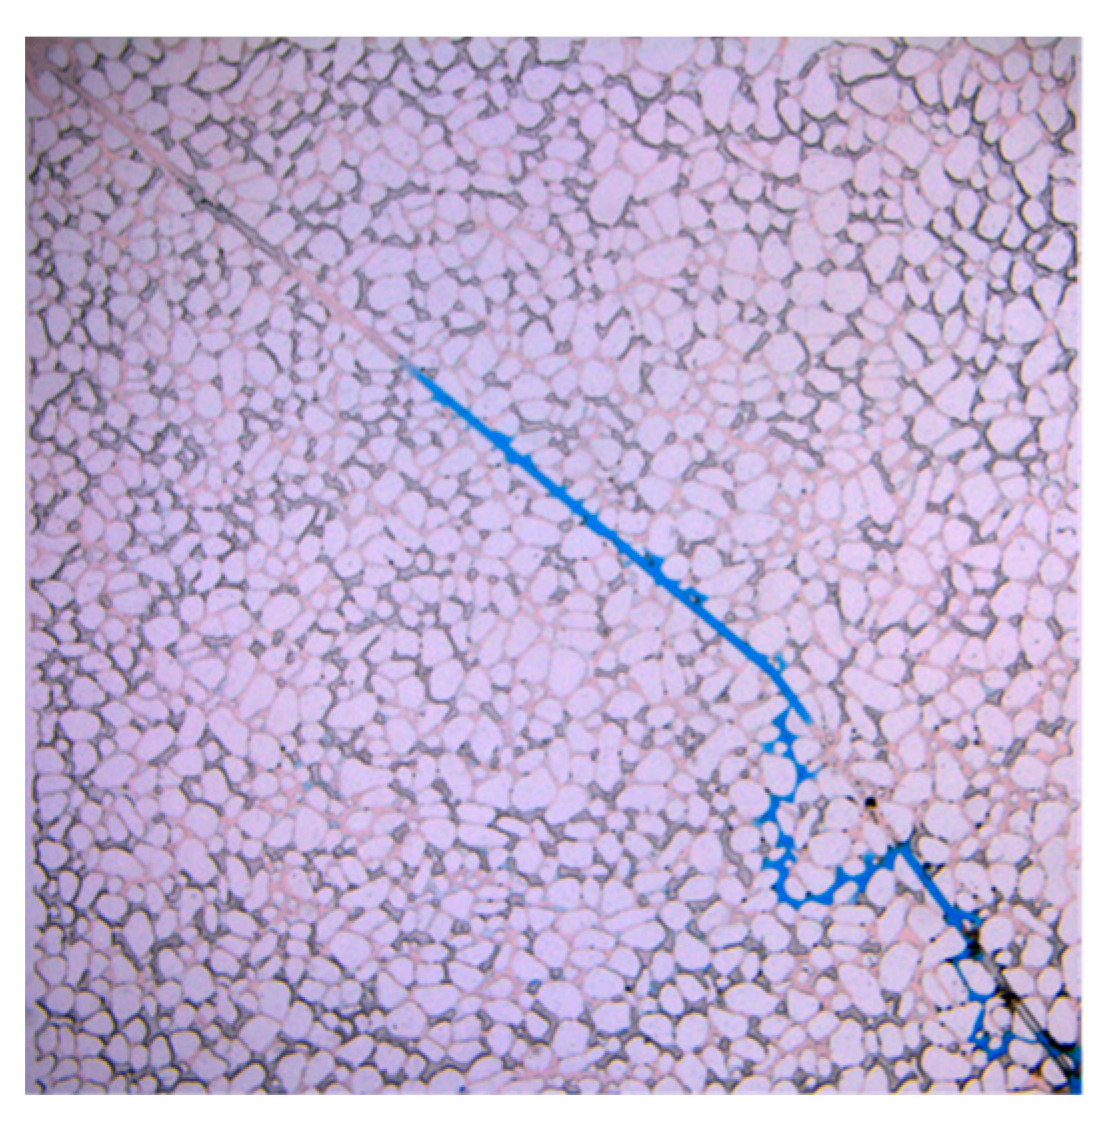
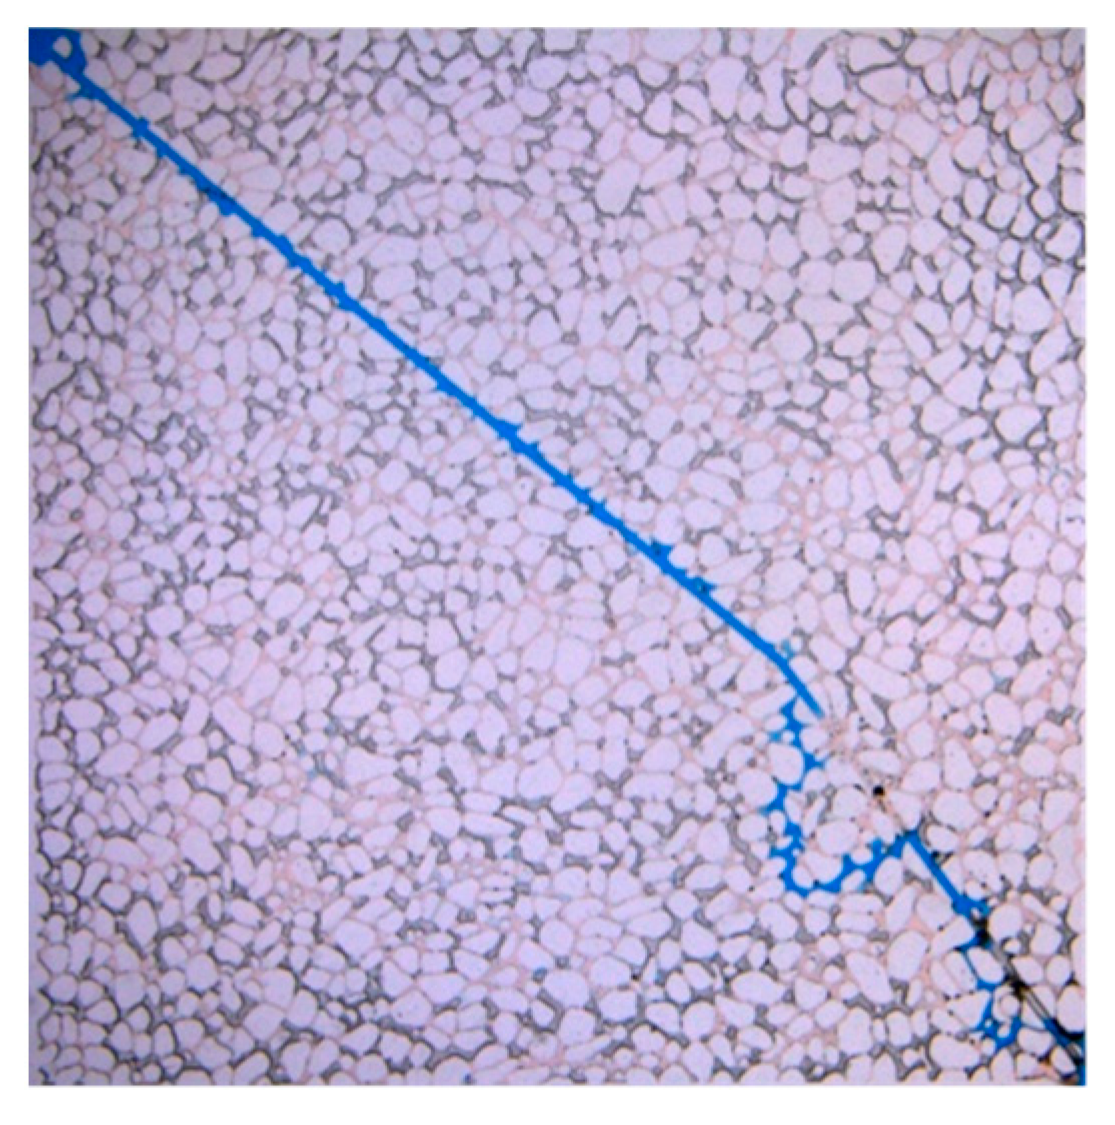
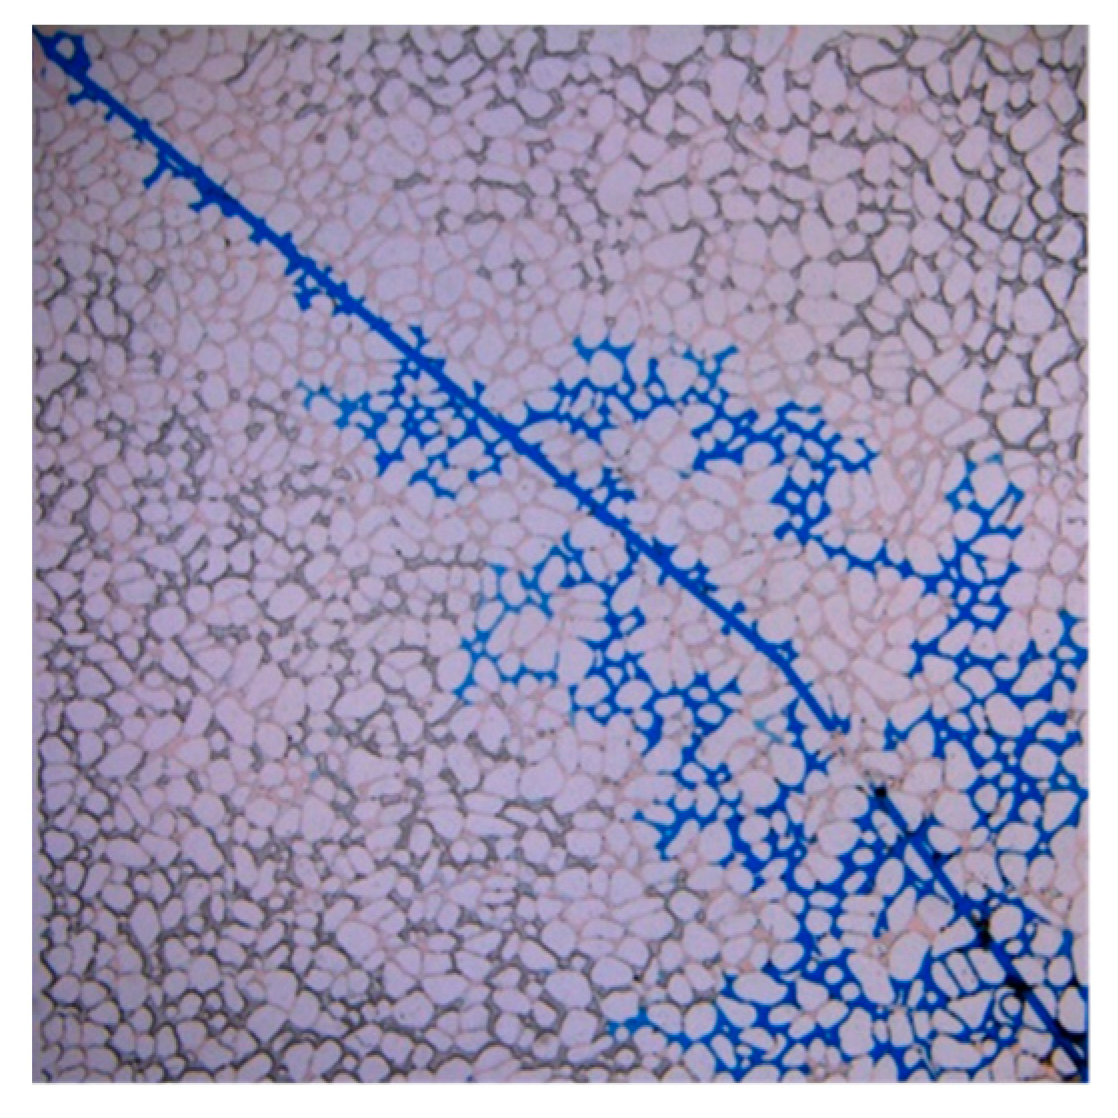
4.2.2. Microfluidic Experiment of Fractured Porous Carbonate Reservoir with Fractures Parallel to Mainstream Line

After the fractured porous carbonate reservoir model with fractures parallel to the mainstream line changes from depletion development to waterflooding development, the injected water first flows along the fracture at the early stage of displacement, as shown in Figure 25, and then water breakthrough happens quickly and the water cut increases rapidly, as shown in Figure 26. Although the injected water flows through the fracture, the injected water can restore formation pressure in the main line area, and dissolved gas from the main line area gradually dissolves again. When the pores containing only simulated oil increase gradually, the fractured porous model is the same as the porous carbonate reservoir model. The large pore throat containing only simulated oil is selected as the flow channel at the same time, the displacement process shows an obvious characteristic of “ displace the oil, not the gas”, and the water driving range is significantly increased.
As the water is injected, the formation pressure is restored, and the dissolved gas continues to dissolve. The area where re-dissolution occurs gradually expands from the main line to the edge, and the efficiency of waterflooding increases, as shown in Figure 27. Figure 28 shows the distribution of the remaining oil of the fractured porous carbonate reservoir model after depletion and water injection. According to threshold segmentation calculation, the oil displacement efficiency of the microfluidic model of the fractured pore carbonate reservoir after depletion and water injection development is 60.73%, as shown in Figure 29.

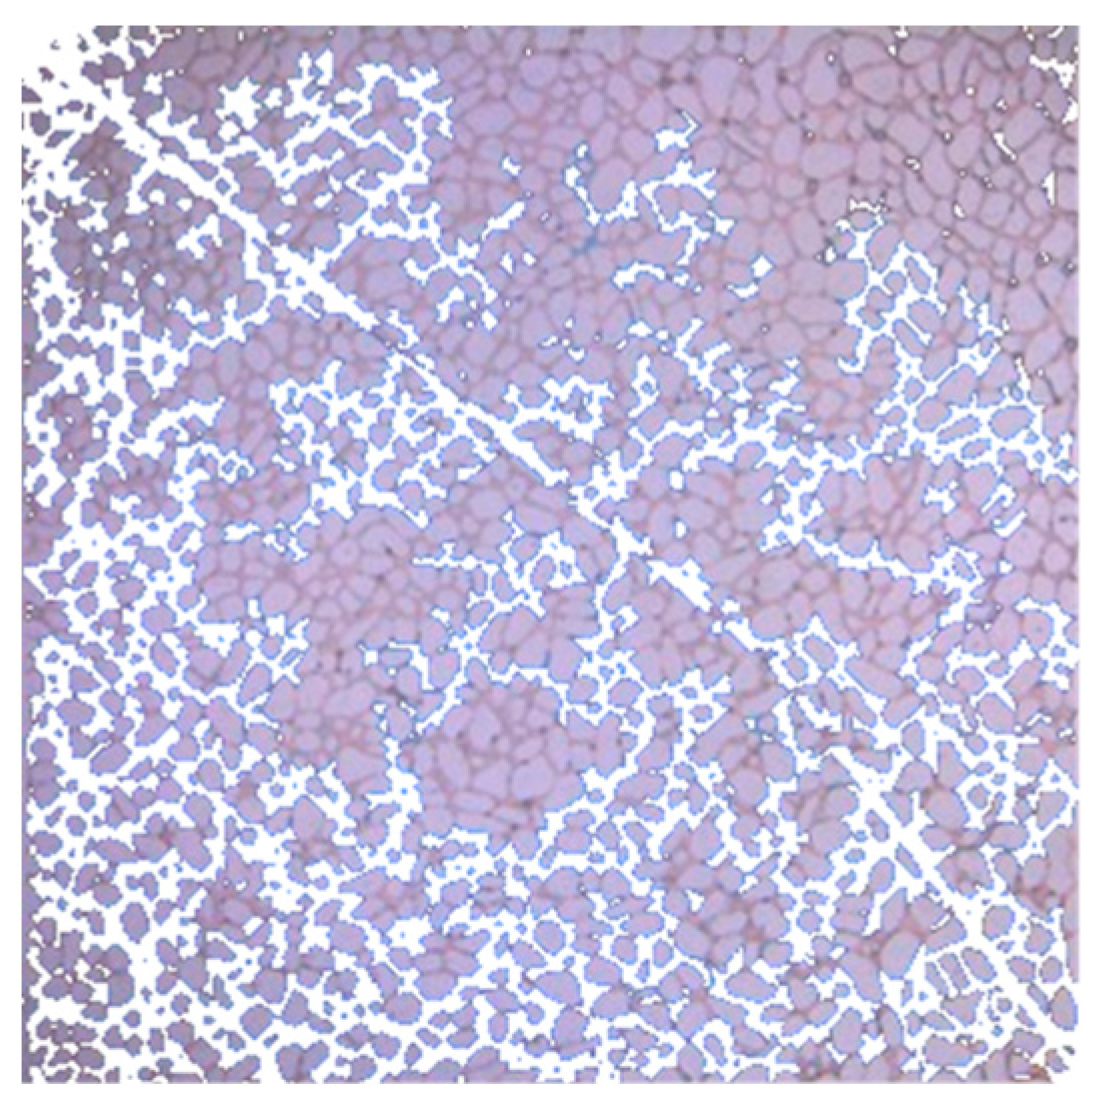
4.3. Distribution Rule of Remaining Oil

The remaining oil distribution of the porous carbonate reservoir and the fractured porous carbonate reservoir is shown in Figure 30, which is dominated by a contiguous cluster of remaining oil, followed by remaining oil that is dispersed and porous. This type of remaining oil distribution is caused by the strong heterogeneity of the carbonate reservoir. At the same time, due to the influence of hydrophilic and weak hydrophilic wettability of the glass etching model, the distribution of the membranous remaining oil is less. Due to the influence of fracture-enhancing heterogeneity, the water driving range of the fractured porous carbonate reservoir is obviously reduced, and the remaining oil saturation is larger than that of the porous carbonate reservoir, and the oil displacement efficiency is reduced by 28.09%.
Compared with the water drive oil microfluidic experiment with a pressure higher than the saturated pressure, it is found that not only the pore throat size, but also the gas phase distribution affects the effective use of oil by injecting water in the water drive oil and the gas microfluidic experiment has a pressure lower than the saturated pressure. In the process of displacement, due to the serious Jamin effect in the gas phase, displacement shows the characteristic of “displace the oil, not the gas”, and the decrease of the oil displacement efficiency is larger than that of the water–oil displacement experiment.

4.4. Mechanism of Water Drive Oil and Gas

(1)
Replenishing formation energy
In depletion and water injection development, the injected water can occupy the volume of the crude oil that is produced, and replenish the formation energy consumed by depletion development and raise the formation pressure to maintenance level, as shown in Figure 31.
It can be seen from Figure 31 that water injection development after depletion development can improve the formation pressure maintenance level, and the formation pressure level gradually rises from below the saturation pressure to above the saturation pressure.
(2)
Protection of reservoir and fluid properties
The water injection development after depletion development can improve the formation pressure level, and the weak volatile oil reservoir especially showed the mechanism of protecting the reservoir and fluid properties. Water injection can make the dissolved gas dissolve again and protect the fluid properties, as shown in Figure 32. The process of redissolution can be seen in Figure 32, which is the inverse process of nucleation, enlargement and coalescence. In addition, water injection can alleviate reservoir damage caused by the Jamin effect and expand the effective mobilization range, as shown in Figure 33.
(3)
Improve the degree of crude oil recovery
Similar to the oil-displacement mechanism of higher-than-saturation pressure, after the depletion development, the injection water can provide the oil-displacement power to drive the crude oil in the large pore throat forward. In hydrophilic-weak hydrophilic reservoirs, the oil is removed from the rock surface along the rock particle surface (pore throat wall), and the oil is transported forward in the form of a continuous water film to drive the oil and improve the degree of crude oil recovery. Figure 34 and Figure 35 show the change of the oil displacement efficiency of the porous and fractured porous carbonate reservoirs, respectively. After waterflooding, the displacement efficiency of the porous and fractured porous carbonate reservoirs increases by 51.02% and 27.61%, respectively.

5. Conclusions

In this paper, in order to explore the gas occurrence state and the flow characteristics of the oil–gas–water three-phase formation fluid in the depletion development process of volatile carbonate reservoir, microscopic displacement experiments of a typical fractured porous reservoir were carried out. The following conclusions can be drawn by analyzing the experimental results:
(1)
In the process of depletion development, the first degassing area of the porous carbonate reservoir is around the production well and the large pore throat area in the model, and the main gas migration channel is the small pore throat area. With the increase of the volume of gas, the gas phase in the small pore throat gradually expands, coalesces and migrates. The degassing sequence of the fractured porous carbonate reservoir is fracture, large pore throat region and small pore throat region.
(2)
The locations of the gas phase increase in the same order. Gas phase state and position and its change rule is as follows: in the early depletion stage, the gas phase occurs in fractures near the matrix, and rapidly forms a continuous gas phase in the fractures. In the middle depletion stage, the occurrence position extends from fractures near the matrix to the large pore throat region. Along with the continuous gas phase formation and migration in the matrix, the occurrence position extends to fractures, the large pore throat region and the small pore throat region.
(3)
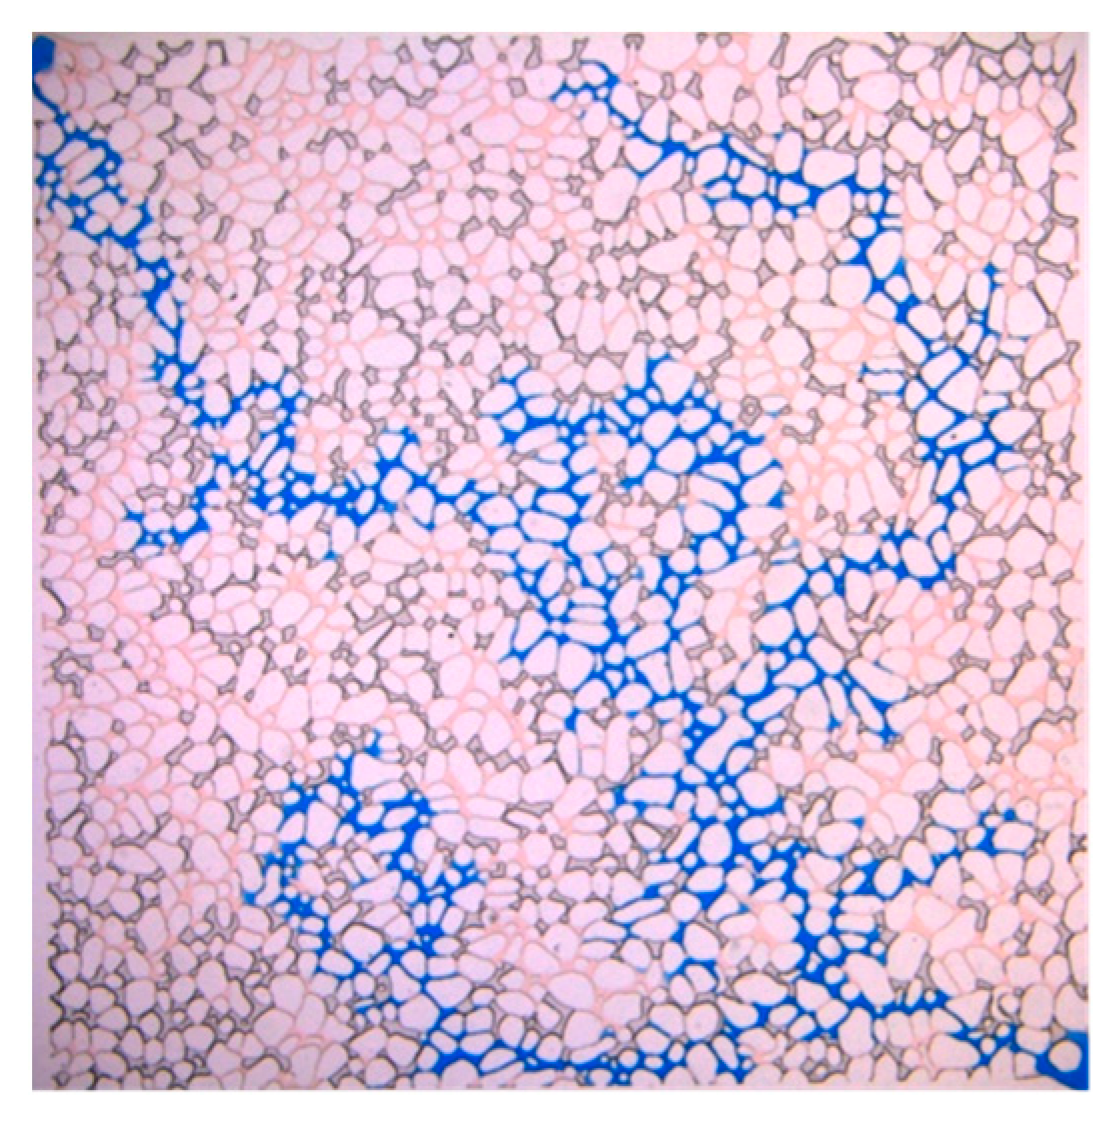
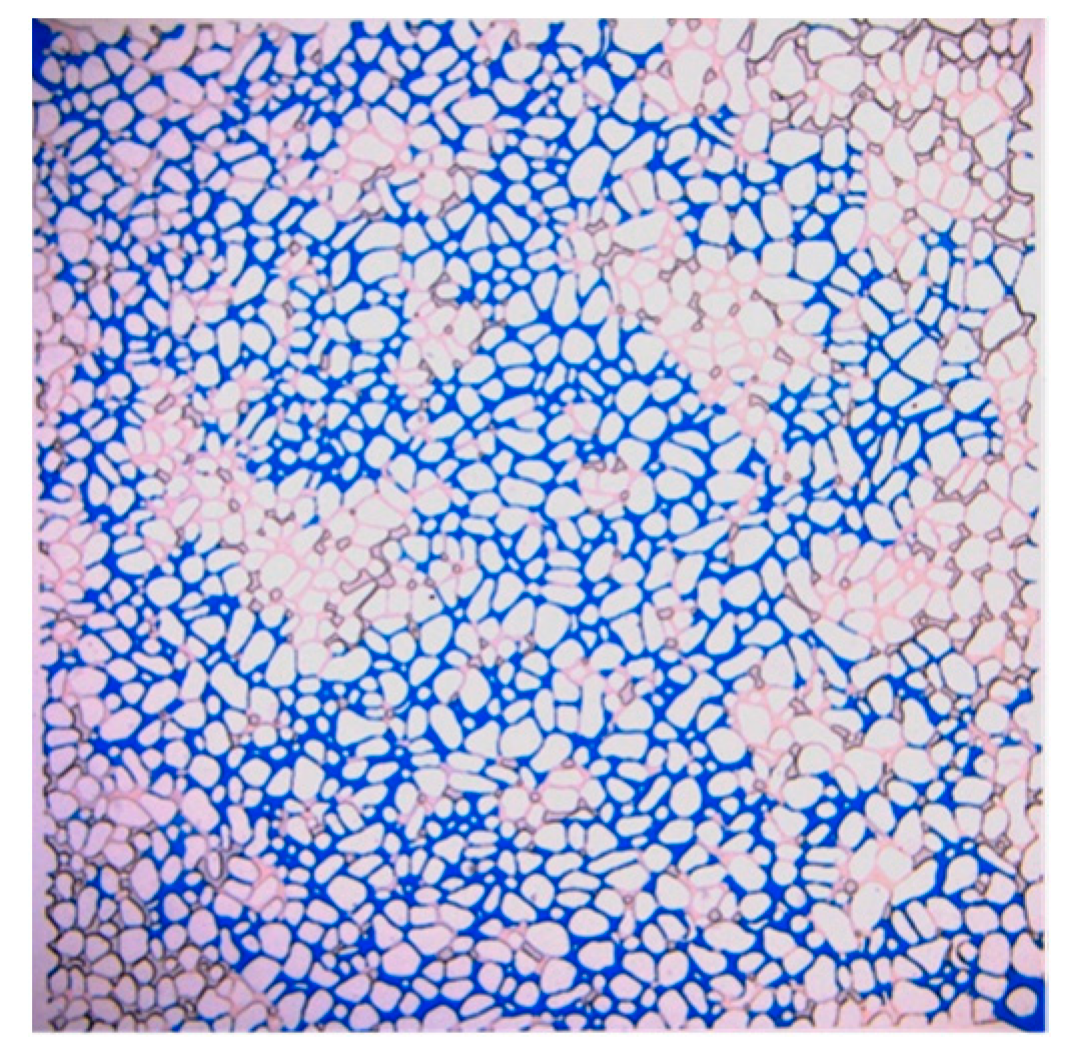
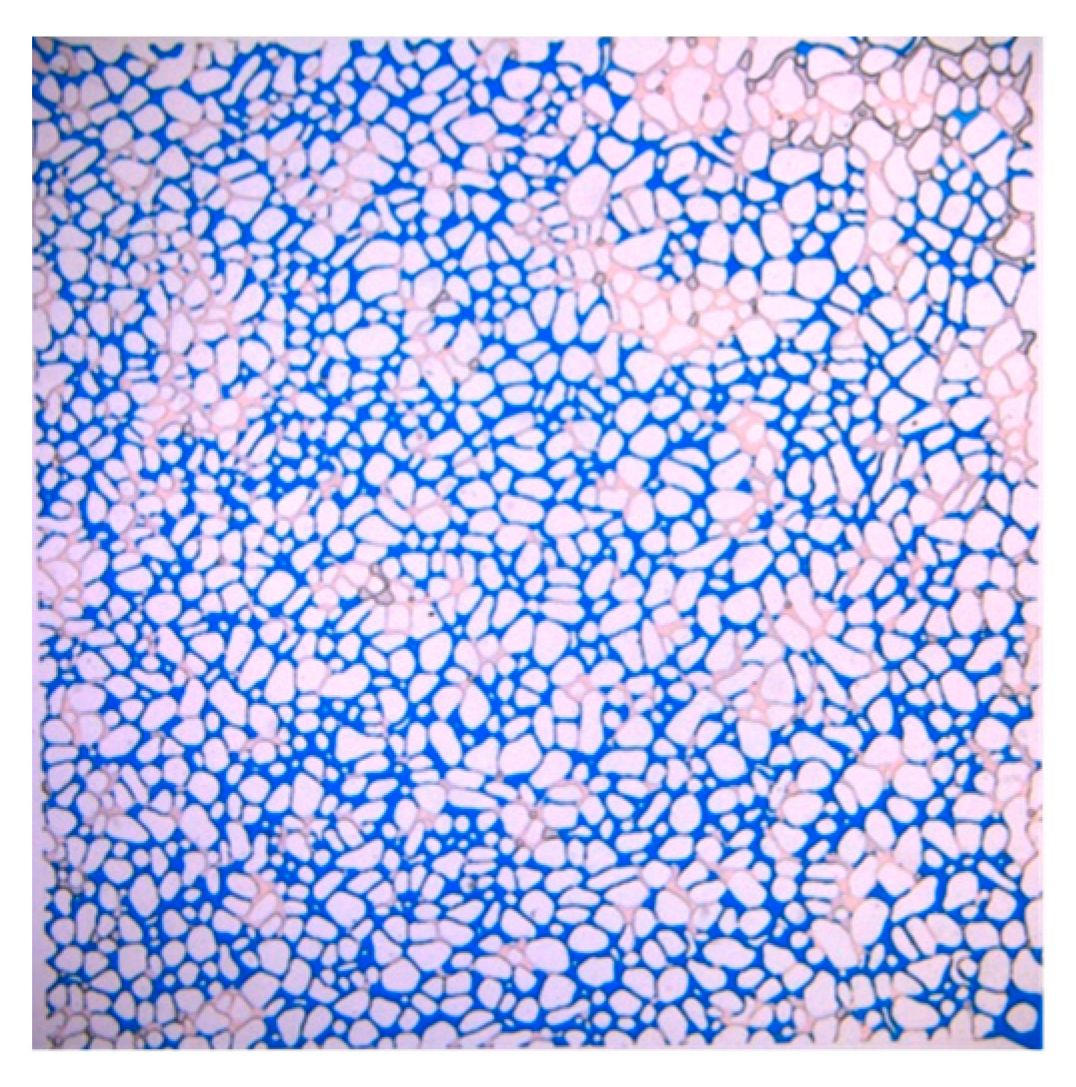
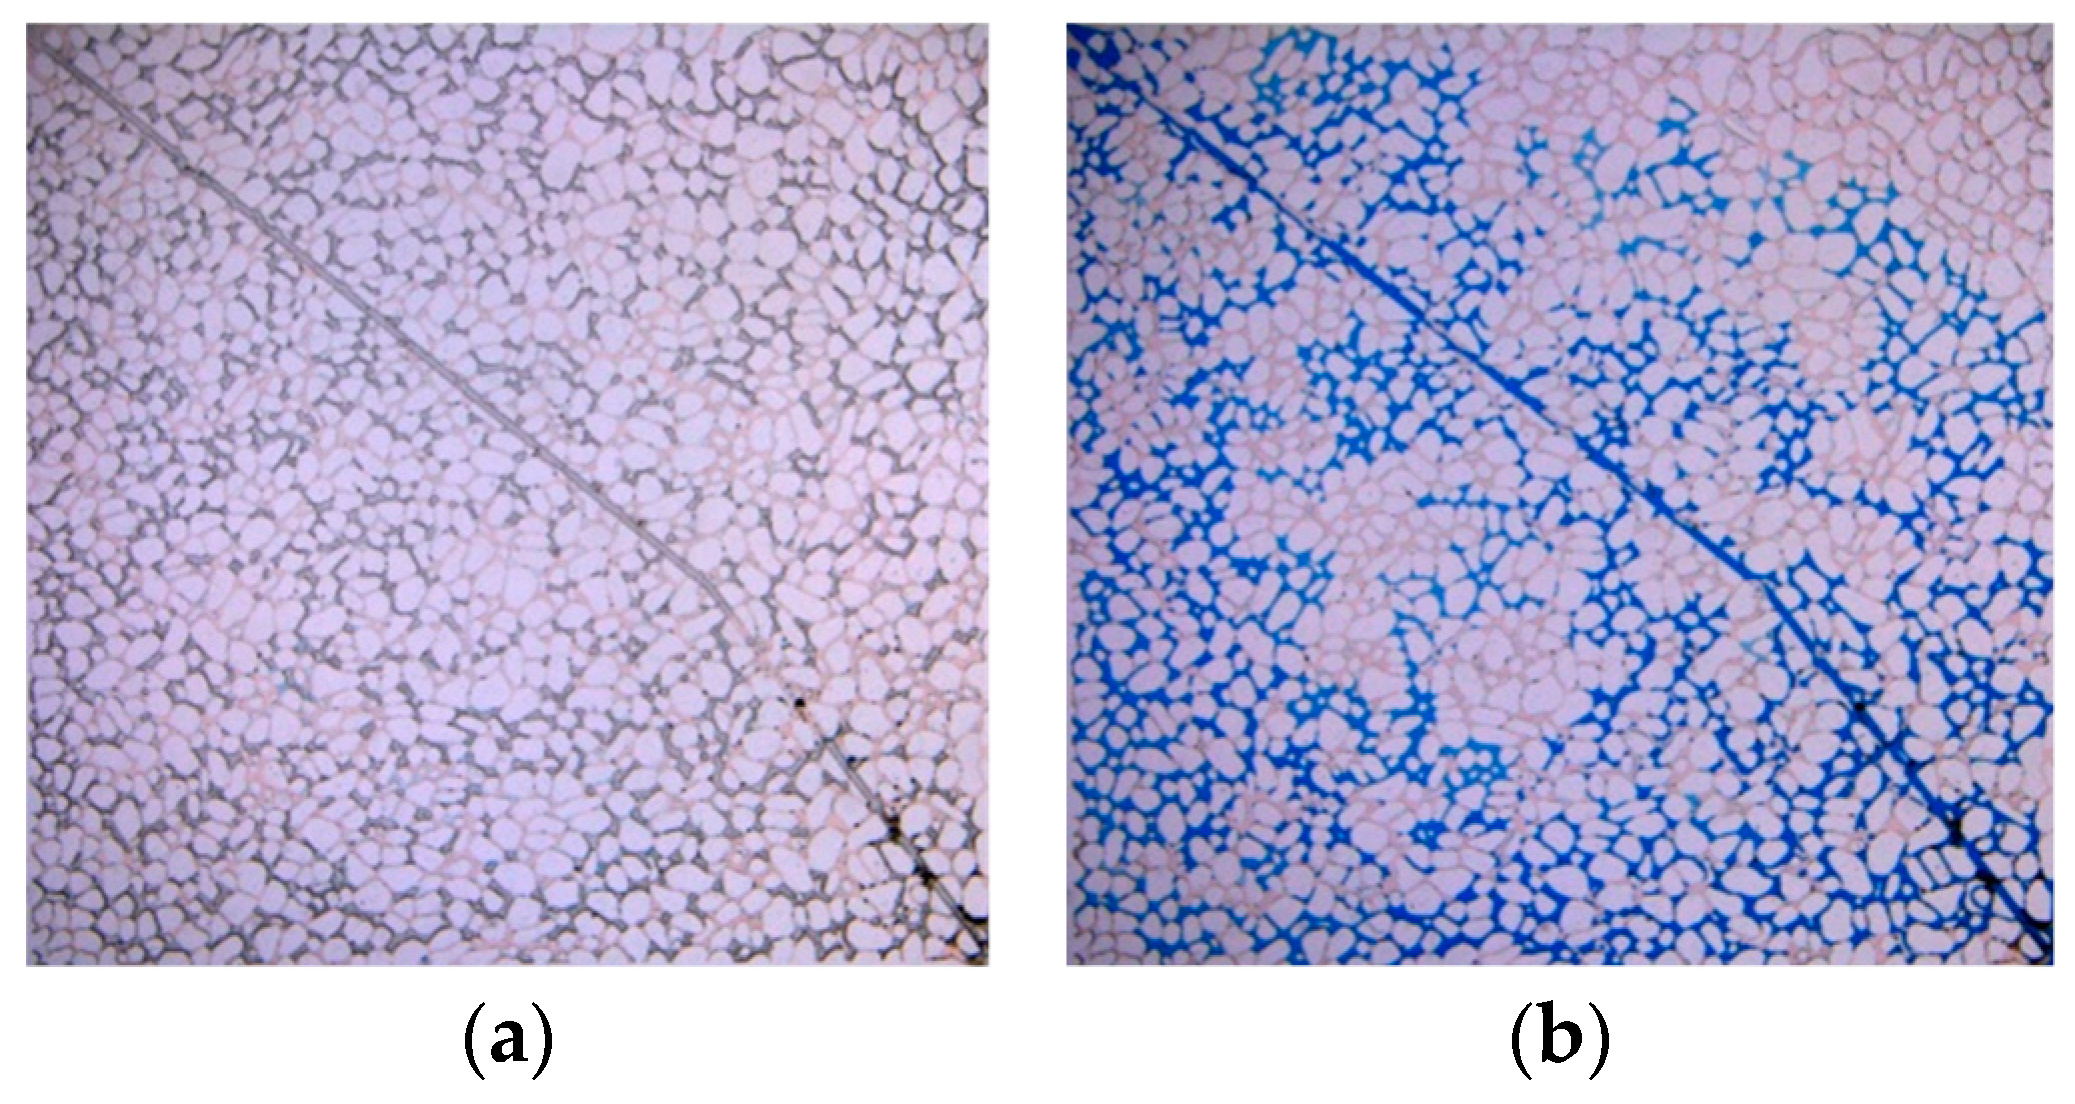
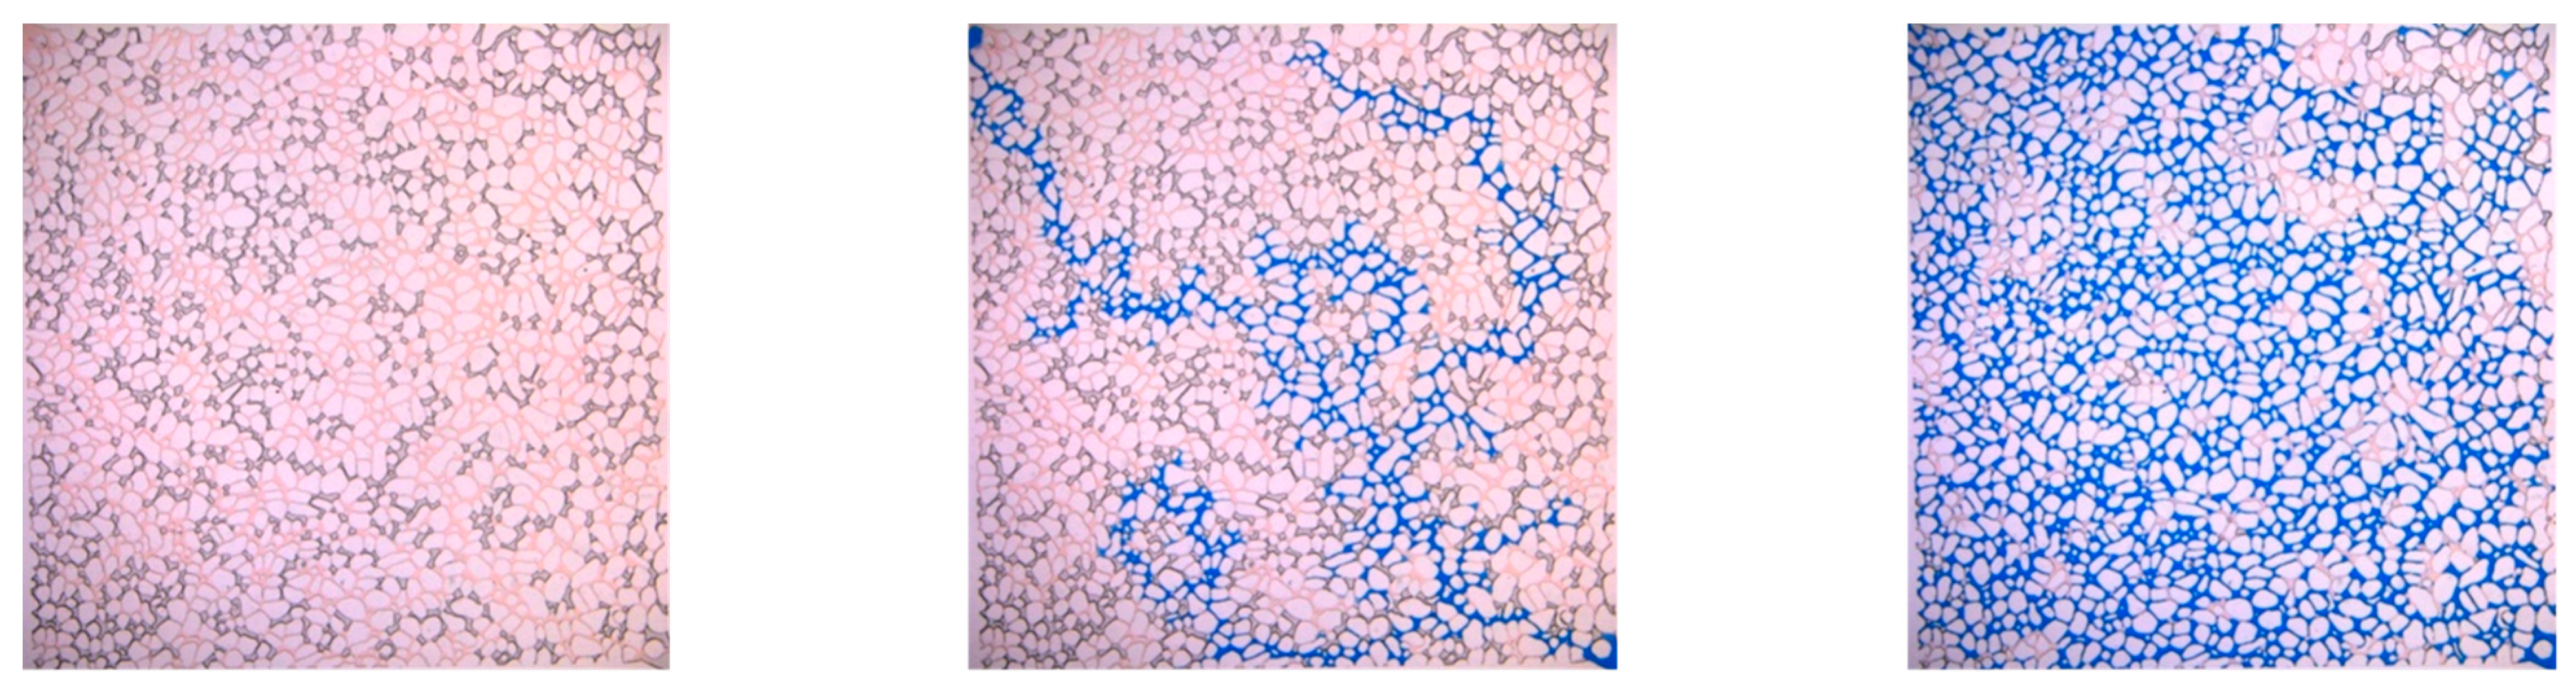
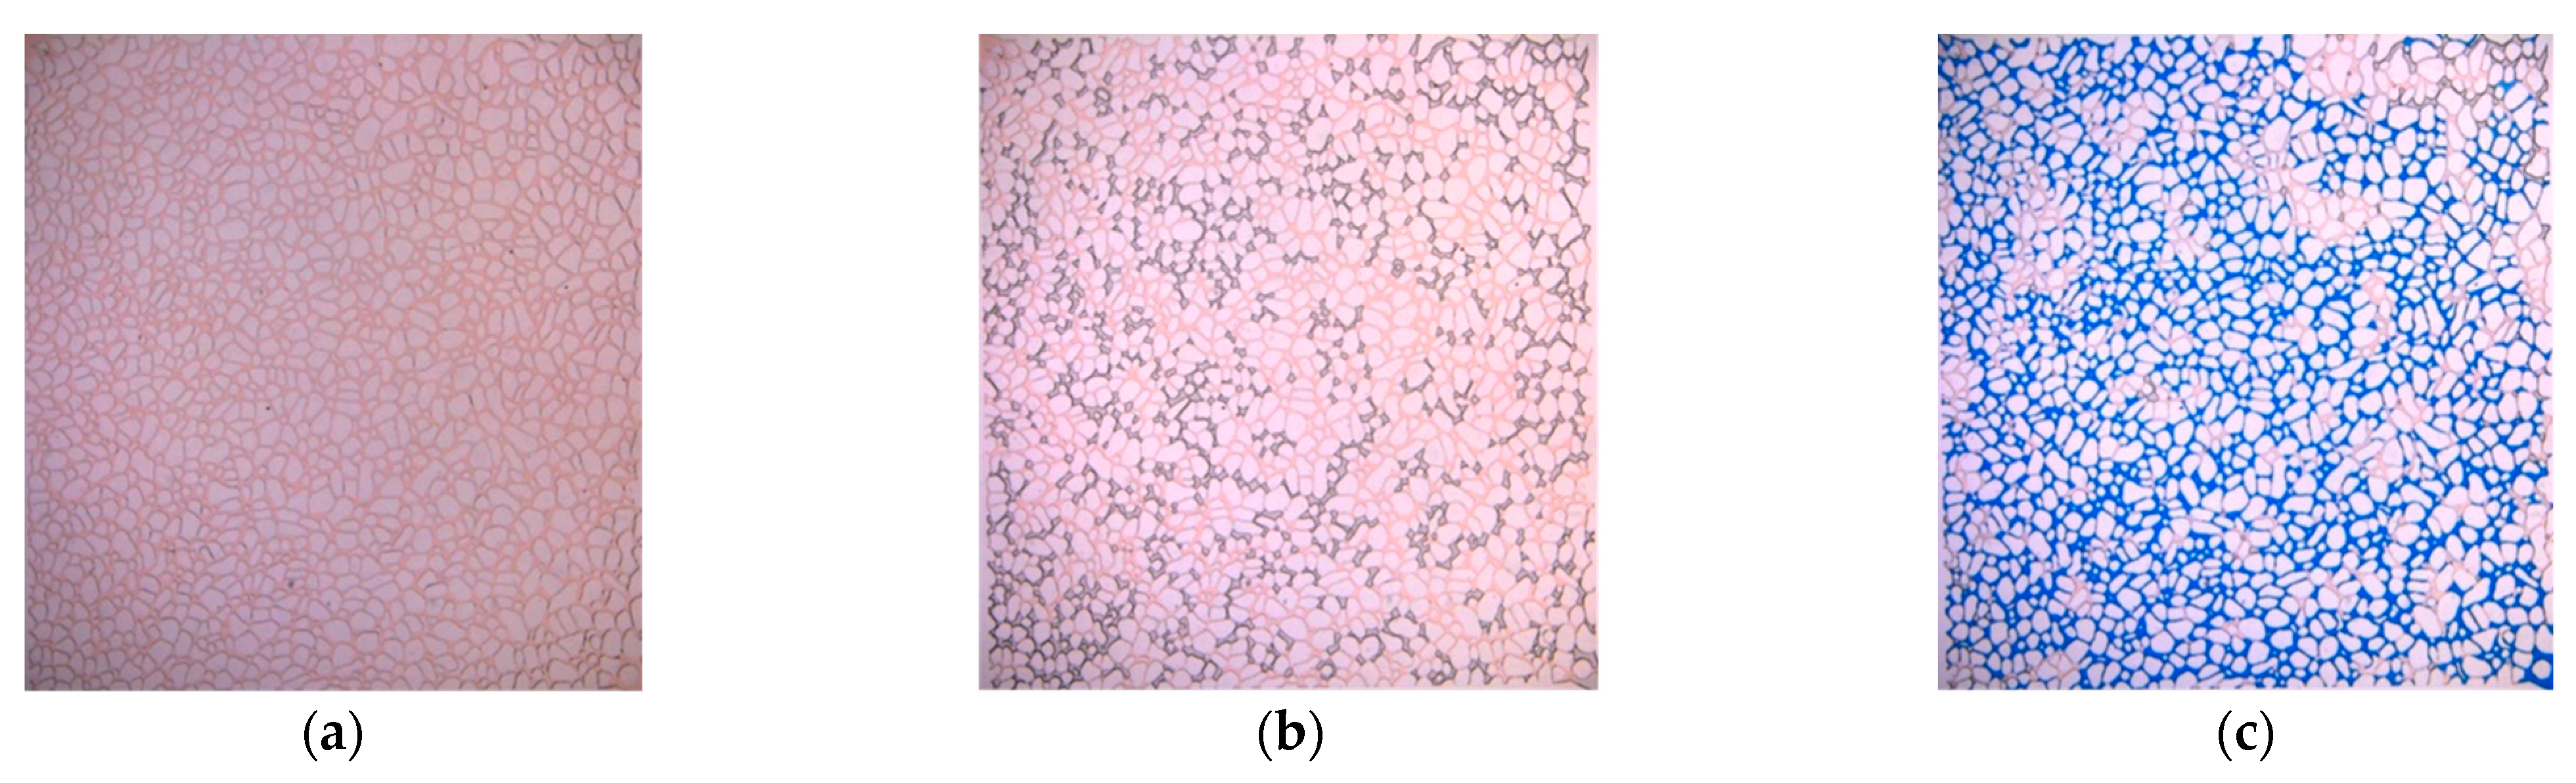
When the depletion development is converted to water injection development, in the early stage of displacement, the injection water preferentially selects the large pore throat or fracture containing only simulated oil as the flow channel, and the displacement process shows an obvious feature of “displace the oil, not the gas”. As the injected water restores and maintains formation pressure, the dissolved gas dissolves continuously, and the area where re-dissolution occurs gradually expands from the main line to the edge, increasing the effective mobilization of water flooding.
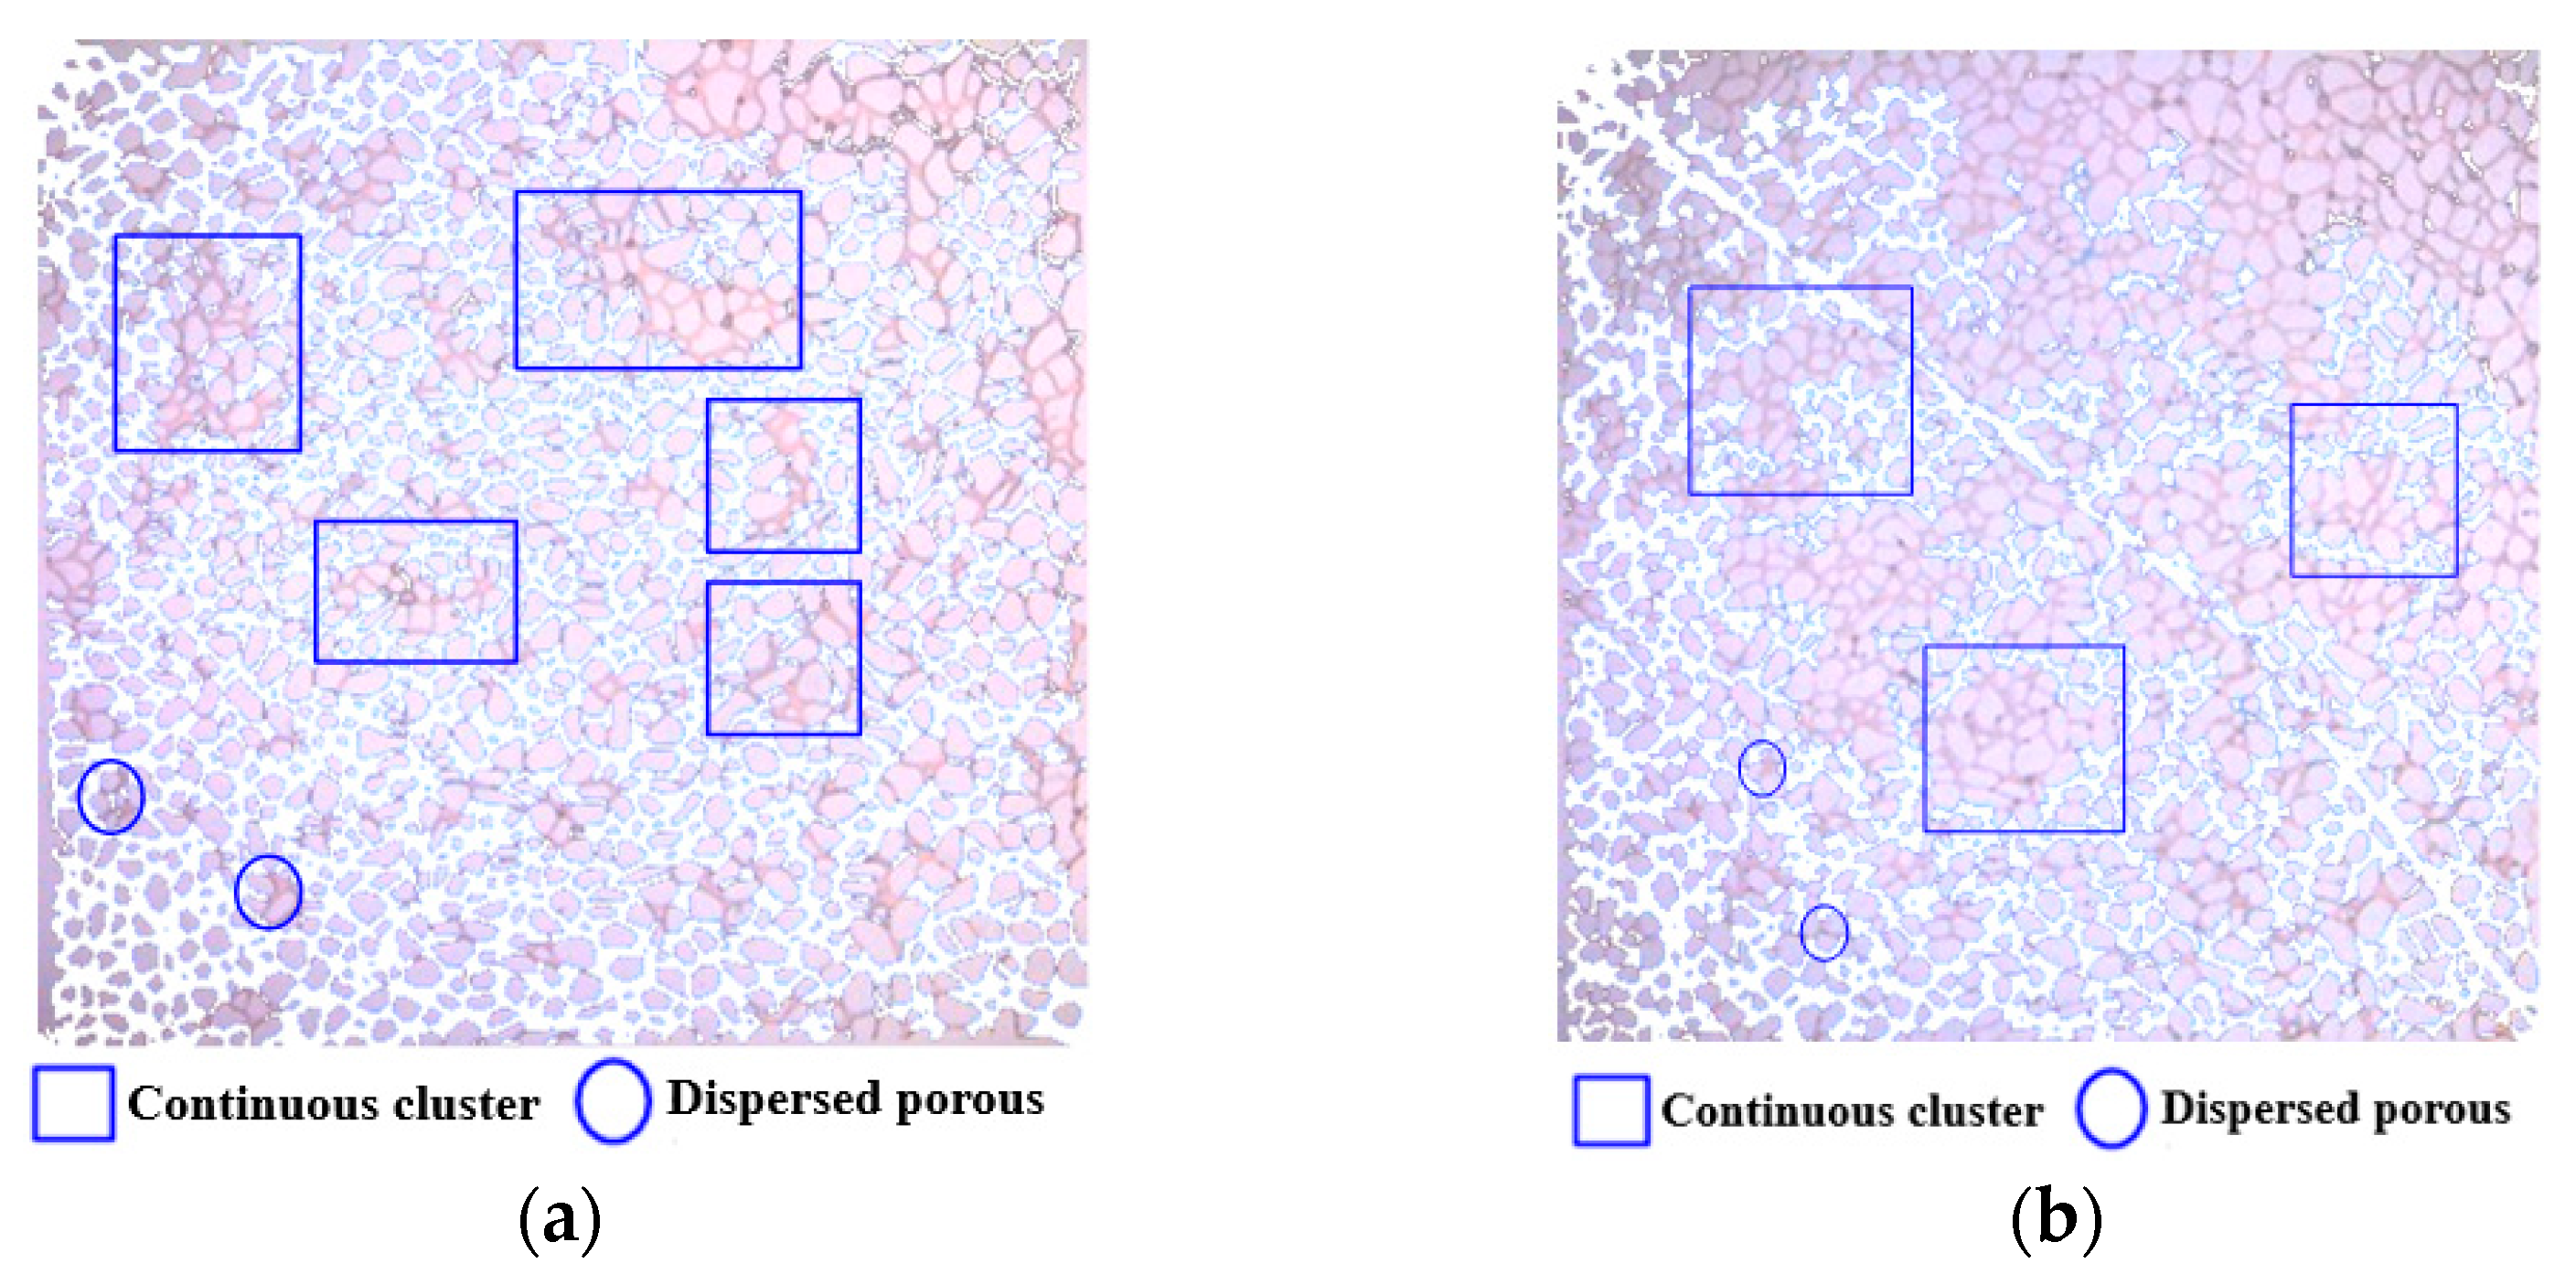
(4)
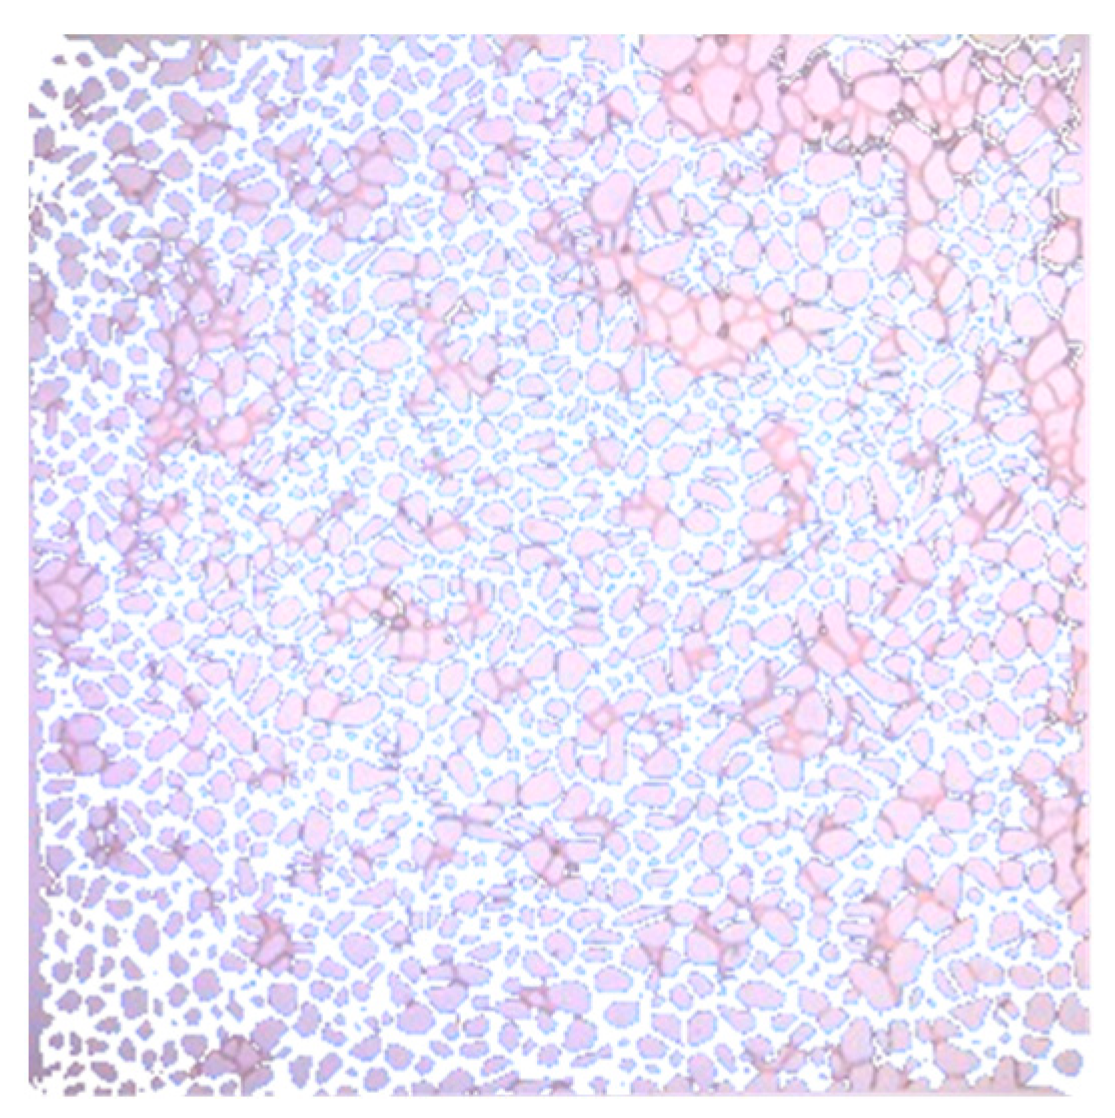
Due to the strong heterogeneity of carbonate reservoirs, the remaining oil in this type of oil field is dominated by a contiguous cluster of remaining oil, followed by the dispersed porous remaining oil, and the membranous remaining oil. Moreover, fractures enhance the influence of heterogeneity, so that the water driving mobilization range decreases obviously, and the remaining oil saturation increases.
(5)
The microfluidic experiment of water-driven live oil can better simulate and observe the whole process of formation fluid seepage in a volatile carbonate reservoir with depletion and waterflooding development. Through analysis and summary, the oil and gas dynamic occurrence law in the depletion development stage and the oil and gas production law in the waterflooding development stage can be obtained. The experimental results show that this method is a feasible and accurate microscopic physical simulation experiment to study the oil–gas–water three-phase flow law in fractured porous carbonate reservoirs.

Author Contributions

Conceptualization, P.J. and H.G.; methodology, P.J.; software, Y.L.; validation, Y.L., H.G. and H.F.; formal analysis, L.C.; investigation, P.J. and L.C.; data curation, Y.L. and H.G.; writing—original draft preparation, Y.L. and H.F.; writing—review and editing, P.J.; supervision, L.C.; project administration, P.J.; funding acquisition, P.J. All authors have read and agreed to the published version of the manuscript.

Funding

This research was partially funded by the National Natural Science Foundation of China (No. 52004307). We would further like to thank financial support of the Science and technology project of CNPC- major project (No. ZLZX2020-02-04).

Institutional Review Board Statement

Not applicable.

Informed Consent Statement

Not applicable.

Data Availability Statement

Due to privacy restrictions, the data from the study period is unavailable.

Conflicts of Interest

The authors declare no conflict of interest. The funders had no role in the design of the study; in the collection, analyses, or interpretation of data; in the writing of the manuscript; or in the decision to publish the results.

References

  1. Alizadeh, A.; Khishvand, M.; Ioannidis, M.; Piri, M. Multi-scale experimental study of carbonated water injection: An effective process for mobilization and recovery of trapped oil. Fuel 2014, 132, 219–235. [Google Scholar] [CrossRef]
  2. Chen, L. Simulation Study of Gas-Water Two-Phase Seepage Characteristics in Porous Media. Ph.D. Thesis, Dalian University of Technology, Dalian, China, 2014. [Google Scholar]
  3. Chen, Q. Study on the Production Characteristics and Development Mode of Near-Critical Volatile Clastic Reservoirs. Master’s Thesis, Southwest Petroleum University, Chengdu, China, 2017. [Google Scholar]
  4. He, G.; Zhang, L.; Lang, Z. Production characteristics of volatile oil reservoirs and factors affecting oil recovery. Fault-Block Oil Gas Fields 1996, 2, 23–26. [Google Scholar]
  5. Zhong, X.; Wang, L.; Chen, L. Development experience of weak volatile oil reservoirs in Changchun. Acta Pet. Sin. 2001, 1, 67–71. [Google Scholar]
  6. He, Y.; Ling, J. Water injection development of volatile reservoirs. West. Prospect. Proj. 2004, 4, 80–81. [Google Scholar]
  7. Huang, W.; Qin, X.; Du, X. Study on the development effect of water injection and gas injection in weak volatile black oil reservoir. Pet. Geol. Oil Recovery 2012, 19, 87–89. [Google Scholar]
  8. Gao, C.; Lei Yang, W.; Fu, Q.; Hou, S. Exploration and application of “water injection and pressure retention” development technology for weakly volatile reservoirs in carbonate rocks. Chem. Eng. Equip. 2016, 6, 90–93. [Google Scholar]
  9. Hai, X.; Roland, N. Experimental Study of Composition Variation During Flow of Gas-Condensate. In Proceedings of the SPE Annual Technical Conference and Exhibition, Houston, TX, USA, 28–30 September 2015. [Google Scholar]
  10. Leili, M.; Ehsan, R.; Dario, R.; Martin, B.; Giuseppe, M.; Franco, M.; Alberto, C.; Fabio, I.; Alberto, G. Combining Two- and Three-Phase Coreflooding Experiments for Reservoir Simulation Under WAG Practices. In Proceedings of the International Petroleum Technology Conference, Dhahran, Saudi Arabia, 13–15 January 2020. [Google Scholar]
  11. Li, J.; Su, H.; Jiang, H.; Yu, F.; Liang, T.; Zhao, Y.; Gao, Y.; Hossein, H. Application of microfluidic model in oil and gas field development. Pet. Sci. Bull. 2018, 3, 284–301. [Google Scholar]
  12. Li, J.; Jiang, H.; Wang, C.; Zhao, Y.; Gao, Y.; Pei, Y.; Wang, C.; Dong, H. Pore-scale investigation of microscopic remaining oil variation characteristics in water-wet sandstone using CT scanning. J. Nat. Gas Sci. Eng. 2017, 48, 36–45. [Google Scholar] [CrossRef]
  13. Liu, J.; Li, Y.; Bi, Y.; He, Q. Application of oil drive microsimulation experimental techniques to study the characteristics of reservoir residual oil microdistribution. China Offshore Oil and Gas. Geology 2000, 1, 52–55. [Google Scholar]
  14. Liu, Y.; Liang, W.; Wang, Q.; Yang, X.; Lu, Y. Analysis of the effect of water drive development in a weakly volatile reservoir with exceptionally low permeability in a hilly oilfield. Spec. Oil Gas Reserv. 2006, 4, 51–68. [Google Scholar]
  15. Lenomand, R.; Touboul, E.; Zarcone, C. Numerical models and experiments on immiscible displacements in porous media. J. Fluid Mech. 1988, 189, 165–187. [Google Scholar] [CrossRef]
  16. Molla, S.; Mostowfi, F. Microfluidic platform for PVT measurements. In Proceedings of the SPE Annual Technical Conference and Exhibition, Amsterdam, The Netherlands, 27–29 October 2014. [Google Scholar]
  17. Akbarabadi, M.; Alizadeh, A.; Piri, M.; Nagarajan, N. Experimental evaluation of enhanced oil recovery in unconventional reservoirs using cyclic hydrocarbon gas injection. Fuel 2023, 331, 125676. [Google Scholar] [CrossRef]
  18. Khishvand, M.; Alizadeh, A.; Piri, M. In-situ characterization of wettability and pore-scale displacements during two- and three-phase flow in natural porous media. Adv. Water Resour. 2016, 97, 279–298. [Google Scholar] [CrossRef]
  19. Vicencio, O.A.; Sepehrnoori, K. Simulation of Nitrogen Injection into Naturally Fractured Reservoirs Based on Uncertain Properties and Proper Matrix Grid Resolution. In Proceedings of the International Oil Conference and Exhibition, Cancun, Mexico, 31 August–2 September 2006. SPE-104038-MS. [Google Scholar]
  20. Song, P.; Yao, R.; Chu, S.; Zhen, Y.; Zhang, S. Mechanism of gas-liquid two-phase seepage and water drive characteristics of condensate reservoirs in Banqiao area. Pet. Geol. Eng. 2013, 27, 80–82. [Google Scholar]
  21. Uddin, M. Numerical Studies of Gas Exsolution in a Live Heavy-Oil Reservoir. In Proceedings of the SPE International Thermal Operations and Heavy Oil Symposium, Calgary, AB, Canada, 1–3 November 2005. [Google Scholar]
  22. Wang, C.; Li, X. Experimental study on microscopic pore modeling of condensate gas phase change. J. Eng. Thermophys. 2006, 2, 251–254. [Google Scholar]
  23. Zhao, W.; Zhao, L.; Wang, X.; Wang, S.; Sun, M.; Wang, C. Phase behavior characteristics and water-flooding development technical policy of weakly volatile oil in carbonate reservoirs. Pet. Explor. Dev. 2016, 43, 308–314. [Google Scholar] [CrossRef]
  24. Gao, J.; Kwak, H.; Marwah, A. Accurate Carbonate Pore System Characterization by Nuclear Magnetic Resonance and Micro-CT Techniques. In Proceedings of the SPE Middle East Oil & Gas Show and Conference, Event Canceled, 28 November–1 December 2021; SPE-204659-MS. Available online: https://onepetro.org/SPEMEOS/proceedings/21MEOS/3-21MEOS/D031S027R007/474514?searchresult=1 (accessed on 10 January 2023).
  25. Berg, S.; Gao, Y.; Georgiadis, A.; Brussee, N.; Coorn, A.; van der Linde, H.; Dietderich, J.; Alpak, F.O.; Eriksen, D.; van den Heuvel, M.M.; et al. Determination of Critical Gas Saturation by Micro-CT. Petrophysics 2020, 61, 133–150. [Google Scholar] [CrossRef]
  26. Lv, W. Application of CT Technology in Oilfield Development Experiments; Petroleum Industry Press: Beijing, China, 2020; pp. 7–15. [Google Scholar]
  27. Hou, J.; Qiu, M.; Lu, N. CT technology was used to study the microscopic occurrence state of core residual oil. Acta Pet. Sin. 2014, 35, 319–325. [Google Scholar]
  28. Lv, W.; Leng, Z.; Zhang, X. The mechanism of low-permeability core water flooding was studied by CT scanning technology. Pet. Geol. Oil Recovery 2013, 20, 87–90. [Google Scholar]
  29. Zhao, W.; Zhao, L.; Jia, P.; Wang, P.; Hou, J. Influence of micro-heterogeneity of fractured-porous reservoirs on the water flooding mobilization law. Sustain. Energy Technol. Assess. 2022, 53, 102694. [Google Scholar] [CrossRef]
  30. Zhao, W.; Zhao, L.; Wang, X.; Wang, S.; Sun, M.; Wang, C. Phase characteristics of crude oil in weakly volatile carbonate reservoirs and countermeasures for water injection development. Pet. Explor. Dev. 2016, 43, 281–286. [Google Scholar] [CrossRef]
Figure 1. Thin sheet of reference unit cast. (a) Pore characteristics; (b) Fracture characteristics.
Applsci 13 06642 g001
Figure 2. Distribution of pore radius and throat radius of carbonate reservoir pore reference unit. (a) Pore radius distribution map; (b) Throat radius distribution map.
Applsci 13 06642 g002
Figure 3. Physical diagram of microfluidic model. (a) Carbonate pore type; (b) Carbonate fracture pore type.
Applsci 13 06642 g003
Figure 4. Water drives the microfluidic experimental platform under saturation pressure.
Applsci 13 06642 g004
Figure 5. Saturated oil in the pore carbonate model.
Applsci 13 06642 g005
Figure 6. Macropore throat degassing in the porous carbonate model.
Applsci 13 06642 g006
Figure 7. Gas phase migration in porous carbonate model.
Applsci 13 06642 g007
Figure 8. Expansion of degassing zone in porous carbonate model.
Applsci 13 06642 g008
Figure 9. Distribution of remaining oil in depletion development with pore type model.
Applsci 13 06642 g009
Figure 10. Threshold segmentation of depletion development in pore model.
Applsci 13 06642 g010
Figure 11. Fracture porosity model saturated oil.
Applsci 13 06642 g011
Figure 12. The first stage of degassing of fracture pore model.
Applsci 13 06642 g012
Figure 13. Second degassing stage of fracture pore model.
Applsci 13 06642 g013
Figure 14. Gas migration in the large pore throat of fracture pore model.
Applsci 13 06642 g014
Figure 15. Migration of pore throat in fracture pore model.
Applsci 13 06642 g015
Figure 16. The third stage of degassing for the porous carbonate model.
Applsci 13 06642 g016
Figure 17. Distribution of depleted remaining oil in the fracture porosity model.
Applsci 13 06642 g017
Figure 18. Threshold segmentation of the fracture porosity model depletion development.
Applsci 13 06642 g018
Figure 19. Evolution process of gas phase. (a) Oil saturation; (b) Bubble nucleation; (c) Bubble expansion; (d) Bubble coalescence; (e) Continuous gas phase migration.
Applsci 13 06642 g019
Figure 20. Pore model in the early stage of waterflood development.
Applsci 13 06642 g020
Figure 21. Porosity model water in production well.
Applsci 13 06642 g021
Figure 22. Formation pressure recovery in pore model.
Applsci 13 06642 g022
Figure 23. Distribution of remaining oil after water injection after initial depletion in pore model.
Applsci 13 06642 g023
Figure 24. Threshold segmentation of remaining oil in water injection after exhaustion in pore model.
Applsci 13 06642 g024
Figure 25. Fracture porosity model in the early stage of waterflood development.
Applsci 13 06642 g025
Figure 26. Fracture porosity model Water appears in production Wells.
Applsci 13 06642 g026
Figure 27. Increase in waterflood development and utilization of fracture pore type model.
Applsci 13 06642 g027
Figure 28. Distribution of remaining oil in fracture pore model after exhaustion.
Applsci 13 06642 g028
Figure 29. Segmentation of threshold value of remaining oil in water injection after exhaustion in fracture pore model.
Applsci 13 06642 g029
Figure 30. Remaining oil types in pore model and fracture pore model. (a) Pore type model remaining oil type; (b) Residual oil type of fracture pore model.
Applsci 13 06642 g030
Figure 31. Water injection to replenish formation energy. (a) The pressure drops below saturation at the end of depletion development; (b) Rising above saturation pressure at the end of waterflood development.
Applsci 13 06642 g031
Figure 32. Injected water protects fluid properties. ① Before replenishing formation energy; ② Early stage of water injection; ③ Meddle stage of water injection; ④ Late stage of water injection.
Applsci 13 06642 g032
Figure 33. Injection water protects the reservoir.
Applsci 13 06642 g033
Figure 34. Change of displacement efficiency of porous carbonate rock model. (a) Original condition; (b) Depletion development; (c) Water injection development.
Applsci 13 06642 g034
Figure 35. Change of oil displacement efficiency of fractured pore carbonate model. (a) Original condition; (b) Depletion development; (c) Water injection development.
Applsci 13 06642 g035
Table 1. Test results of cast thin section.
Serial NumberHorizonThe Name of the RockStorage Space (%)
The HoleFissureTotal Hole Seam Surface Ratio
Intergranular Dissolved PorePaste DieThe Coelomic Cavity HoleSolution PoresStructural Fractures
4-17The carboniferous KT-IDolomicrite23.40.5390.136
4-43zThe carboniferous KT-IArgillaceous and silty dolomite81150.115.1
Table 2. Pore throat parameters summary of microfluidic model.
Model Type Maximum Aperture (μm)Minimum Aperture (μm)Average Aperture (μm)Concentrated Distribution Range of Aperture (μm)Seam Width (mm)
Pore type 754.2910.57125.82200–400/
Fracture pore pattern754.2910.57125.82200–4000.17
Disclaimer/Publisher’s Note: The statements, opinions and data contained in all publications are solely those of the individual author(s) and contributor(s) and not of MDPI and/or the editor(s). MDPI and/or the editor(s) disclaim responsibility for any injury to people or property resulting from any ideas, methods, instructions or products referred to in the content.

