Review

Review of Scanning and Pixel Array-Based LiDAR Point-Cloud Measurement Techniques to Capture 3D Shape or Motion †

Faculty of Engineering and Natural Sciences, Konya Technical University, Selcuklu 42250, Turkey
This paper is an extended version of a paper presented at the XXIV ISPRS Congress, held in Nice, France from 6–11 June 2022.
Appl. Sci. 2023, 13(11), 6488; https://doi.org/10.3390/app13116488
Submission received: 3 January 2023 / Revised: 23 January 2023 / Accepted: 24 May 2023 / Published: 25 May 2023

Abstract

:
Developments in light detection and ranging (LiDAR) technology have brought innovations in three-dimensional (3D) measurement. After mechanical laser scanners were introduced in the 1990s, the speed and point density of LiDAR measurements have increased considerably with the developments in photon imagers. On the other hand, lightweight and small-size LiDAR sensors and their integrated use with other related sensors have made the use of LiDAR widespread for mapping and navigation purposes on mobile platforms. Matrix imaging LiDAR cameras and solid-state laser scanners have no or fewer moving parts for measurement, and are unaffected by vibrations. They are usually used in mobile mapping, driverless vehicle navigation, and mobile robot navigation. Pulse or phase-shift methods are used to measure the distance from the LiDAR instrument to the scan point. The measured scan point direction is determined by the orientation angles of the beam in scanners, focal length, and pixel positions in matrix viewers, and instrument-centered 3D coordinates are calculated. LiDAR tools have their own specific capabilities and limitations. Therefore, the selection of the appropriate LiDAR for any application is very important. In this study, after LiDAR principles are introduced, scanning LiDAR and pixel-based matrix imager LiDAR methods used to measure 3D point clouds are technically examined and analyzed.

1. Introduction

LiDAR is a technique for measuring the distance of any object or surface point remotely using laser light. As a result of developments in electronics and computer techniques, LiDAR has gained significant progress in three-dimensional (3D) measurement. Moreover, mobile measurements can be made during the motion of the object or measuring instrument. This situation has opened the door to the use of 3D LiDAR tools in a wide variety of applications. Currently, LiDAR is a measurement technique for a wide range of applications, such as mapping [1], unmanned vehicle navigation [2], 3D digitization [3], robotics [4], building information modeling [5], etc. A single-solution LiDAR measurement technique is not proper for all these applications.
The developments in LiDAR technology have provided new techniques for measuring 3D point clouds (Figure 1). These innovations are in the form of reducing the size, weight, and cost of LiDAR devices while increasing their measurement speed and density. In this way, LiDAR measurement from aerial and terrestrial mobile platforms has become more widespread.
TLS has accelerated 3D measurement with intensive spatial data in a short time. Thanks to the advantages they provide, TLS is widely used for object modeling and topographic surveying [6,7]. They are ground-dependent instruments for static measurements. The integrated use of laser beams with sensors such as GPS and inertial measurement units (IMU) has enabled mobile 3D measurement [8,9]. Terrestrial mobile LiDAR with mobile vehicles is used in the creation of 3D models of urban areas and corridor mapping [10]. Aerial LiDAR is used for mapping large areas and creating a digital elevation model. This situation has especially highlighted the LiDAR method in providing data to geographical information systems [11]. On the other hand, thanks to the fact that LiDAR measurements can be made in a short time, changes in the measurement area can be easily reflected in databases.
A new era has been started in LiDAR measurement with compact time-of-flight (ToF) cameras used in indoor measurements. These cameras using the ToF technique can simultaneously measure the entire field of view (FoV) and repeat this process many times per second. Thanks to its high measurement speed, mobile measurements can also be made by carrying the camera in hand. In addition, the use of LiDAR in robotic navigation, motion analysis, three-dimensional measurement, and deformation imaging has become widespread with the use of ToF cameras [12]. However, due to the laser-beam structure, ToF cameras are not suitable for outdoor surveys. This situation has led to the search for a new technique for measuring the LiDAR point clouds, and a flash LiDAR measurement technique was developed in the early 2000s.
Flash LiDAR cameras with imaging sensors in matrix form are used in navigation, security, mobile mapping, 3D modeling, and object tracking [13,14,15]. The use of a flash LiDAR camera is common, especially in the navigation of autonomous vehicles [16]. Thanks to its low weight and integrated use with the other sensors, flash cameras are also used in unmanned aerial vehicle (UAV)-based mobile mapping.
The single avalanche photodiode (APD) technique used in LiDAR photon imaging has turned into multiple APD sensors in a pixel array with flash LiDAR [17]. According to the working mode of the APD arrays, flash LiDAR has two types of APD array, namely the linear mode and the Geiger mode [18]. Geiger-mode LiDAR (GMLiDAR) allows LiDAR measurements to measure larger areas in a short time. Single-photon avalanche diode (SPAD), which is a different application of GMLiDAR and has been used for the last few years, enables high-density point measurement at a low energy level [19]. The laser photon imaging technique affects the LiDAR reflection intensity, measuring distance, accuracy, and point density. On the other hand, depending on the measurement technique, the energy requirement also changes.
When light encounters an obstacle with a refractive index different to the surrounding environment, it is scattered in various directions depending on polarization states and wavelengths. Thus, multispectral LiDAR offers the possibility to detect more information than traditional LiDAR in measurements [20,21].
The efficient and effective use of 3D LiDAR techniques requires knowledge of their technical features and limitations. This study introduces 3D LiDAR instruments and their point-cloud measurement methods.

2. 3D LiDAR Fundamentals

The basic principle of 3D LiDAR measurement is to determine the distance and direction of the measured scan point and record the information carried by the reflected beam by converting it into digital codes. The spatial information is expressed on a local instrument-centered coordinate system. The range can be estimated from known light speed and the ToF of the laser pulse using direct or indirect methods. In beam-guiding systems, the beam direction is expressed by the angles made between the horizontal and vertical planes of the defined instrumental reference system. In matrix imagers, the beam direction is determined by the pixel position and the focal length of the imaging lens. The measuring distance of the instrument to the object is defined as 1D, and 2D LiDAR is created by adding beam direction in a plane to measure data. By measuring the elevation angles, LiDAR provides 3D information about distance and location in a defined instrument-based x–y–z coordinate system, called 3D LiDAR. The aerial and ground-based mobile 3D LiDAR incorporates LiDAR sensors with position and navigation sensors such as GNSS and IMU to collect 3D point-cloud data quickly and accurately in motion.

2.1. Photon-to-Digital Conversation

An APD is used to convert light into electricity in LiDAR instruments. It is a p–n junction diode whose doping profile supports electric fields near the junction at operational bias [22,23]. APD is a highly sensitive semiconductor photodiode detector that exploits the photoelectric effect. The analog signal is converted to a measurement signal in digital form using an analog-to-digital converter (ADC). GMLiDAR, single-photon LiDAR (SPL), and conventional linear-mode LiDAR (LMLiDAR) use these general principles to obtain density measurement data.

2.2. LiDAR Measurement Data

The LiDAR instrument records the position of the measured points and the intensity of their returned light. The light intensity is highly dependent on surface reflectance properties. The color and material properties of the surface affect the intensity of reflected light. The high reflectance surface can be measured from a long distance. The LiDAR maximum measurement range is usually given by the reflectance ratio of the object surface. The range measurement accuracy is also proportional to the reflectance ratio of the emitted and backscattered.

2.3. LiDAR Multiple Returns

The LiDAR has multi-return properties that enable us to detect multi-depths in the same light direction. When a laser pulse is left away from the sensor, it gradually grows larger because of beam divergence. Any emitted laser pulse that encounters multiple reflection surfaces as it travels is split into many returns. A part of the light pulse will be reflected from the first surface and another part that has enough intensity to measure will be reflected from the surface behind it. This effect can occur multiple times in the same light direction. It is important to determine whether the measured value is part of the application or whether it should be discarded, e.g., due to a part falling across the field of vision. The receiver detector triggers when the incoming pulse reaches a set threshold, thus measuring the time of flight. The received laser pulse can be evaluated as measurement data in different manners, such as from the most significant return, from the first and last significant return, or from all returns which are above the threshold. For example, the Velodyne HDL-32E MBL records two return signals using the strongest and last signals. The measuring rate is 695,000 pts/s in the case of recording a single return signal, and 1,390,000 pts/s in the case of recording two return signals. The number of return signals to be recorded can be determined by the user. Many return signals increase the amount of measurement data and level of detail, but reduce the signal-to-noise ratio (SNR). On the other hand, it is useful to remove the errors caused by rain, snow, and dust in the FoV. Or, it is evaluated for height detection of trees, in aerial measurements [24]. Scanning LiDAR can use returns of up to five.

2.4. Pulse Repetition Frequency

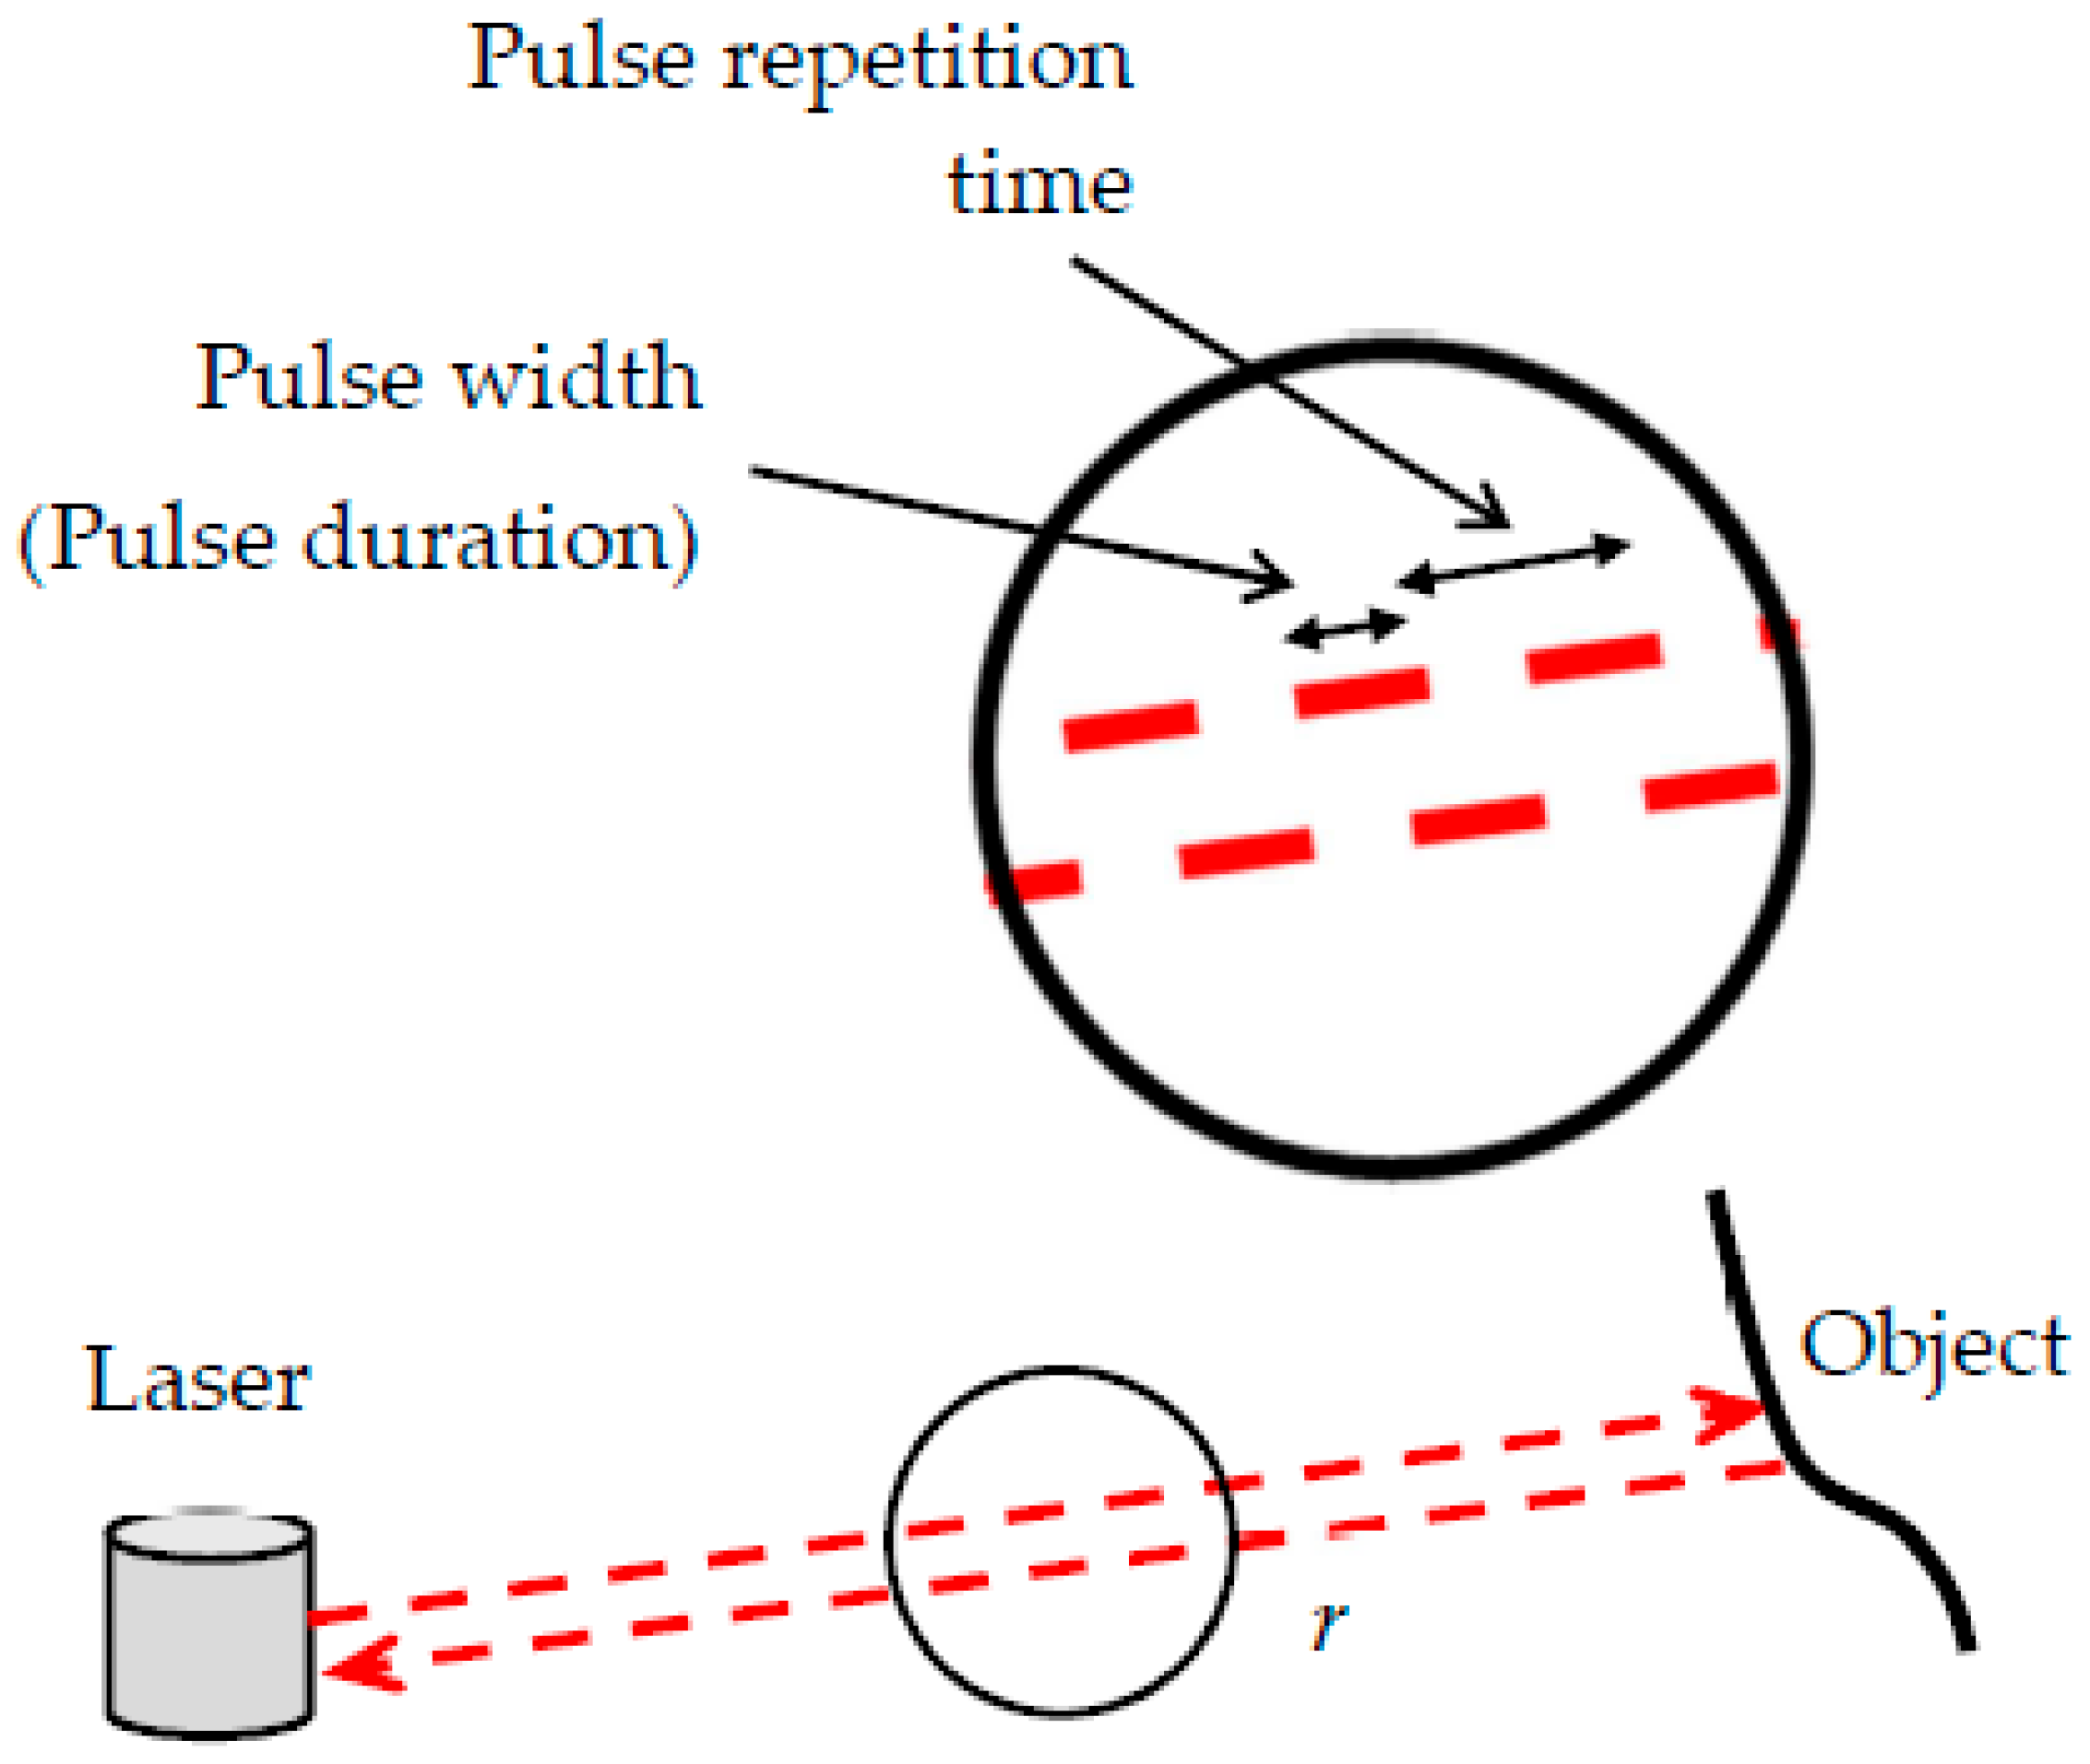
A laser pulse is a portion of the beam that has an energy level above a certain threshold. The time it takes to produce a laser pulse is called the pulse duration (pulse width). Pulse duration is the time interval during the first transition when the intensity of the pulse reaches a specified level of its final amplitude, and the time the pulse intensity falls, on the last transition, to the same level. The interval between two times of maximum effect (or minimum effect) of a signal characteristic that varies regularly with time is called the jitter period. The small jitter interval has a significant impact on increasing the range accuracy.
The number of pulses must be increased to a high repeating frequency of the measurement. This is possible by increasing the speed of electronic signal processing circuits but increases the cost of the measuring instrument. The number of pulses that are transmitted per second is called the pulse repetition frequency (PRF) of the LiDAR system. The time between the beginning of one pulse and the start of the next pulse is called pulse repetition time (PRT), and the relationship between PRT and PRF is expressed as PRT = 1/PRF. If the receiving time ends before the next emitting pulse, the result is a dead time. Since the signal cannot be received during the dead time, there is an indefinite time interval that affects the size of selectable details.

2.5. Discrete and Full-Waveform LiDAR

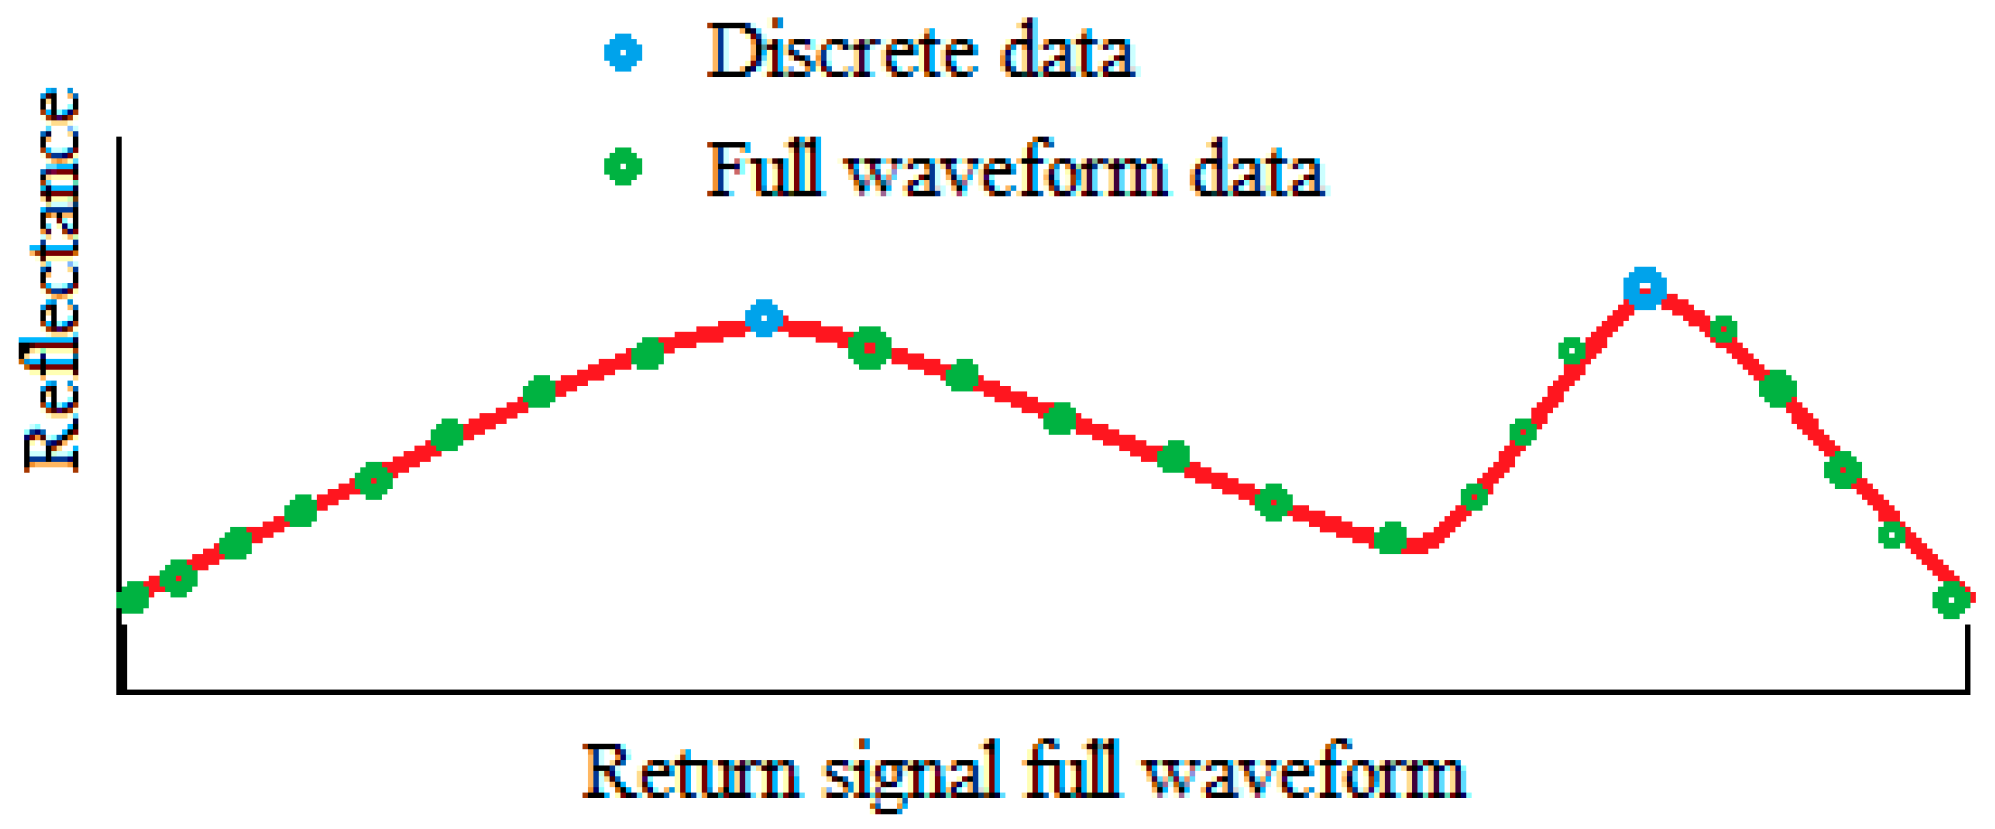
LiDAR records the energy of the return signal. The reflectance calculated from the energy of the return signal is important to understand and separate the surface properties. A record of a waveform or continuous distribution of light energy is related to the level of detail expected from signals returning to the LiDAR sensor. The return signal may be recorded in two ways, such as discrete or full waveforms.
A discrete LiDAR system records individual return points for the peaks in the waveform curve. It takes as a measurement peak points in the waveform curve. The peak points are called returns. Five or more returns can be recorded from each laser pulse in discrete systems. A full-waveform LiDAR records a distribution of return energy in the continuous waveform (Figure 2). Thanks to these, it includes more information than discrete LiDAR. However, it is more complex to process full-waveform records. The full-waveform measurement data could have large noise and low SNR. Full-waveform LiDAR is more useful than discrete LiDAR for characterizing vegetation and investigating forests [25,26].

2.6. Multispectral LiDAR

Multispectral LiDAR allows more spatial information and reflectance values to be recorded from the image area in the same measuring operation. The reflection intensities of laser beams at different wavelengths will also be different for the surfaces. In this way, more information can be obtained about the entire surface. If three different wavelengths are used, three point-cloud measurements are performed simultaneously. Multispectral LiDAR is useful for water depth and topography mapping, vegetation, and forestry applications. Their measurement data especially provides greater accuracy in the classification and segmentation of image area details [27]. In particular, different plant species can be detected from multispectral LiDAR data [21]. Optech Titan commercial multispectral LiDAR incorporates three independent laser wavelengths into a single sensor with beams at 532, 1064, and 1550 nm.

3. LiDAR Range Measurement

3.1. Pulse-Time Range Measurement

When the laser pulse is emitted from the instrument, it hits the object’s surface. The backscattered light reflected from the object’s surface is recorded by the instrument (Figure 3). The distance between the instrument and the object point is estimated using the known light traveling time in Equation (1).
r = 1 2 c Δ t
  • r: Measured distance
  • c: Light speed
  • Δt: Round trip time-of-flight
Since the laser beam travels twice the distance between the instrument and the scanning object point, the distance is calculated by dividing two of the flight time. In Equation (1), c is the speed of light in space. However, the measuring light interacts with different air environments in terms of temperature, pressure, and particles during travel. These effects decrease the accuracy of the distance measured. The SNR is low at long distances. Because the interaction between an object and air reduces the energy of a laser beam, the energy of the returned light will be lower than the emitted. Thus, measuring long distances requires higher energy than shorter ones. The pulse method is proper for long-distance measurement.

3.2. Phase-Shift Range Measurement

Since the laser beam is highly affected by weather conditions, the measurement signal is modulated with a carrier wave for high accuracy. Frequency modulation continuous wave (FMCW) and amplitude modulation continuous wave (AMCW) are commonly used in this measurement. The distance is measured by the phase difference modulation in an indirect time-of-flight method.
The frequency of the carrier wave is periodically increased and decreased to match the wave motion of the measuring beam in the FMCW method. The phase difference is determined by comparing the emitted and received return signals. If the instrument and object measured are fixed, a single or multi-frequencies can be applied to estimate the residual wavelength [15]. In this case, since the instantaneous frequency corresponding to the wavelength is variable, the frequency value in the residual portion will be proportional to the round ToF (Δt). The Δt is expressed by Equation (2).
Δ t = ( N c + Δ φ 2 π ) T
  • Δt: Round trip time-of-flight
  • Nc: Number of full wavelengths
  • T: Period
  • Δφ: Faz angle
Nc is determined using modulation waves at various wavelengths. The distance (Δr) corresponding to the phase angle is calculated by Equation (3).
Δ r = c Δ φ 4 π T = c Δ φ 4 π   ·   1 f m o d
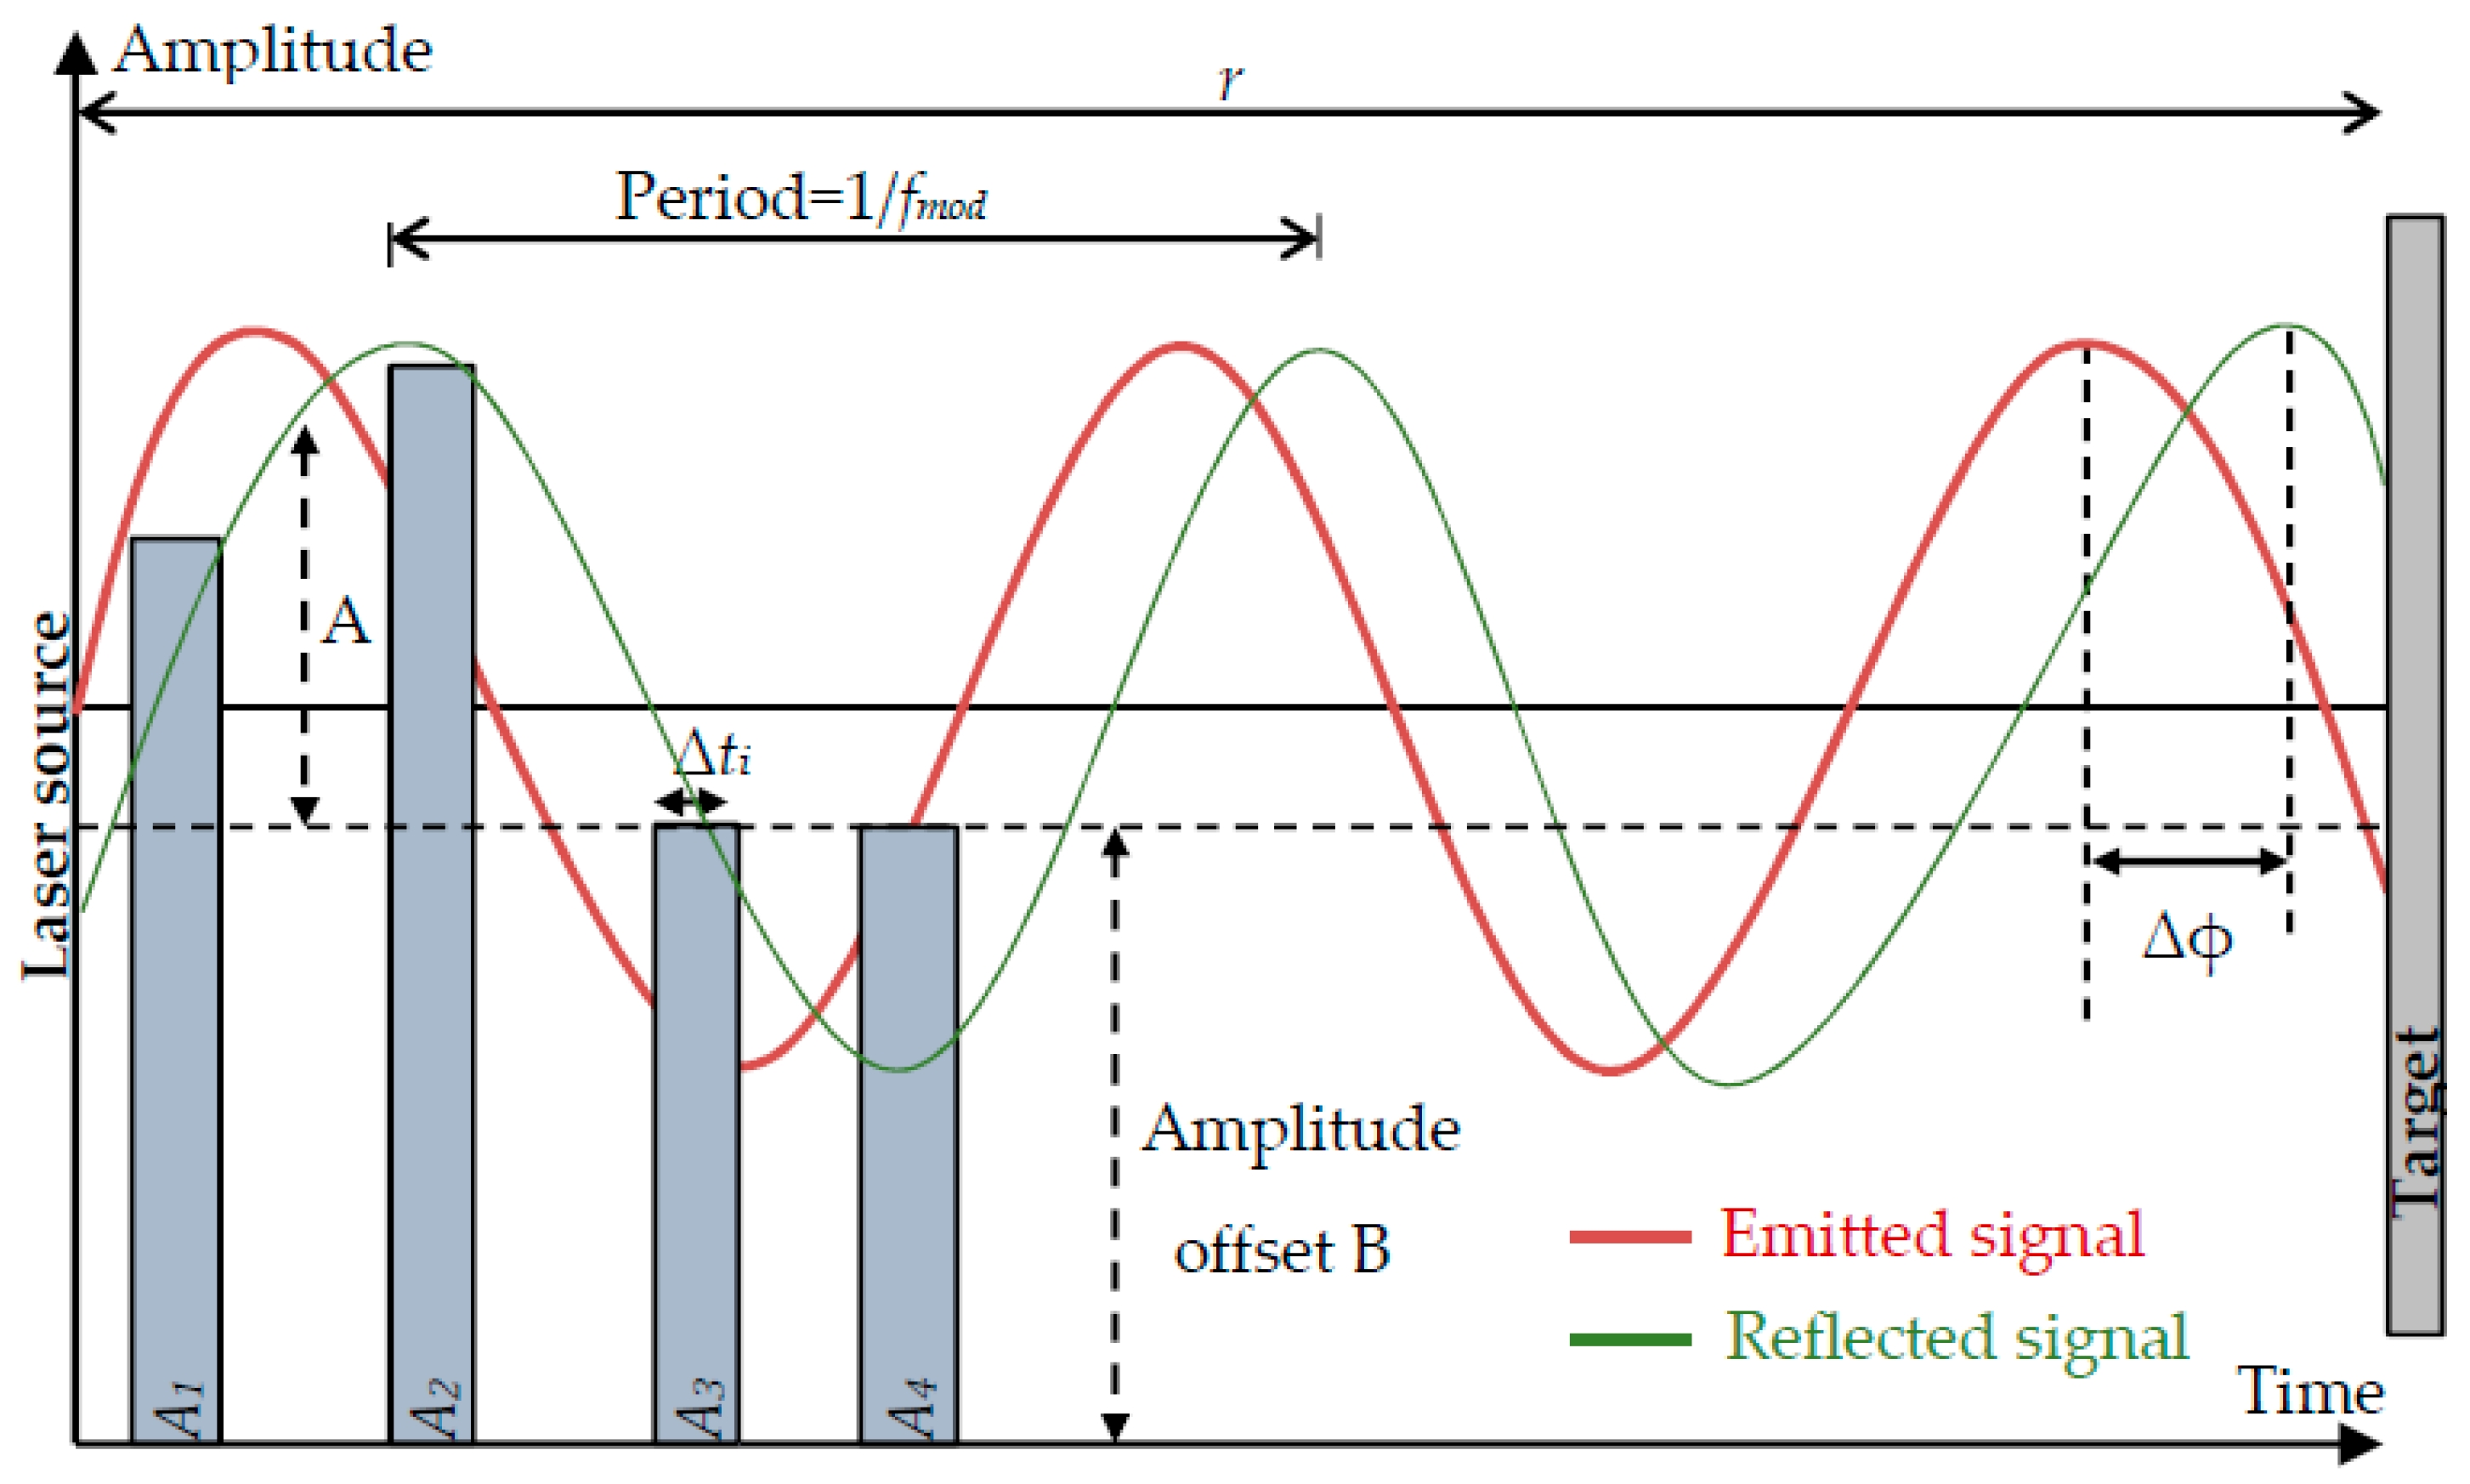
The residual phase angle is estimated by the cross-correlation of the amplitudes (A) of emitted and received signals at four different regions of the wavelength at a differential time interval (Δti) in the AMCW method. (Figure 4). Accordingly, the phase angle corresponding to the residual wavelength is calculated by Equation (4) [28,29].
Δ φ = arctan ( A 1 A 3 A 2 A 4 )
The phase-shift method removes the measurement uncertainty to a certain level. Increasing the frequency reduces the distance uncertainty corresponding to the phase angle. Another way to increase distance accuracy is to increase the integration time (IT). IT should be at a proper level to obtain enough accurate measurements. A high IT increases the measurement period to provide sufficient measurement accuracy [30]. On the other hand, it reduces the measurement speed. The AMCW phase shift can be applied when the returning signal has a certain strength and the SNR reaches a certain value. For this reason, the measuring distance is shorter than the FMCW and pulse methods so that the intensity of the signals does not fall below a certain value.

4. LiDAR Photon Imaging

4.1. Linear-Mode LiDAR

LMLiDAR is also called LMAPD, multi-photon LiDAR, or conventional LiDAR. The backscattered signal is received by a single APD detector. LMAPD requires at least 250 or more photon records for distance measurement [31,32]. Thus, it has a low measurement speed (30 Hz). An increase in the number of photons reduces the effect of distortion on measurement accuracy. The laser pulse width of a multi-photon LiDAR is equivalent to 1–5 ns in range. Their jitter-ranging precision is 50–500 ps [31]. LMAPD requires high energy to measure longer distances at high accuracy, and it depends on technological developments. In addition, a fiber laser is used in the beam source for high-speed measurement with LMAPD.
LMAPD requires more energy than GMAPD to obtain 3D data of similar size from the same distance. LMAPD measurement data includes distance and reflectance values. Achievable point density depends on the laser pulse repetition rate.

4.2. Geiger-Mode LiDAR

A single large aperture divergent laser pulse is emitted to the FoV in the GMLiDAR. The reflected signal is received by focal plane array sensors which are named GMAPD. GMAPD has a combination of advantages over other photon-counting technologies. Each cell of the matrix-shaped sensor has a single photon-sensitive receiver to estimate the range of the reflected object points. Photon recording of the cells is maintained until no further echo can be measured from the same laser pulse. If it is carried out, the photon recording is stopped by photodiode triggers, and the range is estimated via the time to the digital converter (TDC). Then, the GMAPD array resets the operation for the photon records of a subsequent laser pulse.
GMAPD has a high measurement rate (10–200 kHz frame rate). This measuring speed allows mobile mapping with a low-level energy laser beam. Thanks to the high measuring speed, large areas can be measured at a low cost. GMAPD records range data only, without the intensity. The intensity values are calculated by statistical analysis. Possible delays with short time intervals in measurement direction should be taken into account to reduce measurement errors in mobile measurements [33]. The negative effect of GMLiDAR on human health is very low [34,35].
GMAPD calculates the distance by counting the received photons and statistical evaluation. A distance can be calculated for a single photon or even for very weak signals. The high sensitivity of pixels to photons will increase the measurement speed while expending low energy. The high measuring speed causes a density in the read-out units and data process. This density is quite high compared to the LMAPD method.

4.3. Single-Photon LiDAR (SPL)

Single-photon avalanche detectors or single-photon avalanche diodes (SPADs) are a variation of GMAPD. SPL is executed by multiplying a single laser line into grid 10 × 10 sub-beams (beamlets) by a diffractive optical element [36]. The footprints of the 100 beamlets do not overlap on the ground. The backscattered signal is received by an individual detector which is aligned to the beamlet laser direction. The detectors consist of a matrix array of single-photon sensitive cells operating in Geiger mode. The possible implementations include microchannel plate photomultiplier tubes (MCP-PMT) or silicon photomultipliers (SiPM) [22,37]. SPAD utilizes a very short laser pulse (duration is 400 ps). The very low jitter of the detector element is specified at 50–100 ps, which has a positive impact on the ranging accuracy. In addition, it has a low recovery time, such as 1.6 ns [31].
The beamlets do not provide more subsampling as different from GMLiDAR, but rather provide a cumulative signal at the detector’s output. Some cells of the array respond to closer targets, while others trigger later at more distant targets. This gives the possibility of multiple targets such as vegetation and ground. Each beamlet detector acts as an avalanche photo diode (APD) operated in linear mode. In contrast to GMLiDAR, the cumulative signal intensity can be measured but its radiometric resolution is less compared to multi-photon LMAPDs [36,38]. Thanks to single-photon sensitivity, in aerial measurement, SPL enables higher altitude than GMLiDAR and consequently larger area measurement compared to conventional LiDAR. SPL-APD enables higher frame rates than LMAPD.

5. LiDAR 3D Point-Cloud Acquisition Techniques

5.1. Laser Scanning

Laser scanning is the process of collecting spatial data in the form of a series of points from the entire FoV by directing single or multiple beams. The measurement data are in the form of a point cloud where the points usually have an inhomogeneous distribution. The laser scanners are collected in five groups such as TLS, solid-state LiDAR scanners, multi-beam LiDAR, multi-layer LiDAR, and rotating 2D LiDAR. The solid-state LiDAR scanners have microelectromechanical (MEMS) and optical phased array (OPA) techniques [39]. The laser scanning methods were explained in detail in the following subsections.

5.1.1. Terrestrial Laser Scanner

The TLS is a mechanical scanner that collects spatial data from the FoV with the orientation of a single laser beam. The laser beam is directed by a galvanometer or rotating mirror in TLS. 3D coordinates (x, y, z) of the scan points are calculated from the instrument-centered polar coordinates measured. In addition, the reflection intensity (I) of the returning beam is measured and recorded for each scanning point. The color record for the scan points is applied from the in-built camera images. Pulse or phase-shift methods are used for distance measurement. Scanners using the pulse method can measure up to 6 km and are more suitable for surveying land topography. In scanners using the phase difference method, the measuring distance is about 800 m, but the accuracy is higher than in the pulse method. The range measurement accuracy of the pulse method is 5–8 cm at 1 km, and around 1 cm in the phase difference method. The measuring speed of instruments using the phase difference method is higher than the pulse time (Table 1).
The beam deflection unit may consist of either two scanning mirrors or one rotating mirror which has a polygonal or flat shape. The scanning principle changes according to the beam deflection unit. The frame scanner, which has a fixed scanning head, uses two scanning mirrors, and measures points as rows or columns. They have limited FoV e.g., 40° × 40°. Hybrid scanners use an oscillating or rotating polygonal mirror for beam deflection. They have horizontal FoV of 360° and limited vertical FoV such as 60° (e.g., RIEGL VZ-4000). The panoramic scanner uses a flat rotating mirror. They have 360° horizontal FoV and around 320° vertical FoV (e.g., Z + F IMAGER 5006). They are proper at scanning indoors since the whole space around the scanner can be captured from a single station. They are typically used in phase shift to range measurements [40].
Laser scanners contain many mechanical parts that must be compiled in accordance with the mathematical model, but it is very difficult to overcome this. Therefore, these scanners contain measurement errors caused by the structure of the system and must be protected against vibrations. It is, therefore, only suitable for static measurements. Solid-state LiDAR and MBL scanners have been developed to overcome their disadvantages in scanning. The traditional aerial LMLiDAR is similar to mechanical scanners, and scanning is carried out by directing a single laser beam. However, since the measuring platform is mobile, positioning is carried out using GPS and IMU components.

5.1.2. Solid-State LiDAR Scanners

A solid-state LiDAR has the properties of a solid-state camera and line scanners. The FoV 3D data are scanned by an oriented LiDAR beam. More recent examples of solid-state LiDAR sensors incorporate technologies such as MEMS or beam steering that can manipulate the laser beam to scan a much wider FoV than a typical ToF sensor. In similar cases, these LiDAR sensors can capture up to a 270° horizontal FoV. These solid-state sensors have no or fewer moving parts, which makes them less expensive and more reliable than a typical mechanical scanning LiDAR sensor (Table 2).
The scan light is oriented by a micro-dimensional mirror, in the MEMS scanner. The mirrors can be oriented in two axes as perpendicular with pre-programmed electronic signals. The tilt angle of the mirror varies when applying a signal, so the emitted light beam is modified to measure a specific point in the scene. In this way, the beam is directed so that the image area is scanned. Due to the structure of the system, these mirrors may be subject to deformation in static or working conditions. The design of such a scanner is based on scanning area size, measuring distance, power consumption, and measuring speed [41]. The measuring distance is short. MEMS scanners are used in automotive, machine vision, and laser microscopes. Hamamatsu Corporation [42] and Mirrorcle Technologies [43] are producing MEMS which have different configurations.
OPAs are an emerging technology made of arrays of closely spaced (about 1 µm) optical antennas that radiate coherent light in a broad angular range. The laser beam is sent by splitting into micro-wavelength rays. The beam is steered by the microwave arrays controlling the relationship between the receiving antenna arrays by balancing them. Pulse time or FMCW methods are used for distance measurement. Ambient light can reduce the SNR and cause false detections in ToF ranging. Thus, the FMCW method has high accuracy in range detection. OPA is a fast scanning technique. OPA scanners are solid-state, which have no or fewer moving parts, and are unaffected by vibrations. OPA components are based on mechanical control, such as motor-driven rotating collimation mirrors. The mechanical beam steering provides high efficiency and a relatively large scanning angle, through mechanically moving parts such as gimbals. The bulky mechanical steering approach is less preferred due to acceleration, temperature, and vibration [44].
OPA technology enables very fast scanning (100 kHz) with low beam divergence and a wide FoV angle. A high-power and low-divergence beam is needed to accurately resolve a scene. Detecting a 10 cm object at a 100 m distance away requires an OPA steering at a wavelength of 1 µm with a circuit consisting of at least 1000 antennas, each spaced 1 µm apart. The OPA scanning provides a highly reliable and cost-effective 3D LiDAR solution that is important for the automotive industry. It has also been used for mobile mapping by ground vehicles or UAVs.
The OPA can be implemented in the visible, near-infrared, and mid-infrared spectral ranges. The main performance parameters of an OPA scanner are FoV, beam width, modulation speed, power consumption, and scalability.

5.1.3. Multi-Beam LiDAR (MBL)

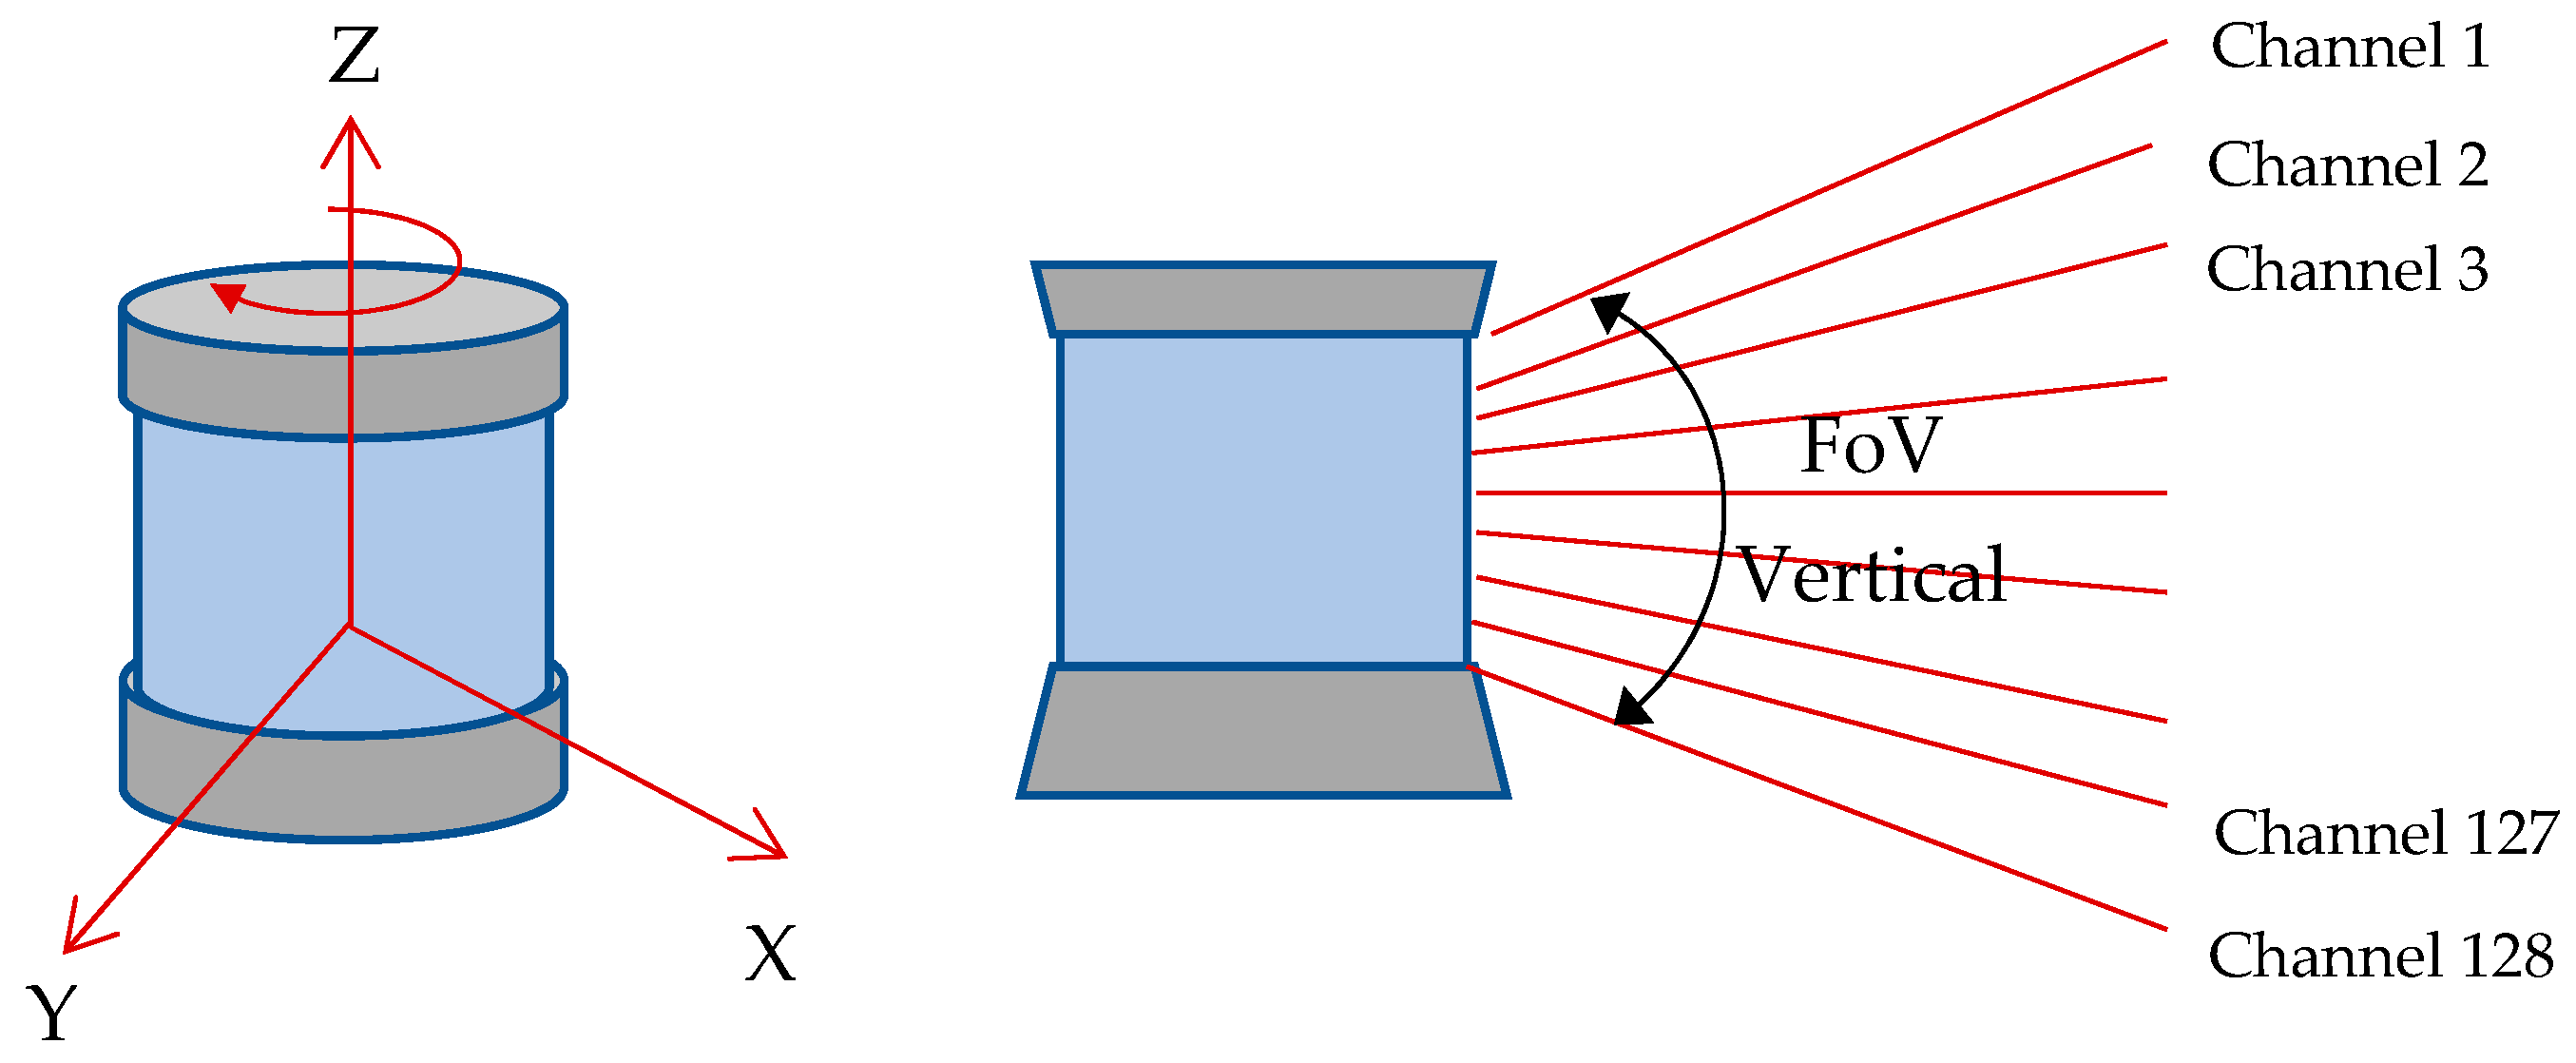
The 3D scan is made with a 2D laser plane formed by the flash LiDAR sensor, which consists of n pixels (channels) along a line (Figure 5). It can also be called a hybrid LiDAR instrument that includes a pixel array and moving parts. The distribution of LiDAR beams over the scene is realized by a spinning mirror [45]. Multiple beams are emitted simultaneously, and single or multiple returns are captured. The mirrors may spin in a rotating way at a 360-degree angle (Table 3). These spinning devices have moving mechanical parts and thus affect the quality of the measured point cloud. Furthermore, calibration is continuously required, leading to higher surveying costs. These scanners are compact with very few parts and low on energy. The main factor influencing productivity is the number of laser beams (channel) emitted simultaneously; the maximum number of beams is 128, currently.
MBL is little affected by vibrations. It is widely used in robot navigation, driverless vehicle navigation, and mobile mapping. A wider FoV combined with a long range, high output rate, and better range accuracy will always be significant when selecting the most suitable LiDAR device for a mobile mapping system [46,47].

5.1.4. Multi-Layer LiDAR

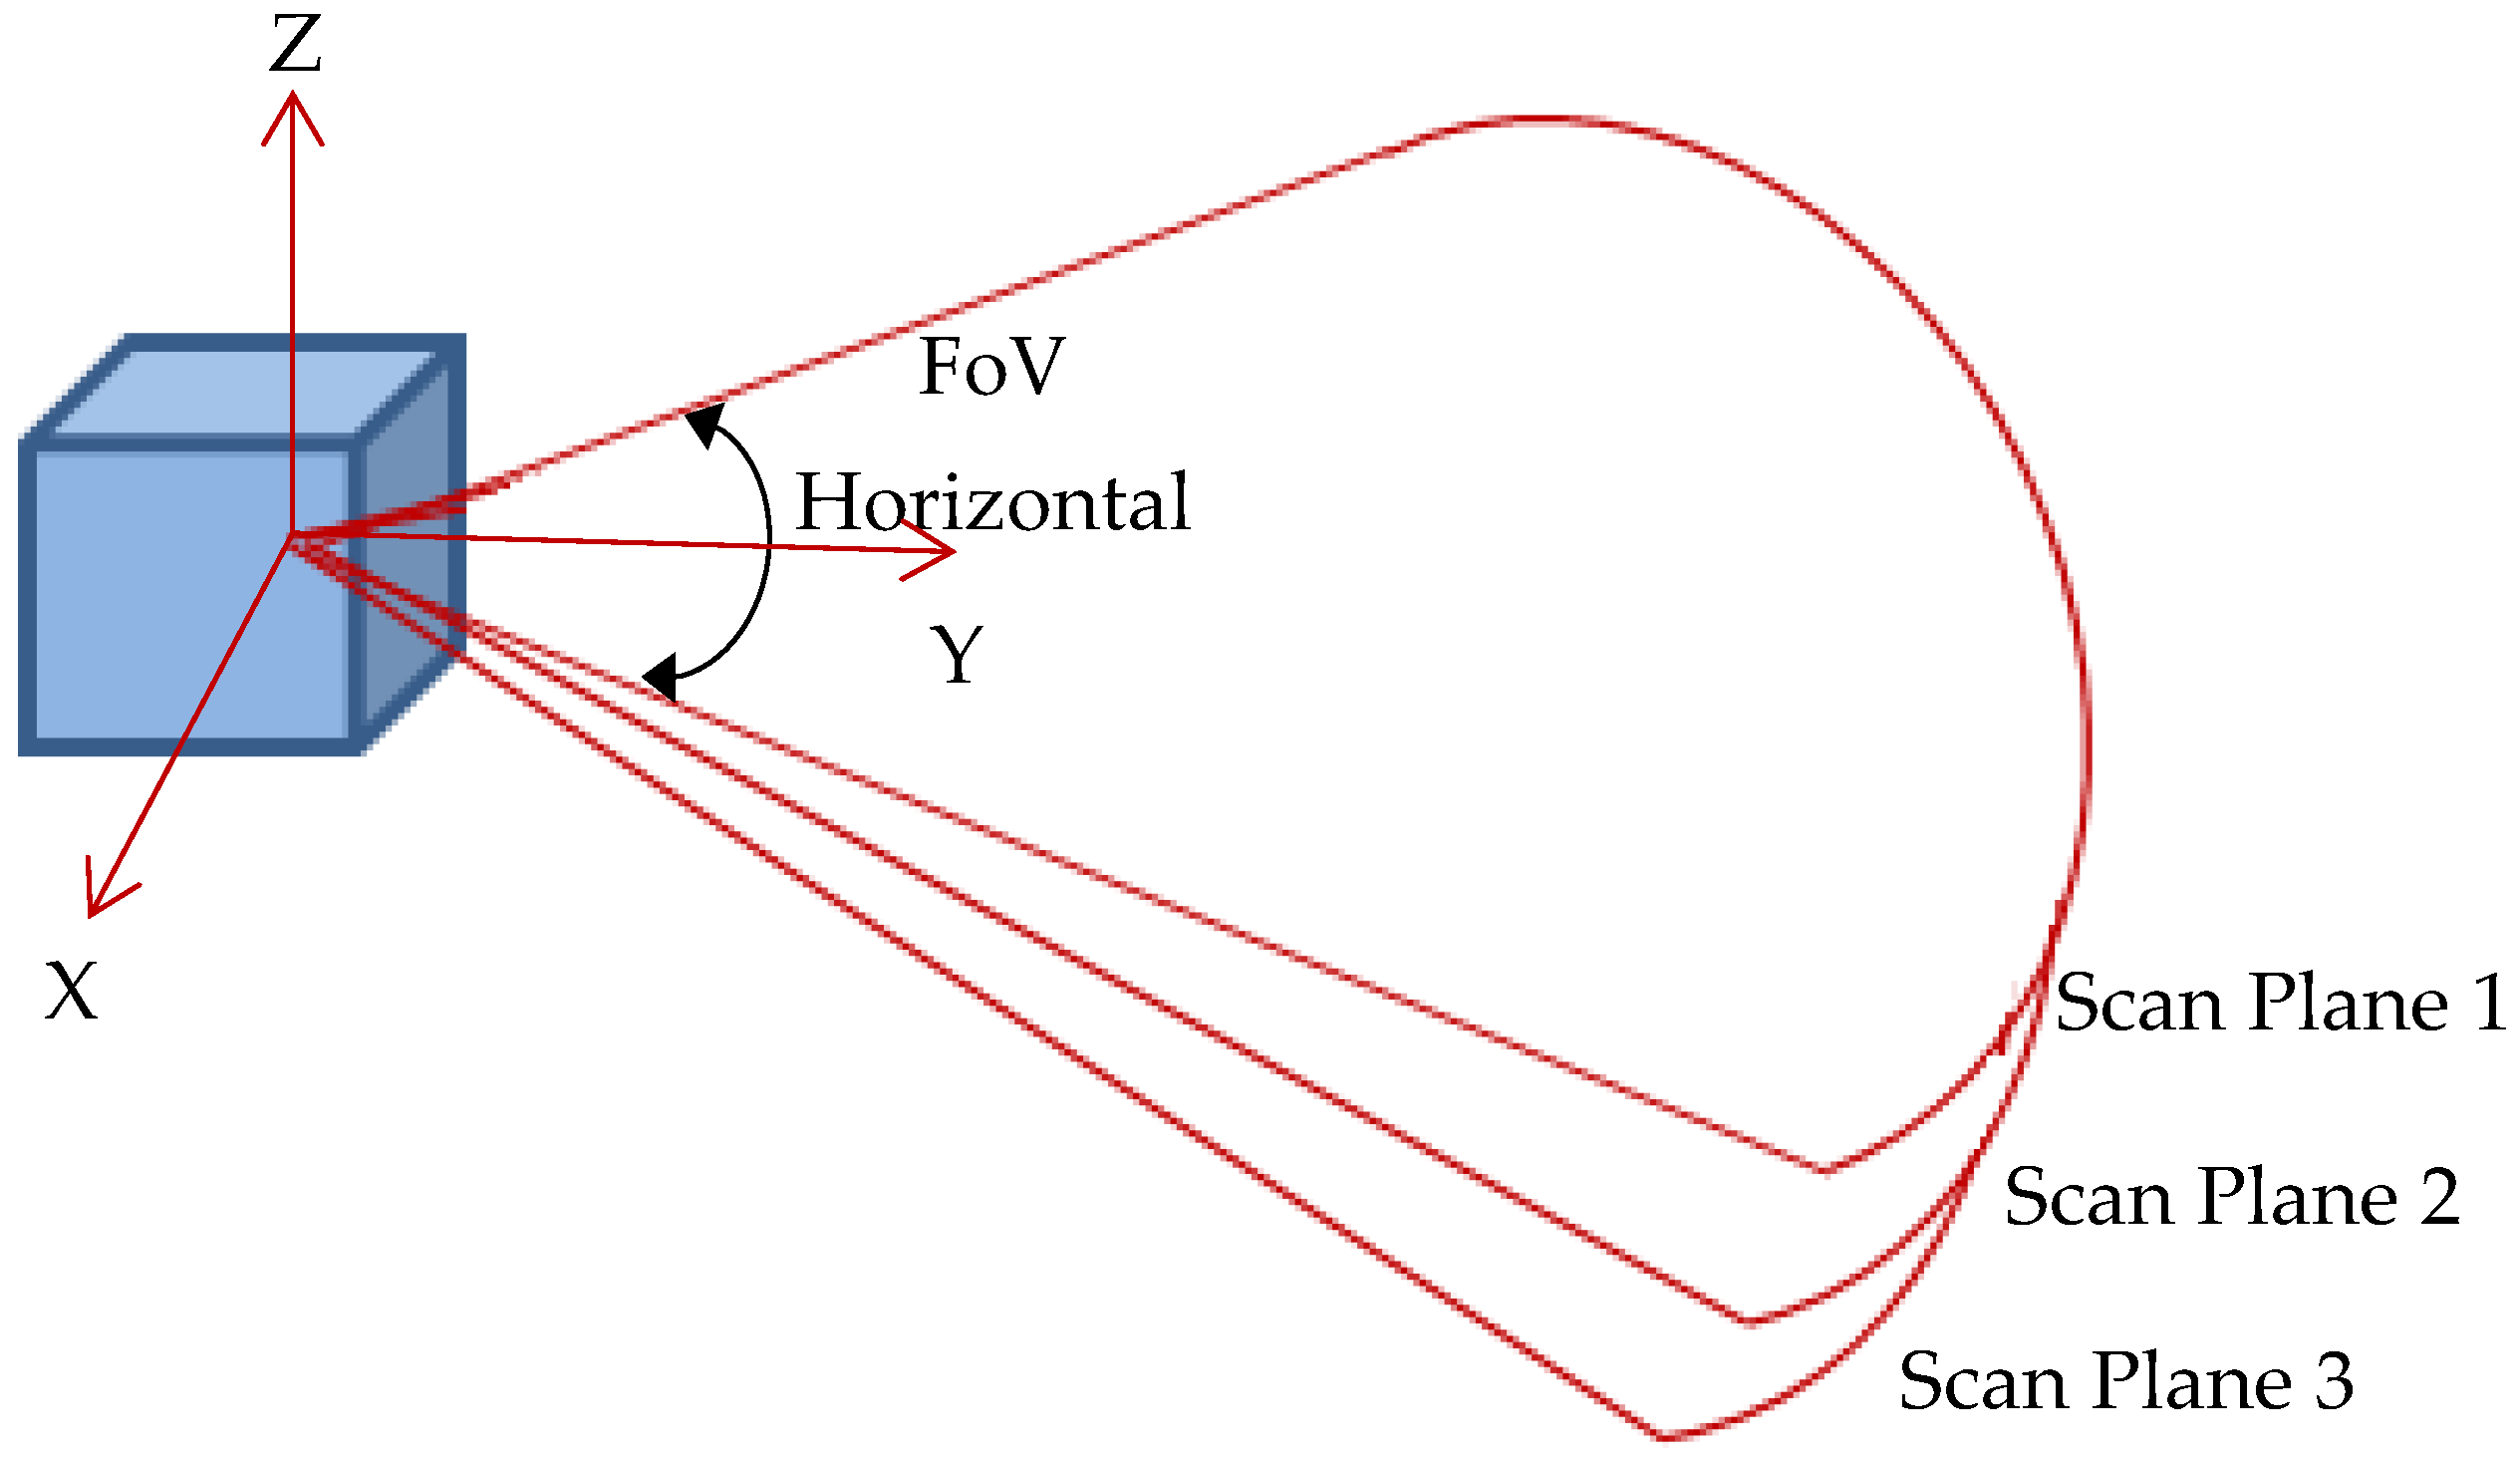
Using multiple senders or receivers, or a combination of both, multi-layer LiDAR can be produced with the capacity to scan multiple planes simultaneously or at offset angles (Figure 6). This means that the sensors of device generation, in addition to the horizontal 2D plane (which is the 0° plane in a horizontally positioned sensor), can scan further planes tilted up or down [48]. Additional information must also be collected on distance, angle at the horizontal level, and angle at the different levels of the three-dimensional space (Table 4). Using these three spatial coordinates, the positions of a measured point can be determined with XYZ in the local coordinate system.
Multi-layer systems are available in a range of different designs. In the MRS1000, the internal emitter and receiver modules are tilted to achieve tilted planes. The MRS6000 uses a polygon mirror to reflect the light [49]. The mirror allocates multiple senders one over the other. This is an alternative principle used to generate more measuring levels with a single scanner.

5.1.5. Rotating 2D LiDAR

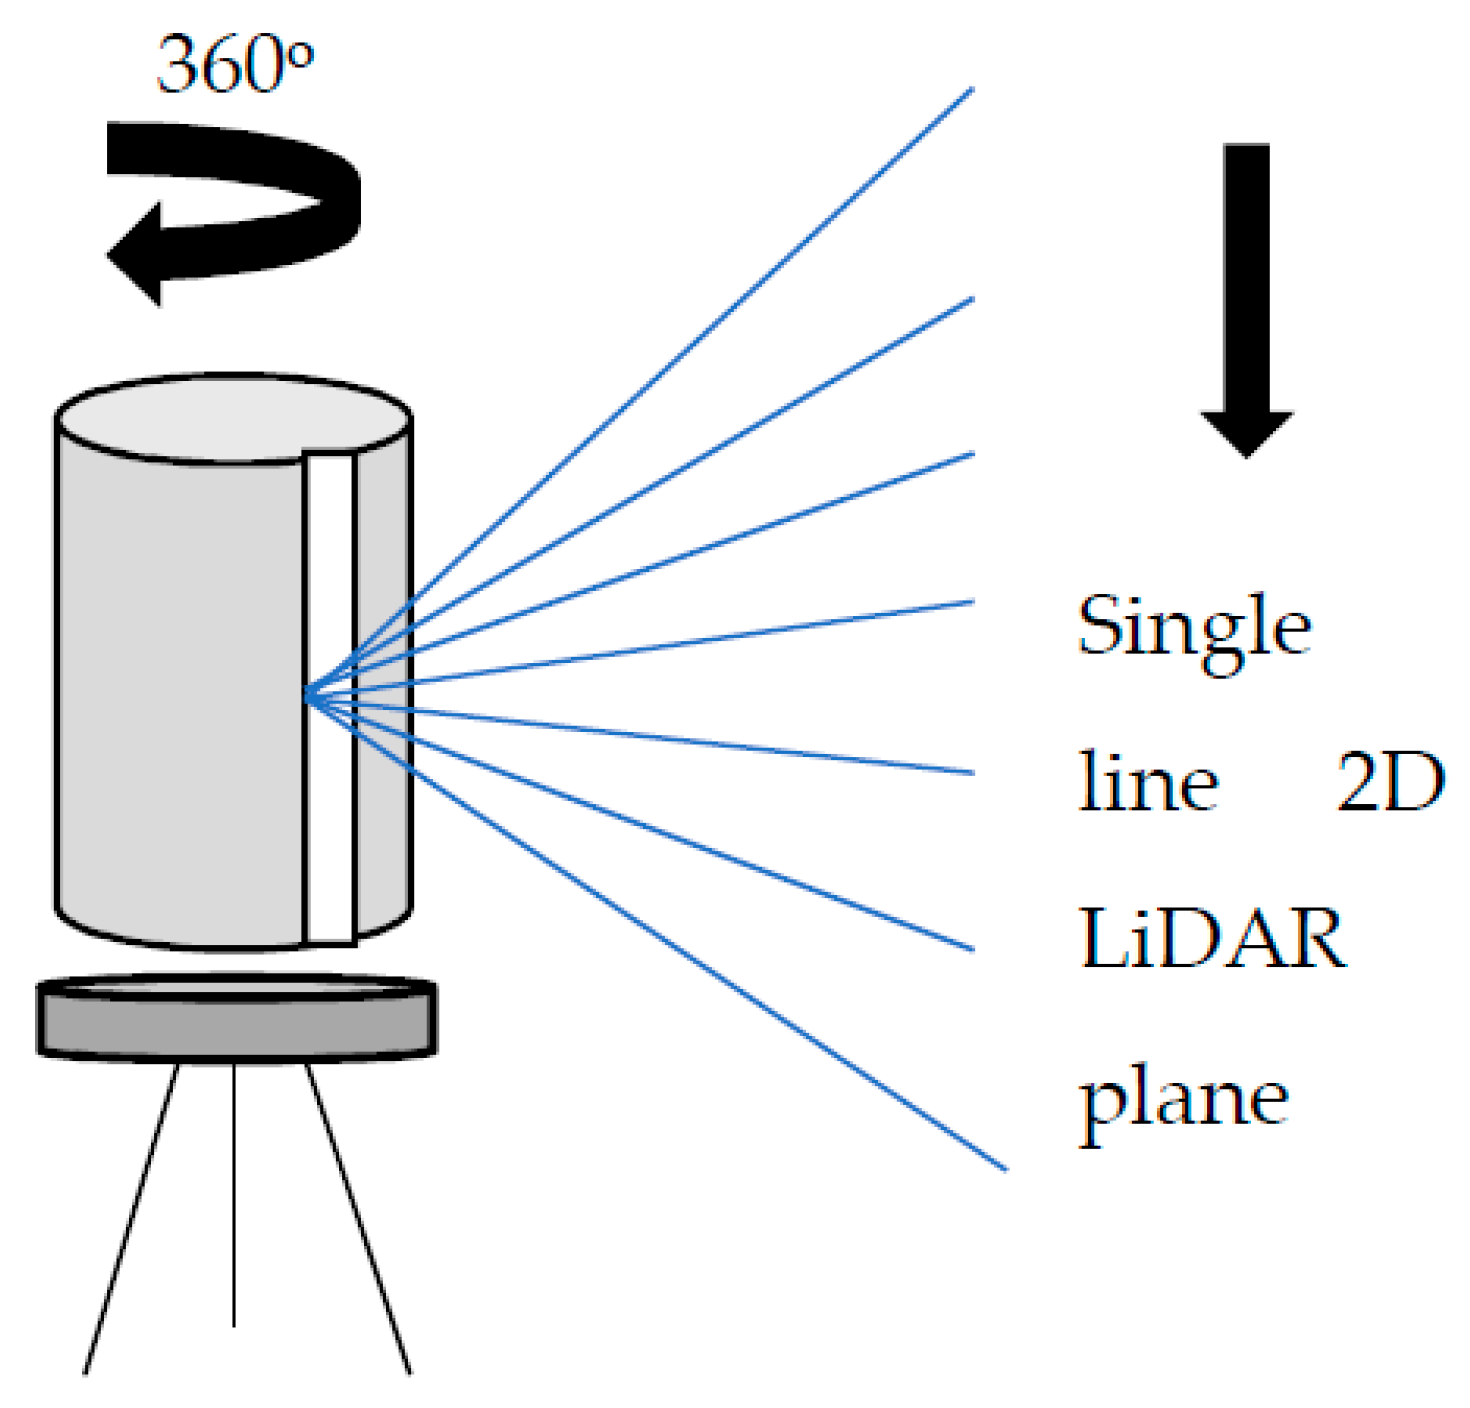
A single line 2D LiDAR generates 3D LiDAR by rotating 360 degrees perpendicular to the scan plane. The rotation makes it possible to capture 3D scan data with a particular FoV around them. The scanning may be continuous or delimited by pre-set azimuth start and stop angles as different from MBL (Figure 7). They can be used on stationary or mobile platforms. The line spacing and slope are determined by pre-defined parameters which are azimuth start and stop points, rotation angle, and scan speeds. They are proper for vehicle navigation, obstacle detection, forest investigation, and airborne mapping (Table 5).

5.2. Solid-State LiDAR Camera

In a solid-state camera, simultaneous beams are sent from an optical light source in response to the camera pixels. The light backscattered from the object is recorded by a sensor array in matrix form. Unlike the laser scanning method, the object points in the entire FoV are measured simultaneously. The measurement is performed at the video rate, so mobile measurements can be made. The distance is measured by the pulse or phase-shift method (AMCW or FMCW). AMCW is usually used in ToF cameras [50]. The 3D flash LiDAR camera uses direct time of flight to measure.
Solid-state LiDAR cameras have no moving parts and are therefore unaffected by vibrations. This makes them less expensive and more reliable than a typical scanning LiDAR sensor. They cannot capture panoramic data such as a scanning LiDAR. They are suitable to use on mobile platforms such as cars, mobile robots, and industrial production lines.

5.2.1. ToF Camera (AMCW)

The light reflected from the object’s surface is recorded in the matrix array pixels. The distances corresponding to the pixels are measured by the phase-shift AMCW of the returning signal. The image is created according to the pinhole camera model. The measuring distance is a maximum of 10 m. It uses different modulation frequencies (15–30 MHz) at near-infrared wavelength, and the measurement speed is 60 fps and more (Table 6). The sunlight causes extra reflection on the image sensor of the camera, and reduces the SNR. Therefore, it is not suitable for outside measurements. It is used in mobile robots, game consoles, and computer vision applications in indoor areas.
The most important parameter affecting the measurement accuracy of the ToF camera is the IT value. IT is the exposure time to the light for the camera pixels. For high measurement accuracy, IT should be near its ideal value. The ideal value of IT varies depending on the illumination of the environment, the reflection rate of the surface, and the measuring distance. The range accuracy (σ) of the ToF camera is given by Equation (5).
σ = c 4 2 π f m o d · A + B c d A
Here, A is the amplitude, and B is the amplitude offset (Figure 3). cd is the modulation constant that expresses how well the camera sensor can collect electrons [29]. According to Equation (4), if the light reflectance ratio of the surface is high, the measurement accuracy will also be high. Another factor affecting the measurement accuracy is the modulation frequency (fmod). The higher modulation frequency makes the higher accuracy.

5.2.2. 3D Flash LiDAR Camera

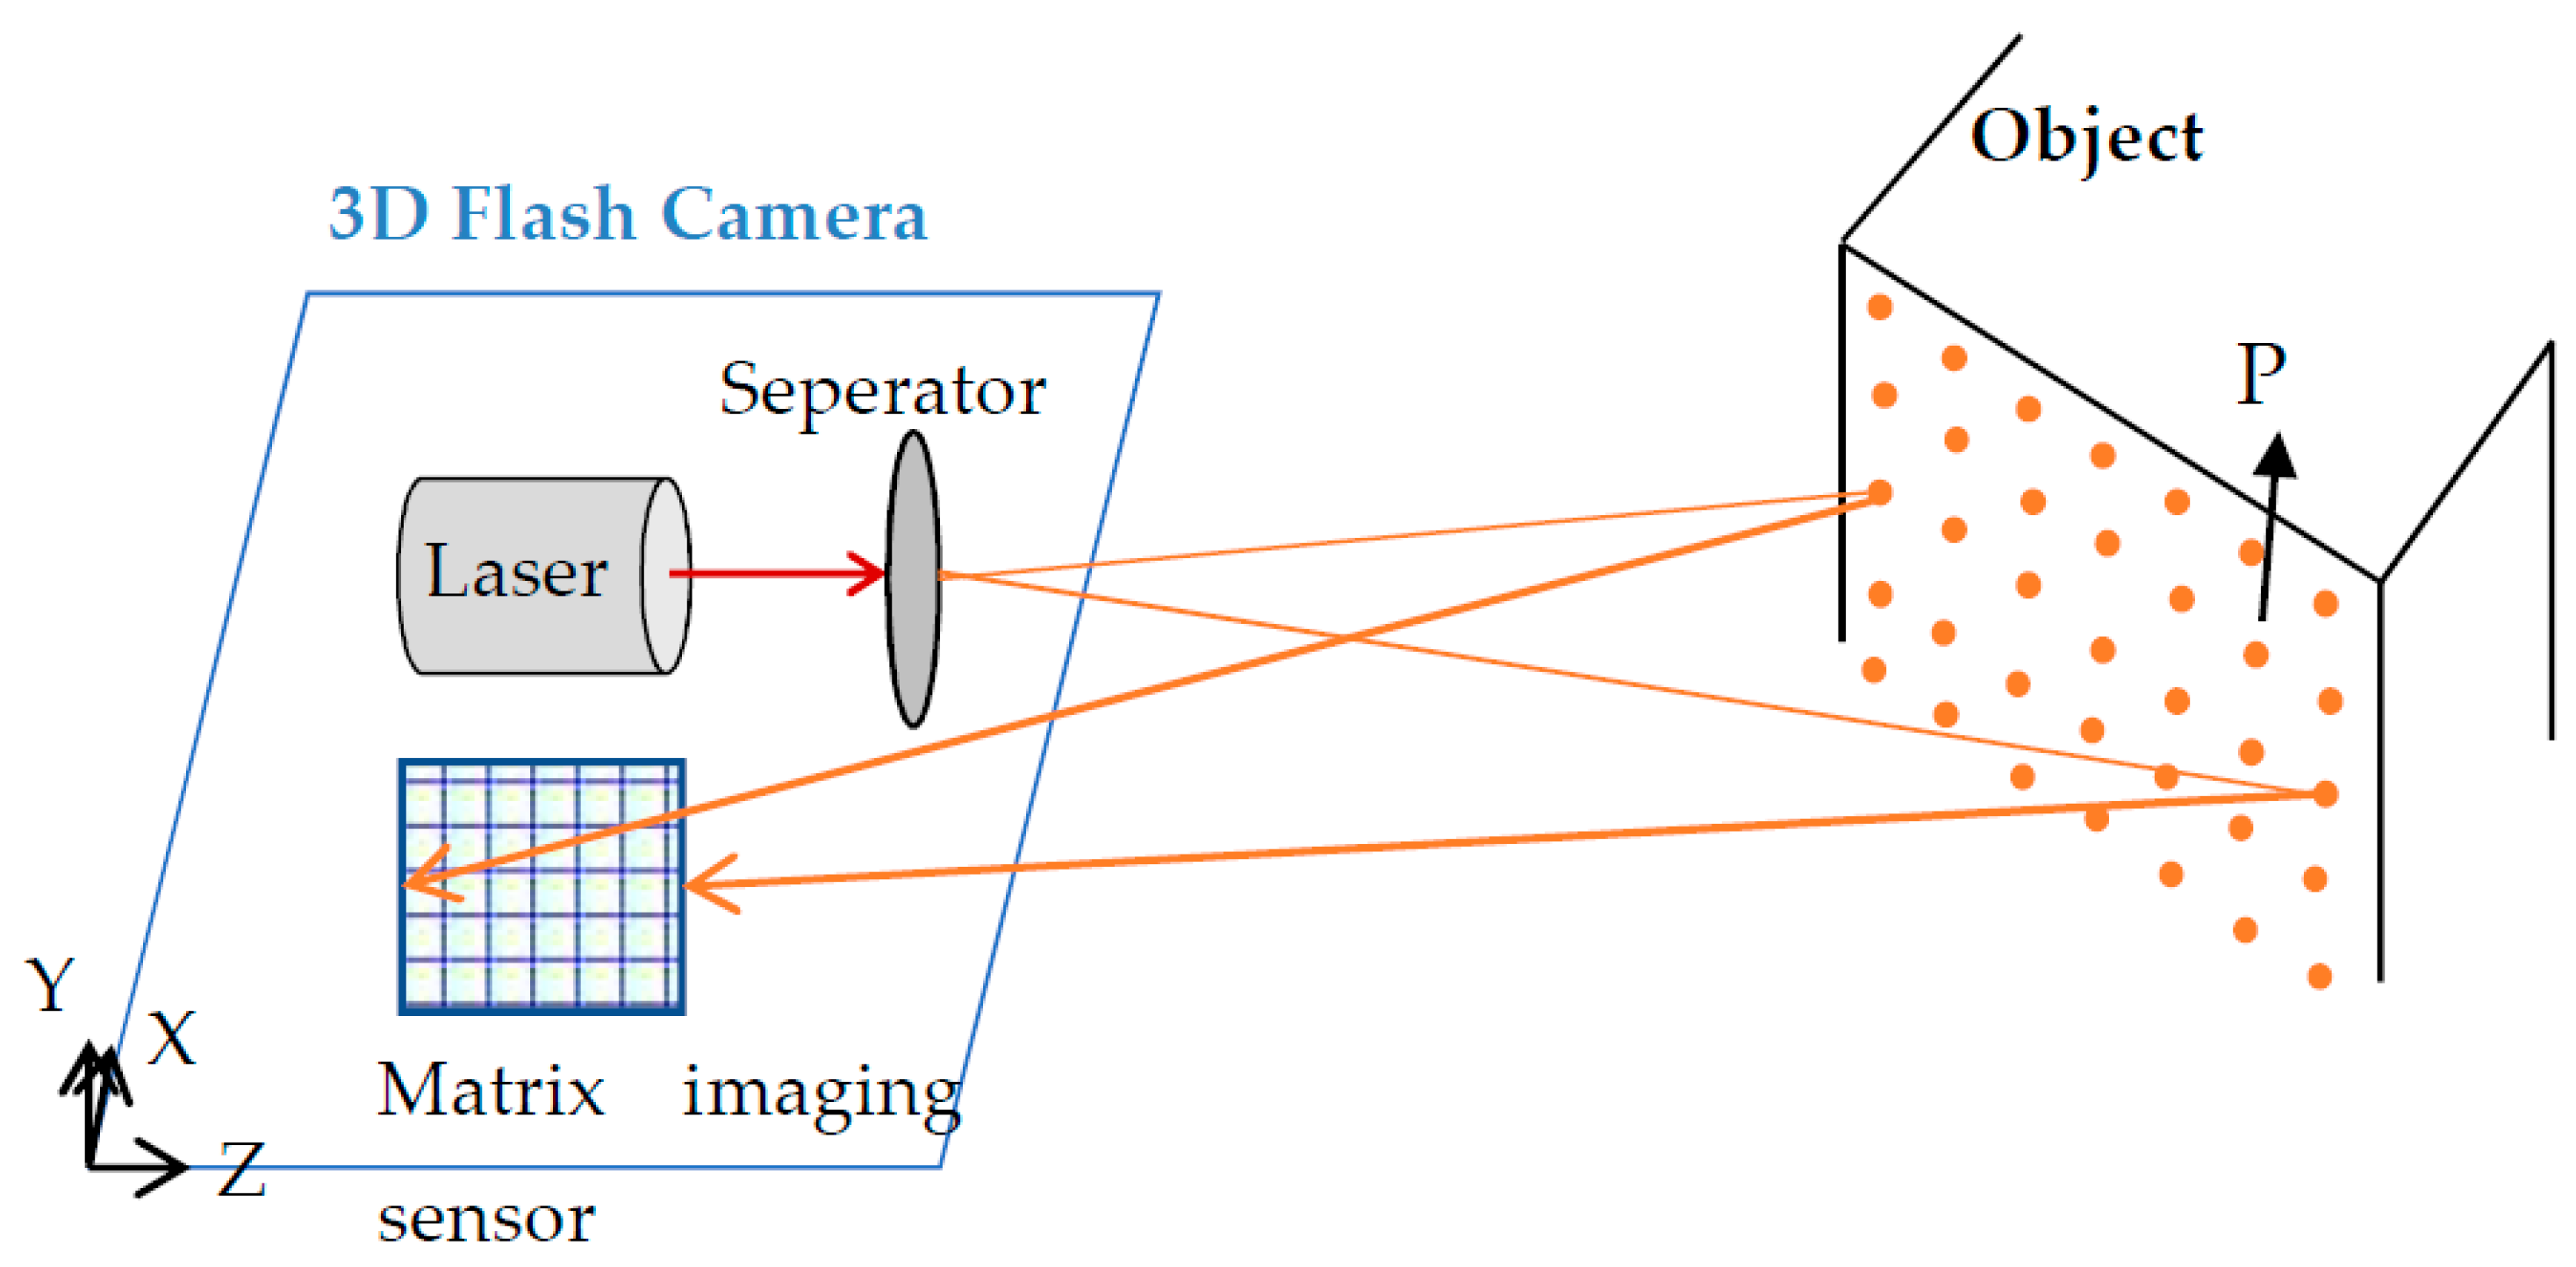
The flash LiDAR camera uses integrated sensor arrays that have time sensitivity multiple detectors and therefore maps time onto intensity. This form of focal plane array imaging uses a high-resolution CMOS sensor for 2D digital imaging at high resolution and precision. In this approach, an emitted single light pulse fills the scene, and the camera lens focuses some part of the reflected signal onto the digital imager through a modulator. The range is estimated from the pulsed ToF of the received signal. The measuring range varies from one meter to several kilometers [51]. The scan rate is 30 or more frames per second. Since the camera beams are not affected by the sunlight, they can be used for indoor or outdoor measurements. Optical ToF and GMAPD techniques are used in flash LiDAR measurement. Along with the distance (r) of the object point, the intensity (I) of the reflected beam is also measured and recorded (Figure 8).
The flash LiDAR camera does not contain any moving parts for measuring. Therefore, it has a solid structure that will not be affected by vibrations. The imaging sensor is very small in size and can be integrated with IMU systems. Flash cameras are used in UAVs due to their low weight. Accuracy and point density is decreased when the measuring distance is increased. Since intense light is emitted from the laser source in flash cameras, the negative effect of this beam on human health must be eliminated. Three-dimensional flash LiDAR cameras with different features have been produced by commercial companies so far (Table 7).
Flash LiDAR cameras are used for many purposes such as navigation, object tracking, 3D modeling, mapping, robot navigation, autonomous vehicles, and more. They are used to detect obstacles around the vehicle, especially in driverless vehicles.

6. Discussion

LiDAR is an active measurement technique that can be applied in day or night conditions. The range accuracy depends on the measuring distance and the intensity of the reflected beam. The light reflectance ratio of the measuring surface affects the maximum measuring distance. The higher reflectance enables measurement from a further distance away. For laser measuring instruments, it is an important reason for preference that surfaces with low reflectivity can be measured from longer distances. This provides an important advantage in detecting black vehicles and other surfaces from longer distances, especially in mobile mapping and navigation. LiDAR point cloud is collected from mobile or static platforms. Multi-beam scanners and LiDAR cameras can be used in mobile mapping. In laser scanning, the scan point density can be adjusted, while in a LiDAR camera, the point density is fixed and only changes according to the measuring distance. The 3D position accuracy of the scan points is largely related to the divergence angle, backscattered intensity, and the object interaction angle of the laser beams.

6.1. Mobile Measurement

Mobile mapping is performed from aerial or ground-based mobile vehicles. Aerial platforms enable us to collect 3D topographic data of large areas in a very short time. They are also widely used in 3D modeling of urban areas. Reducing the size and weight of LiDAR sensors has made the use of UAV LiDAR widespread. Another positive effect of the small-sized LiDAR is the spread of terrestrial hand-held and back-pack mobile scanning. Thus, indoor areas and narrow urban areas that cannot be reached by vehicle can be viewed. LiDAR sensors are used to integrate with the other related instruments in mobile mapping. Although the energy requirement is directly provided in static measurements, batteries are used in mobile devices. The low energy consumption reduces the measurement cost. In particular, robots and unmanned vehicles require low energy consumption in LiDAR devices.
Mobile scanning requires LiDAR devices that do not contain mechanical parts affected by vibrations. For this reason, solid-state LiDAR, MBL, ToF, and 3D flash LiDAR cameras are used in mobile scanning. Robot navigation, driver assistance, and 3D mapping are common in mobile LiDAR (Table 8).
The speed of the vehicle providing mobility directly affects the density and accuracy of a point cloud. When the speed of the vehicle is increased, the point density and accuracy are decreased. The measuring speed of LiDAR instruments is in accordance with the average city vehicle speed (50 km/h). There are also LiDAR devices that can measure at high navigation speeds. For example, LSLİDAR/HS device [52] can perform mobile mapping while the vehicle is traveling at 120 km/h.

6.2. Interference Effect

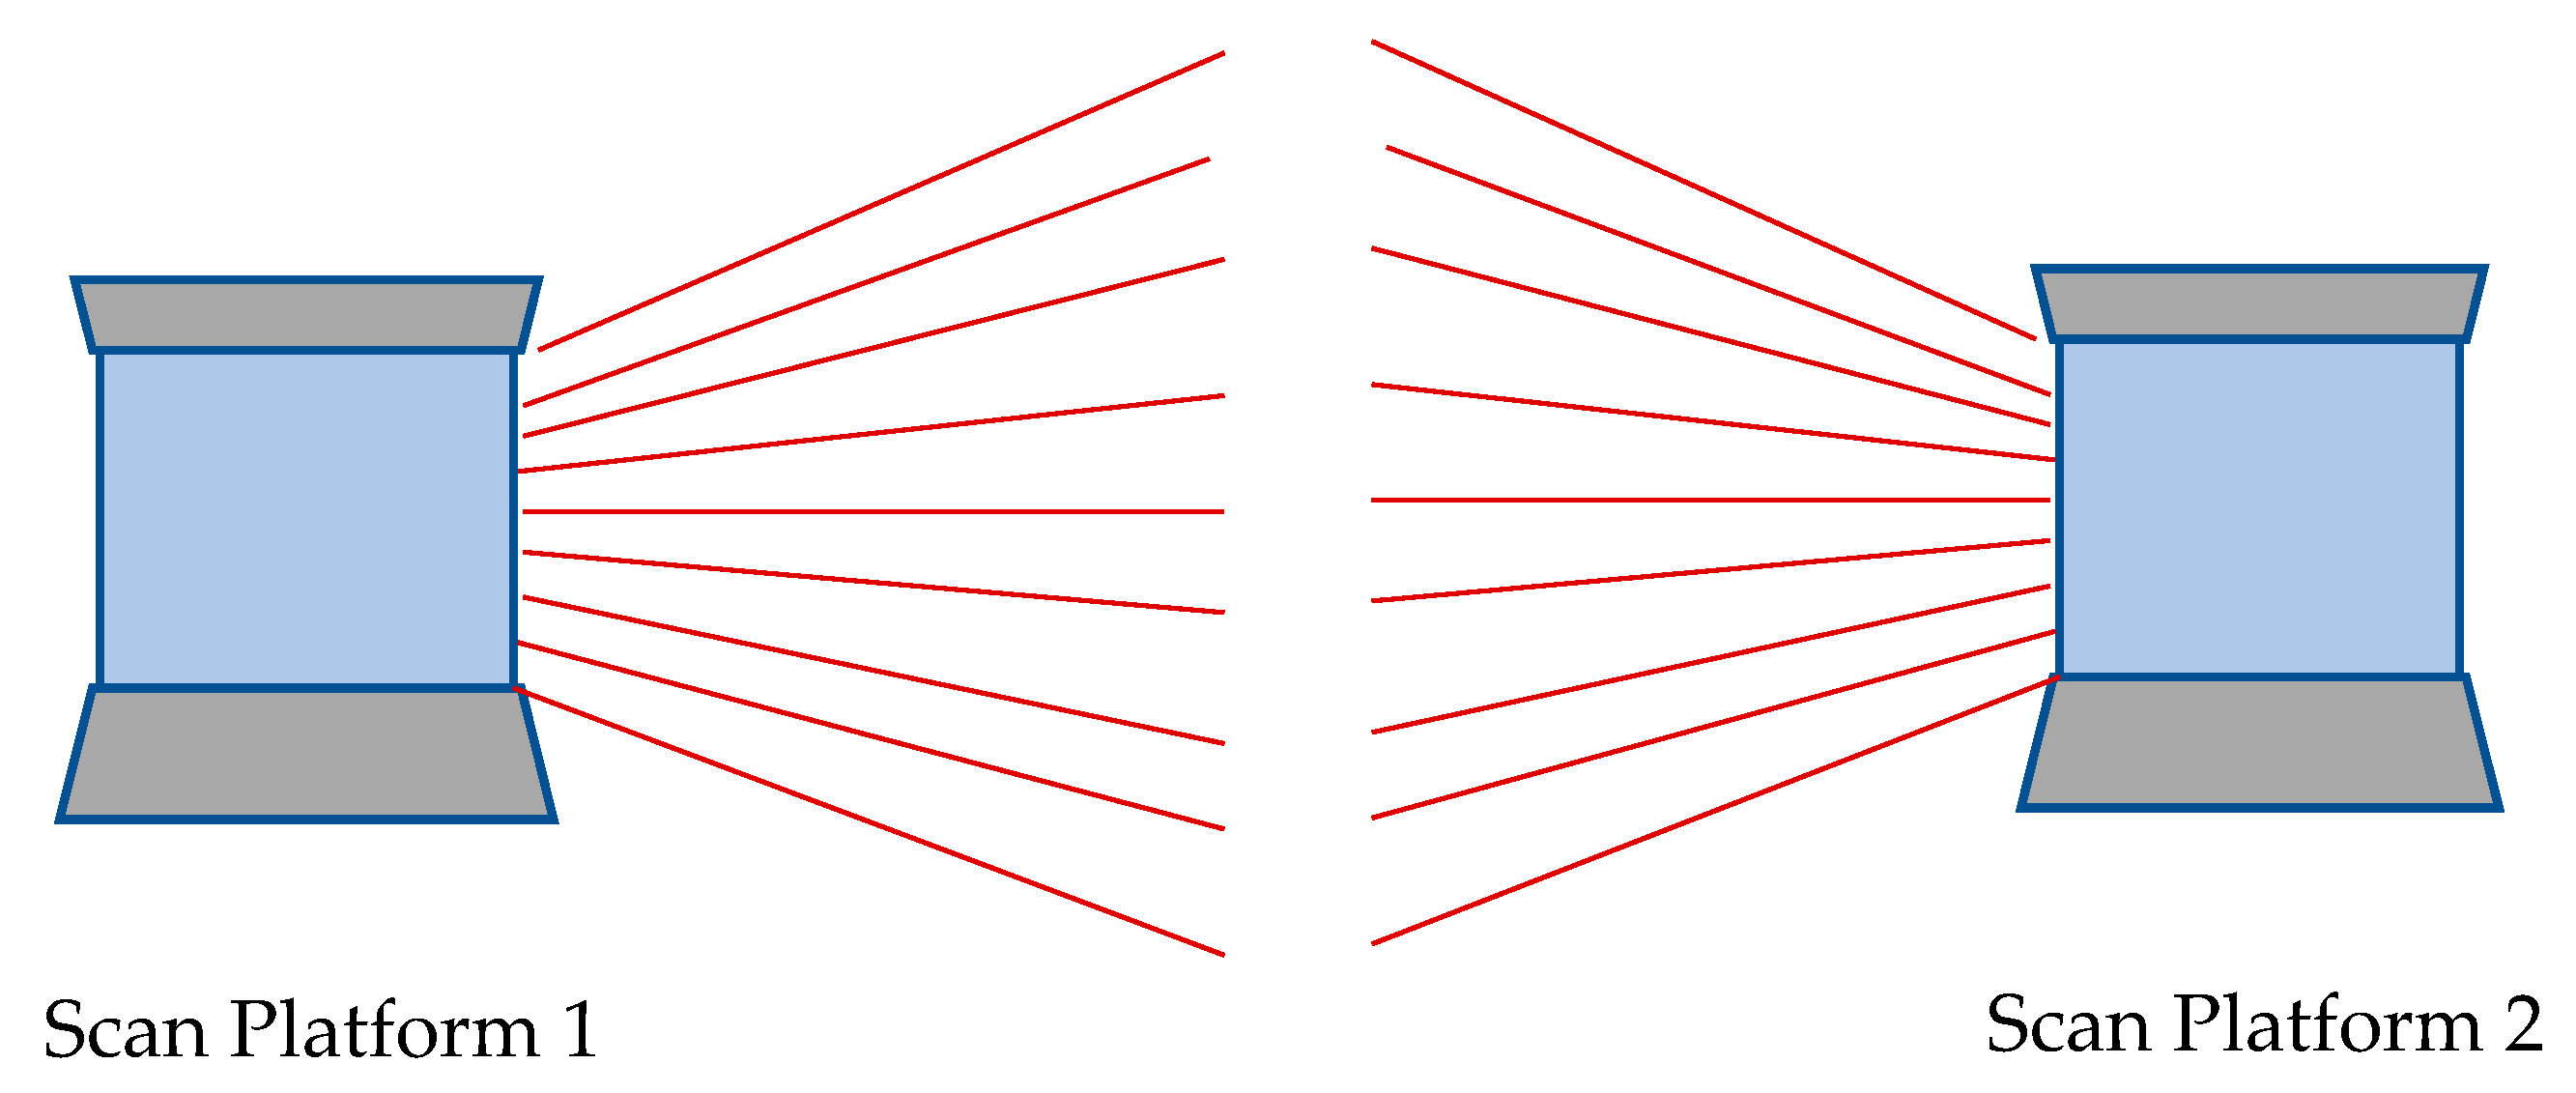
The detection of the beams sent by another LiDAR instrument of the same type causes a measurement error that is called an interference effect. The interference effect causes incorrect range measurements. The widespread use of mobile LiDAR causes intersensory confusion in recording reflected beams (Figure 9). This error is common, especially in LiDAR devices used for unmanned vehicle and robot navigation. The interference effect can be eliminated using the phase lock feature and advanced software. The phase lock feature is used to synchronize the relative rotational position of multiple sensors. Phase locking works by offsetting the firing position based on the rising edge of the signal.

6.3. Point-Cloud Specifications

The point cloud of a mechanical terrestrial laser scanner has a uniform distribution of points in the horizontal and vertical directions. However, if there is a discrepancy between the beam divergence angle and the angular step, the points will not be uniformly distributed [53]. A circular scanner (e.g., Livox/Mid-40) measures the field of view in a circular motion, not as arrays of points.
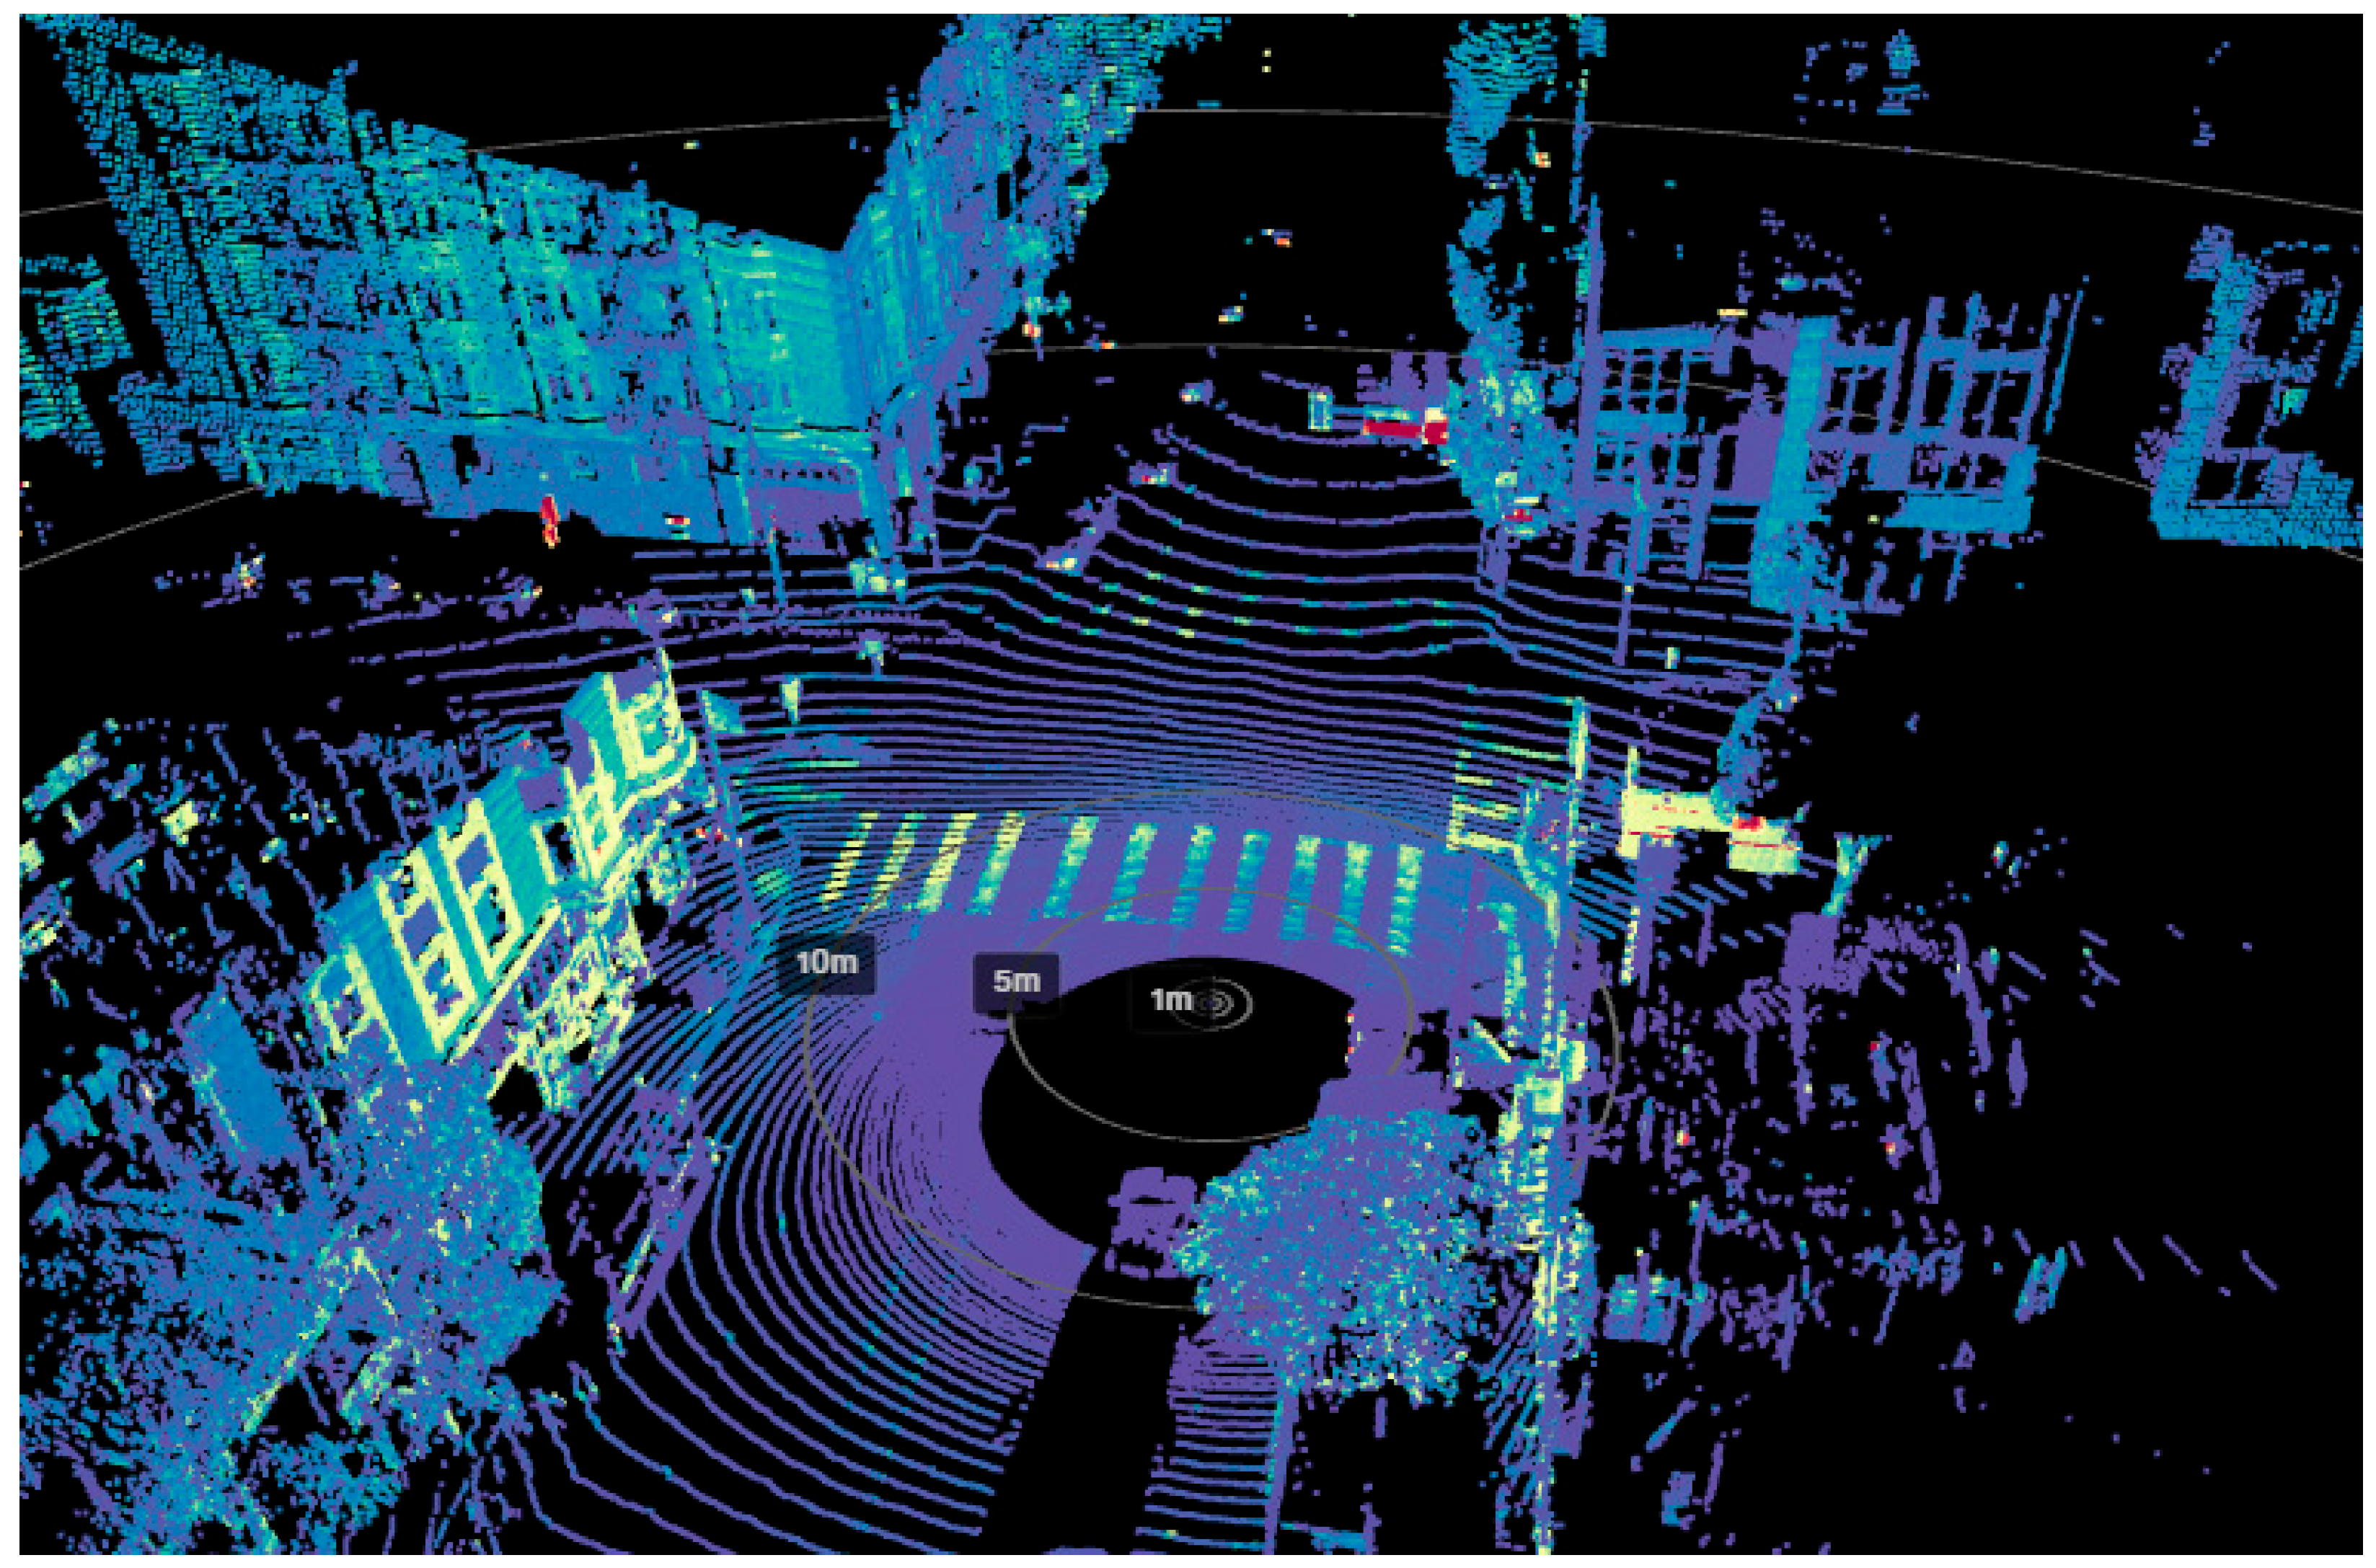
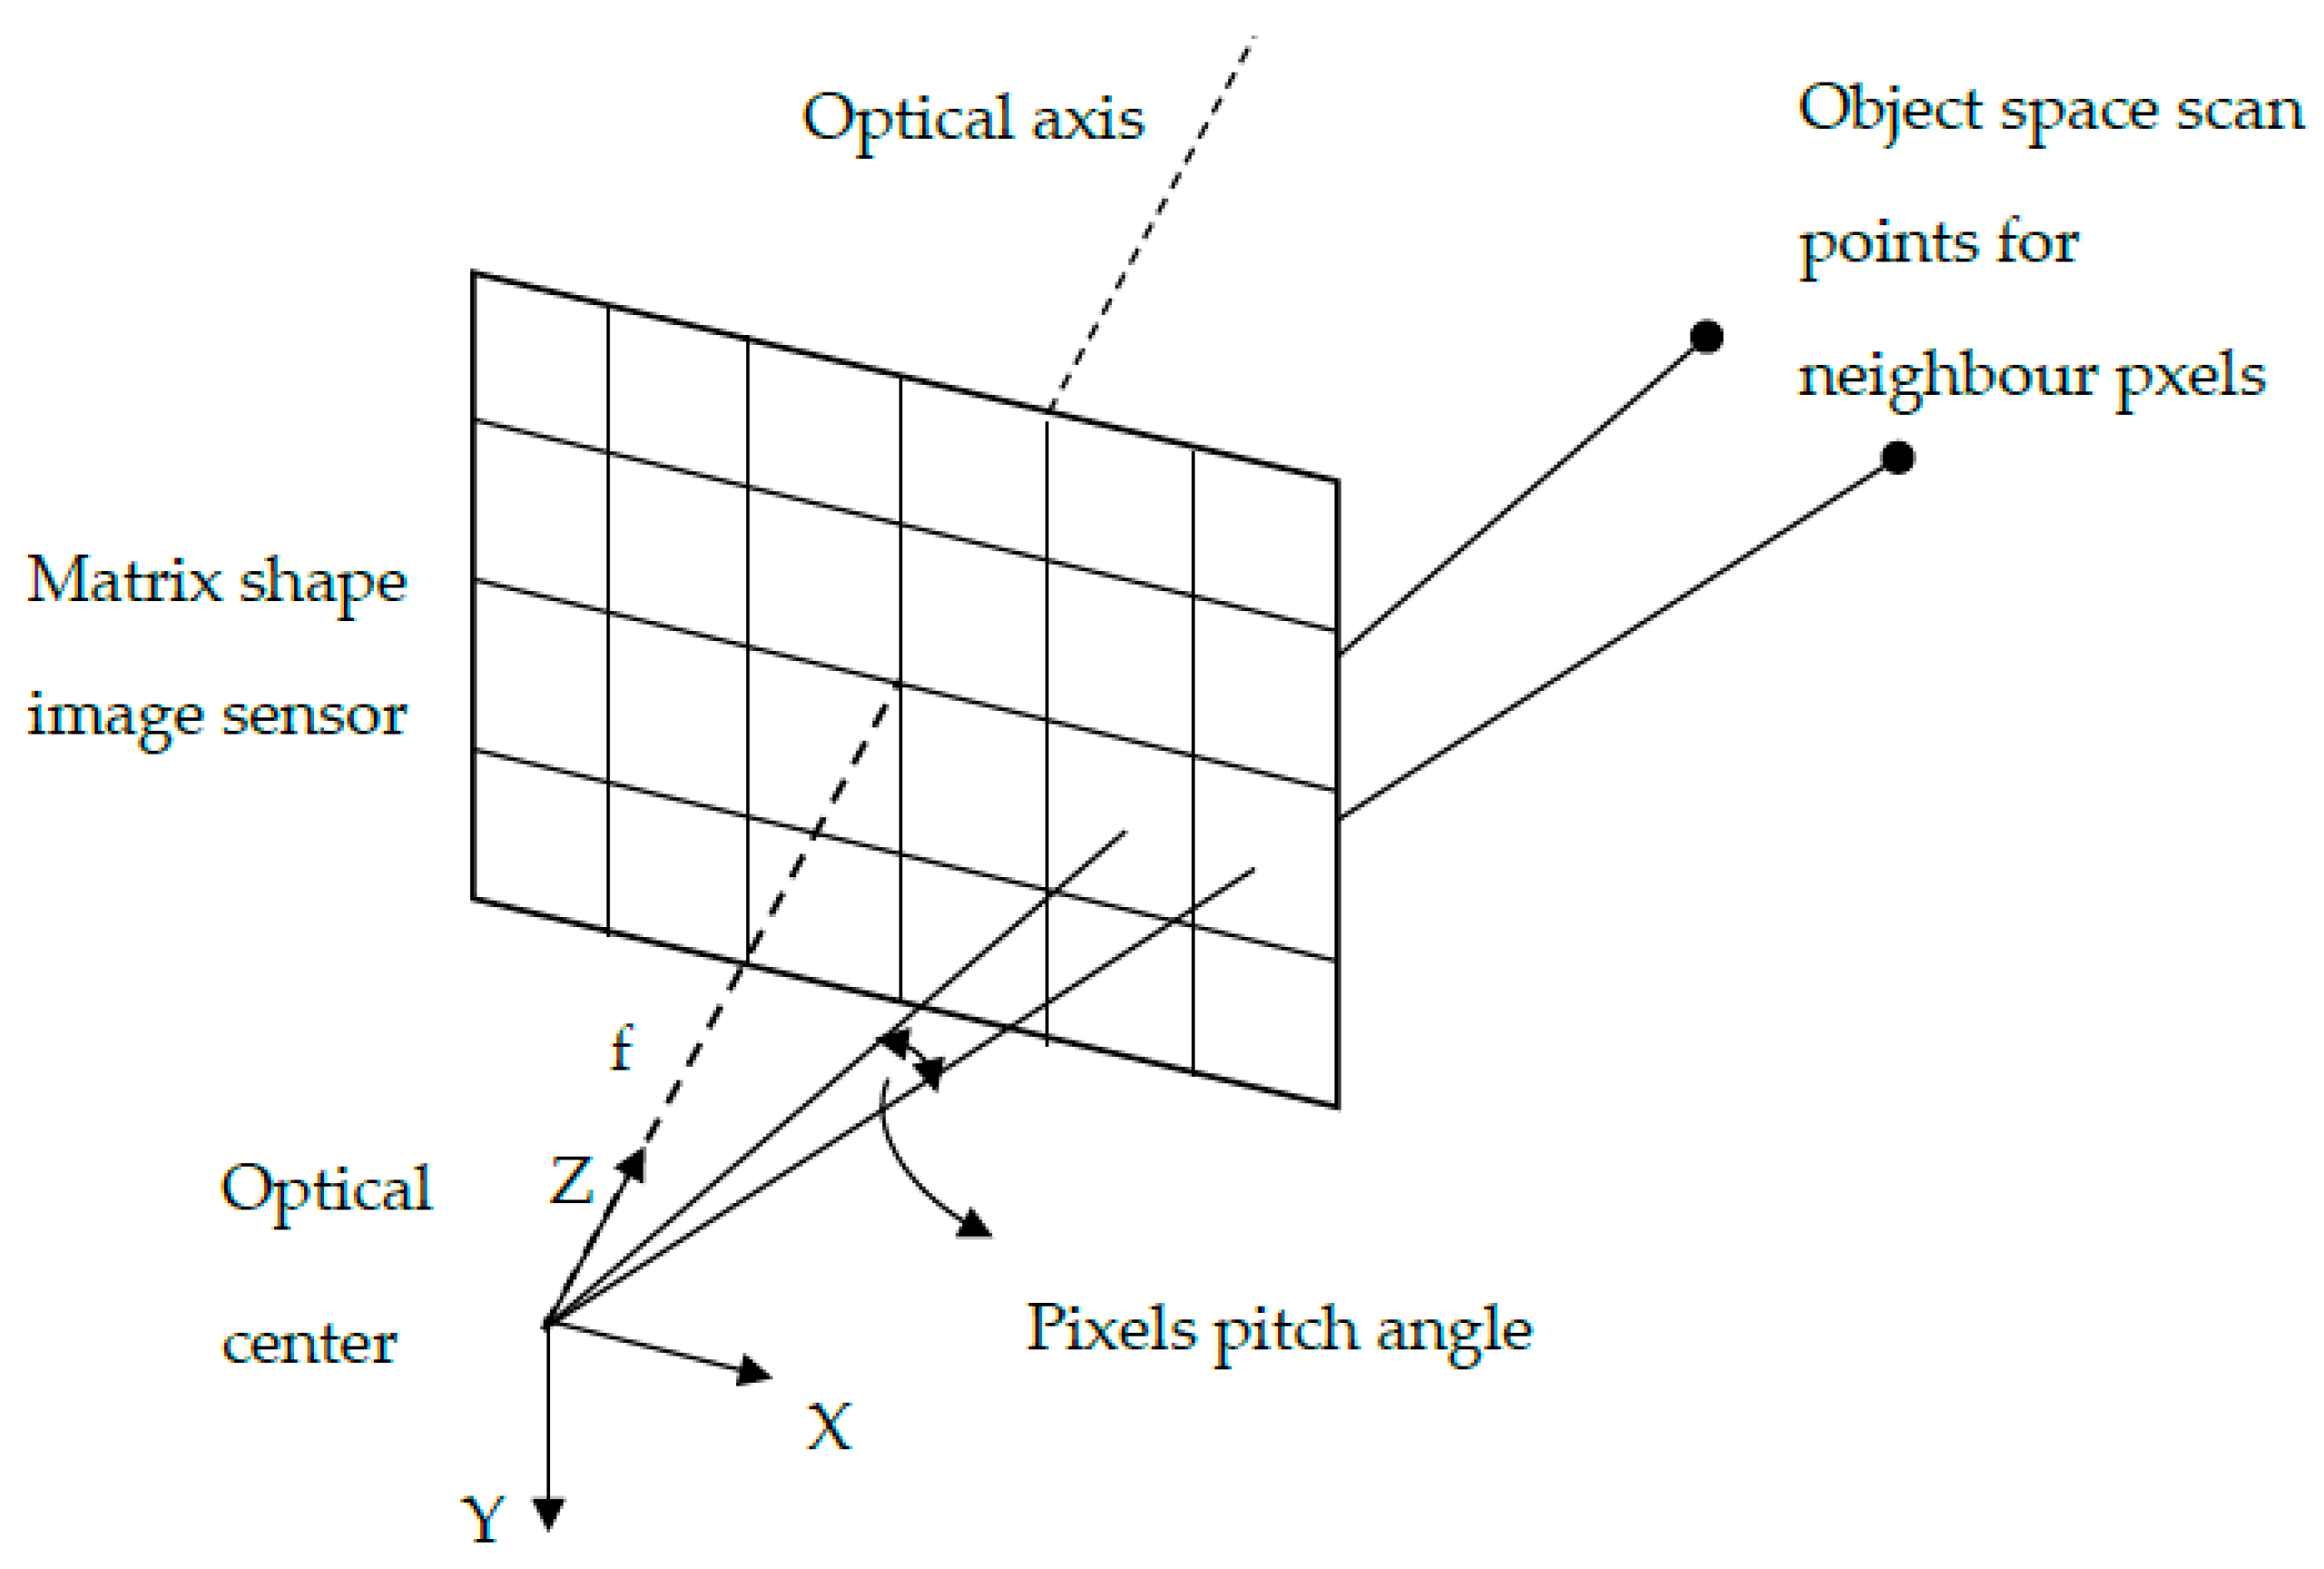
The scan point frequency is determined by the average measuring distance. The point density is decreased at greater distances. The MBL has a fixed point density formed by the scan lines in the vertical direction. The point density in the horizontal direction can only be adjusted since scanning is performed with horizontal rotation (Figure 10). AMCW and flash LiDAR cameras that display with matrix array sensors have a fixed point density that is defined by pixel pitch. Their point density corresponding to pixel pitch only varies depending on the measured distance (Figure 11).
The instrument-centered polar coordinates and the intensity of the backscattered beam are measured for each scan point. If the tool has a 2D real camera view, the color value for the scan points is also recorded.

7. Conclusions

In this study, scanning and pixel-based 3D LiDAR point-cloud measurement techniques were analyzed. Thanks to the developments in LiDAR technology, sensor sizes have decreased, while measuring speeds have increased significantly. This situation has made the use of LiDAR widespread, especially in mobile 3D mapping. The use of LiDAR scanning systems in mobile robots, driverless vehicles, and mobile mapping is becoming increasingly common. Geometric data provided from the LiDAR point cloud enables spatial query and analysis related to the image area with high accuracy. In particular, smart city applications and their requirements have made LiDAR point-cloud measurement techniques even more important. Technological developments will result in new techniques that will provide higher speed and accuracy for LiDAR 3D point-cloud acquisition systems. Even during the preparation of this article, it was observed that new LiDAR instruments with different measuring techniques were introduced by commercial companies. Making 3D point-cloud measurements with sufficient accuracy and efficiency requires full knowledge of the technical features and capacities of the LiDAR devices used.

Funding

This research received no external funding.

Institutional Review Board Statement

Not applicable.

Informed Consent Statement

Not applicable.

Data Availability Statement

Not applicable.

Conflicts of Interest

The authors declare no conflict of interest.

References

  1. Chen, P.; Luo, Z.; Shi, W. Hysteretic mapping and corridor semantic modeling using mobile LiDAR systems. ISPRS J. Photogramm. Remote Sens. 2022, 186, 267–284. [Google Scholar] [CrossRef]
  2. Ma, R.; Chen, C.; Yang, B.; Li, D.; Wang, H.; Cong, Y.; Hu, Z. CG-SSD: Corner guided single stage 3D object detection from LiDAR point cloud. ISPRS J. Photogramm. Remote Sens. 2022, 191, 33–48. [Google Scholar] [CrossRef]
  3. Jung, J.; Sohn, G. A line-based progressive refinement of 3D rooftop models using airborne LiDAR data with single view imagery. ISPRS J. Photogramm. Remote Sens. 2019, 149, 157–175. [Google Scholar] [CrossRef]
  4. Francis, S.L.X.; Anavatti, S.G.; Garratt, M.; Shim, H. A ToF-camera as a 3D vision vensor for autonomous mobile robotics. Int. J. Adv. Robot. Syst. 2015, 12, 11. [Google Scholar] [CrossRef]
  5. Wang, J.; Sun, W.; Shou, W.; Wang, X.; Hu, C.; Chong, H.Y.; Liu, Y.; Sun, C. Integrating BIM and LiDAR for real-time construction quality control. J. Intell. Robot. Syst. 2015, 79, 417–432. [Google Scholar] [CrossRef]
  6. Dora, C.; Murphy, M. Current state of the art historic building information modelling. The International Archives of the Photogrammetry. Remote Sens. Spat. Inf. Sci. 2017, XLII-2/W5, 185–192. [Google Scholar]
  7. Hayakawa, Y.S.; Kusumoto, S.; Matta, N. Application of terrestrial laser scanning for detection of ground surface deformation in small mud volcano (Murono, Japan). Earth Planets Space 2016, 68, 114. [Google Scholar] [CrossRef]
  8. Mandlburger, G.; Hauer, C.; Wieser, M.; Pfeifer, N. Topo-bathymetric LiDAR for monitoring river morphodynamics and instream Habitats—A Case Study at the Pielach River. Remote Sens. 2015, 7, 6160–6195. [Google Scholar] [CrossRef]
  9. Yadav, M.; Singh, A.K.; Lohani, B. Extraction of road surface from mobile LiDAR data of complex road environment. Int. J. Remote Sens. 2017, 38, 4645–4672. [Google Scholar] [CrossRef]
  10. Xia, S.; Wang, R. Extraction of residential building instances in suburban areas from mobile LiDAR data. ISPRS J. Photogramm. Remote Sens. 2018, 144, 453–468. [Google Scholar] [CrossRef]
  11. Wang, X.; Li, P. Extraction of urban building damage using spectral, height and corner information from VHR satellite images and airborne LiDAR data. ISPRS J. Photogramm. Remote Sens. 2020, 159, 322–336. [Google Scholar] [CrossRef]
  12. Qi, X.; Lichti, D.D.; El-Badry, M.; Chan, T.O.; El-Halawany, S.I.; Lahamy, H.; Steward, J. Structural dynamic deflection measurement with range cameras. Photogramm. Rec. 2014, 29, 89–107. [Google Scholar] [CrossRef]
  13. Yeong, D.J.; Hernandez, G.V.; Barry, J.; Walsh, J. Sensor and sensor fusion technology in autonomous vehicles: A review. Sensors 2021, 21, 2140. [Google Scholar] [CrossRef]
  14. Hecht, J. LiDAR for self driving cars. Opt. Photonics News 2018, 29, 26–33. [Google Scholar] [CrossRef]
  15. Royo, S.; Garcia, M.B. An overview of LiDAR imaging systems for autonomous vehicles. Appl. Sci. 2019, 9, 4093. [Google Scholar] [CrossRef]
  16. Nguyen, P.T.T.; Yan, S.W.; Liao, J.F.; Kuo, C.H. Autonomous mobile robot navigation in sparse LiDAR feature environments. Appl. Sci. 2021, 11, 5963. [Google Scholar] [CrossRef]
  17. McManamon, P.F.; Banks, P.; Beck, J.; Fried, D.G.; Huntington, A.S.; Watson, E.A. Comparison of flash LiDAR detector options. Opt. Eng. 2017, 56, 031223. [Google Scholar] [CrossRef]
  18. Hao, Q.; Tao, Y.; Cao, J.; Cheng, Y. Development of pulsed-laser three-dimensional imaging flash LiDAR using APD arrays. Microw. Opt. Technol. Lett. 2021, 63, 2492–2509. [Google Scholar] [CrossRef]
  19. Yu, X.; Kukko, A.; Kaartinen, H.; Wang, Y.; Liang, X.; Matikainen, L.; Hyyppa, J. Comparing features of single and multi-photon LiDAR in boreal forests. ISPRS J. Photogramm. Remote Sens. 2020, 168, 268–276. [Google Scholar] [CrossRef]
  20. Previtali, M.; Garramone, M.; Scaioni, M. Multispectral and mobile mapping ISPRS WG III/5 data set: First analysis of the dataset impact. Int. Arch. Photogramm. Remote Sens. Spat. Inf. Sci. 2021, XLIII-B3-2021, 229–235. [Google Scholar] [CrossRef]
  21. Okhrimenko, M.; Coburn, C.; Hopkinson, C. Multi-Spectral Lidar: Radiometric Calibration, Canopy Spectral Reflectance, and Vegetation Vertical SVI Profiles. Remote Sens. 2019, 11, 1556. [Google Scholar] [CrossRef]
  22. Gundacker, S.; Heering, A. The silicon photomultiplier: Fundamentals and applications of a modern solid-state photon detector. Phys. Med. Biol. 2020, 65, 17TR01. [Google Scholar] [CrossRef]
  23. Aull, B. Geiger-mode avalanche photodiode arrays integrated to all-digital CMOS circuits. Sensors 2016, 16, 495. [Google Scholar] [CrossRef]
  24. Ussyshkin, V.; Theriault, L. Airborne LiDAR: Advances in discrete return technology for 3D vegetation mapping. Remote Sens. 2011, 3, 416–434. [Google Scholar] [CrossRef]
  25. Hancock, S.; Armston, J.; Li, Z.; Gaulton, R.; Lewis, P.; Disney, M.; Danson, F.M.; Strahler, A.; Schaaf, C.; Anderson, K.; et al. Waveform lidar over vegetation: An evaluation of inversion methods for estimating return energy. Remote Sens. Environ. 2015, 164, 208–224. [Google Scholar] [CrossRef]
  26. Anderson, K.; Hancock, S.; Disney, M.; Gaston, K.J. Is waveform worth it? A comparison of LiDAR approaches for vegetation and landscape characterization. Remote Sens. Ecol. Conserv. 2015, 2, 5–15. [Google Scholar] [CrossRef]
  27. Morsy, S.; Shaker, A.; El-Rabbany, A. Multispectral LiDAR Data for Land Cover Classification of Urban Areas. Sensors 2017, 17, 958. [Google Scholar] [CrossRef]
  28. Kahlmann, T. Range Imaging Metrology: Investigation, Calibration and Development. Ph.D. Thesis, ETH Zurich, Zurich, Switzerland, 2007. [Google Scholar]
  29. Li, L. Time-of-flight cameras: An introduction. In Technical White Paper SLOA190B; Texas Instruments: Dallas, TX, USA, 2014. [Google Scholar]
  30. Piatti, D.; Rinaudo, F. SR-4000 and CamCube3.0 Time of Flight (ToF) Cameras: Tests and Comparison. Remote Sens. 2012, 4, 1069–1089. [Google Scholar] [CrossRef]
  31. Mandlburger, G.; Jutzi, B. On the feasibility of water surface mapping with single photon LiDAR. ISPRS Int. J. Geo-Inf. 2019, 8, 188. [Google Scholar] [CrossRef]
  32. Mandlburger, G. Evaluation of Single Photon and Waveform LiDAR. Arch. Photog. Cartog. Remote Sens. 2019, 31, 13–20. [Google Scholar] [CrossRef]
  33. Stoker, J.M.; Abdullah, Q.A.; Nayegandhi, A.; Winehouse, J. Evaluation of single photon and Geiger mode LiDAR for the 3D elevation program. Remote Sens. 2016, 8, 767. [Google Scholar] [CrossRef]
  34. Mizuno, T.; Ikeda, H.; Makino, K.; Tamura, Y.; Suzuki, Y.; Baba, T.; Adachi, S.; Hashi, T.; Mita, M.; Mimasu, Y.; et al. Geiger-mode three-dimensional image sensor for eye-safe flash LİDAR. IEICE Electron. Express 2020, 17, 20200152. [Google Scholar] [CrossRef]
  35. National Research Council. Laser Radar: Progress and Opportunities in Active Electro-Optical Sensing; The National Academies Press: Washington, DC, USA, 2014. [Google Scholar] [CrossRef]
  36. Mandlburger, G.; Lehner, H.; Pfeifer, N. A comparison of single photon LiDAR and full waveform LiDAR. ISPRS Ann. Photogramm. Remote Sens. Spat. Inf. Sci. 2019, 4, 397–404. [Google Scholar] [CrossRef]
  37. Villa, F.; Severini, F.; Madonini, F.; Zappa, F. SPADs and SiPMs Arrays for Long-Range High-Speed Light Detection and Ranging (LiDAR). Sensors 2021, 21, 3839. [Google Scholar] [CrossRef]
  38. Donati, S.; Martini, G.; Pei, Z. Analysis of timing errors in time-of-flight LiDAR using APDs and SPADs receivers. IEEE J. Quantum Electron. 2021, 57, 7500108. [Google Scholar] [CrossRef]
  39. Altuntas, C. Point cloud acquisition techniques by using scanning lidar for 3D modelling and mobile measurement. Int. Arch. Photogramm. Remote Sens. Spat. Inf. Sci. 2022, 43, 967–972. [Google Scholar] [CrossRef]
  40. Reshetyuk, Y. Self-Calibration and Direct Georeferencing in Terrestrial Laser Scanning. Ph.D. Thesis, KTH Royal Institute of Technology, Stockholm, Sweden, 2009. [Google Scholar]
  41. Gorecki, C.; Bargiel, S. MEMS Scanning Mirrors for Optical Coherence Tomography. Photonics 2021, 8, 6. [Google Scholar] [CrossRef]
  42. Hamamatsu Corporation. Available online: https://www.hamamatsu.com/eu/en/index.html (accessed on 24 September 2021).
  43. Mirrorcle Technologies, Inc. Available online: https://mirrorcletech.com/wp/ (accessed on 6 August 2022).
  44. Guo, Y.; Guo, Y.; Li, C.; Zhang, H.; Zhou, X.; Zhang, L. Integrated Optical Phased Arrays for Beam Forming and Steering. Appl. Sci. 2021, 11, 4017. [Google Scholar] [CrossRef]
  45. Wei, W.; Shirinzadeh, B.; Nowell, R.; Ghafarian, M.; Ammar, M.M.A.; Shen, T. Enhancing solid state LiDAR mapping with a 2D spinning LiDAR in urban scenario SLAM on ground vehicles. Sensors 2021, 21, 1773. [Google Scholar] [CrossRef]
  46. Alsadik, B. Multibeam LiDAR for Mobile Mapping Systems. GIM Int. 2020, 2020, 1–3. [Google Scholar]
  47. Hesaitech. Available online: https://www.hesaitech.com/en/Pandar128 (accessed on 5 August 2022).
  48. Weber, H. LiDAR sensor functionality and variants. SICK AG White Pap. 2018, 7, 1–16. [Google Scholar]
  49. SICK AG. Operating Instruction of MRS6000 3D LİDAR Sensors. Available online: https://cdn.sick.com/media/docs/0/40/540/operating_instructions_mrs6000_en_im0076540.pdf (accessed on 8 August 2022).
  50. Horaud, R.; Hansard, M.; Evangelidis, M.; Menier, C. An overview of depth cameras and range scanners based on time-of-flight technologies. Mach. Vis. Appl. 2016, 27, 1005–1020. [Google Scholar] [CrossRef]
  51. Fuller, L.; Carl, A.; Spagnolia, J.; Short, B.; Dahlin, M. Photon counting linear mode global shutter flash LİDAR for improved range performance. In Laser Radar Technology and Applications XXVII; SPIE: Bellingham, WA, USA, 2022; Volume 12110, pp. 35–41. [Google Scholar]
  52. LeiShen Intelligent System Co., Ltd. Available online: http://www.lsLiDAR.com/en/hs/86 (accessed on 11 August 2022).
  53. El-Khrachy, I.M. Towards an Automatic Registration for Terrestrial Laser Scanner Data. Ph.D. Dissertation, Technical University of Braunschweig, Brunswick, Germany, 2008. [Google Scholar]
Figure 1. 3D LiDAR systems in historical progress.
Applsci 13 06488 g001
Figure 2. Discrete and full-waveform LiDAR data.
Applsci 13 06488 g002
Figure 3. Pulse-based range measurement.
Applsci 13 06488 g003
Figure 4. Amplitude modulation (AMCW).
Applsci 13 06488 g004
Figure 5. MBL channel distribution.
Applsci 13 06488 g005
Figure 6. Operational diagram of multi-layer LiDAR.
Applsci 13 06488 g006
Figure 7. Schematic diagram of rotating 2D LiDAR. 2D LiDAR plane perpendicular to the 360-degree rotation plane.
Applsci 13 06488 g007
Figure 8. Schematic visualization of flash LiDAR camera measurement.
Applsci 13 06488 g008
Figure 9. Possible interference affects the position of two scan platforms.
Applsci 13 06488 g009
Figure 10. MBL point-cloud data (Ouster LiDAR OS1-128 channel).
Applsci 13 06488 g010
Figure 11. The pixels pitch angle and density of scan points on matrix imager LiDAR camera.
Applsci 13 06488 g011
Table 1. Technical specifications of mechanical LiDAR (LW: Laser Wavelength).
Brand/ModelLW
(nm)
FoV
(H° × V°)
Range PrincipleMax. RangeMeasuring SpeedRange Accur.
Leica/BLK360830360 × 270Phase-shift45 m680,000 pts/s7 mm@20 m
Leica/RTC3601550360 × 300Phase-shift130 m2 M pts/s0.5 mm@20 m
Leica/ScanStatioP401550360 × 290Phase-shift270 m1 M pts/s0.5 mm@50 m
Z + F/IMAGER 50161500360 × 320Phase-shift365 m1.1 M pts/sec1 mm + 10 ppm
RIEGL/VZ-6000N.Inf.360 × 60Pulsed6000 m222,000 pts/s15 mm@150 m
RIEGL/VZ-4000N.Inf.360 × 60Pulsed4000 m222,000 pts/s15 mm@150 m
RIEGL/VZ-400iN.Inf.360 × 100Pulsed800 m500,000 pts/s5 mm@100 m
FARO/Focus Pre 3501553.5360 × 300Phase-shift350 m2 M pts/s1 mm@25 m
OPTECH/Polaris1550360 × 120Pulsed2000 m2 Mhz5 mm@100 m
Topcon/GLS-22001064360 × 270Pulsed500 m120,000 pts/s3.1 mm@150 m
Trimble/TX81500360 × 317Pulsed340 m1 M pts/s<2 mm
PENTAX/S-3180VNa360 × 320Pulsed187.3 m1.016 M pts/s<1 mm
Maptek XR3N.Inf.360 × 90Pulsed2400 m400,000 pts/s5 mm@65 m
GVI/LiPod903360 × 30Pulsed100 m600,000 pts/s<3 cm
Table 2. Technical specifications of solid-state LiDAR instruments. (LW: Laser wavelength, LO: Light orientation, RR: Repetition rate, PC: Power consumption).
Brand/ModelLW
(nm)
LOFoV
(H° × V°)
Max. RangeRRMeasuring SpeedRange Accur.PC
Velodyne/Velabit903MEMS90 × 70100 mnanana3 W
Hesai/PandarGT-L601550MEMS60 × 20300 m%1020 Hz945,000 pts/s2 cm30 W
Livox/Mid-40905OPACircular 38.4°260 mna100,000 pts/s2 cm10 W
Livox/Avia905OPA70.4 × 77.2 circular450 mna240,000 pts/s2 cm9 W
Intel R.Sense/L515860MEMS70 × 559 m30 fps23 M pts/s14 mm3.5 W
Quanergy/S3-2NSI-S00905OPA50 × 410 m@%8010 Hzna5 cm6 W
Leishen/LS21F1550MEMS60 × 25250 m@%530 Hz4 M pts/s5 cm35 W
Table 3. Technical specifications of MBL. (LW: Laser wavelength, RR: Repetition rate, PC: Power consumption).
Brand/ModelLW
(nm)
Channel#FoV
(H° × V°)
Max. RangeRRMeasuring SpeedRange
Accur.
PC
Velodyne/HDL-32E90532360 × 40100 m20 Hz1.39 M pts/s2 cm12 W
Ouster/OS2-128865128360 × 22.5240 m20 Hz2,621,440 pts/s2.5 cm24 W
HESAI/Pandar 6490564360 × 40200 m20 Hz1,152,000 pts/s2 cm22 W
Quanergy/M8-Ultra9058360 × 20200 m20 Hz1.3 M pts/s3 cm16 W
LSLİDAR/C3290532360 × 31150 m20 Hz600,000 pts/s3 cm9 W
LSLİDAR/CH3290532120 × 22.25200 m20 Hz426,000 pts/s2 cm10 W
Table 4. The specifications of multi-layer LiDAR instruments. (LW: Laser wavelength, RR: Repetition rate, PC: Power consumption).
Brand/ModelLW
(nm)
Scan PlanesFoV
(H° × V°)
Range PrincipleMax. RangeRRMeasuring SpeedPC
SICK/MRS10008504275 × 7.5Puls-time30 m50 Hz165,000 pts/s30 W
SICK/MRS600087024275 × 15Puls-time75 m10 HzNa20 W
PEPPERL + FUCHS/R23009054100 × 9Puls-time10 m90 kHz50,000 pts/s8 W
Table 5. The specifications of rotating 2D LiDAR instruments. LW: Laser wavelength, Range MM: Range measuring method, RR: Repetition rate, PC: Power consumption).
Brand/ModelLW
(nm)
FoV
(H° × V°)
Max. RangeMeasuring SpeedRange Accur.Return Signal#PC
Acuity Technologies/AL-500905360 × 120300 m200,000 pts/s8 mm412 W
Acuity Technologies/AL-500AIR905120 × 120300 m200,000 pts/s8 mm46 W
Table 6. Properties of solid-state ToF cameras. (LW: Laser wavelength, PC: Power consumption).
Brand/ModelLW
(nm)
Pixel ArrayFoV
(H° × V°)
Range PrincipleMax. RangeFrame RateRange AccuracyPC
Terabee/3DcamIR80 × 6074 × 57Phase-shift (indoor)4 m30 fps1%of distance4 W
LUCID/Helios2+850 nm640 × 48069 × 51Phase-shift (indoor)8.3 m103 fps4 [email protected] m12 W
Panasonic/HC4W940 nm640 × 48090 × 70Pulsed (outdoor)4 m30 fpsNa5.4 W
Odos Imaging/Swift-E850 nm640 × 48043 × 33Pulsed (outdoor)6 m44 fps1 cm30 W
Table 7. Technical specifications of flash LiDAR cameras. (LW: Laser wavelength, PC: Power consumption).
Brand/ModelLW
(nm)
Pixel ArrayFoV
(H° × V°)
Range PrincipleImaging TechniqueMax. RangeFrame RateRange Accur.PC
ASC/GSFL-16K1570128 × 1283 × 60Puls-timeLMAPD1000 m20 Hz10 cm30 W
Ball Aerospace/
GM-Camera
1000128 × 32NaPuls-timeGMAPD6 km90 kHz7.5 cm18 W
Ouster/ES2880Na26 × 13Puls-timeSPAD450 m30 Hz5 cm18 W
Leica/SPL10053210 × 10 beamlet20 × 30Puls-timeSPL4500 m25 Hz10 cm5 W
Leddar Tech/
Leddar Pixel
905Na177.5 × 16Puls-timeLMAPD56 m20 Hz<3 cm20 W
Table 8. 3D LiDAR point-cloud acquisition techniques and their main properties. (LW: Laser wavelength, PC: Power consumption).
Point-Cloud AcquisitionMax. RangeMeasuring SpeedPCMobilityMain Application Area
ScanningMechanical LiDAR (TLS)6 km222,000 pts/sNaNoObject, historical relics, building, scene view 3D modeling
Solid-state LiDAR-MEMS300 m945,000 pts/sNaYesAutonomous driving, smart cities, indoor mapping, logistics, delivery, transportation, robotics
Solid-state LiDAR-OPA450 m240,000 pts/s9 WYesRobot and vehicle navigation, mapping, powerline surveying, smart cities, security
Multi-beam LiDAR200 m1.3 M pts/s18 WYesAutonomous cars and trucks, robotaxis, robotics, indoor and outdoor mobile mapping
Multi-layer LiDAR75 m10 Hz20 WYesMobility and navigation services. Gap-free measurement, mining
Rotating 2D LiDAR300 m200,000 pts/s6 WYesVehicle navigation and obstacle detection, crime scene reconstruction, forest inventory, drone, and airborne mapping
Pixel arrayToF camera (AMCW)8 m40 fps12 WYesIndoor navigation, mapping, and modeling, BIM applications
3D Flash LiDARcamera6 km90 kHz18 WYesOutdoor navigation and modeling, space research, robotic automation, heavy industry
Disclaimer/Publisher’s Note: The statements, opinions and data contained in all publications are solely those of the individual author(s) and contributor(s) and not of MDPI and/or the editor(s). MDPI and/or the editor(s) disclaim responsibility for any injury to people or property resulting from any ideas, methods, instructions or products referred to in the content.