Article

Phishing Node Detection in Ethereum Transaction Network Using Graph Convolutional Networks

1
School of Cyberspace, Hangzhou Dianzi University, Hangzhou 310018, China
2
Data Security Governance Zhejiang Engineering Research Center, Hangzhou Dianzi University, Hangzhou 310018, China
*
Author to whom correspondence should be addressed.
Appl. Sci. 2023, 13(11), 6430; https://doi.org/10.3390/app13116430
Submission received: 16 April 2023 / Revised: 19 May 2023 / Accepted: 20 May 2023 / Published: 24 May 2023
(This article belongs to the Special Issue Advances in Cybersecurity: Challenges and Solutions)

Abstract

:
As the use of digital currencies, such as cryptocurrencies, increases in popularity, phishing scams and other cybercriminal activities on blockchain platforms (e.g., Ethereum) have also risen. Current methods of detecting phishing in Ethereum focus mainly on the transaction features and local network structure. However, these methods fail to account for the complexity of interactions between edges and the handling of large graphs. Additionally, these methods face significant issues due to the limited number of positive labels available. Given this, we propose a scheme that we refer to as the Bagging Multiedge Graph Convolutional Network to detect phishing scams on Ethereum. First, we extract the features from transactions and transform the complex Ethereum transaction network into three simple inter-node graphs. Then, we use graph convolution to generate node embeddings that leverage the global structural information of the inter-node graphs. Further, we apply the bagging strategy to overcome the issues of data imbalance and the Positive Unlabeled (PU) problem in transaction data. Finally, to evaluate our approach’s effectiveness, we conduct experiments using actual transaction data. The results demonstrate that our Bagging Multiedge Graph Convolutional Network (0.877 AUC) outperforms all of the baseline classification methods in detecting phishing scams on Ethereum.

1. Introduction

Ethereum, which provides Turing completeness in smart contracts, has become the largest smart contract platform. Meanwhile, Ether, i.e., the cash in Ethereum, has become one of the most popular cryptocurrencies. Hence, it is not surprising that Ethereum has been targeted extensively by cybercriminals. For example, according to the 2022 crypto crime report of Chainalysis, illicit transaction activity has reached an all-time-high value, and scams are the largest form of cryptocurrency-based crime by transaction volume, with over $7.7 billion of cryptocurrency taken from victims worldwide [1].
Among the various types of cybercriminal activity on Ethereum, phishing scams are notably prevalent and highly damaging and have garnered significant attention [2]. Currently available approaches to the detection of phishing primarily concentrate on identifying the specific characteristics of fraudulent emails and websites [3,4,5,6,7]. However, such methods are ineffective against scams that trick users into transferring cryptocurrency to Ethereum addresses that belong to or are controlled by scammers.
To detect phishing attempts on Ethereum, many novel methods using the transaction network were proposed [8,9,10]. The nodes of the transaction network represent Ethereum accounts, and the edges represent transactions between accounts. Specifically, these models transformed the phishing scam detection task into a node classification task [11]. Recently, researchers have constructed a transaction subgraph for each target node and used the features of the transaction subgraph as the features of the target node. Thus, the problem of phishing node detection in the Ethereum transaction network can be converted from a node classification task to a graph classification task [12,13,14]. These existing works, however, have some limitations in handling large graphs and have few positive labels.
Figure 1 is a schematic representation of the Ethereum transaction network, where multiple edges are merged into a single edge and the directions of the edges are hidden. The Ethereum transaction network is a multidigraph and contains rich information about node behavior patterns. From Figure 1, we can identify the following characteristics of the Ethereum transaction network.
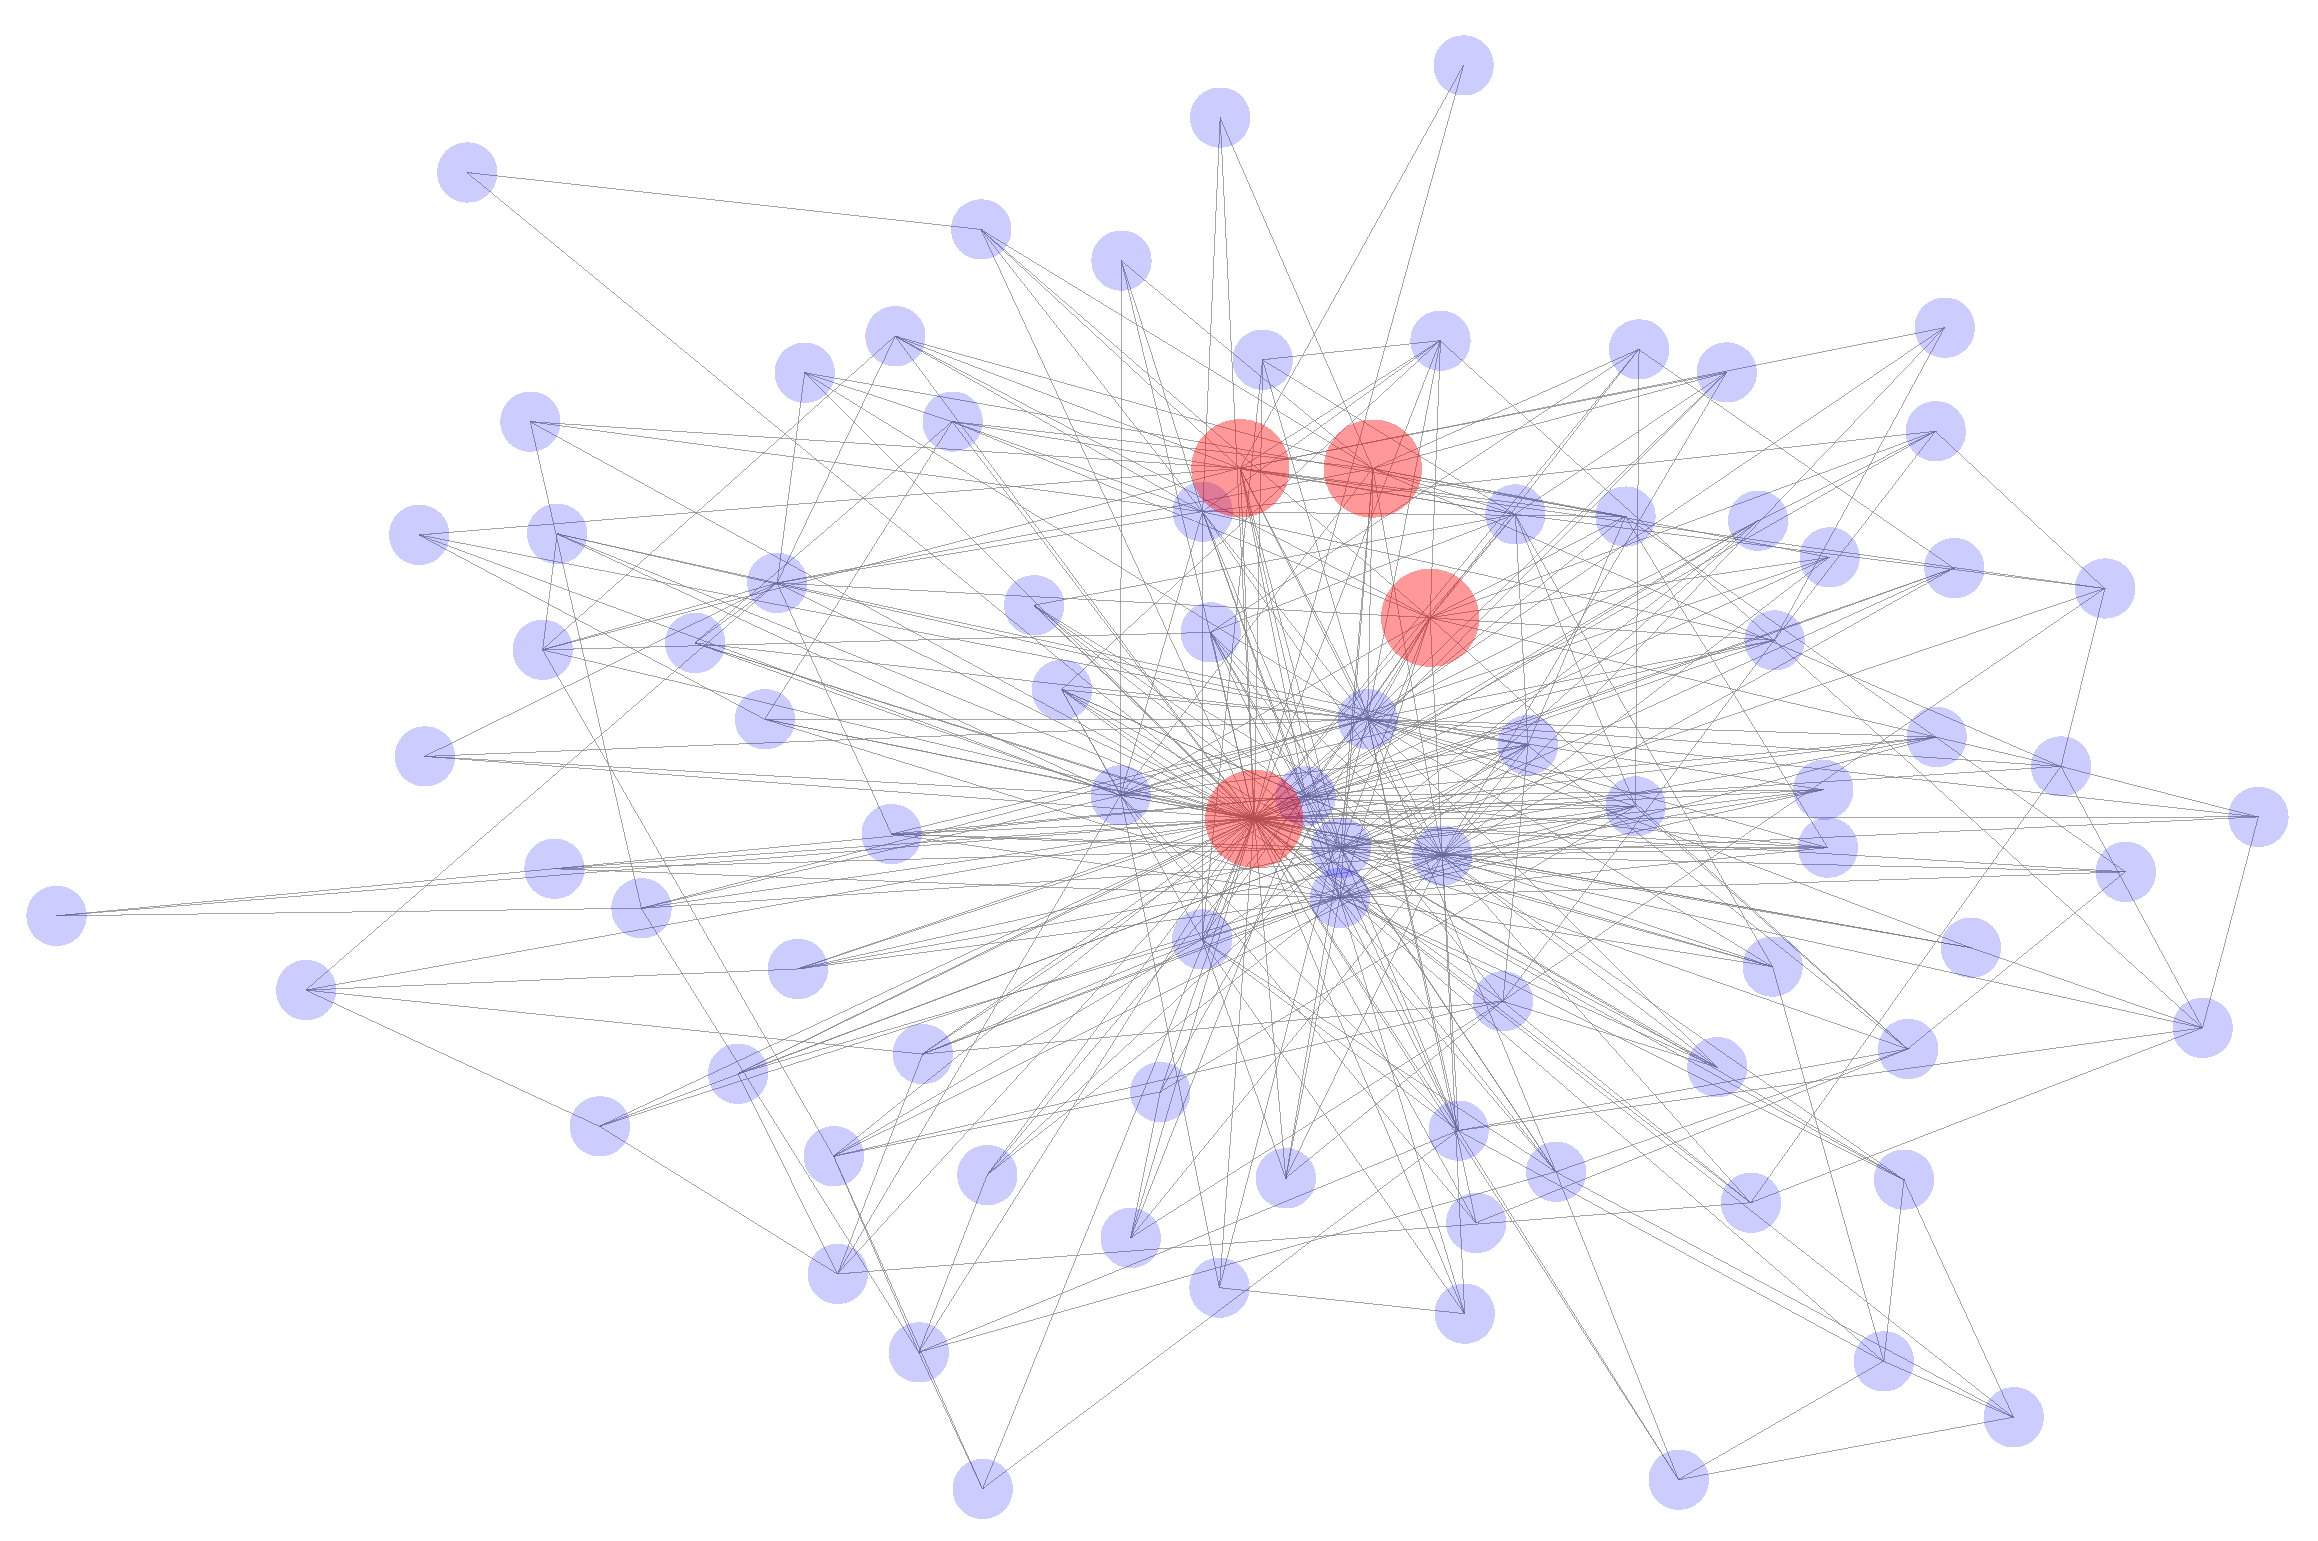
  • There is a very large amount of transaction data. Although only a few dozen nodes are shown in the figure, there are hundreds of edges among the nodes. Thus, it can be concluded that the transaction network is very complex.
  • There is an intricate relationship between the nodes. Figure 1 shows that the nodes in the transaction network are connected closely with other nodes, and there are multiple edges between nodes.
  • There is an imbalance in the data. Based on the figure, phishing nodes only account for a small proportion of the data compared to normal nodes, and this indicates that a serious data imbalance problem exists in the Ethereum transaction data.
Based on the observations stated above, we can identify the reason for the limitations in the model’s performance. First, a great deal of computational resources are needed to process large-scale transaction data. Second, the intricate relationships mean that naive edge handling approaches can lead to a loss of transaction information. Last but not least, the serious data imbalance problem causes models to inadequately learn phishing features. Most researchers alleviate these challenges via graph sampling (e.g., subgraph extraction) and graph filtering mechanisms. However, these methods have difficulty in obtaining global structural information. The lack of global structural information in the node embedding impacts the final phishing node detection.
Therefore, to fully benefit from the structural information of the transaction network and effectively solve the data imbalance problem, we propose a Bagging Multiedge Graph Convolutional Network (BM-GCN) model. The model simplifies the complex relationships between the nodes by breaking down the entire transaction network into three inter-node graphs. The advantage of this is that it facilitates the extraction of node features while preserving global structure information. The inter-node graph refers to the fact that each pair of nodes (a, b) in the graph has at most two edges, one from a to b and one from b to a. Specifically, in our approach, we preprocess the transaction data and generate three inter-node graphs to represent the property on the transaction graph. Then, the GCN model is utilized as the embedding generation method to make use of structural information in the graph. During the training of the GCN model, a bagging strategy is adopted to mitigate the impact of imbalanced data and unlabeled nodes. Consequently, our model can deal with large-scale data. To the best of our knowledge, this work is the first example that uses a bagging GCN for the detection of Ethereum phishing scams.
The remainder of this article is organized as follows. Section 2 addresses the research related to the subject of this article, and Section 3 presents the motivation for the research. Section 4 describes the BM-GCN model and the strategy that was used when we were training the model. In Section 5, we introduce the method of evaluating the effectiveness of the BM-GCN model and analyze the experimental results. Section 6 summarizes the contributions of this paper and presents our future research plans.

2. Related Work

2.1. Scams on Blockchain Platforms

With the development of blockchain technology and the growth of its community, the number of fraud attacks on digital currencies is increasing, and this has prompted researchers to analyze the scams. Vasek et al. [15] presented the first survey of Bitcoin-based scams; after gathering and combining the various reports of scams, they categorized the scams into four groups, i.e., Ponzi schemes, mining scams, scam wallets, and fraudulent exchanges. Since Ethereum is an extension of Bitcoin, it can also be categorized in these ways.
Bitcoin Ponzi schemes have received a great deal of attention because they are a classical form of economic deception. Vasek et al. [16] identified why Ponzi scams occur frequently in this ecosystem. Bartoletti et al. [17] analyzed this type of scheme on Ethereum and studied how Ponzi schemes are promoted on the web. To fuel the detection of Ponzi schemes on smart contracts, Chen et al. [18] provided an open dataset by gathering real-world samples, and they used a random forest model built on account features and code features to identify latent smart Ponzi schemes.

2.2. Detection of Phishing Scams on Ethereum

Phishing scams are among the most severe cybercrimes aimed at Ethereum users, and many efforts have been made to detect phishing [3]. Wu et al. [8] proposed trans2vec, which used a weighted random walk to generate the embeddings of nodes, and then employed a one-class SVM model to classify the embeddings to detect phishing nodes. Chen et al. [10] extracted graph-based cascade features from transaction records and developed a lightGBM-based dual-sampling ensemble algorithm to identify phishing accounts. Chen et al. [9] obtained statistics on the transaction information as features of nodes and then used a graph convolutional network (GCN) and autoencoder technology to extract the structural features of the subgraph. The output of the GCN and handcrafted features are concatenated to obtain the final result for classification. To detect potential phishing scammers, Zhang et al. [14] proposed a multi-channel graph classification model (MCGC) with multiple feature extraction channels for GNN to extract richer information from the input graph.
Although the approaches mentioned above have been able to complete the detection of Ethereum phishing, their methods of processing graph data are designed for simple subgraphs, thus ignoring the global structural information of the Ethereum transaction network. In addition, they do not work in multiedge graphs. To make full use of the transaction information and structural information, we propose a novel method that transforms the transaction network into some inter-node graphs for feature extraction.

2.3. Graph Embedding

Graph embedding transforms the data on the graph into a low-dimensional space while retaining the graph’s structural information and properties as much as possible [19]. This operation facilitates subsequent analytical tasks in both homogeneous and heterogeneous networks. Graph embedding methods can be roughly divided into three categories, i.e., random walk, matrix decomposition, and deep learning. The basic idea of random-walk-based graph embedding is to utilize SkipGram on a path set sampled by a truncated random walk on the graph data to obtain a node embedding [20,21]. Matrix decomposition methods factorize a proximity matrix that represents node relationships to obtain the node embedding [22]. For example, ProNE [23] learns embedding both rapidly and efficiently via matrix factorization with spectral propagation. The core idea of the deep learning methodology is to obtain a graph embedding directly from the graph structure through a deep neural network. For example, Kipf et al. [24] proposed the graph convolutional network (GCN), which introduced a variant of convolutional neural networks that can use graphs directly and match neighborhoods in the spatial domain.

3. Research Motivations

The Ethereum transaction network is a multiedge graph with a large number of transactions. In such a graph, phishing nodes generally make up only a tiny percentage of the nodes. Therefore, there are several factors that can impact the classification performance when constructing a phishing node detection scheme on the graph.

3.1. Challenges

Transaction graph has complex inter-node relationships
Generally, in the Ethereum transaction network, there are multiple transactions with varying amounts occurring at different times between two nodes. In other words, there will be multiple adjacent edges between nodes. Figure 2 shows a simple transaction graph with only five nodes. The simple addition of weights leads to the unexpected fusion of the features, which limits the effective utilization of the discrete properties.
Significant imbalance between phishing and normal nodes
In the Ethereum transaction network example presented in [25], there were 2,973,489 nodes and 13,551,303 transactions, but only 1165 phishing nodes. In other words, there was a significant imbalance between phishing and normal nodes, which can impact the results of the classification.
Unlabeled nodes
The labeling of phishing nodes relies on reports from users of specific websites, such as etherscamdb.info and etherscan.io. In other words, these websites can track phishing incidents only if they are reported, and significant numbers of frauds and scams are not reported [26,27]. Therefore, having these unknown/undetected phishing nodes in the “normal node” set can skew and impact the classifier’s performance, a situation that is also referred to as a Positive Unlabeled (PU) learning challenge.

3.2. Potential Solutions

We posit the potential of using the following approaches to mitigate the challenges discussed in Section 3.1.
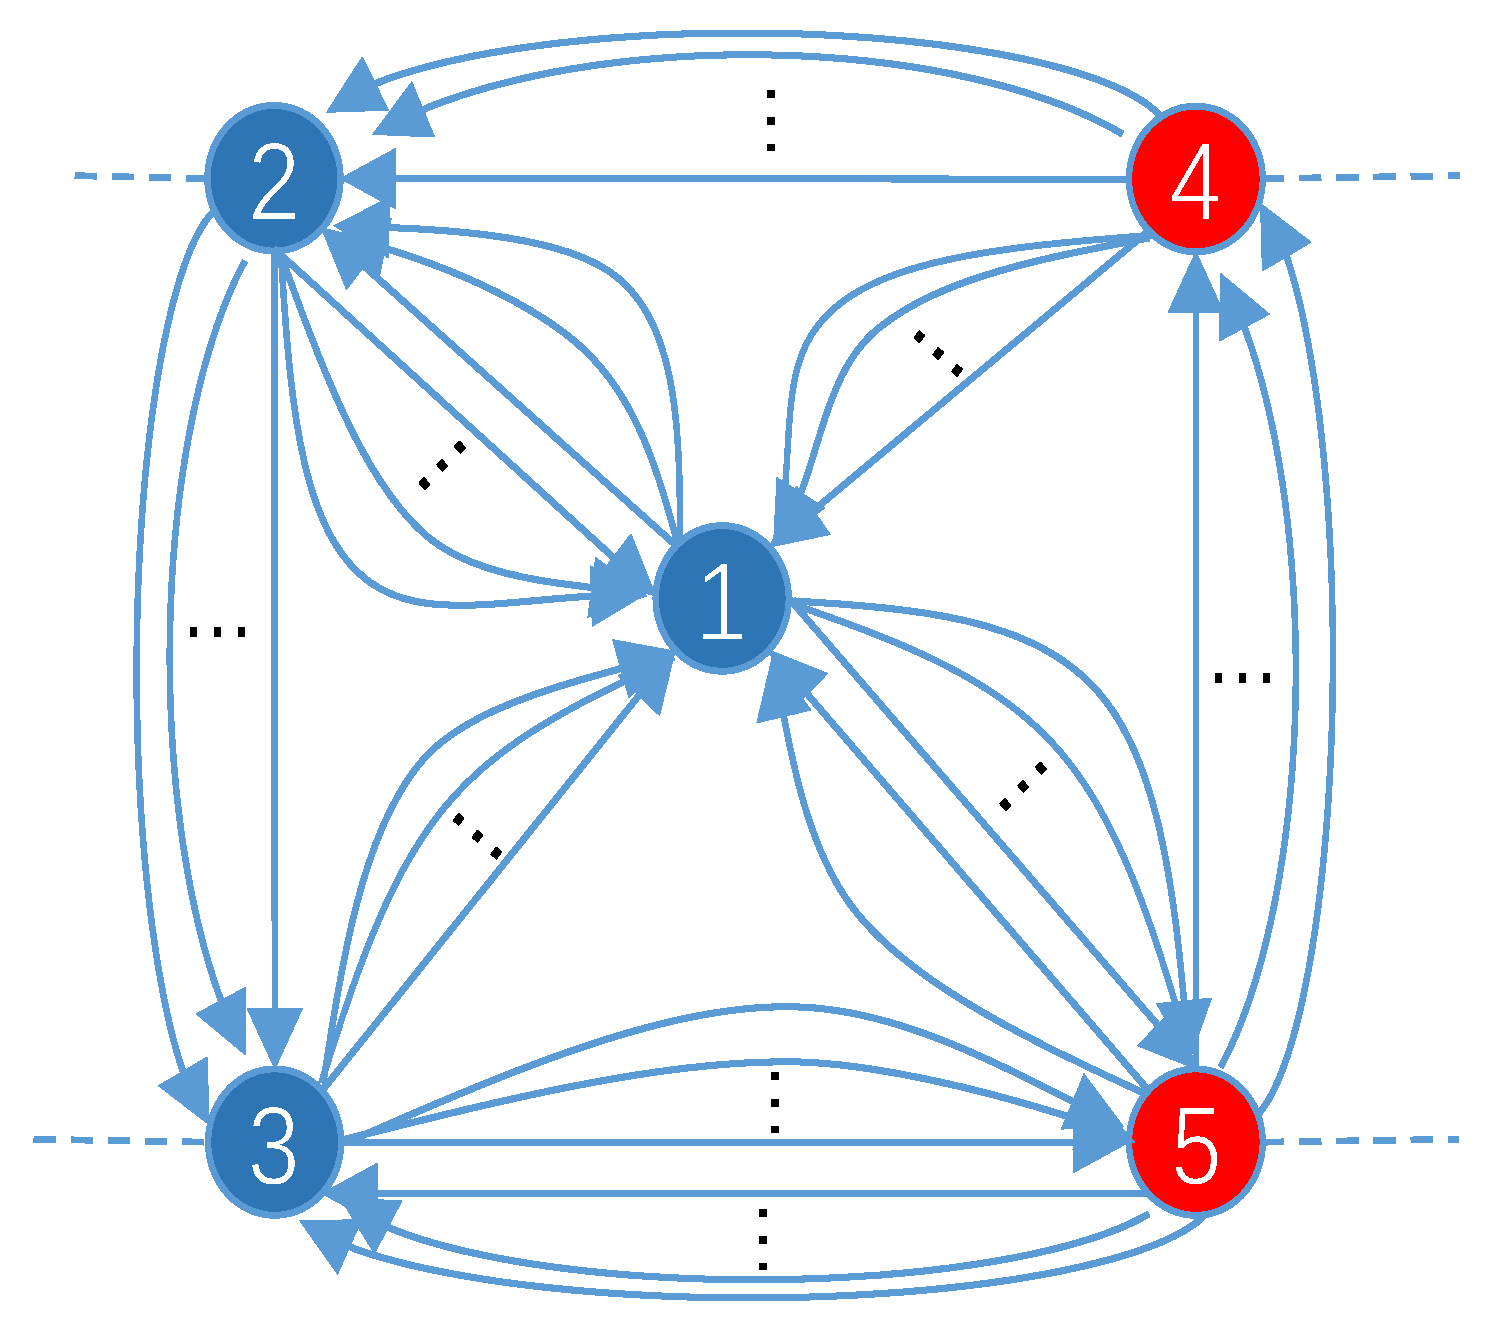
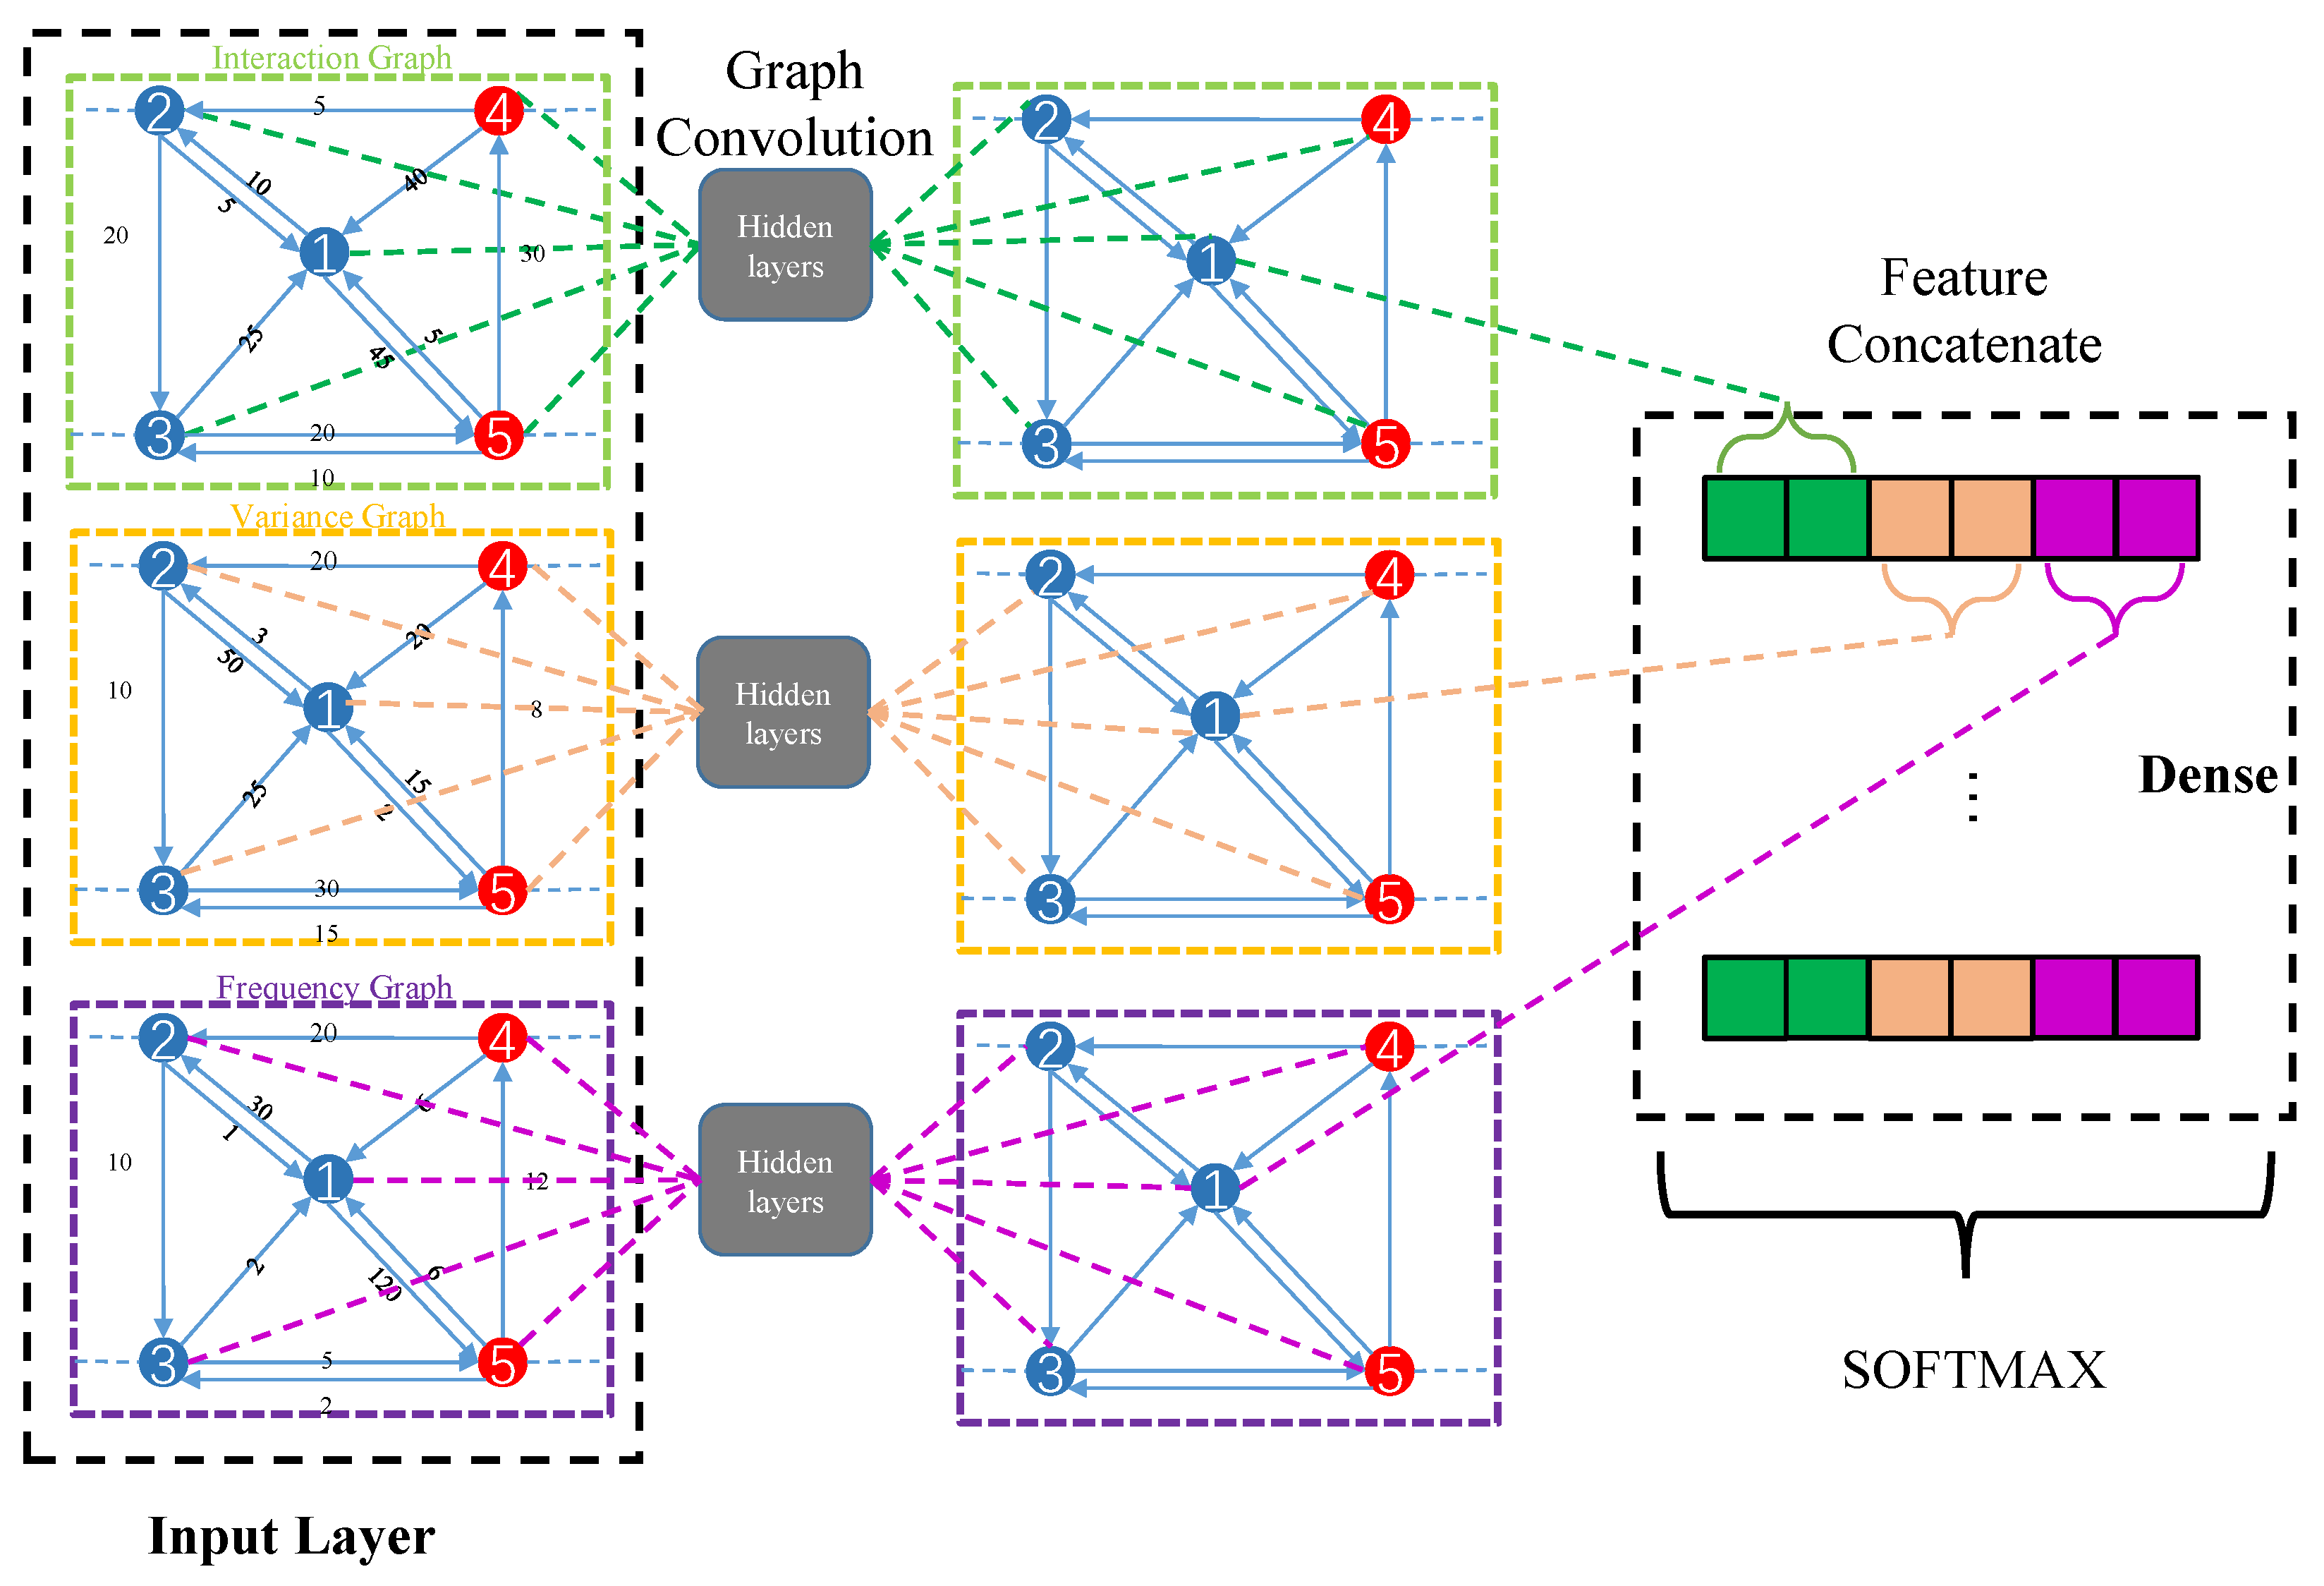
  • To address the multiedge graph problem, we extract three features from the transactions, i.e., inter-node interaction, transaction time variance, and transaction frequency. For each feature, we replace the edges between two nodes that have the same direction with a single directed edge and construct a feature graph to represent the information contained in the multiedges.
  • We use the bagging strategy [28] to deal with both data imbalances and the PU problem. In doing so, we use bootstrap aggregating techniques to leverage unlabeled data and mitigate the limitations associated with the PU problem. In addition, the sampling method used in the bagging strategy also minimizes the impact of the imbalance in the data on the classification results.

4. Proposed BM-GCN Model

4.1. Representing the Features of the Graph

Due to the complexity of Ethereum transaction networks, the use of GCN directly in the original network cannot effectively encode the topology around the nodes. Therefore, we consider extracting features from the original transaction network and transforming the complex network into three simple graphs, i.e., a node interaction graph, a time variance graph, and a transaction frequency graph. Then, we use the corresponding adjacency matrices, A i , A v , and A f , to represent the three feature graphs (see also Figure 3). Note that the transactions are directed and the matrices are not symmetrical.

4.1.1. Node Interaction Graph

Transaction records provide a significant amount of information to build inter-node graphs. For example, if many transaction records exist between node i and node j, there will be a closer relationship between these nodes than between nodes with fewer interactions. With this in mind, we constructed an interaction graph to indicate whether there are frequent interactions between two nodes. We denote I i , j as the trade number from i to j, and we build the interaction graph as follows:
G i ( V , E ) w e i g h t = T r a n s a c t i o n N u m b e r
A i = 0 I 0 , 1 I 0 , 2 I 0 , N 1 I 1 , 0 0 I 1 , N 1 I 2 , 0 I 2 , 1 0 I 2 , N 1 I N 1 , 0 0

4.1.2. Time Variance Graph

Intuitively, the interval of transaction time, which shows the changes in trading time between two nodes, can be used effectively to describe the transaction relationship between nodes. To introduce the time feature of transactions between nodes, we use the variance of the time of the transactions to construct the second inter-node graph. Let v i , j denote the variance in the transaction time from node i to j; the mean value of the transaction time from i to j is t i , j ¯ , the total number of transactions from i to j is n i , j , and the time of k-th transaction is τ k . The graph of the time variance is constructed as follows:
G v ( V , E ) w e i g h t = T r a n s a c t i o n T i m e V a r i a n c e
v i , j = k = 1 n i , j ( τ k t i , j ¯ ) 2 n i , j
A v = 0 v 0 , 1 v 0 , 2 v 0 , N 1 v 1 , 0 0 v 1 , N 1 v 2 , 0 v 2 , 1 0 v 2 , N 1 v N 1 , 0 0

4.1.3. Transaction Frequency Graph

We use the frequency of transactions between nodes as the weight to construct a graph; specifically, we introduce additional time information into our model, which reflects the average duration of the intervals of the transactions from node i to node j, also written as f i , j . We denote the transaction frequency from node i to j as the reciprocal of f i , j . This also ensures that high-frequency nodes have high weights. The frequency graph can be represented as follows:
G f ( V , E ) w e i g h t = T r a n s a c t i o n F r e q u e n c y
f i , j = 0 , n i , j = 1 k = 1 n i , j 1 τ k + 1 τ k n i , j , n i , j 2
A f = 0 1 f 0 , 1 1 f 0 , 2 1 f 0 , N 1 1 f 1 , 0 0 1 f 1 , N 1 1 f 2 , 0 1 f 2 , 1 0 1 f 2 , N 1 1 f N 1 , 0 0

4.2. GCN for Inter-Node Graphs

In this section, we model the phishing detection problem as a binary classification. The inputs of this model are the three feature graphs discussed earlier and the outputs of this model are the prediction labels of Ethereum nodes.
In our model, we use the layer-wise propagation rule of Kipf et al. [24] to build a multilayer GCN. The rule is as follows:
H ( l + 1 ) = σ M ˜ 1 2 A ˜ M ˜ 1 2 H ( l ) W ( l )
In the above equation, A ˜ = A + I N denotes the adjacency matrix of the graph G with self-connections added, I N is the identity matrix, M ˜ i i = j A ˜ i j and W ( l ) are the trainable weight matrices, σ ( · ) is the activation function, and H ( l ) R N × D is the matrix of activations in the l-th layer, H ( 0 ) = X .
Then, we use the propagation rule mentioned above to build a GCN. For each feature graph, we use graph convolution to generate the embedding of the feature, which is shown on the left side of Figure 4. The input graph G is denoted by G = { n 1 , n 2 , . . . , n | V | } , where n i is the i-th node, and x i is the representation of n i . For the three feature graphs { G i , G v , G f } in our model, we denote the vector of the i-th node as { x i i , x i v , x i f } .
In order to predict the labels of nodes, we concatenate the outputs of three GCN models as X i = ( x i i : x i v : x i f ) , and use a dense layer y = f ( w · X + b ) and a softmax layer to obtain the predictions of node labels. The softmax function is as follows:
p i = exp y i k = 1 n exp y k

4.3. Bagging

Considering that there are many unlabeled phishing nodes in the transaction data and the distribution of positive and negative examples in the data is very asymmetrical, we use the transductive bagging strategy [28] to construct a bagging learning approach dealing with both data imbalances and the PU problem in the transaction graph.
The method that we propose for PU learning in the transaction data is presented in Algorithm 1. It creates a training set, S, by combining all positive nodes and sampled unlabeled nodes randomly and using S to train a classifier. Then, labeled and unlabeled samples are treated as positive and negative, respectively. For each S, the algorithm uses the Adam optimizer to update the w parameter of the model.
Algorithm 1 Bagging learning
Input:  P , U , K = size of bootstrap samples, T = number of bootstraps
Output: a function f : X R
  for  t = 1 to T do
     Draw a bagging sample U t of size K in U.
     Make a bootstrap set S from P and U t with corresponding labels.
     Use bootstrap set S to train the classifier f to discriminate P against U t .
     while stopping criterion not met do
          Update w with Adam optimizer
     end while
  end for
  return f

5. Evaluation

In this section, we demonstrate that our approach can deal with both data imbalances and the PU problem while fully utilizing the graph structure information for the detection of phishing.
First, we introduce the dataset and metrics used in the evaluation. Next, we evaluate the performance of Wu et al.’s approach [8] over different network scales and different negative–positive ratios (NP ratios). To verify the effectiveness of our approach, we conduct the following evaluations: (1) we evaluate the effects of feature numbers to determine their performance with varying NP ratios; (2) we evaluate the effectiveness of our approach in dealing with data imbalances; (3) we evaluate the effectiveness of our approach in dealing with the PU problem. Finally, we present a comparative summary of the performance of our approach with several graph-embedding-based methods.

5.1. Dataset and Evaluation Metrics

We evaluated our model using the dataset of Chen et al. [25] which is available at https://xblock.pro/#/dataset/13. The dataset contains 2,973,489 Ethereum accounts, 13,551,303 transactions, and 1165 labeled accounts. The transaction time in the dataset starts on 7 August 2015 and ends on 19 January 2019. We constructed a transaction graph using accounts as nodes and transactions as edges, and we transformed it into three inter-node graphs as the input to our classification model.
We used the Area Under the Curve (AUC) of the Receiver Operating Characteristic (ROC) curve as an evaluation metric. In the testing phase, we calculated both the True Positive Rate (TPR) and the False Positive Rate (FPR) of the classification result, with T as the varying parameter, where T is the threshold of probability X that the node is classified as “positive” if X > T and “negative” otherwise. Then, the ROC curve was defined by FPR and TPR as the x and y axes, respectively. To evaluate the performance of each baseline model, we used different ratios of both positive and negative instances.
Since the performance of schemes given different positive and negative proportions varies dramatically, we evaluated the classification results of several models using different NP ratio numbers.

5.2. Baseline Methods

We empirically compared the performance of our proposed approach with the performance of the Support Vector Machine (SVM), Logistic Regression (LR), and Random Forest (RF).
  • SVM represents the examples as vectors in space, and it chooses a hyperplane that represents the largest separation between examples in order to classify them.
  • As a statistical classification method, LR models a binary dependent variable using a logistic function and obtains the corresponding probability of the class of examples.
  • RF is an ensemble learning method that constructs a large number of decision trees at training time and outputs the modes of the classes as the classification result.
Since the above classification approaches require vectors as input, we utilized Deepwalk [20], trans2vec [8], ProNE [23], and NETSMF [22] to obtain node embeddings for the baseline methods.
DeepWalk is the first Word2vec-based node vectorization model. It uses the random walking paths of nodes on the network to imitate the process of generating text, and then treats the paths of the nodes as the equivalents of sentences and applies the language model to vectorize each node. Trans2vec introduces biased random walks to determine whether each walk is affected by transaction time bias or amount bias, and then it concatenates these two biases to balance their effects.
Different from DeepWalk and Trans2vec, ProNE and NETS-MF use matrix factorization directly to embed graphs. We introduce them into the baseline system to evaluate our scheme from another perspective. The embedding vector generated by ProNE contains both localized smoothing information and global clustering information, making it able to utilize the graph information more effectively. NETSMF is proposed to provide an efficient way to obtain embeddings from large graphs.
The baseline models were DeepWalk-SVM, DeepWalk-LR, DeepWalk-RF, Trans2vec-SVM, Trans2vec-LR, Trans2vec-RF, ProNE-SVM, ProNE-LR, ProNE-RF, NETSMF-SVM, NETS-MF-LR, and NETSMF-RF. We ran these baseline models on the entire transaction network and obtained the corresponding embeddings for all nodes. To ensure that the comparison was relatively fair, we used the publicly released source codes in the DeepWalk and ProNE papers and their default parameters. For Trans2vec, we added random walking weights in the source code of DeepWalk, following the parameters proposed in [8] to build this baseline model. Moreover, for NETSMF, we also used their source code. However, we reduced the number of training rounds to 80 due to the high usage of memory during training. (After only 80 rounds of training on the Ethereum transaction data, NETSMF had used more than 200 GB of memory.)

5.3. Findings

In our evaluations, we followed the guideline in [28] to set our bagging parameters, which were T = 100 and K = 1165 . The parameters of our GCN were as follows: the number of hidden layers was 3, and the units of hidden layers 1, 2, and 3 were 16, 16, and 8, respectively. The maximum epoch number per bag was 20, the learning rate was 0.01, and the dropout rate was set to 0.5. We selected the value of the NP ratio among the following: 5, 10, 20, 50, 100, 200, 500, and “All”, where “All” means that we used all nodes in the experiment (the NP ratio was 2,972,324:1165).
Evaluation of Wu et al.’s method: Figure 5 shows the performance of Wu et al.’s approach [8] for various NP ratios and graph scales. For each scale, we constructed three test graphs following the approach, and we used their average AUC when evaluating the performance. The average node and edge numbers are provided in Table 1. The following two limitations can be observed in their scheme.
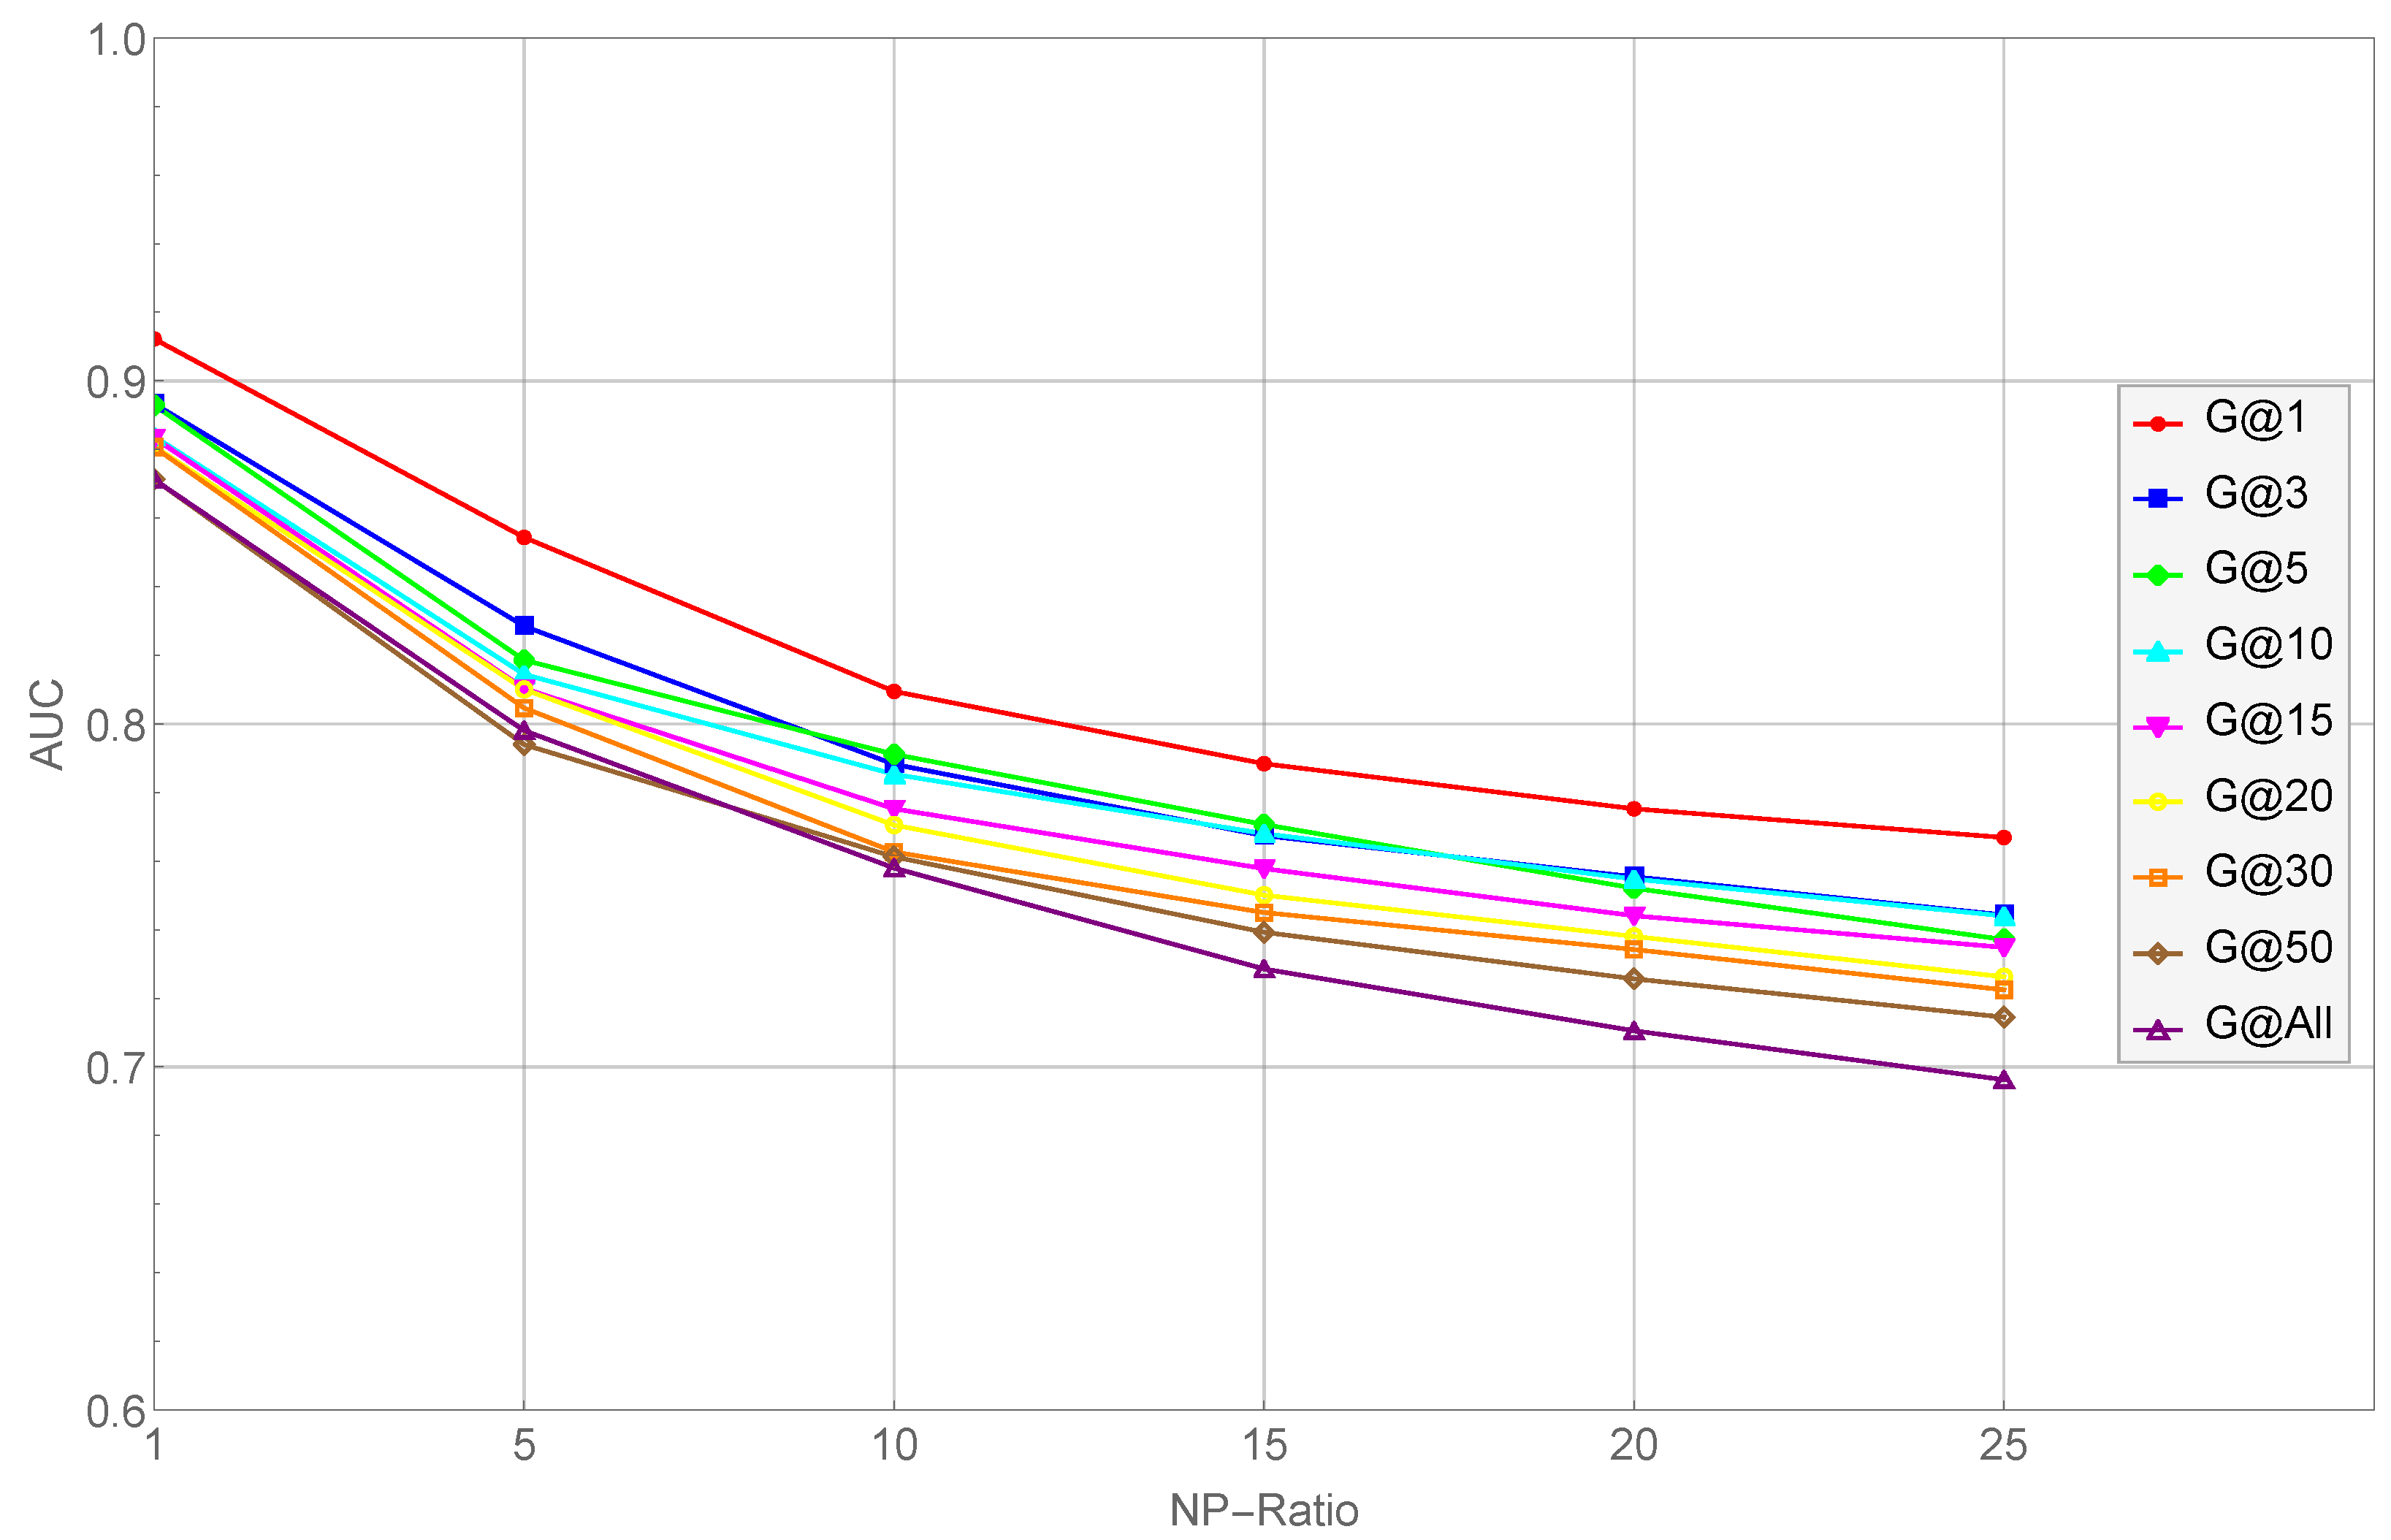
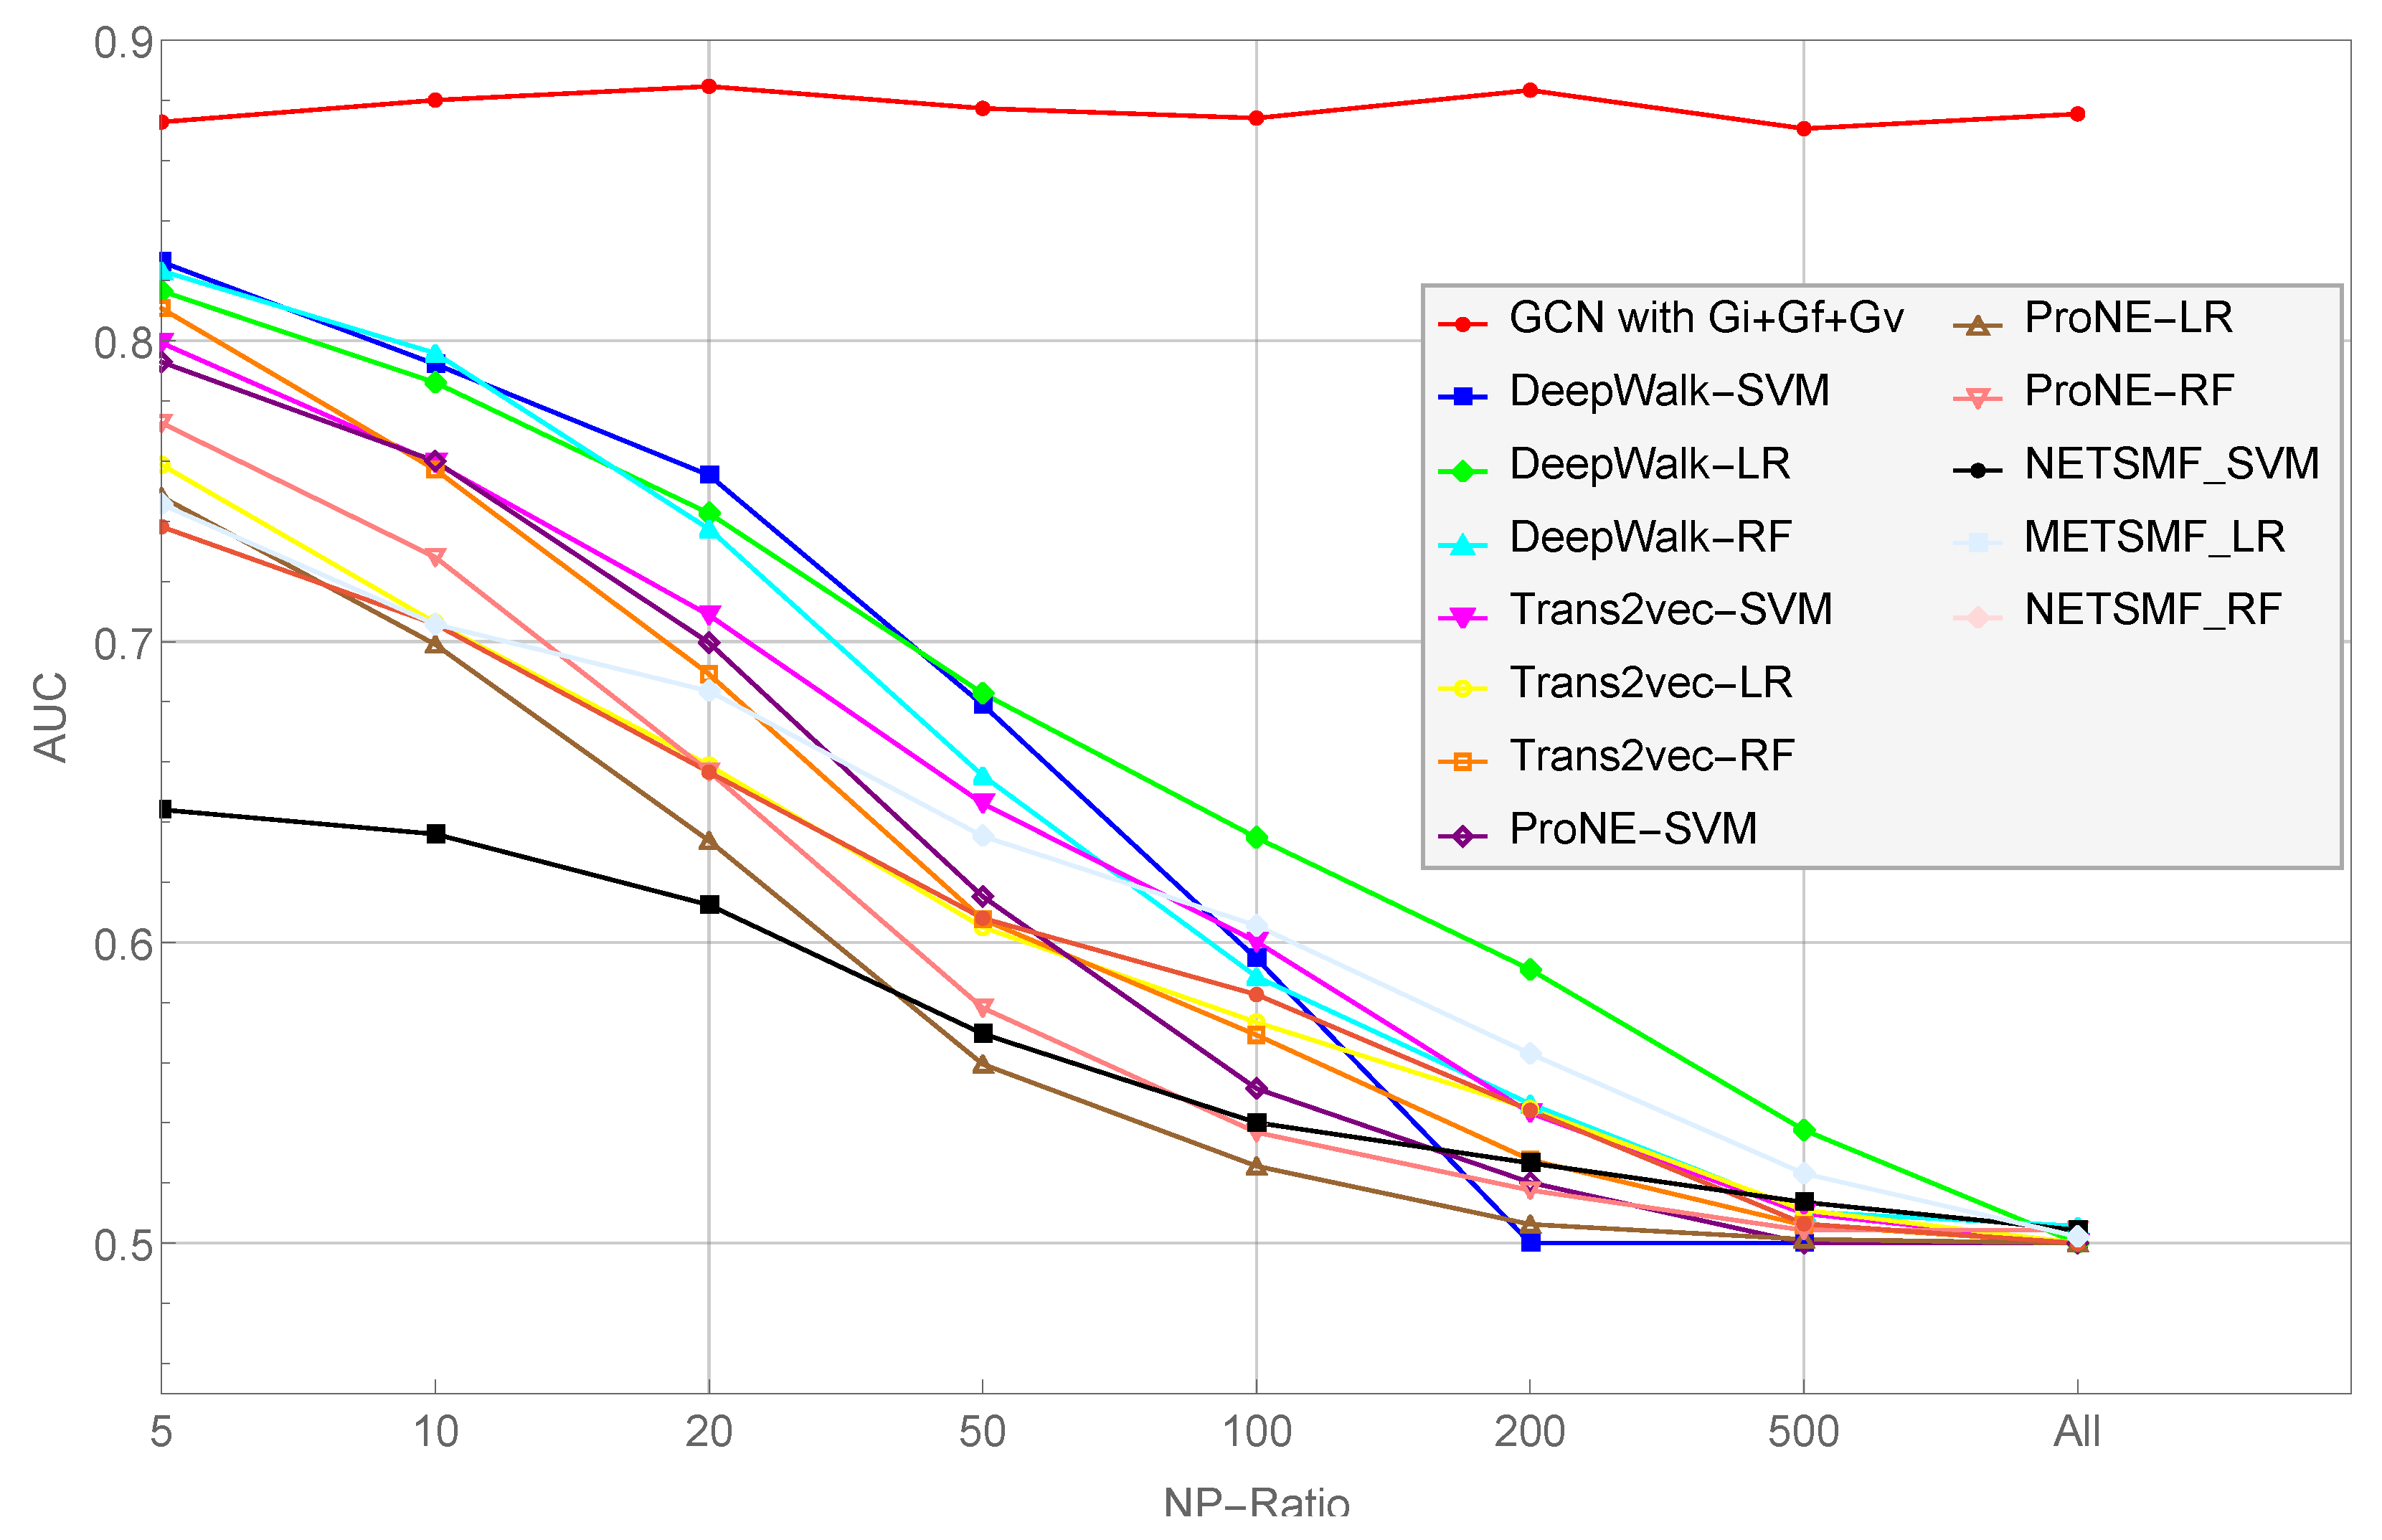
  • As the NP ratio increases, the performance of their scheme decreases consistently. Specifically, the average classification AUC value of Trans2vec decreased from 0.886 to 0.732 when the NP ratio increased from 1 to 25. In other words, Trans2vec is not capable of dealing with data imbalances.
  • As the network scales, the performance of their model decreases gradually. In other words, the scale of the network impacts the node representation capabilities of their scheme and degrades the classification performance (i.e., Trans2vec is not inadequate for large-scale transaction graphs).
Effect of different features: We evaluated the effect of different feature combinations on the proposed BM-GCN model using two NP ratios, i.e., 50 and “All”. Table 2 displays the aggregate AUC of the GCN with different feature combinations. We observe that the classification performance is most significantly improved by the feature G i out of the three analyzed. For multiple feature combinations, we found that the combination of G i , G f , and G v worked best. G i is an indicator that describes the total number of transactions between nodes, which evidently reflects the closeness of the relationships between nodes. It outperforms the other two. G f and G v describe the time properties of transactions from the perspective of transaction frequency and changes in transaction time. This combination effectively improves the AUC value as they complement each other. The combination of all three features allows us to achieve the best classification performance. This implies that the features reflect the topological characteristics of the nodes to a certain extent, and our transaction feature extraction scheme is effective.
Bagging vs. no bagging: In this section, we maintain the NP ratio to evaluate the impact of removing the bagging strategy on the classification performance of the model. As shown in Table 3, in the case of no bagging, the classification performance of the model decreases rapidly as the NP ratio increases. Even when the NP ratio is equal to 50, the AUC of the model drops below 0.5. The findings show that if the bagging strategy is not used in the model’s training process, the original GCN solution will not be able to cope with extreme data imbalances in the Ethereum transaction network and detect phishing nodes effectively.
Evaluation of the PU problem: Next, we utilized the spy technique [29] to set false negative examples to evaluate the robustness of our model with respect to the PU problem. In the evaluation, we selected 15% positive examples and set them as negative examples, and we placed them in the training set to simulate the PU problem in the training set. Then, we checked whether these examples that were intentionally marked as negative examples could be detected by the model. Specifically, we evaluated the classification performance of the BM-GCN model with 173 spy nodes at NP ratios of 5, 20, 50, and “All”.
Table 4 shows the model’s capability of recovering spy nodes’ labels. It also indicates that the AUC value of classification increases as the NP ratio increases, which intuitively reflects the negative impact of unlabeled data. For small datasets, such as when the NP ratio equals 5, there are only 4141 negative examples. Thus, the introduction of 173 unlabeled nodes confuses the model significantly, resulting in the degradation of its performance. However, even in the worst case, 97.6 of the 173 spy nodes are restored successfully by the model. Thus, our model effectively avoids the adverse impact of the unlabeled nodes on the results of the classification. In addition, it illustrates that our model can deal with the PU problem in the Ethereum transaction data.
Baseline evaluation: Figure 6 shows the aggregate AUC of our approach and all of the baselines with varying NP ratios. We can see that the model (GCN with G i + G f + G v ) outperforms all of the baseline systems. First, on the entire range of NP ratios, our model achieves a higher AUC than all of the baselines. Second, the BM-GCN model achieves an average AUC of 0.877, whereas the Deepwalk-LR only achieves an average AUC of 0.661. Thus, we conclude that our BM-GCN model uses more transaction information than other models. Moreover, our model is more robust than all of the baseline models. For example, Figure 6 shows that the performance of all the baselines decreased rapidly as the NP ratio increased, but our scheme remained stable. This implies the potential in using our BM-GCN model for larger datasets.
Comparison with other methods: Table 5 shows the comparison between the proposed method and other methods in terms of the AUC metric. All the methods use transaction data for phishing node detection. However, compared to other methods that directly use raw transaction data or relevant statistical features, BM-GCN extracts the global structural features and preprocesses the raw transaction information into three types of interactive information, i.e., node interaction, time variance, and transaction frequency. As shown in Table 5, our method achieves the best results.

6. Conclusions

In this work, we introduce a BM-GCN model to detect phishing scams targeting Ethereum. This model extracts features of transactions by converting the multiedge transaction graph into several simple graphs. A bagging strategy is introduced during the training of the BM-GCN model to deal with the PU problem and the data imbalance problem in the transaction data. Compared with the baselines, BM-GCN is more effective in three respects: (1) it fully uses complex relations in multiedges; (2) it is able to cope with the problems of data imbalance and unlabeled nodes in the Ethereum transaction network; and (3) the model performs well on both small- and large-scale graphs.
Future research will include conducting systematic statistical tests to make the experimental results more convincing and extending this work to evaluate Ethereum-related transactions in real time. These tasks will require collaboration with the relevant stakeholders.

Author Contributions

Conceptualization, Z.Z. and T.H.; Data curation, K.C. and B.Z.; Formal analysis, K.C. and B.Z.; Funding acquisition, Z.Z., Q.W. and L.Y.; Investigation, Z.Z., K.C. and B.Z.; Methodology, Z.Z. and T.H.; Project administration, Z.Z.; Resources, K.C. and B.Z.; Software, T.H., K.C. and B.Z.; Supervision, Z.Z., Q.W. and L.Y.; Validation, T.H., K.C. and B.Z.; Visualization, T.H.; Writing—original draft, Z.Z. and T.H.; Writing—review and editing, Z.Z., T.H., Q.W. and L.Y. All authors have read and agreed to the published version of the manuscript.

Funding

This research was funded by the “Pioneer” and “Leading Goose” R&D Program of Zhejiang (Grant No. 2023C03203, 2023C03180, 2022C03174).

Institutional Review Board Statement

Not applicable.

Informed Consent Statement

Not applicable.

Data Availability Statement

All data included in this study are available upon request by contacting the corresponding author.

Conflicts of Interest

The authors declare no conflict of interest.

References

  1. Chainalysis Team. The 2022 Crypto Crime Report. 2022. Available online: https://blog.chainalysis.com/reports/2022-crypto-crime-report-introduction/ (accessed on 8 April 2022).
  2. Onyema, E.; Dinar, A.; Ghouali, S.; Merabet, B.; Merzougui, R.; Feham, M. Cyber Threats, Attack Strategy, and Ethical Hacking in Telecommunications Systems. In Security and Privacy in Cyberspace; Springer: Berlin/Heidelberg, Germany, 2022; pp. 25–45. [Google Scholar]
  3. Varshney, G.; Misra, M.; Atrey, P.K. A survey and classification of web phishing detection schemes: Phishing is a fraudulent act that is used to deceive users. Secur. Commun. Networks 2016, 9, 6266–6284. [Google Scholar] [CrossRef]
  4. Xiang, G.; Hong, J.; Rose, C.P.; Cranor, L. CANTINA+: A Feature-Rich Machine Learning Framework for Detecting Phishing Web Sites. ACM Trans. Inf. Syst. Secur. 2011, 14, 1–28. [Google Scholar] [CrossRef]
  5. Kausar, F.; Al-Otaibi, B.; Al-Qadi, A.; Al-Dossari, N. Hybrid client side phishing websites detection approach. Int. J. Adv. Comput. Sci. Appl. 2014, 5, 132–140. [Google Scholar] [CrossRef]
  6. Ramesh, G.; Krishnamurthi, I.; Kumar, K.S.S. An efficacious method for detecting phishing webpages through target domain identification. Decis. Support Syst. 2014, 61, 12–22. [Google Scholar] [CrossRef]
  7. Chen, T.C.; Stepan, T.; Dick, S.; Miller, J. An Anti-Phishing System Employing Diffused Information. ACM Trans. Inf. Syst. Secur. 2014, 16, 1–31. [Google Scholar] [CrossRef]
  8. Wu, J.; Yuan, Q.; Lin, D.; You, W.; Chen, W.; Chen, C.; Zheng, Z. Who Are the Phishers? Phishing Scam Detection on Ethereum via Network Embedding. arXiv 2019, arXiv:1911.09259. [Google Scholar] [CrossRef]
  9. Chen, L.; Peng, J.; Liu, Y.; Li, J.; Xie, F.; Zheng, Z. Phishing scams detection in ethereum transaction network. ACM Trans. Internet Technol. (TOIT) 2020, 21, 1–16. [Google Scholar] [CrossRef]
  10. Chen, W.; Guo, X.; Chen, Z.; Zheng, Z.; Lu, Y. Phishing Scam Detection on Ethereum: Towards Financial Security for Blockchain Ecosystem. In Proceedings of the 29th International Joint Conference on Artificial Intelligence, Yokohama, Japan, 7–15 January 2020; pp. 4506–4512. [Google Scholar]
  11. Wu, J.; Liu, J.; Zhao, Y.; Zheng, Z. Analysis of cryptocurrency transactions from a network perspective: An overview. J. Netw. Comput. Appl. 2021, 190, 103139. [Google Scholar] [CrossRef]
  12. Yuan, Z.; Yuan, Q.; Wu, J. Phishing Detection on Ethereum via Learning Representation of Transaction Subgraphs. Blockchain Trust. Syst. 2020, 1267, 178–191. [Google Scholar]
  13. Wang, J.; Chen, P.; Yu, S.; Xuan, Q. Tsgn: Transaction subgraph networks for identifying ethereum phishing accounts. In Proceedings of the International Conference on Blockchain and Trustworthy Systems, Guangzhou, China, 5–6 August 2021; Springer: Berlin/Heidelberg, Germany, 2021; pp. 187–200. [Google Scholar]
  14. Zhang, D.; Chen, J.; Lu, X. Blockchain Phishing Scam Detection via Multi-channel Graph Classification. In Proceedings of the International Conference on Blockchain and Trustworthy Systems, Guangzhou, China, 5–6 August 2021; Springer: Berlin/Heidelberg, Germany, 2021; pp. 241–256. [Google Scholar]
  15. Vasek, M.; Moore, T. There’s No Free Lunch, Even Using Bitcoin: Tracking the Popularity and Profits of Virtual Currency Scams. In Proceedings of the International Conference on Financial Cryptography and Data Security, San Juan, Puerto Rico, 26–30 January 2015; pp. 44–61. [Google Scholar]
  16. Vasek, M.; Moore, T. Analyzing the Bitcoin Ponzi Scheme Ecosystem. In International Conference on Financial Cryptography and Data Security; Springer: St. Kitts, Saint Kitts and Nevis, 2019; pp. 101–112. [Google Scholar]
  17. Bartoletti, M.; Carta, S.; Cimoli, T.; Saia, R. Dissecting Ponzi schemes on Ethereum: Identification, analysis, and impact. Future Gener. Comput. Syst. 2020, 102, 259–277. [Google Scholar] [CrossRef]
  18. Chen, W.; Zheng, Z.; Ngai, E.C.; Zheng, P.; Zhou, Y. Exploiting Blockchain Data to Detect Smart Ponzi Schemes on Ethereum. IEEE Access 2019, 7, 37575–37586. [Google Scholar] [CrossRef]
  19. Cai, H.; Zheng, V.W.; Chang, K.C. A Comprehensive Survey of Graph Embedding: Problems, Techniques and Applications. arXiv 2018, arXiv:1709.07604. [Google Scholar] [CrossRef]
  20. Perozzi, B.; Al-Rfou, R.; Skiena, S. DeepWalk: Online learning of social representations. In Proceedings of the 20th ACM SIGKDD International Conference on Knowledge Discovery and Data Mining, New York, NY, USA, 24–27 August 2014; pp. 701–710. [Google Scholar]
  21. Grover, A.; Leskovec, J. Node2vec: Scalable Feature Learning for Networks. In Proceedings of the 22nd ACM SIGKDD International Conference on Knowledge Discovery and Data Mining, New York, NY, USA, 13–17 August 2016; pp. 855–864. [Google Scholar]
  22. Qiu, J.; Dong, Y.; Ma, H.; Li, J.; Wang, C.; Wang, K.; Tang, J. NetSMF: Large-Scale Network Embedding as Sparse Matrix Factorization. In Proceedings of the World Wide Web Conference, San Francisco, CA, USA, 13–17 May 2019; pp. 1509–1520. [Google Scholar]
  23. Zhang, J.; Dong, Y.; Wang, Y.; Tang, J.; Ding, M. ProNE: Fast and Scalable Network Representation Learning. In Proceedings of the 28th International Joint Conference on Artificial Intelligence, Macao, China, 10–16 August 2019; pp. 4278–4284. [Google Scholar]
  24. Kipf, T.N.; Welling, M. Semi-supervised classification with graph convolutional networks. arXiv 2016, arXiv:1609.02907. [Google Scholar]
  25. Chen, L.; Peng, J.; Liu, Y.; Li, J.; Xie, F.; Zheng, Z. XBLOCK Blockchain Datasets: InPlusLab Ethereum Phishing Detection Datasets. 2019. Available online: http://xblock.pro/ethereum/ (accessed on 8 April 2020).
  26. Team, C. Crypto Crime Series: Decoding Ethereum Scams. 2019. Available online: https://blog.chainalysis.com/reports/ethereum-scams (accessed on 8 April 2020).
  27. Redman, J. Data Shows Ethereum is the ‘Cryptocurrency of Choice for Scams’. 2019. Available online: https://news.bitcoin.com/data-shows-ethereum-is-the-cryptocurrency-of-choice-for-scams/ (accessed on 8 April 2020).
  28. Mordelet, F.; Vert, J.P. A bagging SVM to learn from positive and unlabeled examples. Pattern Recognit. Lett. 2014, 37, 201–209. [Google Scholar] [CrossRef]
  29. Liu, B.; Dai, Y.; Li, X.; Lee, W.S.; Yu, P.S. Building text classifiers using positive and unlabeled examples. In Proceedings of the 3rd IEEE International Conference on Data Mining, Melbourne, FL, USA, 9–12 November 2003; pp. 179–188. [Google Scholar]
Figure 1. Part of the Ethereum transaction network in which multiedges between nodes are simplified to a single edge. In this network, scam nodes and normal nodes are marked in red and blue, respectively.
Applsci 13 06430 g001
Figure 2. A simple multiedge graph example in the transaction network. It can be observed in this figure that there are many edges between nodes, and these edges have different amounts of transactions and time. Thus, it is challenging to merge them. When the number of transactions is greater than three, we use the symbol “…” to represent the remaining transactions.
Applsci 13 06430 g002
Figure 3. Feature representation: The property of the transaction graph is extracted into three inter-node graphs, and the matrices in the right part show the feature representation of each graph. The numbers in the graphs and matrices are only examples, not the actual information in the transaction network.
Applsci 13 06430 g003
Figure 4. GCN classification model. On the left is the GCN used to learn the different structures of the three feature graphs. Although the three graphs have the same topology, the weights of their edges are different. On the right is the concatenation of the output of the previous GCNs with the dense layer and softmax layer for classification.
Applsci 13 06430 g004
Figure 5. Curves of average AUC of Wu et al.’s model [8], with varying NP ratios. Each curve represents a network scale, and it refers to the number after “G” in the legend. It indicates the proportion of positive and negative examples when the network is initialized.
Applsci 13 06430 g005
Figure 6. Curves showing the average AUC values of our model and the baseline models as the NP ratio is increased from 5 to “All”.
Applsci 13 06430 g006
Table 1. Average scale of different test graphs.
ScaleNode NumberEdge Number
132,58270,082
339,60695,154
545,397134,552
1059,250188,875
1576,344241,639
2090,388283,260
30119,368375,159
50162,388535,819
All2,973,48913,551,303
Table 2. AUC with different features.
FeaturesNP-Ratio@50NP-Ratio@All
G f 0.8525910.851575
G v 0.8634510.848624
G i 0.8726300.867106
G f + G v 0.8610690.867045
G f + G i 0.8678510.855019
G v + G i 0.8696120.875120
G i + G f + G v 0.8833250.875443
Table 3. AUC without bagging strategy.
NP RatioNo BaggingBagging
50.8557520.870561
100.7981140.880036
200.7457650.877302
500.4958230.883325
Table 4. Results of the spy test.
NP RatioRestored NodesAUC
597.60.819079
20115.80.852759
50123.00.858245
All133.60.870821
Table 5. Comparison with other methods.
MethodsFeaturesAUC
Chen et al. [9]Handcrafted features + local structural features0.5866
Chen et al. [10]Handcrafted features0.8071
Zhang et al. [14]Hierarchical structural features0.8274
BM-GCNGlobal structural features0.8771
Disclaimer/Publisher’s Note: The statements, opinions and data contained in all publications are solely those of the individual author(s) and contributor(s) and not of MDPI and/or the editor(s). MDPI and/or the editor(s) disclaim responsibility for any injury to people or property resulting from any ideas, methods, instructions or products referred to in the content.

