Abstract
Rapid and accurate anomaly traffic detection is one of the most important research problems in cyberspace situational awareness. In order to improve the accuracy and efficiency of the detection, a two-stage anomaly detection method based on user preference features and a deep fusion model is proposed. First, a user-preference list of attack detection tasks is constructed based on the resilient distributed dataset. Following that, the detection tasks are divided into multiple stages according to the detection framework, which allows multiple worker hosts to work in parallel. Finally, a deep fusion classifier is trained using the features extracted from the input traffic data. Experimental results indicate that the proposed method achieves better detection accuracy compared to the existing typical methods. Furthermore, compared with stand-alone detection, the proposed method can effectively improve the time efficiencies of the model’s training and testing to a large extent. The ablation experiment justifies the use of the machine learning method.
1. Introduction
Due to the expanding volume of cyberspace, new attack surfaces are introduced. Faced with massive network traffic, a severe problem to be solved for the cyberspace situation awareness system is how to perceive threats quickly and accurately, which appears extremely urgent. Rapid and accurate anomaly traffic detection is an effective means to improve the ability to perceive network threats, which has been considered a research hotspot in recent years.
Anomaly detection methods for network traffic can be roughly divided into two categories: rule-based anomaly traffic detection and deep learning-based anomaly traffic detection. Rule-based anomaly detection needs to design statistical rules by analyzing a certain feature of the traffic. For instance, some studies have proposed a method of attack detection and traceability based on information entropy [1,2,3], and some studies have tried to use parallelization technology to accelerate the detection and classification of anomaly traffic [4]. Rule-based anomaly traffic detection is often determined by classical machine learning methods. However, with the extension of network boundaries, traditional machine learning methods now and again face problems such as lack of learning, high false positive rates, and weak generalization ability when dealing with massive dynamic network traffic.
In recent years, the remarkable achievements of deep learning in various tasks have also attracted attention in the field of anomaly detection. A convolutional neural network (CNN) has shown excellent feature extraction ability in the field of image recognition. Transfer learning is capable of transferring the feature extraction ability of CNN models on images to classification tasks in other fields, such as semantic comprehension. Long short-term memory networks (LSTM) and recurrent neural networks (RNN) have the ability to capture the potential sequential correlation of data, which achieves excellent results in the field of text classification and can be applied in network traffic detection. With the breakthrough of the transformer [5] on the self-attention mechanism, some transformer-based anomaly detection methods have been proposed. TranAD [6] uses focus-score-based self-regulation to enable powerful multimodal feature extraction and adversarial training for stability.
Rule-based network anomaly traffic detection can be easily circumvented by sophisticated attacks. By contrast, the existing detection based on deep learning leads to low detection accuracy and low throughput due to the inefficiency of traffic feature extraction. Therefore, the existing methods lack the capability of real-time network threat awareness. For this purpose, this paper proposes an anomaly traffic detection technique based on discrete user preference features.
Discrete user preference features, extracted by edge devices of cyberspace situation awareness systems, contribute to first-level filtration and detection, which increase accuracy and throughput. When the attacker interferes with the user preference features to launch an attack, we use the DL model to re-detect the traffic, which contains a certain robustness to the covert traffic attack. Experiments show that the proposed method can effectively improve the detection rate compared with single machine detection, and the efficiency of model training and evaluation is increased by 31.63% and 48.64%, respectively.
The proposed main contributions are as follows:
- We designed a user preference feature model to achieve fast cyberspace situation awareness.
- We designed a two-level detection frame to re-direct and achieve better performance compared to the existing typical methods.
- The proposed method improves the time efficiencies of the model’s training and testing by 31.63% and 48.64%, respectively.
The organizational structure of this paper is as follows: the second section introduces the relevant work; the third section introduces the proposed detection model in detail; the fourth section is based on the comparison experiment between the proposed model and other methods; and the last section is the summary of this paper.
2. Related Work
2.1. Fast Anomaly Traffic Detection
Recent research on the attack detection of anomaly traffic mainly focuses on detection rate and detection accuracy. Especially under the premise of ensuring that the detection accuracy meets the actual application requirements, improving detection efficiency has become a current research hotspot. Several methods have been proposed. The first category is to design detection methods with low computational complexity that reduce detection computation by approximation and other methods to achieve the purpose of improving detection rates. Such as the attack detection method based on the covariance of a small amount of traffic characteristics [7] and the attack detection method based on a fuzzy estimator [8]. These methods mentioned above improve the detection rate and cost by designing algorithms with low detection calculations. However, the lack of extensibility causes difficulties in migration for other tasks. The second category aims at the method of hardware acceleration, which improves the detection rate through hardware auxiliary operations, such as the detection methods based on Field Programmable Gate Array (FPGA) [9,10,11]. This kind of method combines hardware to effectively improve the detection rate. Nevertheless, the algorithm design must be adapted to the hardware, which is costly to promote. The third category is based on distributed computing platforms, which use cluster distributed parallel computing to improve the detection rate. For example, the network attack detection method based on counting is deployed on the Hadoop distributed computing platform. In addition to the network attack detection method of deploying the K-Means algorithm on the Spark distributed computing platform This kind of method distributes detection tasks with a large amount of calculation to work clusters for parallel distributed computing, sharing the pressure of detection hosts, and has fast detection speed and strong applicability. However, the current research has only realized the deployment of a few simple algorithms.
2.2. Big Data Computing Engine
Spark is a general, fast, and scalable big data computing engine based on memory [12]. Compared with Hadoop (based on the MapReduce engine [13]), the distributed computing platform of the same form, Spark, processes computing and mapping operations in memory, which gains higher computing speed and adaptability for cyberspace situational awareness tasks assisted by data mining and machine learning.
The Spark cluster mainly consists of two parts: one Master node and multiple Worker nodes. A cluster manager is deployed on the Master node, which is responsible for task allocation and scheduling as well as obtaining and summarizing the calculation results of each Worker node, while the Worker node is only responsible for calculating the tasks assigned by the Master node, storing the data required by the application, and uploading the results.
The running mode of the Spark cluster is shown in Figure 1. Figure 1 shows that applications connect to the Spark cluster through the SparkContext class as the access point of the Spark function. When SparkContext connects to the Spark cluster, the cluster manager sends the application code to the Worker node. SparkConext sends the task to the actuator on the Worker node for calculation. By dividing tasks and assigning them to different Worker nodes, the distributed and parallel execution of computing tasks can be achieved, reducing the computing pressure on a single host and improving the computing speed.
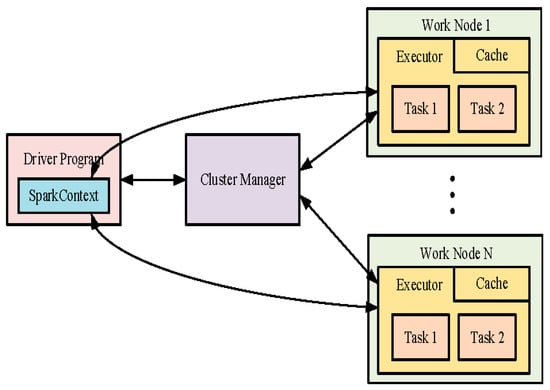
Figure 1.
Running mode of the Spark cluster.
2.3. Deep Learning in Cyberspace Security
In recent years, the exploration of deep learning technology has been advancing in the field of network security. The method based on convolutional neural networks and transformers has very promising prospects. Convolutional Neural Network (CNN) is a typical deep learning network that automatically adjusts parameters through the forward propagation and back propagation algorithms. CNN models learn the abstract features in the input data layer by layer, which performs well in image detection and recognition tasks. RNNS used to be the most popular and powerful network architecture for building encoder-decoder structures before Vaswani et al. [5] proposed the Transformer model. Fast computing devices such as Graphics Processing Units (GPUs) and Tensor Processing Units (TPUs) rely on parallel computation. However, due to the sequential structure of RNNS, which must process sentences word by word, RNNs are not suitable for parallel processing. To overcome this drawback of RNNS, the Transformer model employs a self-attention mechanism that allows the encoder and decoder to compute every word in the entire input sequence. Zhao et al. [14] proved through experiments that, compared with RNN and LSTM, Transformer has more powerful coding abilities and can be more efficiently applied to large-scale scene tasks.
3. Proposed Method
3.1. Two-Stage Anomaly Detection Framework
To solve the problem of accurate and fast awareness of anomaly traffic under massive network data, this paper proposes a two-stage detection framework, as shown in Figure 2. As can be seen from Figure 2, the key modules of first-level detection are composed of sniffers placed in the network and a user preference feature extraction model, which can quickly screen massive data and perceive anomalous network traffic that may cause attacks in advance. The second-level detection is composed of a distributed big data computing engine, and the cluster is composed of a Master host and a Worker slave. The deep fusion discriminator is used to discriminate the benign data determined by the first-level detection again. The second-level detection is used to perform depth-accurate detection on the results after the first-level detection.
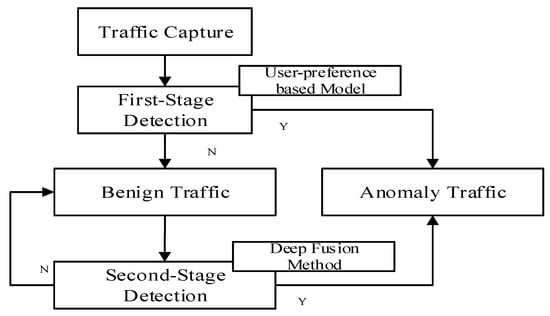
Figure 2.
Implementation framework for network anomaly traffic detection.
3.2. User Preference Feature-Based Detection Model
Given that in a network, users acquire fixed habits over time. For instance, users may communicate with specific addresses during certain hours of the workday or search for information at a certain network site. Users’ fixed habits could be described by virtue of a cache algorithm based on hotspot content, which could be applied to build a User Preference Feature-based detection model and detect anomalous traffic at the first level. This paper considers an ideal edge network, as shown in Figure 3. During normal access, we model the user’s persistent access network flow duration. A set of tuples is used to represent the users’ normal access, where . Assume that for a certain user n, the user preference of n during time could be described using , where represents the event of user access during , represents the history event set of access during of user n, and represents the probability of user n’s access during . Hence, the user n’s preference vector to time could be described as . Similarly, during normal access, we model the user’s access transmission data. A set of tuples is used to represent the user’s normal access. Hence, the user preference of n to content k could be described using , where represents the event of user n to content , and represents the history event set of user n to content . Thus, the user n’s preference vector for content could be described as . The rest preference (transmission rate and data fragmentation) can be modeled in the same manner, including time preference, content preference, and combination preference. The user preference can be described as , consisting of network flow duration, transmission data size, rate, and data fragmentation. When an attack occurs, the user’s behavior is affected by the attack, and the user’s normal usage begins to deviate. We use the cosine distance to measure the deviation. Now we employ the following algorithms for fast attack awareness.
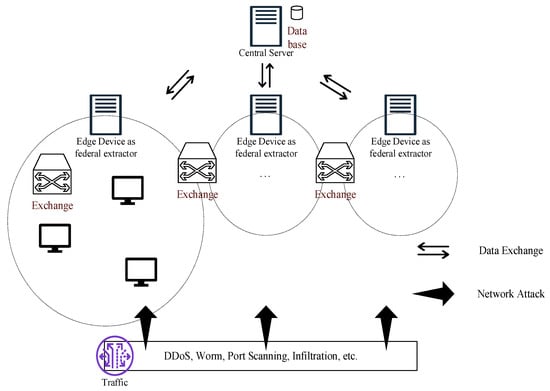
Figure 3.
Ideal network model.
As Algorithm 1 describes, before real-time monitoring and awareness, we first upload the user-preference vector. Following that, check and calculate the user-preference vector after a short period of time Δt. We use cosine distance as the basis for discrimination. If the cosine distance is larger than the proposed threshold, that means anomalous traffic has been detected, where the threshold is crucial to distinguishing normal behavior from bad behavior caused by anomalous traffic.
| Algorithm 1: UPF-based fast awareness algorithm for network attack |
| input: network traffic packages output: traffic packages, awareness 1: Upload Vec(n): //Load the user-preference vector 2: While(1): //Real-time monitoring and awareness 3: Cal Dis(, + t)// user-preference cosine distance after time t 4: If (Discrete Threshold < Dis): 5: Anomalous traffic detected; 6: Send traffic to server; 7: If (secure traffic): 8: Update(Discrete Threshold); 9: Else: 10: Threat report; 11: Else: 12: Normal traffic; 13: Send traffic to server; 14: If (anomalous traffic): 15: Threat report; |
3.3. Deep Fusion Detection Methods
The framework of the network traffic detection technology based on the Spark platform is shown in Figure 4. The framework is composed of a network sniffer, a server, and a Spark cluster deployed at key nodes of the network. The network sniffer is responsible for capturing the network traffic data packets flowing through the server. The application deployed on the server is the target to be protected. The Spark cluster is composed of the Master node and the Worker node. The Hadoop distributed file system (HDFS) and cluster manager are deployed on the Master node. HDFS is a high-performance distributed file management system that can store and forward the data required by the Spark cluster, while the cluster manager is responsible for scheduling detection tasks. The cluster manager divides the tasks, transmits them to the Worker host for computation, and summarizes the computation results of the Worker host. On the Worker host, executors and caches are deployed. The executors are responsible for performing computing tasks, and the caches are used to store data required for computations.
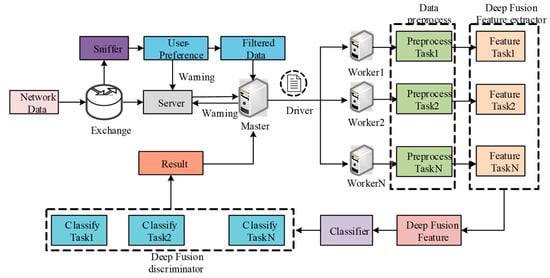
Figure 4.
Framework of two-stage level detection based on user preference features and a deep fusion model.
The operation steps are as follows: First, the traffic flowing through the key nodes of the network is captured by the sniffer. The data packets are integrated to generate a network data flow file and sent to the Master host in the Spark cluster. The Master host uploads the data packet file to the HDFS file management center, generating the corresponding NameNode and DataNode for distributed storage of traffic data packet files. The Worker host searches for the data storage location through the NameNode to extract the data for DDoS attack detection. According to the cluster configuration, the Master host sends the network attack detection driver to the corresponding Worker host. The cluster manager divides the computing tasks and assigns them to the executors of the Worker hosts for computation. After the executors complete the corresponding tasks, they transmit the output results and corresponding information back to the Master host to summarize the results and view the cluster operation. By classifying the network traffic into normal traffic and network attack traffic, the Master host sends the detection results to the server. The server filters the attack traffic according to the detection results and ensures the normal operation of the server through normal traffic.
The driver program in the deep fusion detection models includes the following parts: data preprocessor, deep fusion feature extractor, model trainer, and model evaluator. The feature extractor is responsible for counting the original data packet information and calculating the network flow duration, transmission data size, rate, and fragmentation, which can reflect important characteristics of network attacks (contrasted in Section 3.2). The data preprocessor preprocesses the network traffic data features extracted by the feature extractor to facilitate subsequent training and evaluation operations. The specific operations include data normalization and feature selection.
The construction of the deep fusion models is illustrated in Figure 5. DAG depicts a logical flow of operations on the partitions in a resilient distributed dataset (RDD), which makes it possible for the multiple worker nodes to perform in parallel.

Figure 5.
Construction of deep fusion.
The pseudocode of the proposed method is given in Algorithm 2:
| Algorithm 2: Anomalous network detection methods based on deep fusion models |
| input: network traffic packages output: detection results 1: When packets arrived: 2: Packets_File.append(Packet) 3: End When 4: Initialize Flow_File 5: For Packet in Packets_File: 6: If: (Packet.srcIP,Packet.destIP) in Flow_File: 7: Flow_File[(Packet.srcIP,Packet.destIP)].append(Packet) 8: Else: 9: Flow_File[(Packet.srcIP,Packet.destIP)] = Packet 10: End 11: End 12: Send Flow_File to HDFS 13: Sc = sparkContext() 14: Workers: Sc.read(Flow_File) 15: Features_File = Exctract_Features(Flow_File) 16: Detection_Model = DeepFusionClassifier 17: Detection_Model.fit(Training_File) 18: Prediction = Detection_Model.predict(Features_File) 19: For ele in Prediciton: 20: If ele == 0: 21: Output: Normal Traffic 22: If ele == 1: 23: Output: Attack Traffic 24: End |
4. Results
Creating RDD is the Creating RDD is the basis for the construction of DAG. RDD is a partitionable and immutable distributed data set. There are two ways to create RDD: the first is to read files, and the second is to parallelize the data in memory. The model is created in the first way. The data packet file obtained from the sniffer is uploaded to HDFS, and the Namenode is created to store the file fragments in the DataNode. The nodes in the cluster read the data packet file on HDFS to create RDD for parallel computing.
When building the DAG, the input traffic data in RDD is divided into logical partitions, which can be processed in parallel on cluster nodes. In the feature extraction part, through RDD’s map operation, the original data packet file is converted into network traffic features. The subsequent preprocessing operation is based on RDD’s transform operation, which performs operations such as normalization and screening on the traffic characteristic data, in order to eliminate abnormal data and dimension effects, and improve detection accuracy. The feature extraction and pre-processing include various operations on the partitions. The operations are arranged further in a logical flow of operations, and the arrangement is the constructed DAG. Following that, the DAG graph is converted into the physical execution plan, which contains multiple stages 1.
4.1. Environment
The experimental environment is as follows: Window10 × 64 operating system, Intel Core i7-8850H 2.6GHz CPU, NVIDA GeForce GTX 1050 Ti with Max-Q Design GPU, 32 GB RAM, 1 TB SSD. We use Vmware WorkStation 16 Pro to create a 64-bit Ubuntu16 virtual machine as part of the Spark Working cluster. Each virtual machine is installed with Spark version 3.0.1 and Hadoop version 3.3.0. The memory of the virtual machine is 4 GB, the number of computing cores is 1, the IP address of the Master host is 192.168.118.129, and the IP address of the Worker host is 192.168.118.130~192.168.118.138.
We use the well-known CIC 2017 App-DDoS Dataset [15] as the experimental data set. The data set was obtained by deploying Apache Linux v.2.2.22, PHP5, Drupal v.7 web servers in a real network environment and using a network sniffer to capture network traffic on the server. For the attack data, four different types of network attacks were carried out on the server at different times through seven network attack tools such as Hulk, DDoSSim, and Rudy, and a total of 24 h of network data were recorded, with a total file size of 4.6 GB.
The CIC 2017 App-DDoS Dataset contains the network traffic of eight different application-layer DDoS attacks, and the network characteristics of each attack traffic are different. Using this dataset could well reflect the detection capability of the model for network attacks with different characteristics.
4.2. Evaluation Method
We utilize the classical evaluation metrics, which consist of accuracy, precision, recall, and F1-score.
where TP represents the correctly classified samples, FP represents the misclassified attack samples, TN represents the correctly classified normal samples, and FN represents the misclassified normal samples.
The accuracy rate is the proportion of correctly classified traffic to the total traffic data, reflecting the overall detection performance of the model. The precision rate is determined as the proportion of real attack traffic in the number of attack traffic, reflecting the precision of the model in judging the attack. The recall rate is the proportion of the identified attack traffic to the total attack traffic, which reflects the coverage of attack data achieved by the model. The F1-score is an evaluation index that uses the harmonic mean combined with the recall rate and the precision rate to effectively reflect the overall performance of the detection model.
4.3. Performance Analysis
In order to justify the use of the deep fusion models as the classifier, we conducted the ablation experiment using various other machine learning algorithms as the classifier. Random forests [16], decision trees [17], gradient boosting trees, and linear support vector machine classifiers are considered in the experiment, which are denoted as RF-based, DT-based, GBT-based, and SVM-based. The parameters of various detection algorithms are set as follows: the maximum depth of the random forest tree is 10, and the number of trees is 30; the maximum depth of the decision tree is 20; the maximum depth of the tree in the gradient boosting tree is 10, and the number of iterations is 10; multi-layer linear perception The device has four layers: the hidden layer is a two-layer neural network structure, which contains sixteen and eight neurons, respectively; the output layer is composed of two neurons; the linear support vector machine uses a linear function as the kernel function; and the number of iterations is ten. The regularization parameter is set to 0.1, and the aggregation depth is 2. The above algorithms run in the Spark cluster by writing the Spark driver and sending it to the master host.
The experimental results are shown in Table 1 and Figure 6, where the results of the methods [18,19] are reported in the references and the precision result is not provided in [18]. Among all the methods, the proposed method achieves the best detection effect; the detection accuracy rate is 96.1%, and the F1 score is 0.9595, indicating that the proposed method has the best classification performance under this data set. Among the machine learning methods based on tree structure, GBT-based methods achieve better performance than DT-based and RF-based methods, with a detection accuracy rate of 95.93%. Compared with other methods, the detection accuracy of the SVM-based method is relatively low. This is because the linear SVM method cannot very well deal with high-dimensional data, as the data set includes a total of 79 dimensional network features for attack detection.

Table 1.
Detection performance of the models using various types of classifiers.
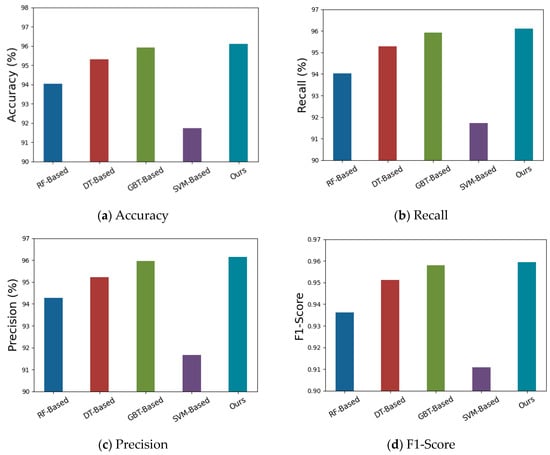
Figure 6.
Illustration of the detection performance of the models using various types of classifiers.
The proposed method is also compared with two typical methods: one based on AdaBoost [18] and its improved version [19], which has better detection performance by leveraging synthetic minority oversampling, principal component analysis, and ensemble feature selection. The experimental results are shown in Table 2 and Figure 7. It can be seen from Table 2 and Figure 4 that the proposed method achieves better detection performance than the typical methods [18,19].

Table 2.
Detection performance of the proposed methods, Adaboost [18] and Improved Adaboost [19].
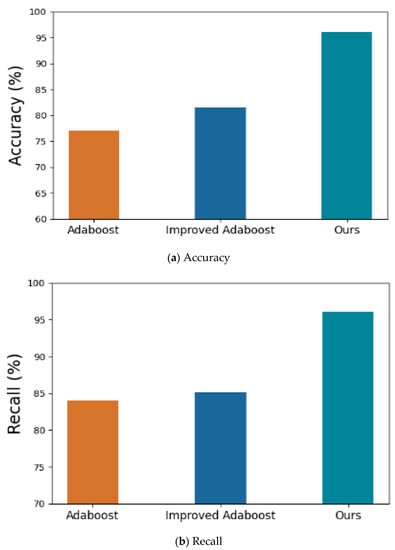
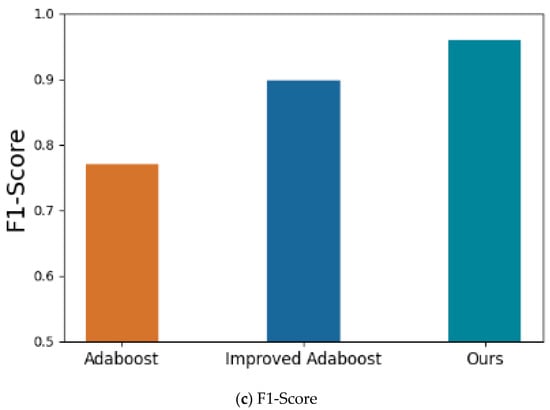
Figure 7.
Illustration of the detection performance of the proposed methods, Adaboost [18] and Improved Adaboost [19].
4.4. Time Efficiency Analysis
In order to verify the improvement of the Spark distributed computing platform on time efficiency, the experiment is set up as follows: under the condition that the total number of processing units of the processor is the same, the driver program based on the MLP neural network is released on a single host and the Spark cluster, respectively, and the cluster number is selected as 2–3, and the number of computing cores in the cluster is 2–8. The training and testing times of clustered operations and stand-alone operations are compared in the experiment.
The driver program uses the MLP-Spark, which achieves the best detection performance, as the model to evaluate the time and cost of the training and testing process. The training data is 80% of the CIC DDoS2017 dataset, and the remaining 20% of the data is used as the testing set. The number of training iterations is 100. The MLP neural network has a four-layer structure. The input layer contains 79 neurons, which is equivalent to the feature dimension of the data set. The two hidden layers contain sixteen and eight neurons, respectively, and the output layer contains two neurons.
The training process performs iterative operations through the stochastic gradient descent method and derives the neuron weight and bias parameters to obtain the lowest loss function to achieve the training effect. The testing process is to input the test data set into the trained model for prediction and calculate the four evaluation indicators, namely accuracy rate, recall rate, precision rate, and F1-score, with the obtained predicted labels and real labels. Finally, the time spent on the training and testing of the statistical model is used to judge the improvement effect of the Spark cluster on time efficiency. Each group of experiments is repeated three times with the same parameters to reduce the error and improve the accuracy of the experimental results. The experimental results are shown in Figure 8.
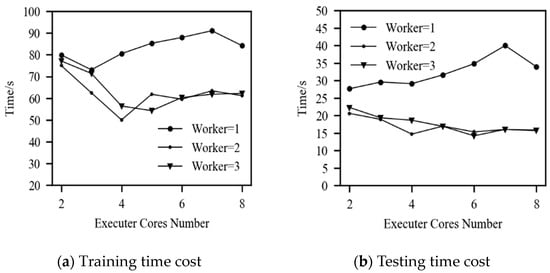
Figure 8.
Time efficiency of the Spark cluster.
As shown in Figure 5, in the Spark cluster mode, namely when the number of workers is 2–3, as the number of computing cores increases, the time efficiency of model training and model evaluation is significantly improved. When the number of workers is two and the number of cores is four, the optimal time efficiency of model training and model evaluation is obtained. The average time required is 50.05 s and 14.68 s, respectively, compared with the stand-alone running time efficiency of 31.61% and 46.87%. In the case where the number of workers is three, optimal training and testing time efficiency are obtained when the number of cores is five and six, respectively. The corresponding average times are 54.27 s and 14.19 s, which are respectively improved compared with the stand-alone running time by 25.84% and 48.64%. Therefore, it can be shown that the Spark distributed computing platform can effectively improve the efficiency of DDoS attack detection.
In the case of stand-alone operations, namely Worker = 1, either in training or model evaluation, under the same computing resources, the time efficiency is far lower than that of Spark cluster mode operations. Furthermore, with the increase in the number of computing cores, the time efficiency of stand-alone operations decreased instead. This is because the distributed data structure of Spark requires the computing cores to use multithreads for parallel computing. Due to the lack of a cluster manager for the cluster model and the lack of program parallel scheduling capabilities, when the number of computing cores is greater than three, performance decreases. The minimum average time required for model training is 73.18 s, and the minimum average time required for evaluation is 27.63 s, which are obtained when the number of computing cores is three and two, respectively. This phenomenon shows that it is not suitable to run the Spark distributed driver on a single machine, resulting in a waste of computing resources.
It can also be observed from Figure 5 that as the number of computing cores increases to a certain extent, the time efficiency will decrease to a certain extent. This is because the time saved by the parallel operations is lower than the communication delay caused by communication and scheduling between Spark clusters. Even though the larger number of computing cores increases the parallelism of the program, it still cannot further improve the total time efficiency.
5. Conclusions
This paper proposes a two-stage anomaly detection method based on user preference features and a deep fusion model. Based on the distributed and parallel execution of detection tasks, the stability and detection accuracy of DDoS attacks are improved. It provides auxiliary decision-making for network security operations and maintenance personnel. In the framework, the detection tasks are divided into two stages. A deep fusion classifier is trained using the features extracted from the input traffic data. The experimental results illustrate the superiority of the proposed method over typical methods in terms of detection accuracy and its higher time efficiency over the stand-alone detection mode. In the future, the effectiveness of the method will be further explored with larger real-world network traffic.
The methods proposed in this paper need to be improved in the following aspects: first, the training data used are all public data sets rather than large-scale real network data, and the training effect needs to be further improved; second, model training requires a large number of label data sets, and there is a certain amount of manual classification and feature summary workload.
Author Contributions
Conceptualization, S.-L.Z.; methodology, B.Z.; software, Y.-T.Z.; validation, Y.-X.G.; formal analysis, J.-L.T. All authors have read and agreed to the published version of the manuscript.
Funding
This research received no external funding.
Institutional Review Board Statement
This study does not require ethical approval and we recommend excluding this statement.
Informed Consent Statement
Not involved.
Data Availability Statement
The data used to support the findings of this study are available from the corresponding author upon request.
Conflicts of Interest
The authors declare no conflict of interest.
References
- Chacon, H.; Silva, S.; Rad, P. Deep learning poison data attack detection. In Proceedings of the 2019 IEEE 31st International Conference on Tools with Artificial Intelligence, Portland, OR, USA, 4–6 November 2019; pp. 971–978. [Google Scholar]
- Wang, Z.H.; Liu, C.G.; Qiu, J.; Tian, Z.; Cui, X.; Su, S. Automatically traceback RDP-based targeted ransomware attacks. Wire-Less Commun. Mob. Comput. 2018, 2018, 7943586. [Google Scholar] [CrossRef]
- Khan, S.; Gani, A.; Wahab, A.W.A.; Singh, P.K. Feature selection of denial-of-service attacks using entropy and granu-lar computing. Arab. J. Sci. Eng. 2018, 43, 499–508. [Google Scholar] [CrossRef]
- Potluri, S.; Diedrich, C. Accelerated deep neural networks for enhanced intrusion detection system. In Proceedings of the 2016 IEEE 21st Inter-National Conference on Emerging Technologies and Factory Automation (ETFA), Berlin, Germany, 6–9 September 2016; pp. 1–8. [Google Scholar]
- Wang, X.; Pi, D.; Zhang, X.; Liu, H.; Guo, C. Variational transformer-based anomaly detection approach for multivariate time series. Measurement 2022, 191, 110791. [Google Scholar] [CrossRef]
- Tuli, S.; Casale, G.; Jennings, N.R. Tranad: Deep transformer networks for anomaly detection in multivariate time series data. arXiv 2022, arXiv:2201.07284. [Google Scholar] [CrossRef]
- Khraisat, A.; Gondal, I.; Vamplew, P.; Kamruzzaman, J. Survey of intrusion detection systems: Techniques, datasets and challenges. Cybersecurity 2019, 2, 1–22. [Google Scholar] [CrossRef]
- Akgun, D.; Hizal, S.; Cavusoglu, U. A new DDoS attacks intrusion detection model based on deep learning for cybersecurity. Comput. Secur. 2022, 118, 102748. [Google Scholar] [CrossRef]
- Hoque, N.; Kashyap, H.; Bhattacharyya, D.K. Real-time DDoS attack detection using FPGA. Comput. Commun. 2017, 110, 48–58. [Google Scholar] [CrossRef]
- Jyothi, V.; Wang, X.; Addepalli, S.K.; Karri, R. Brain: Behavior based adaptive intrusion detection in networks: Using hardware performance counters to detect ddos attacks. In Proceedings of the 2016 29th International Conference on VLSI Design and 2016 15th International Conference on Embedded Systems (VLSID), Kolkata, India, 4–8 January 2016; pp. 587–588. [Google Scholar]
- Nagy, B.; Orosz, P.; Varga, P. Low-reaction time FPGA-based DDoS detector. In Proceedings of the NOMS 2018-2018 IEEE/IFIP Network Operations and Management Symposium, Taipei, Taiwan, 23–27 April 2018; pp. 1–2. [Google Scholar]
- Armbrust, M.; Xin, R.S.; Lian, C.; Huai, Y.; Liu, D.; Bradley, J.K.; Meng, X.; Kaftan, T.; Franklin, M.J.; Ghodsi, A.; et al. Spark sql: Relational data processing in spark. In Proceedings of the 2015 ACM SIGMOD international conference on management of data, New York, NY, USA, 31 May–4 June 2015; pp. 1383–1394. [Google Scholar]
- Hashem, I.A.T.; Anuar, N.B.; Gani, A.; Yaqoob, I.; Xia, F.; Khan, S.U. MapReduce: Review and open challenges. Scientometrics 2016, 109, 389–422. [Google Scholar] [CrossRef]
- Zhao, B.; Gong, M.; Li, X. Hierarchical multimodal transformer to summarize videos. Neurocomputing 2022, 468, 360–369. [Google Scholar] [CrossRef]
- Sood, I.; Sharma, V. Computational Intelligent Techniques to Detect DDOS Attacks: A Survey. J. Cybersecur. 2021, 3, 89–106. [Google Scholar] [CrossRef]
- Chen, L.; Zhang, Y.; Zhao, Q.; Geng, G.; Yan, Z. Detection of DNS DDOS attacks with random forest algorithm on spark. Procedia Comput. Sci. 2018, 134, 310–315. [Google Scholar] [CrossRef]
- Lakshminarasimman, S.; Ruswin, S.; Sundarakantham, K. Detecting DDoS attacks using decision tree algorithm. In Proceedings of the 2017 Fourth International Conference on Signal Processing, Communication and Networking (ICSCN), Chennai, India, 16–18 March 2017; pp. 1–6. [Google Scholar]
- Sharafaldin, I.; Lashkari, A.H.; Ghorbani, A.A. Toward Generating a New Intrusion Detection Dataset and Intrusion Traffic Characterization. In Proceedings of the 4th International Conference on Information Systems Security and Privacy (ICISSP), Funchal, Portugal, 22–24 January 2018. [Google Scholar] [CrossRef]
- Yulianto, A.; Sukarno, P.; Suwastika, N.A. Improving adaboost-based intrusion detection system (IDS) performance on CIC IDS 2017 dataset. J. Phys. Conf. Ser. 2019, 1192, 012018. [Google Scholar] [CrossRef]
Disclaimer/Publisher’s Note: The statements, opinions and data contained in all publications are solely those of the individual author(s) and contributor(s) and not of MDPI and/or the editor(s). MDPI and/or the editor(s) disclaim responsibility for any injury to people or property resulting from any ideas, methods, instructions or products referred to in the content. |
© 2023 by the authors. Licensee MDPI, Basel, Switzerland. This article is an open access article distributed under the terms and conditions of the Creative Commons Attribution (CC BY) license (https://creativecommons.org/licenses/by/4.0/).