Abstract
To study the deformation performance of CFRP-strengthened corroded RC (reinforced concrete) beams under fatigue loading, a numerical analysis method based on the fatigue damage failure process was used, and the fatigue constitutive models of each material were used as the basis. The finite element software ABAQUS was used to model and analyze the CFRP-strengthened corroded RC beams, and the degradation of bond performance between rusted reinforcement and concrete was considered in the simulation. Then, the flexural stiffness calculation method of CFRP-strengthened corroded RC beams was analyzed. Based on the validation of the finite element model, a regression analysis was performed on the mid-span deflection data of the simulated beam to establish a formula for calculating the mid-span deflection of CFRP-strengthened corroded RC beams under fatigue loading. Finally, the collected experimental data were compared with the calculation results using the mid-span deflection formula, which was validated to confirm its accuracy and reliability. The research results show that the mean, standard deviation and coefficient of variation of the ratio of experimental to calculated values were 0.95, 0.09 and 0.10, respectively, indicating that the calculated values of the proposed mid-span deflection formulation are in good agreement with the experimental values, which proves the correctness and high accuracy of the proposed formula for calculating the mid-span deflection. The formula can provide a theoretical basis for the evaluation of the deformation performance of CFRP-strengthened corroded RC beams under fatigue loading.
1. Introduction
Reinforced concrete (RC) structures such as highways and railway bridges are subject to harsh working environments, where steel bars are prone to corrosion and will be subject to high-cycle fatigue loading. To avoid accidents, it is necessary to inspect and strengthen these structures. Carbon fiber reinforced polymer (CFRP) is often used to strengthen RC structures such as bridges due to its advantages such as light weight, high strength, fatigue resistance and corrosion resistance [1].
Currently, many studies have been conducted on the flexural behavior and strengthening effect of CFRP-strengthened corroded RC beams under static load. Al-Saidy [2] and Triantafyllou [3] repaired corroded RC beams using different strengthening schemes and found that the strength of the corroded beams was restored to an uncorroded state after CFRP strengthening and the ultimate deflection of the strengthened beams was less than the ultimate deflection of the unstrengthened beams. Yu et al. [4] determined four equilibrium damage and five damage modes based on the stress states of concrete, corroded steel bars and CFRP plates during bending damage of beams and proposed a simplified calculation method for the bending load capacity of corroded RC beams reinforced with CFRP plates under each failure mode, which proved the validity of the proposed calculation method through the verification of experimental data. Gotame et al. [5] studied FRP-strengthened corroded RC beams through nonlinear finite element analysis, and the results showed that the interface properties between FRP and concrete were crucial for accurately predicting the bearing capacity and failure modes of the strengthened beams. Tran et al. [6] numerically modeled CFRP-strengthened corroded RC beams using the finite element method to predict the flexural load capacity of the strengthened beams, and the results showed that the predicted residual load capacity was in good agreement with the experimental results.
In contrast, there are limited studies related to CFRP-strengthened corroded RC beams under fatigue loading. Sobhy et al. [7] conducted fatigue tests on CFRP-strengthened corroded RC beams and found that the fatigue strength of the steel bars was reduced due to corrosion and all the tested beams were damaged by fatigue damage of the tensile steel bars. Al-Hammoud et al. [8] found through experimental studies that the flexural fatigue performance of moderately corroded beams strengthened with CFRP could be improved to the level of uncorroded beams, and the flexural fatigue performance of heavily corroded strengthened beams were somewhat improved but could not reach the level of uncorroded beams. Song et al. [9] proposed a fatigue evaluation model for prestressed CFRP-strengthened corroded RC beams, which was used to evaluate the damage mode, fatigue life, fatigue strength and post-fatigue ultimate load capacity of prestressed CFRP-strengthened corroded RC beams, and showed that the reinforcement design factors for corroded RC beams under cyclic fatigue loading are in the order of stiffness, fatigue life, fatigue strength and ultimate load capacity. Xie et al. [10] studied the flexural behavior of prestressed CFRP-strengthened corroded RC beams through experiments, and the experimental results showed that the coupling effect of corrosion and cyclic loading significantly reduced the flexural stiffness of the strengthened beams but had little effect on the ultimate load of the strengthened beams, indicating the effectiveness of the prestressed reinforcement system.
It can be seen that most scholars’ research on CFRP-strengthened corroded RC beams under fatigue loading mainly focuses on the experimental study of their flexural performance, while in actual engineering, the deformation of the structure also needs to be verified via calculation in order to meet the normal function of the structure.
Most of the existing research methods are based on experimental studies, and fatigue tests are time-consuming and limited by many conditions; finite element simulation can overcome such problems. Therefore, this study uses the finite element software ABAQUS to numerically simulate the CFRP-strengthened corroded RC beams under fatigue loading. Combining the theoretical analysis and finite element results, the method of calculating the mid-span deflection of CFRP-strengthened corroded RC beams under fatigue loading is investigated to provide some theoretical basis for the evaluation of the deformation performance of CFRP-strengthened corroded RC beams after fatigue loading.
2. Fatigue Constitutive Model of Materials
2.1. Fatigue Constitutive Model of Concrete
2.1.1. Fatigue Stiffness Degradation
Research has found [11] that the stiffness of concrete degrades in three stages as the number of fatigue loadings increases. In the first stage, the elastic modulus of concrete decays rapidly, accounting for about 10% of the total fatigue life. In the second stage, the elastic modulus of concrete degrades steadily and linearly, accounting for about 80% of the total fatigue life. In the third stage, the elastic modulus decreases rapidly, accounting for about 10% of the total fatigue life. Holmen [12] proposed the degradation equation for the fatigue elastic modulus of concrete, as shown in Equation (1):
where EN is the residual elastic modulus of concrete after N cycles of fatigue loading, E0 is the initial elastic modulus of concrete and Nf is the fatigue life of concrete.
2.1.2. Fatigue Residual Strength
The maximum stress that concrete can still withstand after a certain number of fatigue loadings is called concrete fatigue residual strength. Its value can be solved using its residual strength envelope equation, which can be used to represent the softened section of the uniaxial stress–strain curve of concrete, as shown in Figure 1 [11]. The fatigue residual strength of concrete under compression and tension after an arbitrary number of fatigue loading proposed by Zhu [11] is shown in Equations (2)–(4):
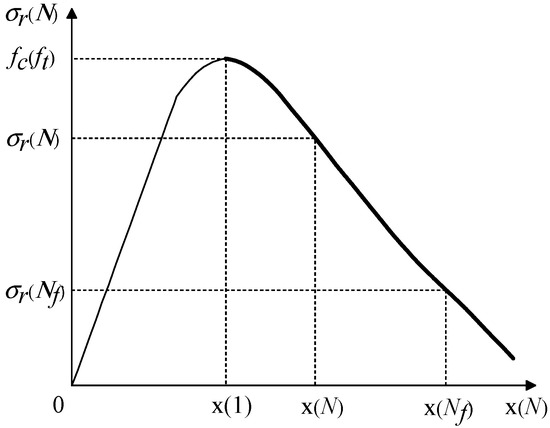
Figure 1.
Fatigue residual strength envelope of concrete.
X(Nf) when under pressure is:
where σr,c(N) and σr,t(N) are the residual compression and tension strengths of concrete after N cycles of fatigue loading, respectively. fc and ft are the compressive and tensile strength of concrete under static load, respectively. X(N) is a function related to the number of fatigue load cycles N, which can be calculated according to Equation (3). αc and αt are the coefficients corresponding to the uniaxial compressive and tensile stress–strain curves of concrete, which can be taken with reference to the Code of GB50010-2010 [13]. σc,max is the stress of concrete under fatigue upper-limit loading.
2.1.3. Fatigue Residual Strain
Under fatigue loading, the residual strain of concrete will accumulate with the increase of fatigue load cycles. The residual strain of concrete is related to the number of fatigue load cycles and stress levels. The formula for calculating the longitudinal residual strain of concrete under compression proposed by Wang [14] is shown in Equation (5):
where Δεr(N) is the fatigue residual strain after N cycles of fatigue loading. Δεr(1) is the residual strain after the first stress cycle, where . εc,min and εc,max are the initial instantaneous strains of concrete under the lower and upper limits of fatigue loading, respectively. εunstab is the total longitudinal strain of concrete at the beginning of the third stage, and its value is very close to the strain ε0 corresponding to the peak stress during a single loading and failure, therefore it can be approximately taken as ε0.
Based on changes of stiffness, residual strength and residual strain of concrete under fatigue loading with an increasing number of loading cycles, and referring to the literature [11], the fatigue constitutive model for concrete under any fatigue loading cycles is established based on the concrete uniaxial stress–strain curve in the Code of GB50010-2010 [14].
Fatigue principal structure of concrete under compression is calculated using the following:
Fatigue principal structure of concrete under tension is calculated using the following:
where . εc,max(N) and εt,max(N) are the peak compressive and tensile strains of concrete after N cycles of fatigue loading, respectively, where . εe(N) is the compressive elastic strain of concrete after N cycles of fatigue loading; generally, take εe(N) = 0.3~0.4εc,max(N).
2.2. Fatigue Constitutive Model of Corroded Steel Bar
It was shown that under fatigue loading, the steel bar is at relatively low stress levels and most of the fatigue deformation is within the elastic phase [15], and the influence of corrosion on the elastic modulus of the steel bar are relatively small and can be neglected [16]. Therefore, it is assumed that the fatigue elastic modulus of a corroded steel bar remains unchanged. The principal structure model of the steel bar used in this study is based on the ideal elastoplastic model, and the principal structure relationship of an uncorroded steel bar under an arbitrary number of fatigue loading is calculated in Equation (8) [11]:
where Es is the initial elastic modulus of steel bar. Σs(N) and εs(N) are the stress and strain of the steel bar at any fatigue loading cycles N. fy(N) and εy(N) are the residual yield strength and yield strain of the steel bar, respectively, at any fatigue loading cycles N. Δεs,r(N − 1) is the residual strain of steel bar after N − 1 fatigue loading cycles, which can be calculated using Equation (9):
The residual yield strength of steel bar after N fatigue loading cycles can be calculated using the formula in the literature [17], which is improved through combining the form of the S–N double logarithmic curve of steel bar, as shown in Equation (10):
where fy is the initial yield strength of the steel bar. σmax is the stress of the steel bar at the upper limit of the fatigue load. Nf is the fatigue life of the steel bar.
Due to a lack of relevant experimental data, this study only considers the effect of steel bar corrosion on its yield strength, and the degradation formula of the yield strength fyc after corrosion of the steel bar was obtained according to the literature [18], as shown in Equation (11):
where η is the mass corrosion degree of the steel bar, η = (m0 − m)/m0 × 100%. m0 is the mass of the steel bar before corrosion, and m is the mass of the steel bar after corrosion.
Based on Equations (10) and (11), the calculation formula for the residual yield strength of a corroded steel bar after N fatigue loading cycles is obtained as shown in Equation (12):
where Nf can be calculated from Equation (13) [19], substituting Equation (12) into Equation (8) to obtain the fatigue constitutive relationship equation for a corroded steel bar.
2.3. Fatigue Constitutive Model of CFRP
The stress and strain of CFRP develop linearly under fatigue loading, and the elastic modulus is basically not degraded [20]. Therefore, it can be assumed that the CFRP material remains a linearly elastic material after any fatigue loading, and its constitutive relationship is
3. Analysis Method for the Full Fatigue Loading Process
Vehicle loads on bridges are often high-cycle fatigue loads, which cannot be calculated for each cycle when using the finite element software ABAQUS for simulation. Some scholars [21,22] attempted to discretize the fatigue behavior analysis of strengthened beams according to the three-stage law of structural fatigue damage development. That is, smaller cycle jump steps are selected for the initial stage of fatigue damage development and the unstable stage of fatigue damage development, and larger cycle jump steps are selected for the linear growth stage of fatigue damage.
This study uses the analysis method proposed by Zhu [11] for numerical simulation of fatigue performance, and the number of fatigue loadings is jumped according to the simplified principle of the number of fatigue loadings in the numerical simulation of fatigue performance. Based on what is described in Section 2, when the Nth fatigue loading is simulated with cyclic jumps, the fatigue constitutive relationships of concrete, corroded steel bars and other materials at the Nth fatigue loading are calculated separately to obtain the fatigue performance of the strengthened beam at the corresponding number of loading times. The fatigue performance under the fatigue loading times of two adjacent cyclic jump steps is linked, so that the whole process of fatigue damage accumulation of the strengthened beam is continuous, and then the fatigue performance of the strengthened beam under the whole fatigue loading is obtained.
4. Numerical Simulation for CFRP-Strengthened Corroded RC Beams
4.1. Experimental Introduction
In order to test the feasibility of the above discrete modeling method based on the fatigue constitutive model of the material, this study simulates the test beam in the literature [23]. Since some of the experiments in the literature were static loading tests or the experiment beams were unstrengthened beams, this study mainly selected two fatigue-loaded CFRP-strengthened corroded RC beams for the simulations. The experimental conditions of the strengthened beams are shown in Table 1, the mechanical properties of each material are shown in Table 2 and the dimensions of the strengthened beams and the arrangement of the steel bars are shown in Figure 2.

Table 1.
Test of strengthened beam.
Table 2.
Mechanical properties of materials.
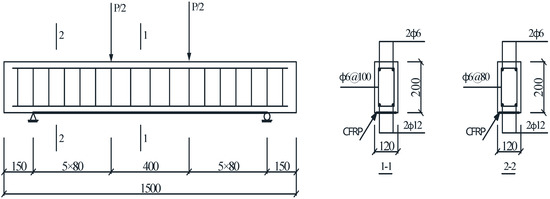
Figure 2.
Test beam size and reinforcement drawing (mm).
4.2. Numerical Simulation Model
Simulations were carried out using the finite element software ABAQUS, and the separated model approach was chosen for finite element modeling. Considering that the corrosion of steel bars in the experiment was obtained via the accelerated corrosion method, it is assumed during simulation that steel bars are uniformly corroded. The loss of steel bar cross-sectional area caused by corrosion can be achieved through modifying the cross-sectional dimensions of the steel bar component. Concrete is simulated using C3D8R elements with a plastic damage model. Steel bars are simulated using T3D2 elements, while CFRP is simulated using C3D8R elements. The fatigue constitutive models for each material are calculated according to the formula described in Section 2. In addition, rigid pads are placed at the points of concentrated force loading and at the supports to avoid stress concentration.
Corrosion of steel bars can lead to degradation of the bond between steel bars and concrete. Due to the advantages of a clear mechanical concept, simple form and easy setup, the spring cell is widely used to simulate the bond slip between concrete and reinforcement. Therefore, this study simulates the bond slip through setting up spring units between the steel bars and the concrete. The direction perpendicular to the steel bars can be approximated as a rigid connection because the relative slip is small, so a linear spring cell can be chosen to establish. Since the elastic deformation in this direction is small, a larger stiffness factor is required to ensure the accuracy of the numerical simulation. In the direction along the length of the steel bars, the interaction between the steel bars and concrete will show obvious nonlinear characteristics because of the large relative slip, so the nonlinear spring element needs to be established to simulate its mechanical behavior. In this direction, the relationship between the force and displacement of the spring element is nonlinear. The bond–relative slip relationship for the nonlinear spring element is shown in Equation (15), and for uncorroded steel bars, the relationship is determined according to the local bond stress–slip relationship between uncorroded steel bars and concrete proposed by Houdle and Mirga [24], as shown in Equation (16):
where F is the bond force of the spring element. l is the distance between adjacent spring elements. d is the diameter of the steel bar. τ(s) is the bond stress between steel bars and concrete. fc is the compressive strength of concrete. s is the relative slip between steel bars and concrete.
Since corroded steel bars will lead to degradation of the bonding performance between steel bars and concrete, the bonding slip relationship between uncorroded steel bars and concrete needs to be corrected when considering the bonding performance between corroded steel bars and concrete; the whole of Equation (16) needs to be multiplied by a correction factor β to achieve this. Yang et al. [25] proposed a correction formula for the variation of the bond stress degradation correction factor with the corrosion degree η:
Due to the fact that the simply supported beam cannot undergo vertical displacement at both ends and horizontal displacement at one end, when modeling the test beam, the vertical displacement of the two supports and the horizontal displacement of one of the supports were constrained. The left support is constrained in three directions for linear displacement and in two directions for angular displacement (U1 = U2 = U3 = UR1 = UR2 = 0), while the right support is constrained in two directions for linear displacement and in two directions for angular displacement (U2 = U3 = UR1 = UR2 = 0). The boundary conditions are set as shown in Figure 3.
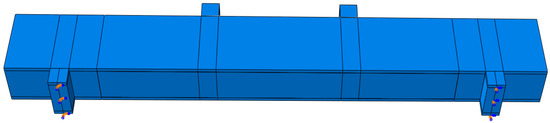
Figure 3.
Boundary condition setting.
This simulation adopts the load application method of centralized force loading, setting the reference point above the mat as the centralized force loading point, and setting the coupling constraint between the loading point and the mat to realize the transfer of centralized force to the mat, as shown in Figure 4.
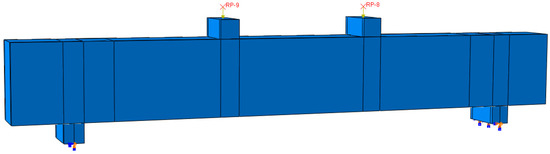
Figure 4.
Concentration force loading setting.
The remaining components are constrained as follows: Binding constrains between concrete and CFRP and between rigid pads and concrete. Coupling constrains between rigid pads and loading point. After analysis and comparison, and finally combined with the size of the model, the mesh of the model is divided by 25 mm, in which there are 3136 solid cells and 522 truss cells. Additionally, the mesh quality of the model beam was checked. The average aspect ratio of concrete components and rigid mat components was 1.5, and CFRP components had a larger aspect ratio due to their thinner thickness, but overall, the model beam had good accuracy while avoiding longer computation time. The finite element model of the strengthened beam is shown in Figure 5 and the meshing of the model is shown in Figure 6.
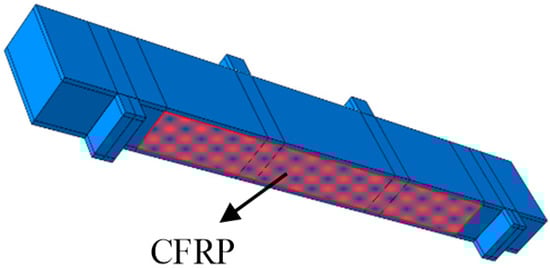
Figure 5.
Finite element model diagram.
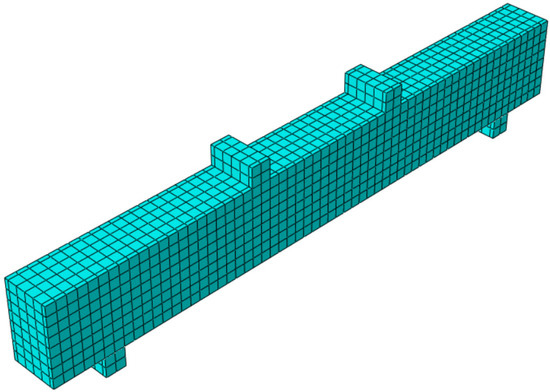
Figure 6.
Mesh of the FE model.
4.3. Fatigue Simulation Results and Correctness Verification
Using the method described above, the test beams in Table 1 were modeled and numerically analyzed. Due to the limited experimental data provided in the literature [23], a comparison of fatigue loading number to median deflection curves of the strengthened beams was chosen for verification, and the comparison results are shown in Figure 7. The comparison of the simulated values of the mid-span deflection of the strengthened beam with the specific values of the experimental results is given in Table 3.
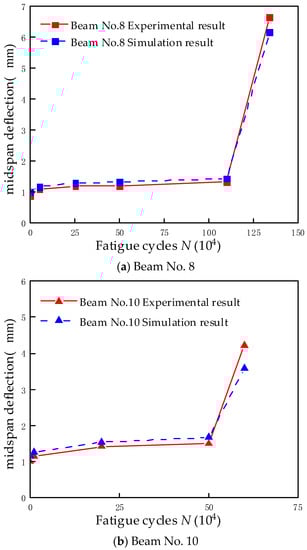
Figure 7.
Comparison of fatigue loading times and mid-span deflection curves of strengthened beams.
Table 3.
Comparison between mid-span deflection simulation results and experimental results.
As shown in Figure 7, the mid-span deflection of the strengthened beam increases rapidly at the beginning of fatigue loading. With the increase in the number of fatigue loading cycles, the mid-span deflection enters a steady development stage and the increase in mid-span deflection slows down. When the strengthened beam approaches fatigue damage, the mid-span deflection rises steeply and quickly reaches fatigue brittle damage. The development trends of both sets of comparison curves are basically consistent, indicating that the simulation results of both beams are in good agreement with the experiment results.
As shown in Table 3, there are certain errors between the simulated and tested values of the mid-span deflection. Possible sources of error include the fact that the fatigue constitutive models for each material are based on certain assumptions and may differ from the actual stress states and fatigue performance of each material in the experiment, and that there may be differences in the boundary conditions of the strengthened beam between the experiment and the simulation.
On the whole, the simulation results of the strengthened beams are basically consistent with the variation trend of the experimental results, and the error range is not more than 15%, which confirms the feasibility and accuracy of the finite element model establishment method used in the simulation, and further follow-up research can be carried out.
5. Analysis of Deformation Performance of CFRP-Strengthened Corroded RC Beams under Fatigue Loading
Based on the theory of calculating the flexural stiffness of CFRP-strengthened RC beams under static load, the method of calculating the mid-span deflection of CFRP-strengthened corroded RC beams after fatigue loading is investigated through considering the effects of steel corrosion and fatigue loading, using the same assumptions as those in the Code of GB50010-2010 [14].
5.1. Calculation of Flexural Stiffness of CFRP-Strengthened Beam under Static Load
The current research on the calculation of flexural stiffness of CFRP-strengthened RC beams under static load is mostly based on the formulae for calculating the flexural stiffness of ordinary RC beams, which are proposed considering the influence of CFRP, and the obtained formulae for calculating the flexural stiffness are either cumbersome in form or debatable in accuracy [26]. Through analysis and comparison, the formula for calculating the flexural stiffness of CFRP-strengthened RC beams proposed by Feng [27] is shown in Equation (18).
where As and Acf are the cross-sectional areas of a tensile steel bar and CFRP, respectively. Es and Ecf are the elastic modulus of the tensile steel bar and CFRP, respectively. h0 is the effective height of the beam section and h is the height of the beam section. ρs is the reinforcement ratio of the tensile steel bar, where ρs = As/(bh0). ρcf is the reinforcement ratio of CFRP, where ρcf = Acf/(bh0). αE is the ratio of elastic modulus of tensile steel bars to concrete, where αE = Es/Ec. αF is the ratio of elastic modulus of CFRP to concrete, where αF = Ecf/Ec. φ is the coefficient of non-uniformity of longitudinal tensile steel bar strain between cracks.
5.2. Effect of Steel Corrosion on Flexural Stiffness of CFRP-Strengthened Corroded RC Beams
This study assumes that there is no relative slip between CFRP and concrete. The effect of steel corrosion on the stiffness of the strengthened beams is mainly reflected in the reduction of steel bar cross-sectional area, the degradation of steel bar strength and the degradation of the bonding performance between steel bar and concrete. The first two factors are considered to be affected via changing the geometric parameters of the steel bar and the yield strength of the steel bar. When steel bars are uniformly corroded, the mass corrosion degree η and the average cross-section corrosion degree ηs of the steel bars are numerically equal. The bond performance between steel bars and concrete is related to the strain inhomogeneity coefficient of longitudinal tensile steel bars between cracks in the Code of GB50010-2010 [14]. k(ηs) is introduced to modify the strain inhomogeneity coefficient of steel bars after corrosion and substituting it into Equation (18) to obtain the formula for calculating the short-term flexural stiffness of CFRP-strengthened corroded RC beams under static load. Considering the applicable range of β in Section 4, this formula is applicable for ηs ≤ 17%, as shown in Equation (19):
where k(ηs) is the strain incongruity coefficient of the steel bar. When ηs = 0, the steel bar is not corroded, and take k(ηs) = 1. When ηs > 0, take k(ηs) = 0.915 + 0.112ηs [28]. As(ηs) is the cross-sectional area of the tensile steel bar after corrosion, which is calculated using As(ηs) = As(1 − ηs), and As is the cross-sectional area of the steel bar before corrosion.
5.3. Effect of Fatigue Loading on Flexural Stiffness of CFRP-Strengthened Corroded RC Beams
The stiffness of CFRP-strengthened corroded RC beams under fatigue load will further degrade. To address this issue, a modification factor λ(N) related to the number of fatigue loading cycles is introduced to modify Equation (19), as shown in Equation (20):
where Bs(N) is the flexural stiffness of the corroded strengthened beam after N cycles of fatigue loading. Bs is the initial flexural stiffness of the corroded strengthened beam.
From the formula for calculating beam deflection in material mechanics, the mid-span deflection of the corroded strengthened beam can be obtained as:
where s is the deflection coefficient related to the form of the load and the support conditions. Bs is the flexural stiffness of the corroded strengthened beam. M is the mid-span bending moment value. l0 is the calculated span.
Due to the lack of fatigue experimental data on CFRP-strengthened corroded RC beams, based on the verification of the correctness of the model in Section 4, Beam No. 8 was used as the reference beam, and the other parameters were kept unchanged but with varying levels of corrosion. Finite element modeling analysis was used to obtain the mid-span deflection data of the strengthened beam under different numbers of fatigue loading cycles, named FB-1, FB-2 and FB-3 for convenience of description, as shown in Table 4. Multiple nonlinear regression analysis was performed using MATLAB, and after several attempts, the function of λ(N) was chosen in the following form, as shown in Equation (22):
Table 4.
Mid-span deflection of simulated beam under different fatigue loading cycles.
The undetermined coefficients were calculated to be a = 1, b = −0.00594 and c = −0.005378. In summary, the formula for calculating the section flexural stiffness of CFRP-strengthened corroded RC beams under fatigue loading is obtained as follows:
5.4. Formulation and Verification of Mid-Span Deflection for CFRP-Strengthened Beams
Combining with the above analysis, the formula for calculating the mid-span deflection of CFRP-strengthened corroded RC beams under fatigue loading is established as follows:
The feasibility and applicability of Equation (24) were verified through collecting experimental data in the literature, and the specific data are shown in Table 5. As can be seen from Table 5, the average value, standard deviation and coefficient of variation of the ratio between the experimental values and the calculated values are 0.95, 0.09 and 0.10, respectively. The experimental values and calculated values are in good agreement, which proves that the formula proposed in this study has certain applicability and can be used for calculating or evaluating the fatigue deformation of CFRP-strengthened corroded RC beams.
Table 5.
Verification of mid-span deflection calculation Formula (24).
6. Conclusions
This study conducted modeling and analysis of CFRP-strengthened corroded RC beams using the finite element software ABAQUS and investigated the deformation behavior of the beams under fatigue loading. The following conclusions were drawn from the study:
- The fatigue constitutive model of each material can accurately reflect the actual state of the material under fatigue loading. Based on the fatigue constitutive models of various materials, the numerical analysis method of fatigue cumulative damage and failure process can simplify the entire process of fatigue loading while ensuring accuracy and improving the efficiency of finite element simulation.
- Based on theoretical research and regression analysis of simulated data on CFRP-strengthened corroded RC beams, a formula for calculating the deflection of CFRP-strengthened corroded RC beams under fatigue loads was obtained. The formula was validated using collected experimental data, which showed that the proposed formula can provide a theoretical basis for calculating or evaluating the fatigue deformation of CFRP-strengthened corroded RC beams.
- Due to the limited current research on CFRP-strengthened corroded RC beams under fatigue loading, the coefficients of the mid-span deflection formula proposed in this study still require further optimization with more experimental data to achieve better accuracy. A series of experimental studies on the deformation performance of CFRP-strengthened corroded RC beams can be conducted in the future to further verify the applicability of the mid-span deflection formula proposed in this study.
Author Contributions
Conceptualization, Z.Z.; Methodology, Z.Z.; Software, T.L.; Validation, T.L.; Formal analysis, T.L.; Data curation, T.L.; Writing—original draft, T.L.; Writing—review & editing, Z.Z.; Supervision, Z.Z. All authors have read and agreed to the published version of the manuscript.
Funding
This research was funded by the National Natural Science Foundation of China (Grant No.: 51978392).
Informed Consent Statement
Not applicable.
Data Availability Statement
Not applicable.
Conflicts of Interest
The authors declare no conflict of interest.
References
- Siddika, A.; Al Mamun, M.A.; Alyousef, R.; Amran, Y.H.M. Strengthening of reinforced concrete beams by using fiber-reinforced polymer composites: A review. J. Build. Eng. 2019, 25, 100798. [Google Scholar] [CrossRef]
- Al-Saidy, A.H.; Al-Harthy, A.S.; Al-Jabri, K.S.; Abdul-Halim, M.; Al-Shidi, N.M. Structural performance of corroded RC beams repaired with CFRP sheets. Compos. Struct. 2010, 92, 1931–1938. [Google Scholar] [CrossRef]
- Triantafyllou, G.G.; Rousakis, T.C.; Karabinis, A.I. Corroded RC beams patch repaired and strengthened in flexure with fiber-reinforced polymer laminates. Compos. Part B Eng. 2017, 112, 125–136. [Google Scholar] [CrossRef]
- Yu, X.; Jiang, C.; Zhang, W. Failure mode-based calculation method for bending bearing capacities of corroded RC beams strengthened with CFRP sheets. Eng. Struct. 2022, 271, 114946. [Google Scholar] [CrossRef]
- Gotame, M.; Franklin, C.L.; Blomfors, M.; Yang, J.; Lundgren, K. Finite element analyses of FRP-strengthened concrete beams with corroded reinforcement. Eng. Struct. 2022, 257, 114007. [Google Scholar] [CrossRef]
- Tran, H.A.; Nguyen, N.T.; Nguyen, T.K.; Nguyen, H.G. Finite element analysis of the flexural behavior of corroded RC beams strengthened by CFRP sheets. Int. J. Geomate 2021, 21, 42–47. [Google Scholar] [CrossRef]
- Sobhy, M.; Khaled, S.; Tim, T. Postrepair fatigue performance of FRP-repaired corroded RC beams: Experimental and analytical investigation. J. Compos. Constr. 2005, 9, 441–449. [Google Scholar]
- Al-Hammoud, R.; Soudki, K.; Topper, T.H. Fatigue Flexural Behavior of Corroded Reinforced Concrete Beams Repaired with CFRP Sheets. J. Compos. Constr. 2011, 15, 42–51. [Google Scholar] [CrossRef]
- Song, L.; Hou, J. Fatigue Assessment Model of Corroded RC Beams Strengthened with Prestressed CFRP Sheets. Int. J. Concr. Struct. Mater. 2017, 11, 247–259. [Google Scholar] [CrossRef]
- Xie, J.; Li, J.; Lu, Z.; Liu, D.; Huang, P. Effects of pre-existing damage and cyclic overloading on the flexural behaviour of RC beams strengthened with prestressed CFRP plates. Eng. Struct. 2021, 247, 113078. [Google Scholar] [CrossRef]
- Zhu, J.; Zhu, X. Study on simplified Method for the Analysis of Fatigue Failure Process of RC Bridges. Eng. Mech. 2012, 29, 107–114, 121. [Google Scholar]
- Holmen, J.O. Fatigue of concrete by constant and variable amplitude loading. Spec. Publ. 1982, 75, 71–110. [Google Scholar]
- GB50010-2010; Code for Design of Concrete Structures. China Architecture & Building Press: Beijing, China, 2015.
- Wang, R.; Zhao, G.; Song, Y. Fatigue of plain concrete under compression. China Civil. Eng. J. 1991, 24, 38–47. [Google Scholar]
- Wang, X.; Zhou, C.; Ai, J.; Petru, M.; Liu, Y. Numerical investigation for the fatigue performance of reinforced concrete beams strengthened with external prestressed HFRP sheet. Constr. Build. Mater. 2020, 237, 117601. [Google Scholar] [CrossRef]
- Moreno, E.; Cobo, A.; Palomo, G.; Gonzalez, M.N. Mathematical models to predict the mechanical behavior of reinforcements depending on their degree of corrosion and the diameter of the rebars. Constr. Build. Mater. 2014, 61, 156–163. [Google Scholar] [CrossRef]
- Liu, F. Study on the Residual Bearing Capacity of Reinforced Concrete after Fatigue Loading. Ph.D. Thesis, University of Chongqing Jiaotong, Chongqing, China, 2016. [Google Scholar]
- Wang, X.; Gu, X.; Zhang, W. Numerical simulation of flexural behavior of corroded reinforced concrete beams. J. Build. Sci. Eng. 2009, 26, 49–54. [Google Scholar]
- Ouyang, X.; Luo, X.; Wang, J. The fatigue properties and damage of the corroded steel bars under the constant-amplitude fatigue load. J. Vibroeng. 2019, 21, 988–997. [Google Scholar] [CrossRef]
- Amran, Y.H.M.; Alyousef, R.; Rashid, R.S.M.; Alabduljabbar, H.; Hung, C.C. Properties and applications of FRP in strengthening RC structures: A review. Structures 2018, 16, 208–238. [Google Scholar] [CrossRef]
- Zhang, Z.; Yang, M. Research on flexural fatigue performance of reinforced concrete beams strengthened with externally bonded FRP based on ABAQUS. J. Nanjing Univ. Sci. Technol. 2021, 45, 116–126. [Google Scholar]
- Liang, J.; Ding, Z.; Li, J. Analytical method for fatigue process of concrete structures. J. Build. Struct. 2017, 38, 149–157. [Google Scholar]
- Song, L.; Yu, Z. Fatigue performance of corroded reinforced concrete beams strengthened with CFRP sheets. Constr. Build. Mater. 2015, 29, 99–109. [Google Scholar] [CrossRef]
- Houdle, J.; Mirza, M.S. A Finite Element Analysis of Shear Strength of Reinforced Concrete Beams. Shear. Reinfor. Concr. 1974, 42, 103–128. [Google Scholar]
- Yang, X.; Sun, G.; Chen, Y.; Wu, T. Analysis on the Deterioration of Bonding Performance between Concrete and Reinforcement in Corroded Reinforced Concrete Beam. Bull. Chin. Ceram. Soc. 2017, 36, 1388–1394. [Google Scholar]
- Chen, X.; Li, H.; Zhu, X. Experimental and theoretical study on short-term stiffness of reinforced concrete beams strengthened with FRP sheets. J. Build. Struct. 2018, 39, 146–152. [Google Scholar]
- Feng, J. Calculation Method for Crack Width and Stiffness of Reinforced Concrete Beams Strengthened with CFRP. Master’s Thesis, University of Zhengzhou, Zhengzhou, China, 2013. [Google Scholar]
- Ma, Y.; Wang, G.; Su, X.; Wang, L.; Zhang, J. Experimental and modelling of the flexural performance degradation of corroded RC beams under fatigue load. Constr. Build. Mater. 2018, 191, 994–1003. [Google Scholar] [CrossRef]
- Loo, K.Y.M.; Foster, S.J.; Smith, S.T. Fatigue Behavior of Carbon Fiber-Reinforced Polymer-Repaired Corroded Reinforced Concrete Beams. ACI Struct. J. 2012, 109, 795–803. [Google Scholar]
Disclaimer/Publisher’s Note: The statements, opinions and data contained in all publications are solely those of the individual author(s) and contributor(s) and not of MDPI and/or the editor(s). MDPI and/or the editor(s) disclaim responsibility for any injury to people or property resulting from any ideas, methods, instructions or products referred to in the content. |
© 2023 by the authors. Licensee MDPI, Basel, Switzerland. This article is an open access article distributed under the terms and conditions of the Creative Commons Attribution (CC BY) license (https://creativecommons.org/licenses/by/4.0/).