Article

Experimental Study on the Properties of Autoclave Curing High-Strength Concrete According to CaO/SiO2 Ratio

1
Environment-Friendly Concrete Research Institute, Kongju National University, 1223-24 Cheonan-daero, Cheonan City 330-717, Chungcheongnam-do, Republic of Korea
2
Department of Architectural Engineering, Kongju National University, 1223-24 Cheonan-daero, Cheonan City 330-717, Chungcheongnam-do, Republic of Korea
*
Author to whom correspondence should be addressed.
Appl. Sci. 2023, 13(10), 6190; https://doi.org/10.3390/app13106190
Submission received: 10 January 2023 / Revised: 9 May 2023 / Accepted: 12 May 2023 / Published: 18 May 2023
(This article belongs to the Section Materials Science and Engineering)

Abstract

:
In this experimental study, tests were conducted to obtain the CaO/SiO2 (C/S) molar ratio that minimizes the micropores of hardened concrete. To this end, the compressive strength, thermogravimetric analysis (TGA), and microporous structure of hardened concrete were investigated using concrete specimens made with silica fume and quartz powder under high-temperature/high-pressure conditions. The tests yielded the following results: (1) the highest compressive strength (200 MP) was exhibited in the C/S molar ratio range of 0.7–0.9, and lower compressive strength was exhibited in the C/S molar ratio ranges of ≤ 0.6 and ≥ 0.95; (2) the productivity of calcium silicate hydrate (C-S-H) tended to increase in proportion to the C/S molar ratio in all specimens; (3) the microstructure was measured using mercury intrusion porosimetry (MIP), and the maximum total porosity of specimens was calculated to be 10%. As the C/S molar ratio increased, the total porosity decreased, as did the pore diameter and threshold pore diameter. Thus, C/S molar ratio was found to be a major factor affecting the compressive strength and microporous structure of autoclave-cured cement and the optimal mechanical properties were exhibited in the C/S molar ratio of 0.8–0.9. However, the reactivity varies depending on the material used and curing conditions employed. Therefore, the hydration products obtained using the curing conditions need to be investigated further.

1. Introduction

Concrete, which is primarily a construction material, has recently been used for other purposes, such as handicraft, furniture, and artificial marble, with consumer needs diversifying [1,2,3]. In particular, high-strength concrete has been developed as an artificial marble product, owing to its high strength and high durability. In general, artificial marble is an organic binder which improves the poor abrasion resistance of natural marble and helps realize diverse patterns [4]. However, artificial marble using an organic binder shows drawbacks such as high price in addition to poor fire, chemical, and impact resistance [5]. This implies a need for research aimed at addressing these problems of artificial marble using high-strength concrete technology.
Inorganic artificial marble using a cementitious binder requires the same level of compressive strength as that of natural stone in addition to the surface properties required as a finishing material. Moreover, since artificial marble is expected to have a higher bending and impact strength compared to stone, it is necessary to use concrete with the fewest possible defects. In general, defects in concrete are closely associated with pore structure [6]. Pores in concrete not only affect its strength, but they are also used as passages for substances that affect durability [7]. For example, contaminants absorbed through pores leave hard-to-efface stains on the surface of artificial marble. Therefore, it is very important to minimize the pores in concrete to improve its durability and surface characteristics. Bichall et al. reported that a concrete’s low flexural strength was attributable to the pores in that concrete [8]. They proposed macro-defect-free (MDF) cement, with large pores (≥100 μm) removed, and reported the research result that high flexural strength could be obtained. However, MDF mixed with organic polymers shows a rapid decrease in strength when contacted with water, and has poor chemical and thermal resistance [9,10].
Methods to reduce pores in concrete include making aggregates of optimum particle size, filling the pores with fine particles, and enhancing reactivity [11]. Fine powders used in concrete are mostly materials with high silica content. Silica raw materials are used as fillers rather than reactive materials at room temperature, but can be used as reactive materials under high temperature/high pressure conditions [12,13]. Different types of silica raw materials tend to have different reactivity depending on oxide content and mineral form, whereby the contribution of the calcium silicate hydrate (C-S-H) reaction is of crucial importance. C-S-H minerals are compounds made by the reaction between the Ca and Si ions in cement and Si ions in the silica raw materials [14,15]. It is, therefore, crucial to investigate the ionization and reaction of these ions under specific conditions [16]. In particular, the properties of hardened concrete change under high-temperature/high-pressure conditions according to the CaO/SiO2 (C/S) molar ratio.
This study experimentally investigated how to minimize pores in high-strength concrete in order to enhance its utility. Specifically, in order to make the structure of high-strength concrete into a microstructure with minimized porosity, the compressive strength and pore structure characteristics were measured, varying the C/S molar ratio in the concrete specimens by adjusting the amount of the silica-based materials in the cement (silica fume and quartz powder) under high-temperature/high-pressure conditions. In addition, the relationship between pore structure and compressive strength was examined by performing thermogravimetry/differential thermal analysis (TG-DTA), X-ray diffraction (XRD) analysis, and scanning electron microscopy (SEM), while varying the C/S molar ratio in the concrete specimens.

2. Materials and Methods

2.1. Materials

The main binders used in this experiment were Ordinary Portland Cement (OPC) compliant with ASTM C150 [17], silica fume, and quartz powder, as shown in Table 1. The OPC used in this experiment had a fineness of 3400 cm2/g and a specific gravity of 3.14 g/cm3. The fineness and specific gravity of silica fume were 200,000 cm2/g and 2.2 g/cm3, and those of quartz powder were 6000 cm2/g and 2.6 g/cm3. Table 2 outlines the physical and chemical properties of quartz used as aggregate. The aggregates had two size ranges: 0.1–0.3 and 0.3–0.7 mm, and were made up of only high-purity materials with a SiO2 content of 99% or higher. Figure 1 plots the particle size distribution of the binders and aggregates used in the experiment. The particle size distribution was measured in accordance with ISO 13320 using a laser diffraction particle size analyzer SALD-2300 (Shimadzu, Kyoto, Japan).

2.2. Methods

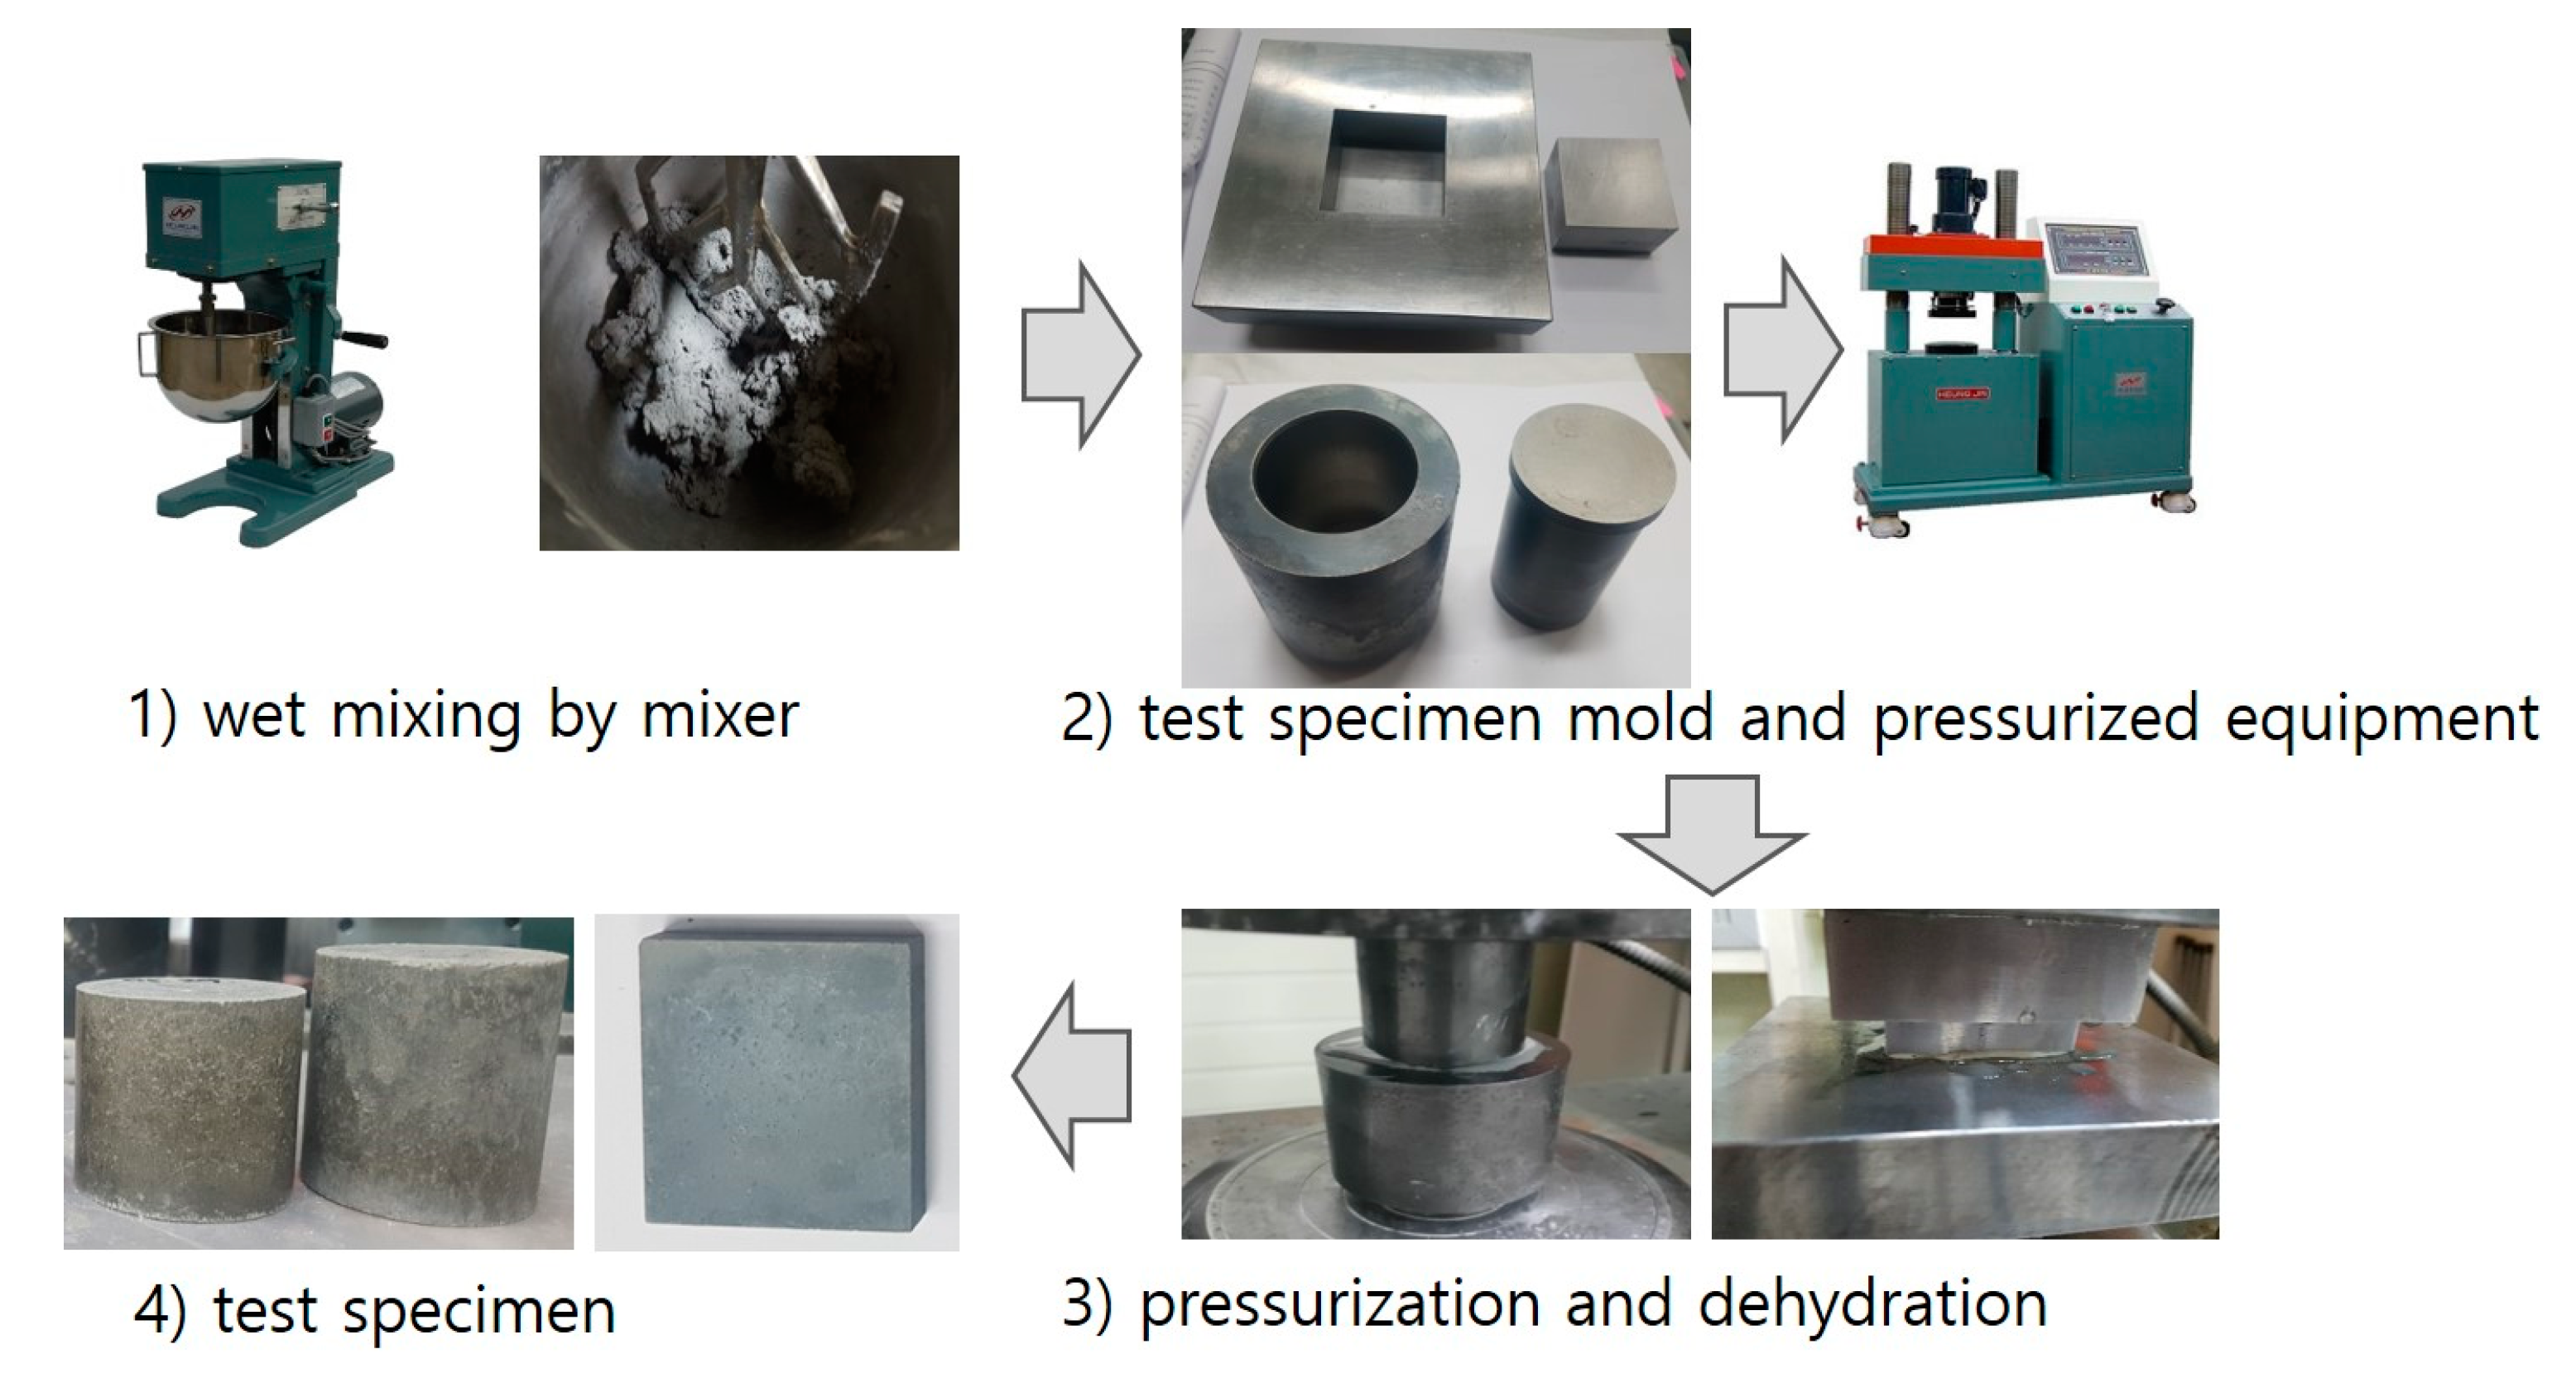
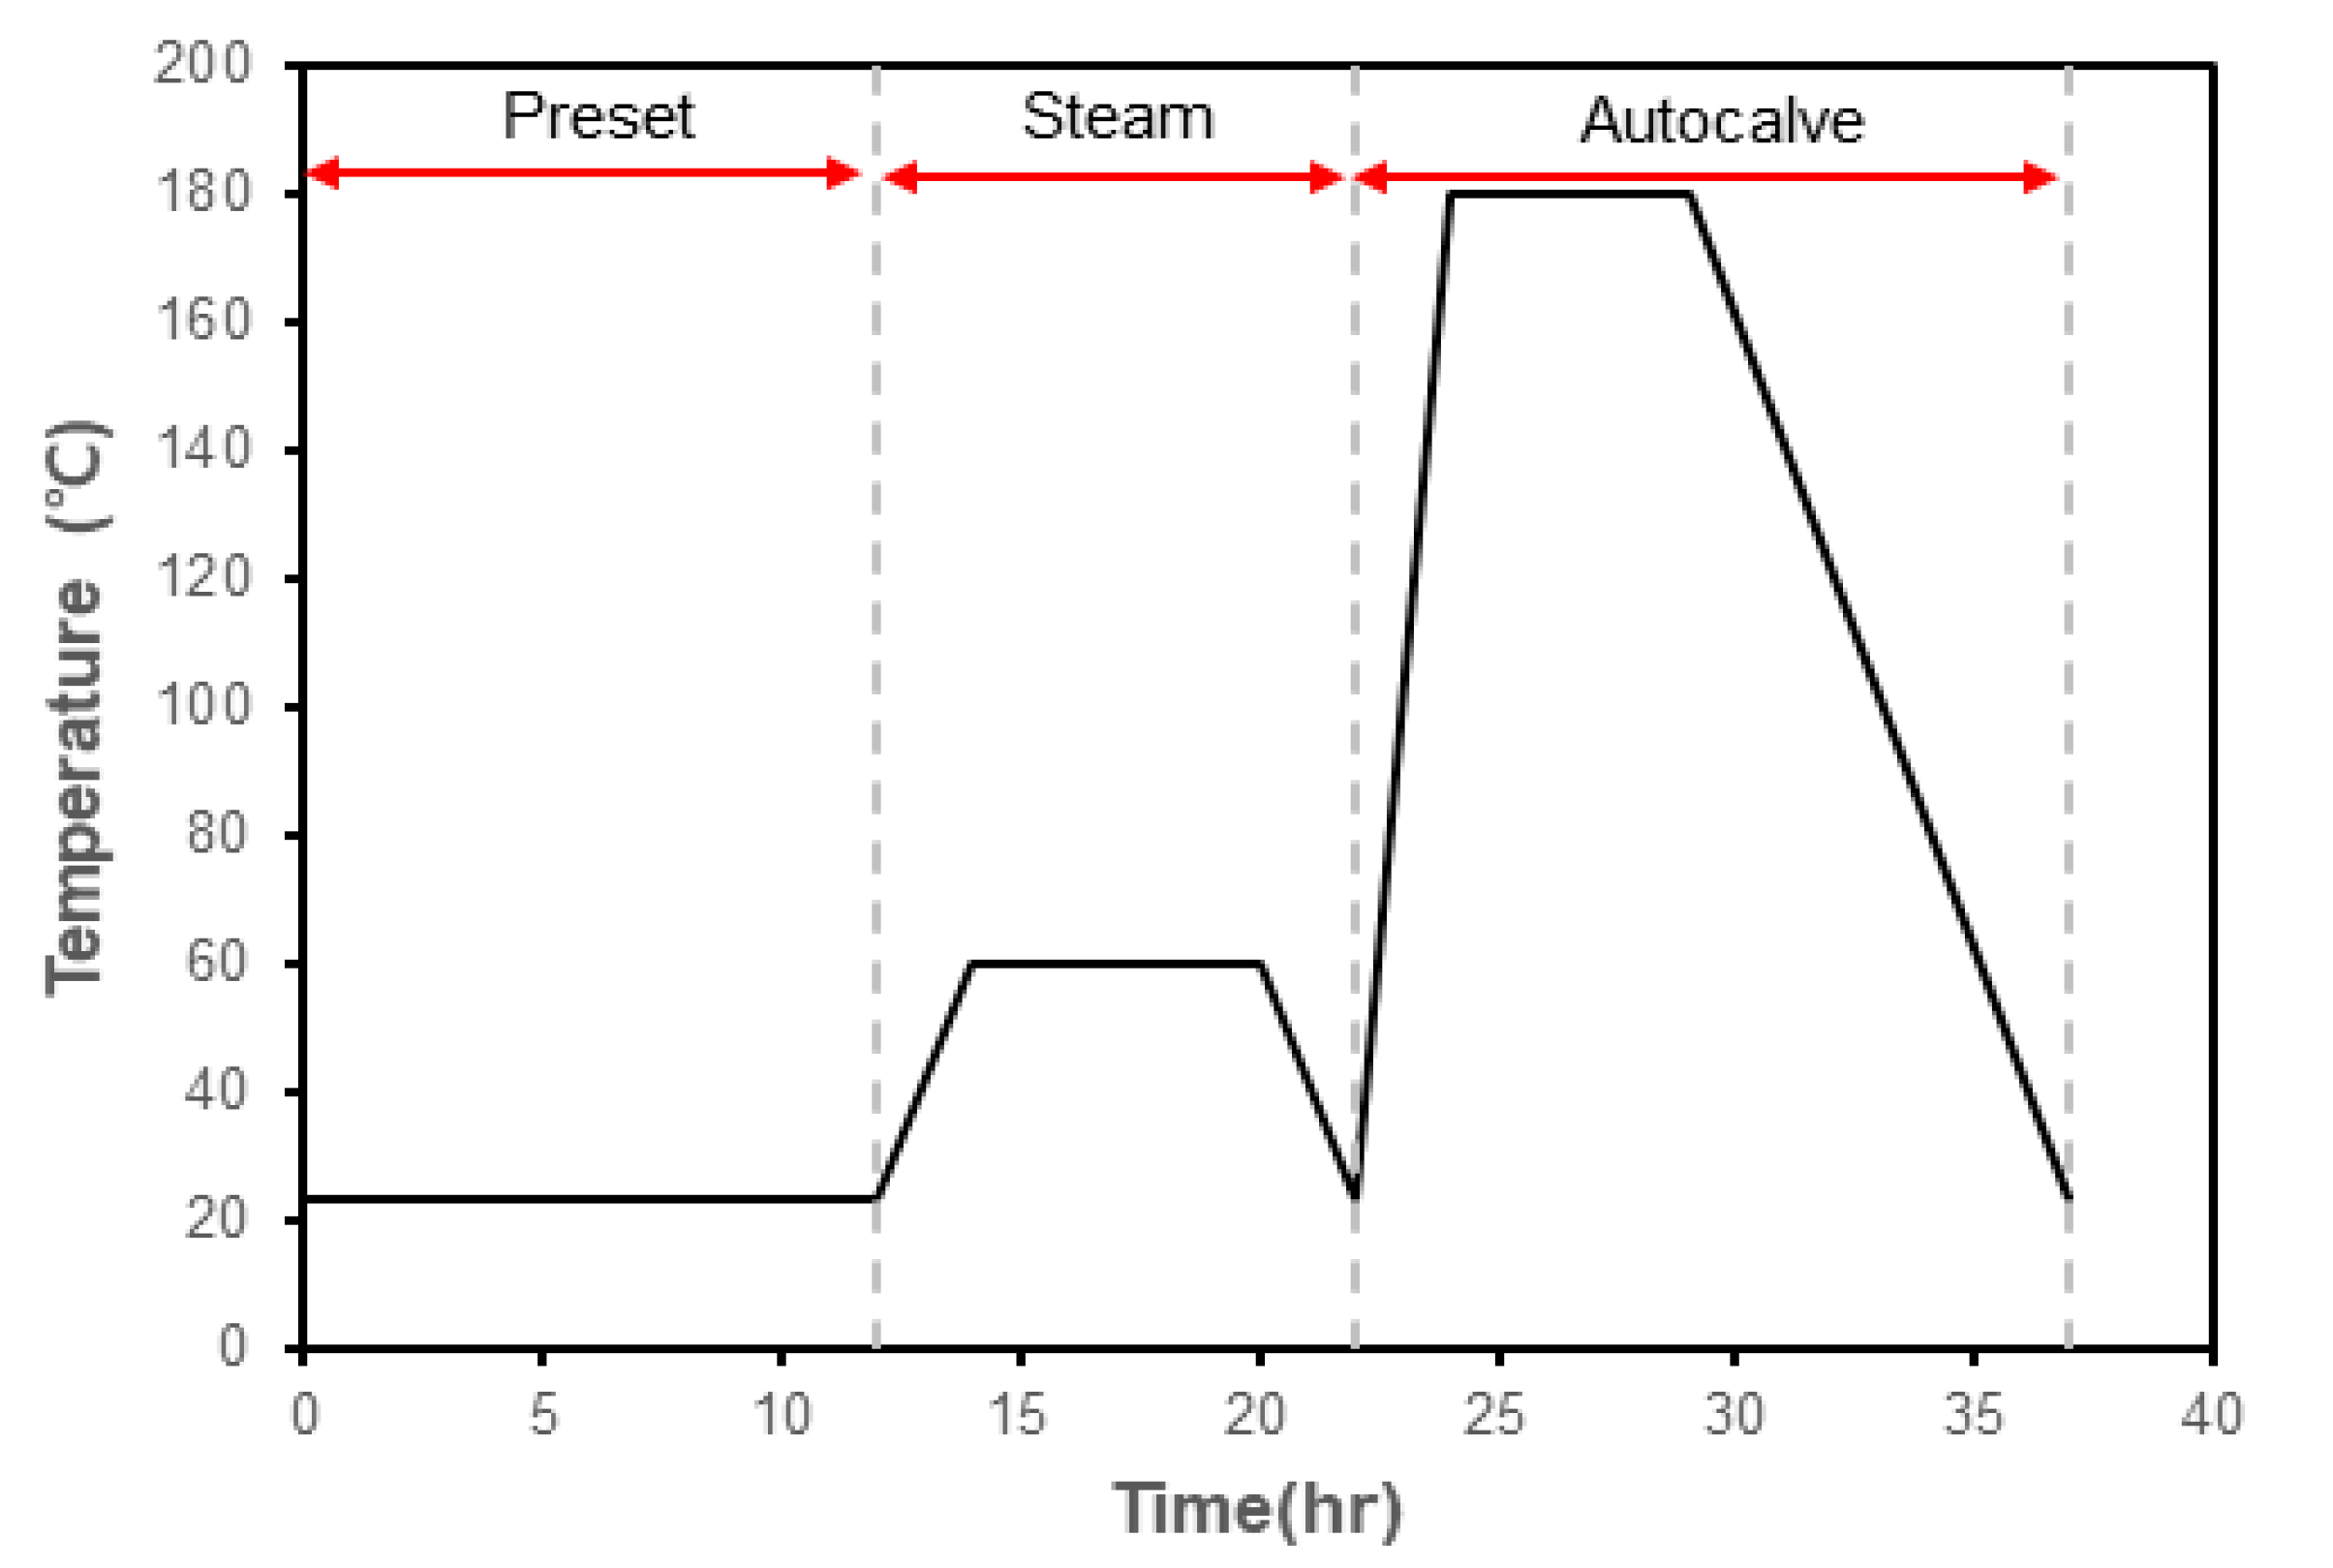
Table 3 and Table 4 show the experimental design and mixing ratios. For the preparation of the specimens, samples were weighed and mixed for 5 min in a mortar mixer and then poured into two molds: a mold for measuring compressive strength (diameter: 50 mm) and a mold for measuring absorption rate (40 × 40 mm), followed by compression molding in a universal material testing machine, applying a compression force of 127 MPa for 6 min. The compression force was removed after removing the water flowing through the mold, as shown in Figure 2, during the compression molding process. The specimens for compressive strength measurement thus prepared underwent preset, steam, and autoclave curing, as shown in Figure 3. The preset curing, an initial hydration process to secure handling strength, was carried out for 12 h at the temperature and relative humidity of 20 ± 3 °C and 60%. Steam curing, a process to secure the volume stability of specimens before autoclave curing, was carried out for 6 h at 60 °C after raising the temperature at a rate of 20 °C/h. Autoclave curing was carried out for 5 h at the temperature and relative humidity of 180 °C and 10 atm after raising the temperature at a rate of 80 °C/h, followed by natural cooling.
The compressive strength was tested in accordance with KS F 2405(ISO 4012:1978) [18], and the water-absorption rate was calculated by measuring and comparing the mass change between a specimen dried at 100 ± 5 °C until it reached a constant weight and a specimen immersed in water for 48 h. The pore size and distribution were measured with mercury intrusion porosimetry (MIP) using the Micromeritics AutoPore IV9500 system. For pore size calculation, the Washburn equation [19], Equation (1), was used.
r = 2 γ cos θ P
where, r is the surface tension of mercury (0.485 N/mm) and θ is the contact angle between the mercury and a pore. The mercury contact angle for calculating the pore diameter was assumed to be 130° [20]. The specimen for pore size and distribution measurements was prepared by drying a sample with a mass of 1–2 g at 100 ± 5 °C for 24 h, and stored in an airtight container after slowly cooling it.
For quantitative analysis of hydration products, TGA was performed using a thermogravimetric analyzer Pyris 1 TGA (PerkinElmer Inc., Waltham, MA, USA) in a nitrogen (N2) environment at a heating rate of 4.5 °C/min up to 1000 °C. For micropore image analysis, hydration products and pore structures were observed with energy dispersive spectroscopy (EDS) using a field emission scanning electron microscope (FE-SEM) (MIRA3-LMH, TESCAN, Brno, Czech Republic). For mineral analysis, an X-ray diffractometer (Rigaku Mini Flex600, Rigaku Ltd., Tokyo, Japan) was used.

3. Results and Discussion

3.1. Compressive Strength

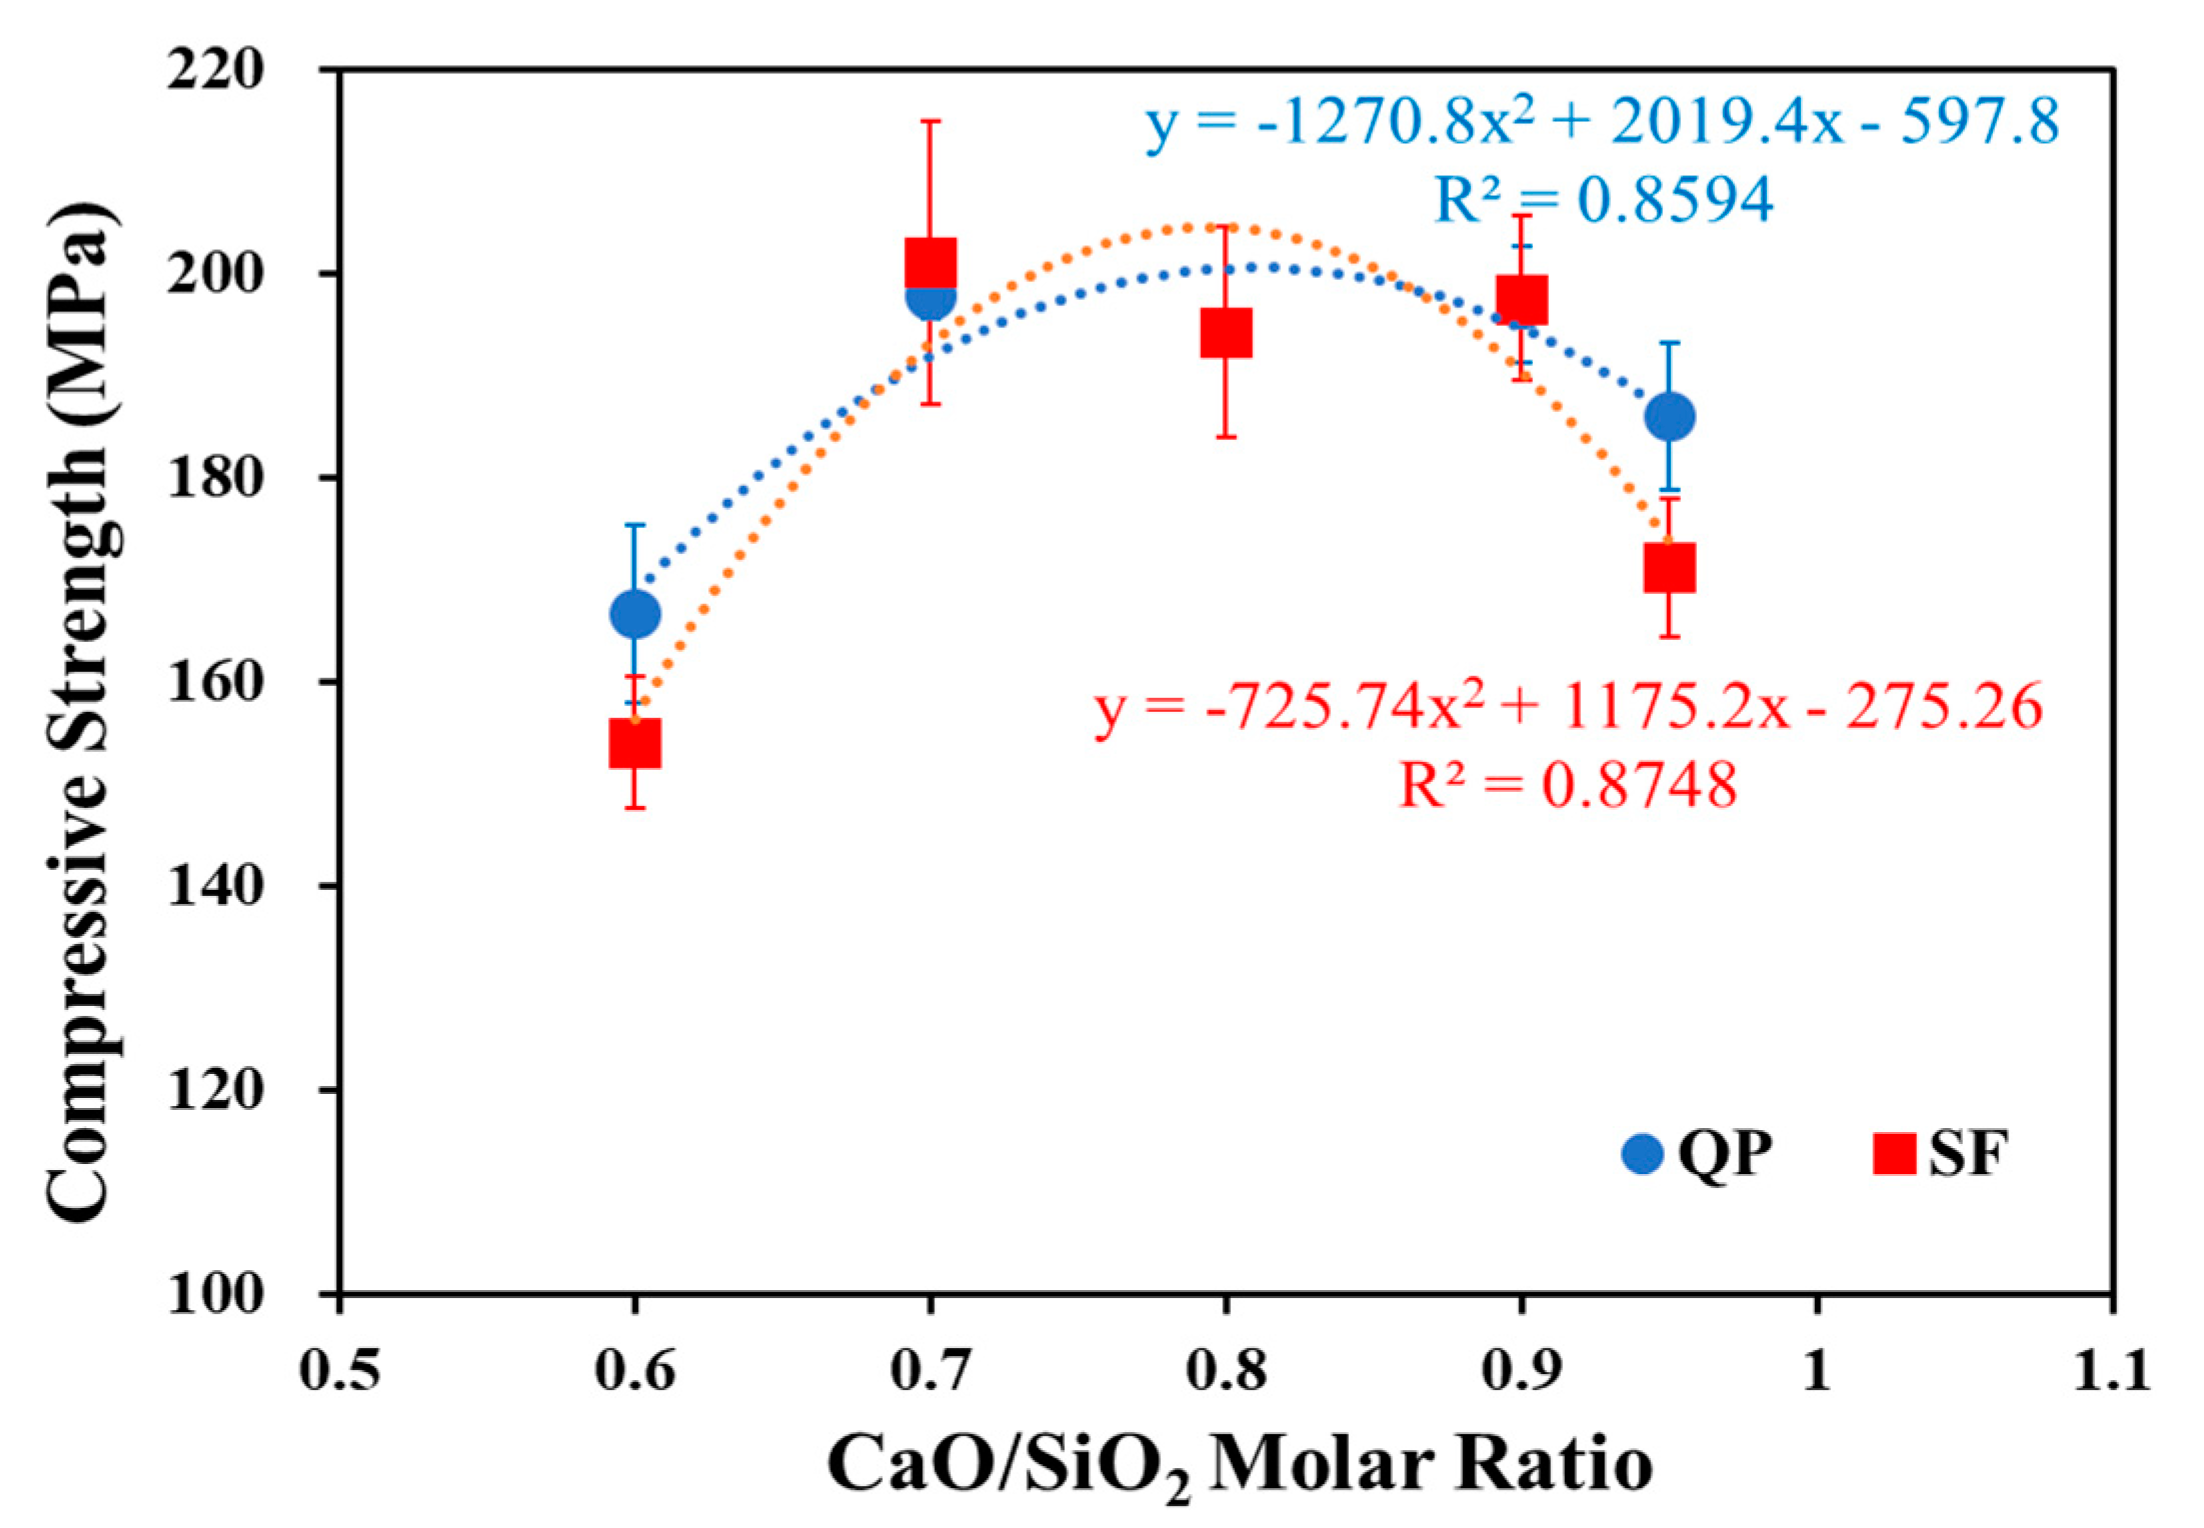
Figure 4 plots graphs for the compressive strength of concrete according to the C/S molar ratio set by adjusting the quantities of silica fume and quartz powder. The highest compressive strength (≥200 MPa) was exhibited by the specimens with a C/S molar ratio ranging from 0.7 to 0.9. At the C/S molar ratio ranges of ≤0.6 and ≥0.95, both silica fume and quartz powder showed lower compressive strength, with the mix ratio adjusted by silica fume showing even lower compressive strength. These results are slightly different from those of previous studies that found the optimal C/S molar ratio range was 0.85 to 1.0 in normal strength concrete and foamed concrete with a high water/binder ratio and a more spacious concrete matrix for the formation of crystalline hydrates [21,22]. These disparate results are presumably ascribable to differences due to the residual unreacted silica in the inorganic high-strength concrete specimens of fine masonry. In addition, the low compressive strength exhibited by specimen SF0.6 with high silica fume content is considered to be associated with the generation of micropores due to an increase in specific surface area.

3.2. Absorption Rate

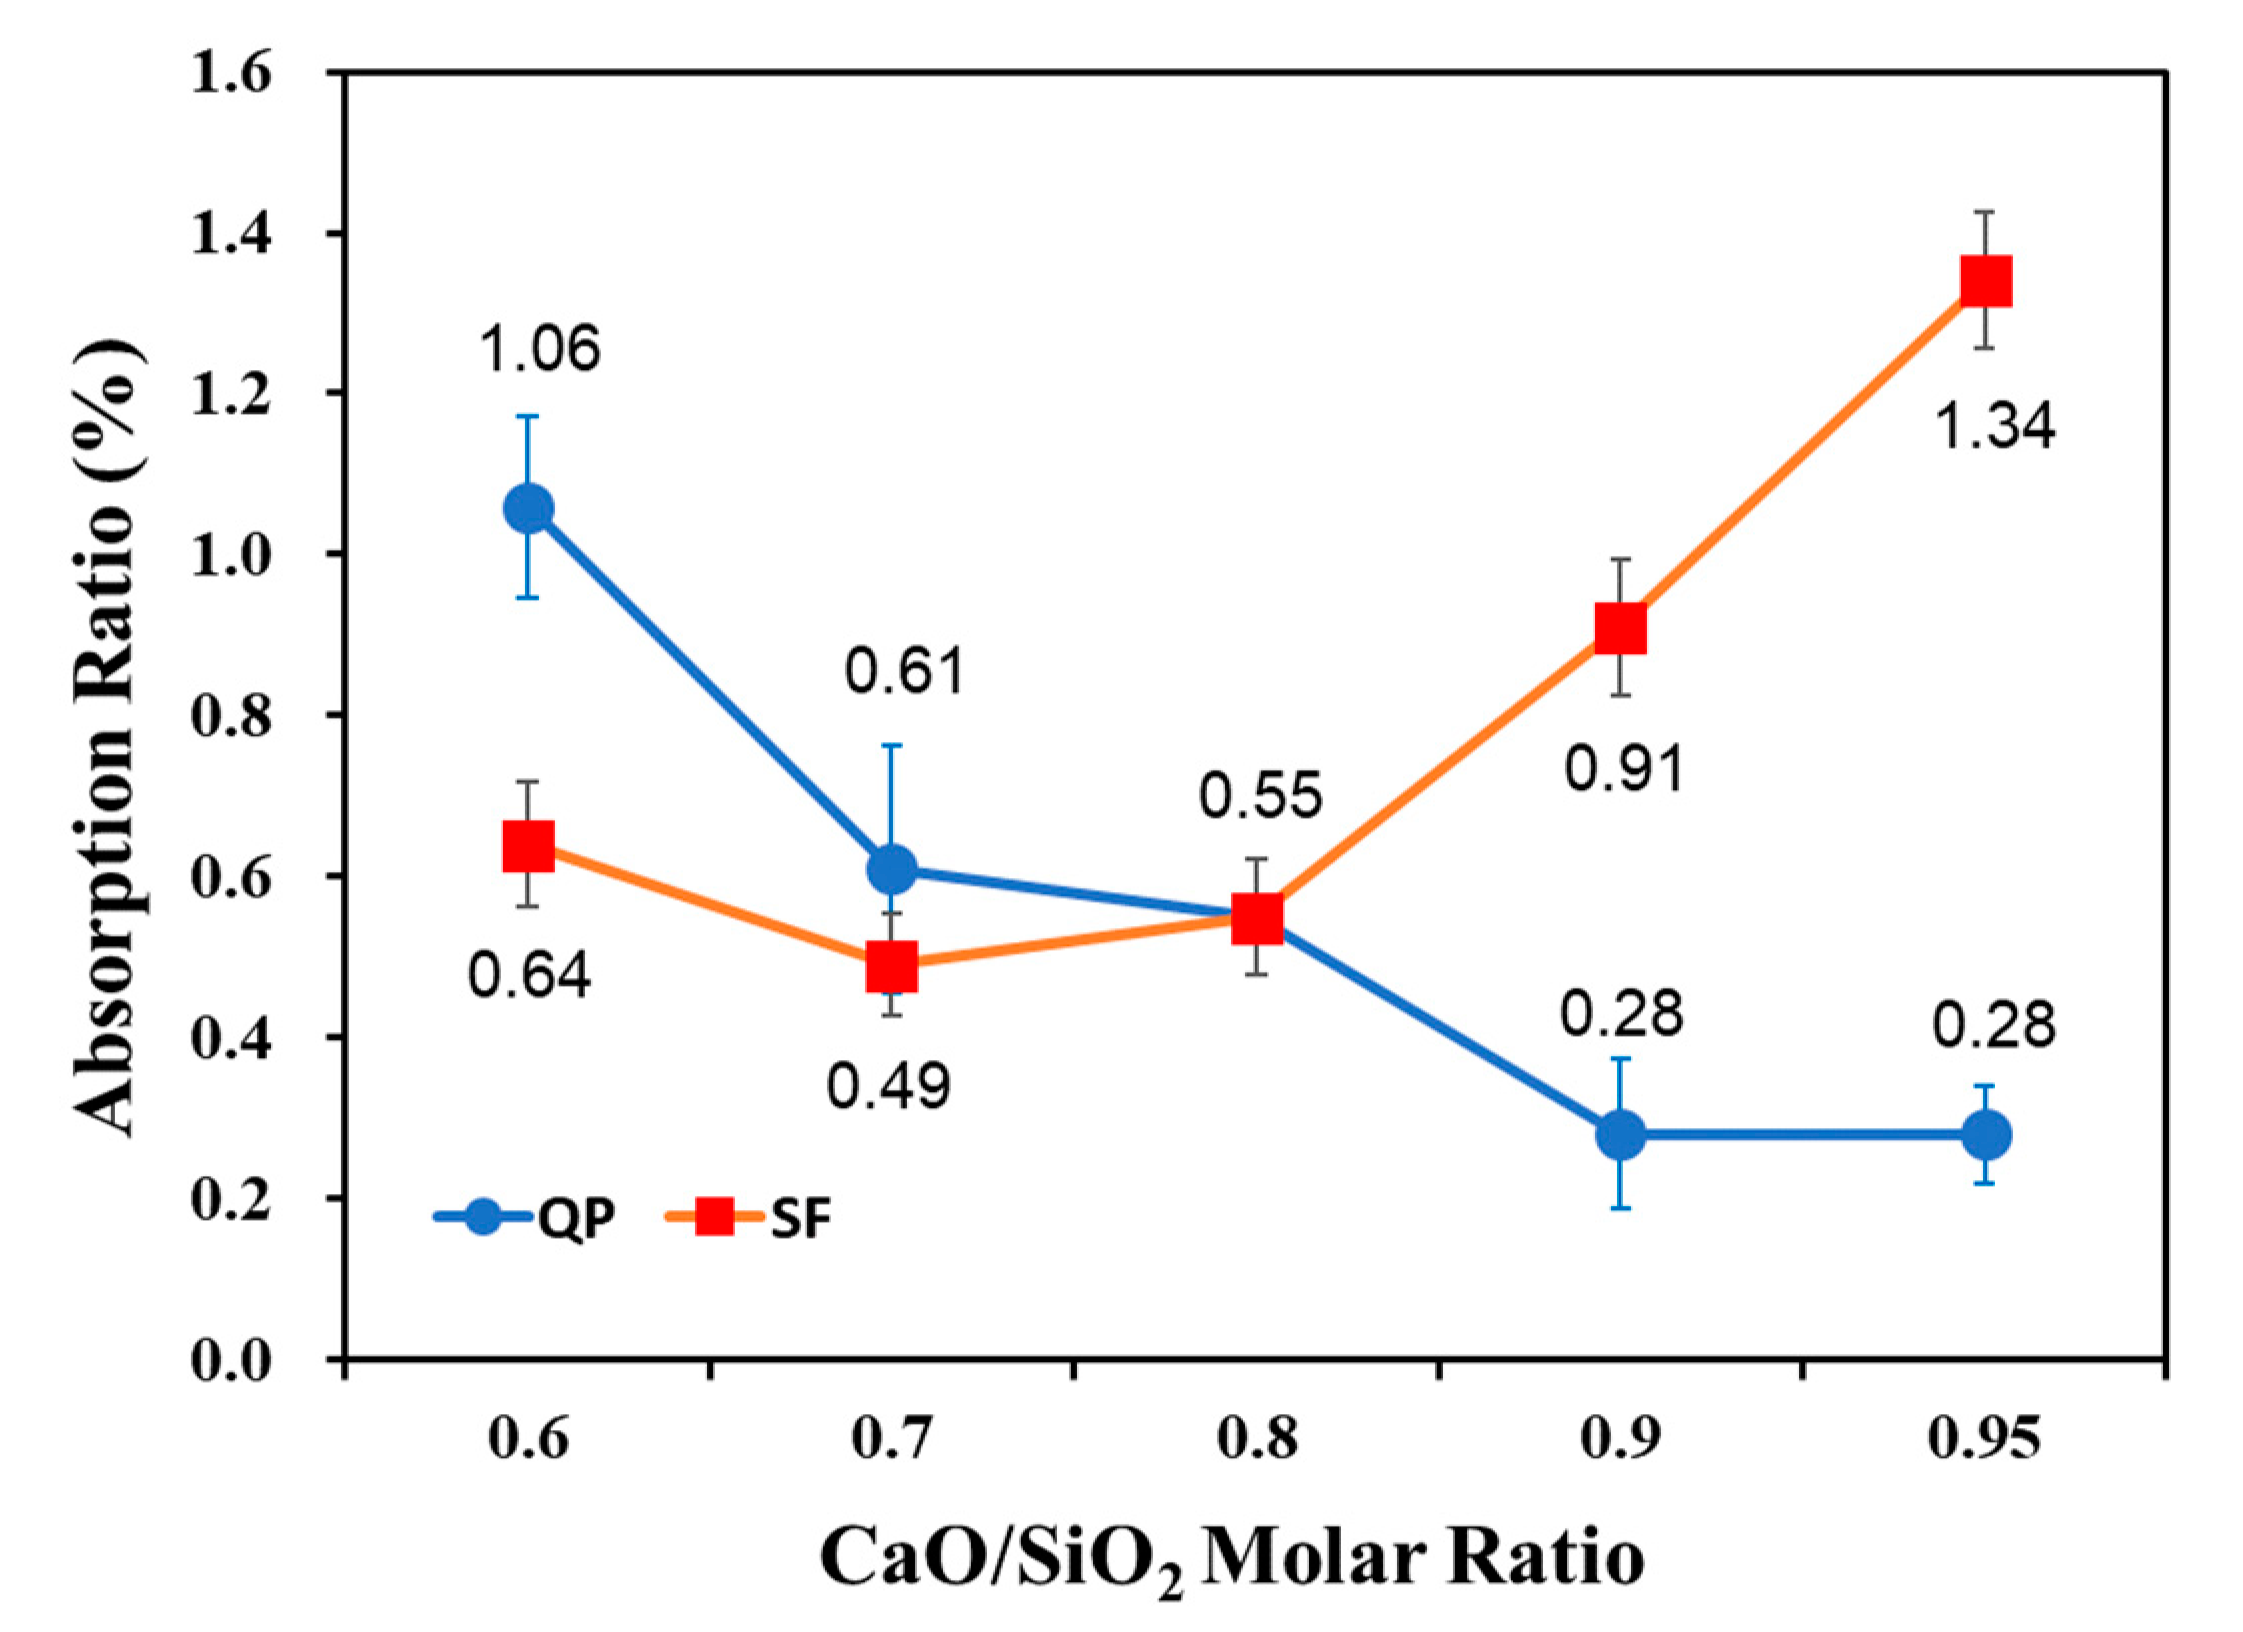
Figure 5 plots the absorption rate of concrete according to the C/S molar ratio adjusted by silica fume and quartz powder. The results generally tended to be inversely proportional to compressive strength, showing low water-absorption rates at the C/S molar ratio range of 0.7 to 0.9, with specimens QP0.95 and SF0.95 showing the lowest and highest water-absorption rates of 0.28% and 1.34%, respectively, demonstrating that a silica fume-based mixing design had a higher absorption rate. This indicates that while C/S molar ratio is the most important determinant of concrete performance in high-temperature/high-pressure curing, the use of fine powders such as silica fume is also an important factor, and that concrete performance is adversely affected by insufficient or excessive content of fine powers compared to an appropriate level [23]. In particular, specimen SF0.95, a mixing design not containing silica fume, has suboptimal particle size distribution due to a low fine powder content in the mixing design, resulting in an increase in pores and, consequently, a high absorption rate.

3.3. Thermogravimetric Analysis (TGA)

Figure 6 shows the results of TGA of the specimens with C/S molar ratios adjusted by silica fume and quartz powder. Wang (1995) examined the decomposition temperature of cement hydration and reported that C-S-H, ettringite, and monosulfate hydration products decompose in the temperature range of 90 to 200 °C [24,25,26]. Drawing on this finding, it was assumed in this experiment that all mass loss in the temperature range of 90–200 °C was due to the decomposition of C-S-H-based products, ettringite, and monosulfate hydration products.
As shown in Figure 6, the ignition loss in the temperature range of 90–200 °C increased in proportion to the C/S molar ratio in the mixing design adjusted by quartz powder. This led to the assumption that the specimen with the C/S molar ratio of 0.95 would have the highest C-S-H hydration capacity because it is inversely proportional to absorption rate, and pores are reduced as the optimal conditions for generating C-S-H hydrate are satisfied. However, the specimens with the mixing design adjusted by silica fume showed low ignition loss at a C/S molar ratio range of 0.7–0.9, and high at ≤ 0.6 and ≥ 0.95, regardless of the water-absorption rate.
The mix in which the C/S molar ratio was adjusted mainly by silica fume showed different results from the absorption rate results. In specimen 0.95SF, which does not contain silica fume, the C/S molar ratio was adequate, but the absorption rate increased, presumably due to the lack of fine powders. In specimen SF0.6, with the highest silica fume content, reactivity increased due to the increase in the amorphous silica fume content. In SF0.6, pores in concrete also increased with an increase in the specific surface area that impeded smooth dispersal, resulting in a disadvantageous water-absorption rate [27].
Figure 7 quantifies the weight loss from dehydration of H2O of C-S-H, ettringite, and monosulfate using the DTA curve at 200 °C or lower, calculated with Equation (2).
Hydrated   Product [ wt % ] = Δ W d r y , 90 200 ° C W d r y , 105 ° C
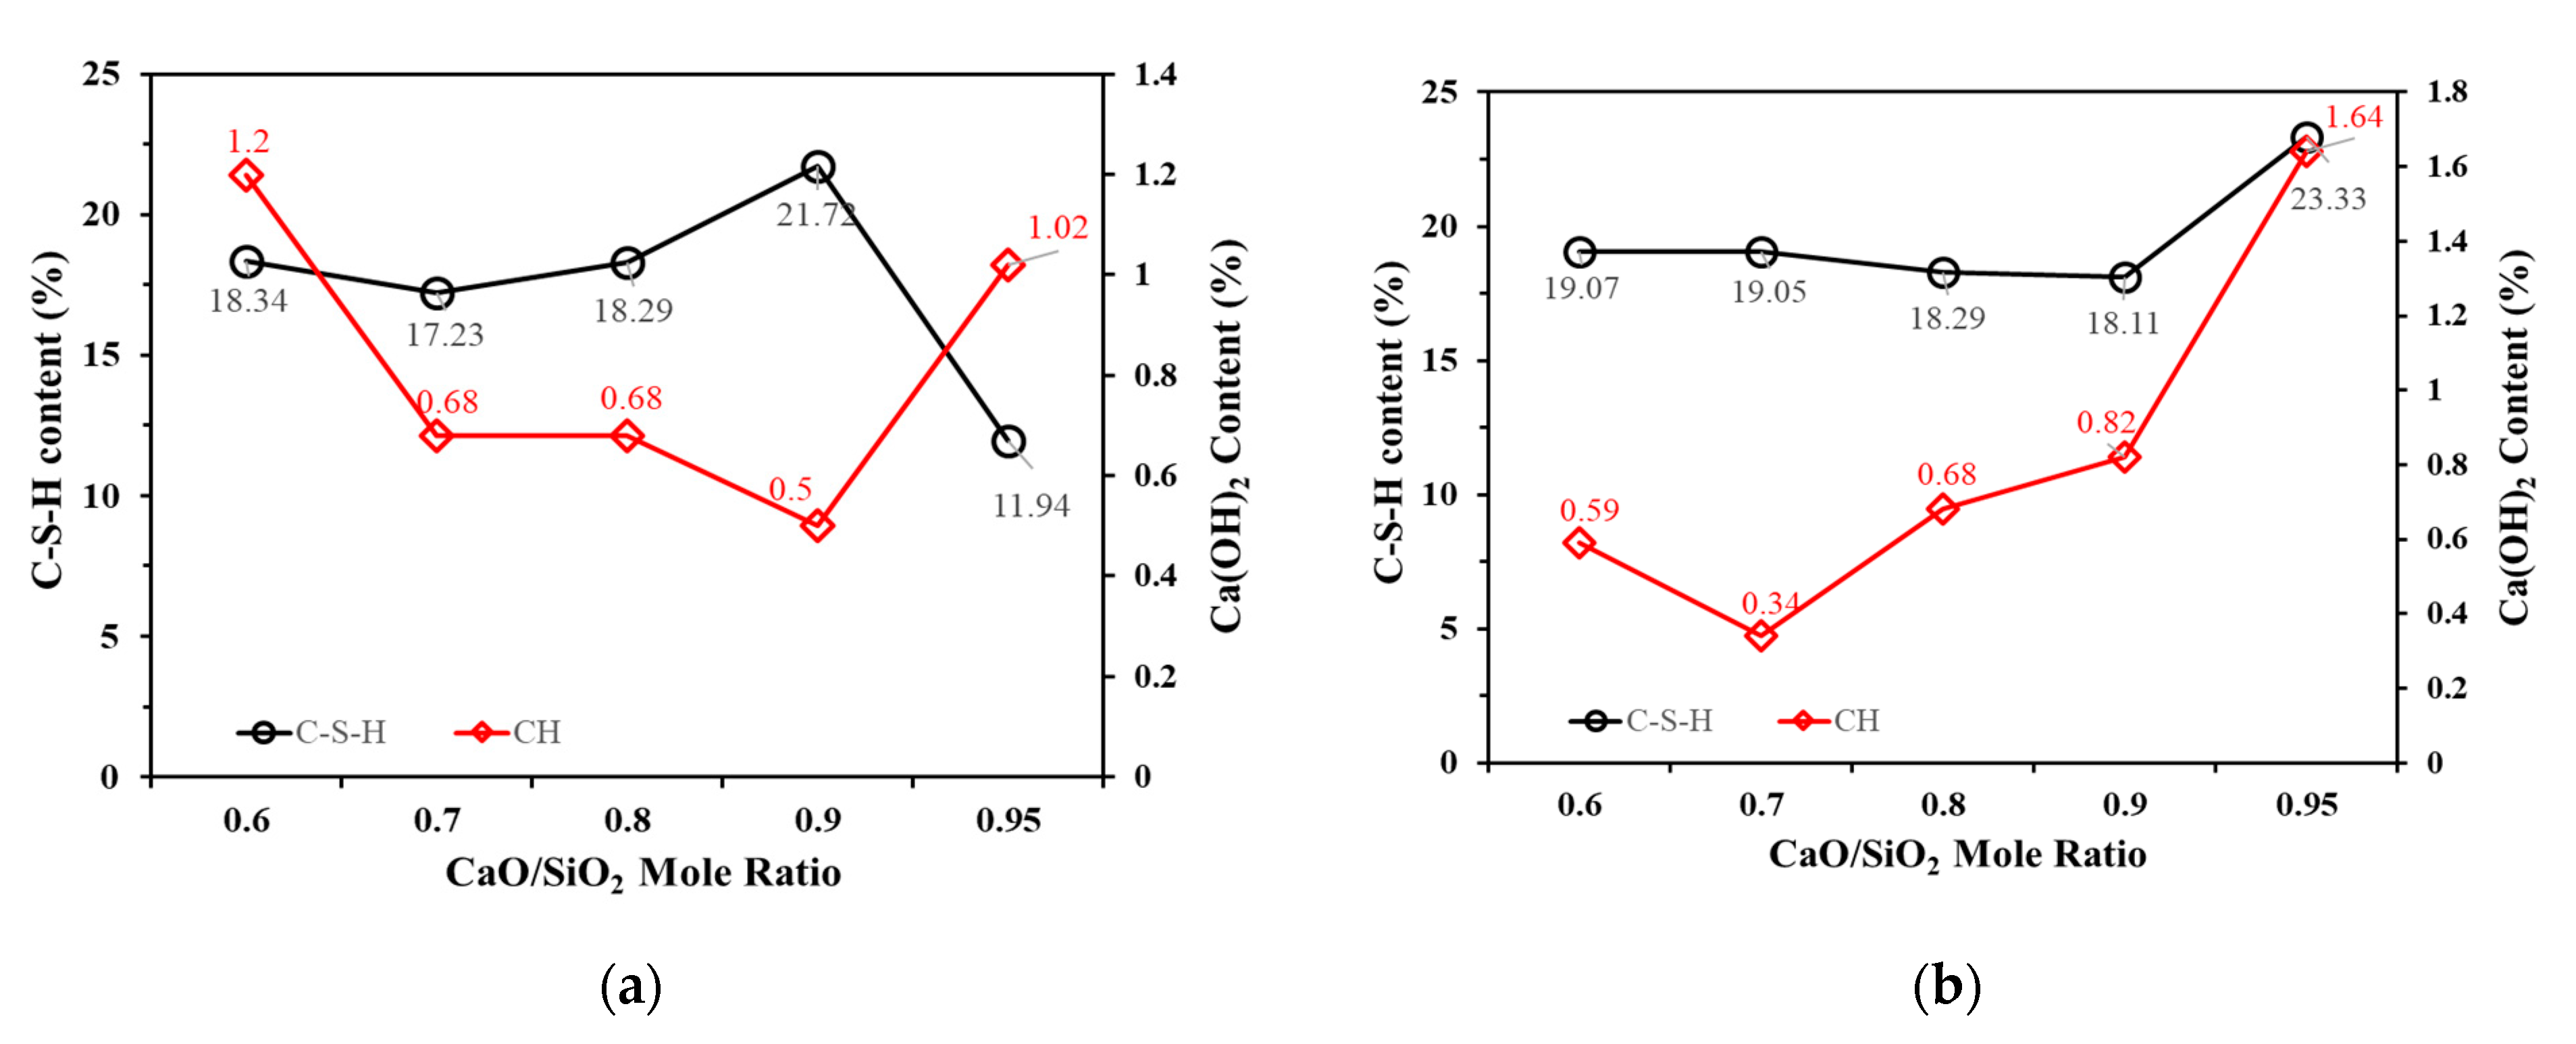
In specimens using quartz powder, the amount of C-S-H increased in proportion to the C/S molar ratio, and the amount of portlandite decreased due to the pozzolanic reaction. In specimens using silica fume, however, an increasing amount of portlandite was generated as the C/S molar ratio increased. These results are assumed to be attributed to a high pozzolanic reactivity of silica fume containing amorphous silica and a low pozzolanic reactivity quartz powder as a crystalline silica material [28].
Generally, during hydration, CH is also produced along with C-S-H; therefore, the two hydrates must have a proportional relationship. In addition, when a pozzolanic material is used, CH is consumed by the pozzolanic reaction; therefore, the amount of CH changes according to the degree of pozzolanic activation.
Figure 7 shows the amount of C-S-H and CH produced by the specimens cured in an autoclave. Figure 7a shows the data when quartz, a crystalline silica, is used. As the relative amount of QP decreases in the range of C/S molar ratio from 0.6 to 0.9, the amount of CH showed similar values for 0.7 and 0.8, but decreased overall. The amount of C-S-H, a CaO hydrate, showed a slight decrease at C/S molar ratios of 0.6 and 0.7, with values of 18.34% and 17.23%, respectively, but increased as the C/S molar ratio increased from 0.7 to 0.9. However, in the C/S molar ratio range of 0.9 to 0.95, the trend of the two hydrates was reversed. Under autoclave conditions, even crystalline silica can participate in the hydration reaction, and the appropriate range is known to be in the range of 0.8 to 0.9 in terms of C/S molar ratio. In the results of this study, as in previous studies, the pozzolan activity was relatively excellent in the C/S molar ratio range of 0.7 to 0.9, and the pozzolan activity was relatively low at the lowest C/S molar ratio of 0.6 and the highest at 0.95.
On the other hand, as can be seen in Figure 7b, which shows the experimental results using amorphous silica SF, the amount of C-S-H production was generally not affected by changes in the C/S molar ratio, except for the case where the amount of silica used was the lowest. Although an inflection point appears at the C/S molar ratio of 0.7, the amount of CH production generally decreases with the decrease of the C/S molar ratio. This means that as the amount of silica used increases, the pozzolanic activity increases. From these results, it was confirmed that when amorphous silica was used, the pozzolanic reaction was most active in a mixture with a relatively high amount of silica having a C/S molar ratio of less than 0.7.
As described above, it was found that amorphous silica, SF, has a relatively excellent pozzolanic activity compared to quartz, which is crystalline silica, and positive results are obtained even when a larger amount is used. However, in this study, amorphous silica had a very high fineness condition of 200,000 cm2/g and quartz had a relatively low fineness condition of 6000 cm2/g; thus, there is an experimental limitation that is not equivalent in terms of reaction conditions. Therefore, there is a need to verify the results of this study by reproducing a similar experiment under the same fineness conditions.

3.4. Mineral Analysis

Figure 8 shows the mineral analysis results of the specimens of different C/S molar ratios according to the use of silica fume and quartz powder. Intense quartz peaks appeared due to the influence of quartz used as aggregate, with the intensity increasing in proportion to the quantity of quartz powder mixture. In accordance with the previously reported results on ignition loss, the quartz powder not only tended to undergo hydration reactions in mineral analysis but also remained as residues after the reaction, which acted as fillers inside the matrix. The C-S-H hydrates appeared in the vicinity of 50°, with non-significant differences in intensity among the specimens [29,30].

3.5. Micropore Characteristics

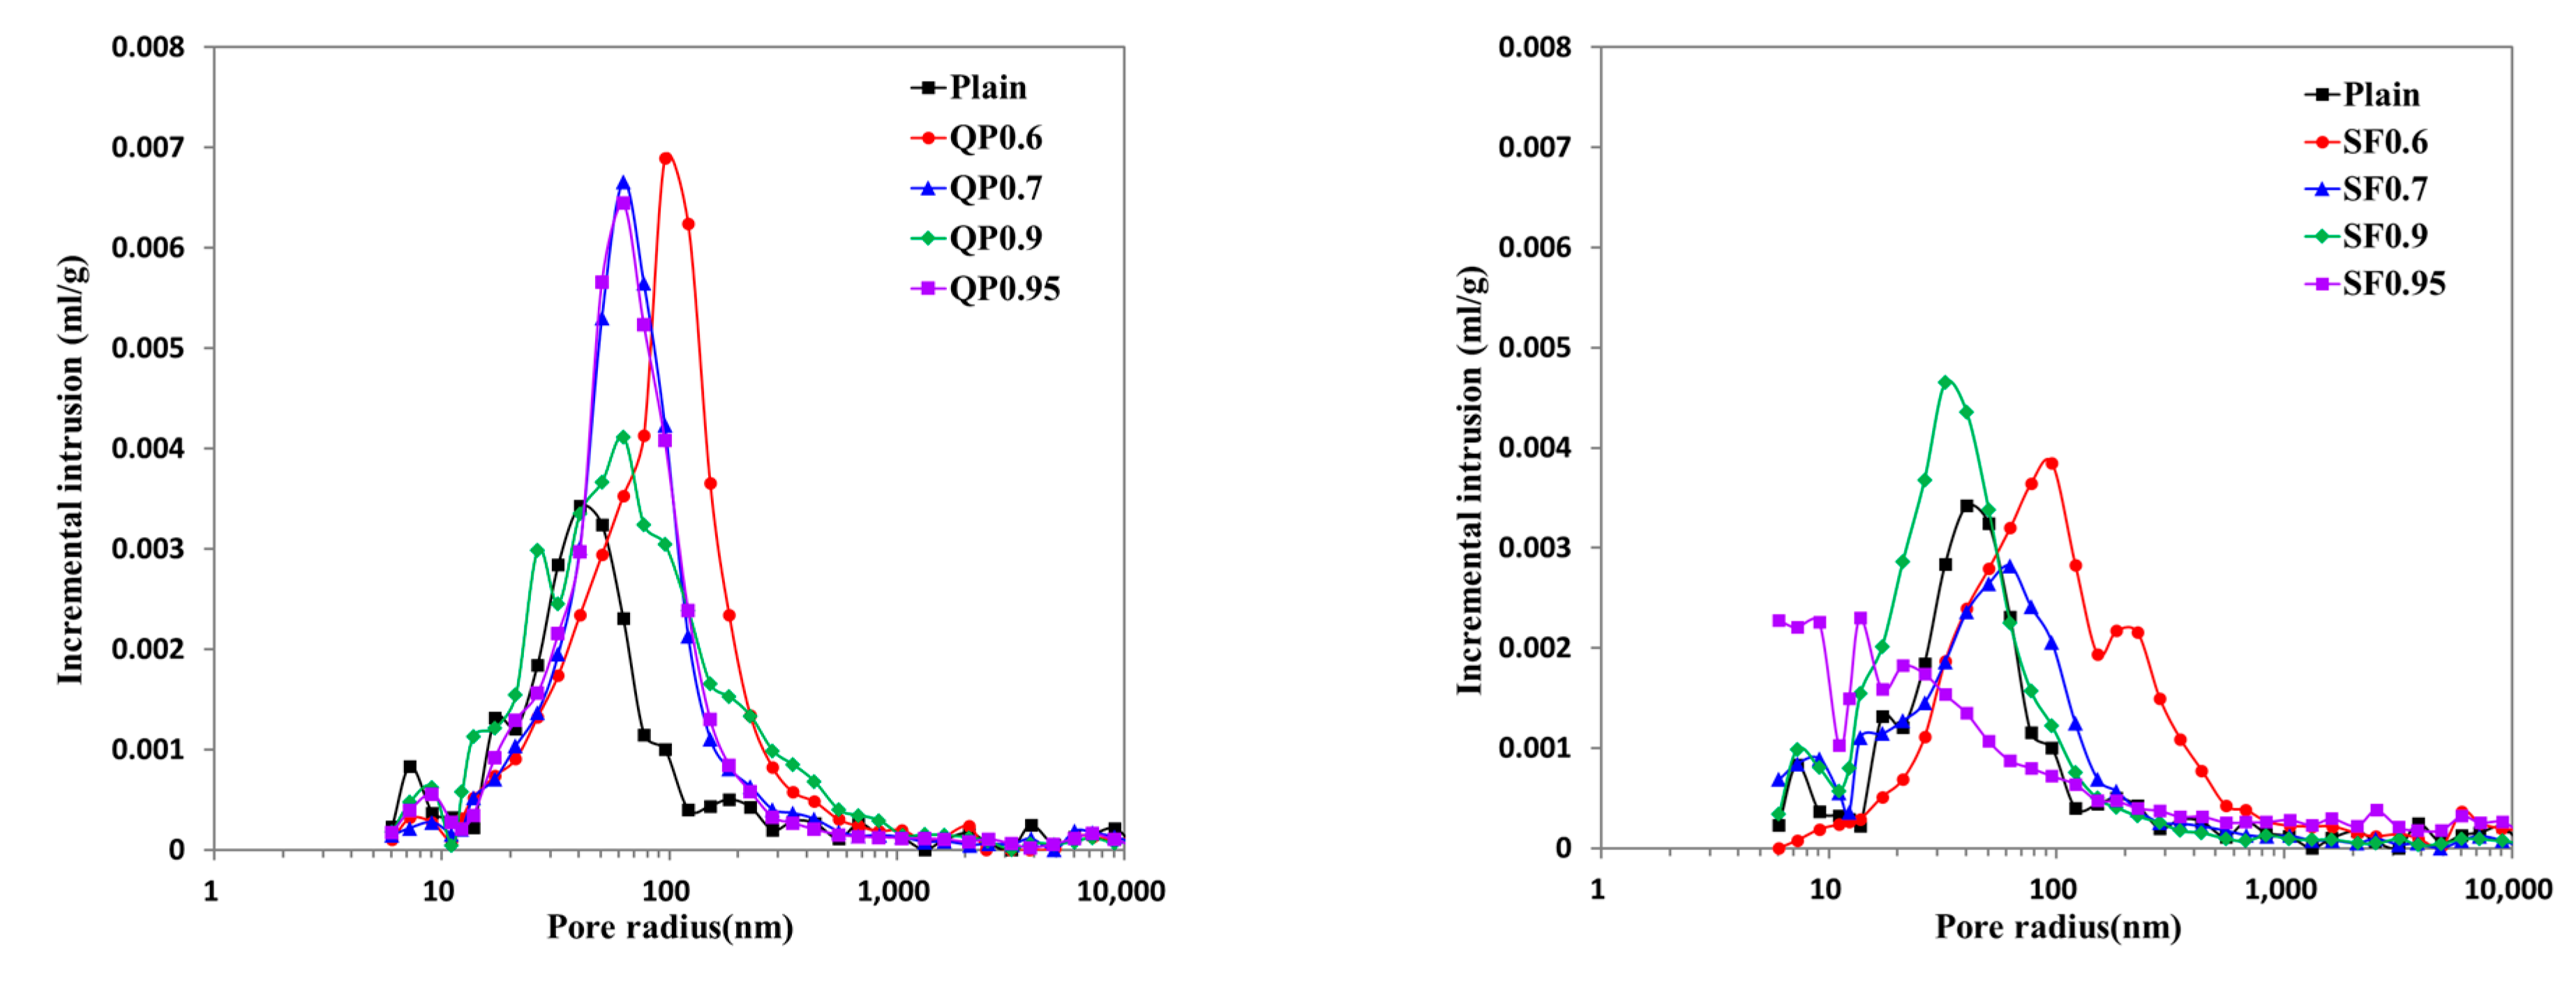
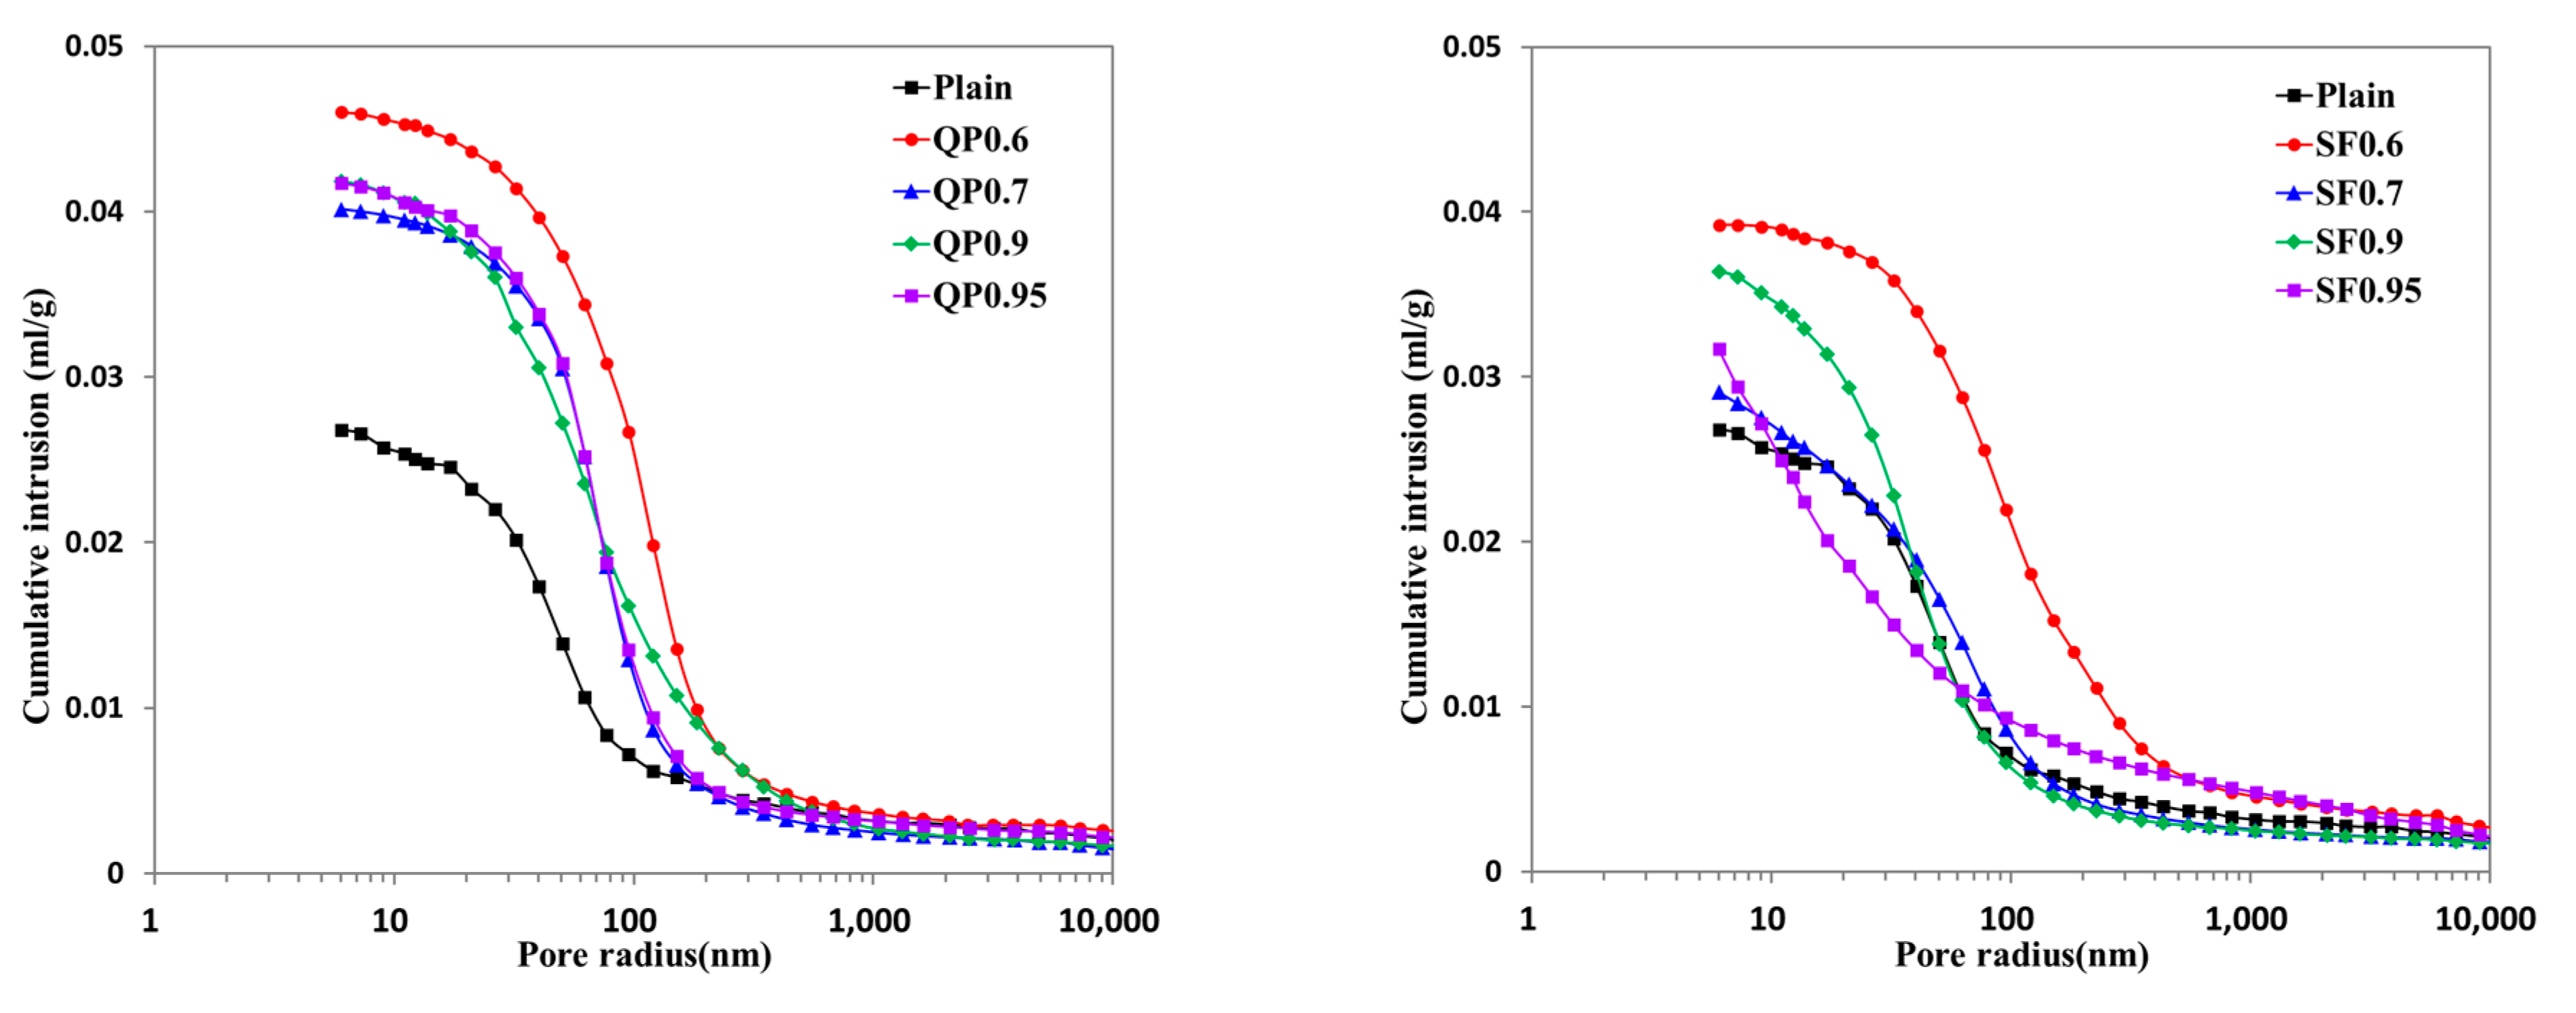
Figure 9 plots the differences in pore-size distribution among the specimens. In all specimens using silica fume and quartz powder, the maximum pore size tended to decrease as the C/S molar ratio increased, with pores in the radius range of 10 to 100 nm being the most frequently measured in all specimens. The QP specimens showed a clear tendency of decreasing pore diameter measured as peak values as the C/S molar ratio increased, reflecting the matrix-filling effect of the hydration products due to the pozzolanic reaction [31]. Figure 10 plots the cumulative pore volume of the specimens. In all specimens using silica fume and quartz powder, the pore volume tended to decrease as the C/S molar ratio increased. This result is similar to that of the strength characteristics of the specimens according to the C/S molar ratio.
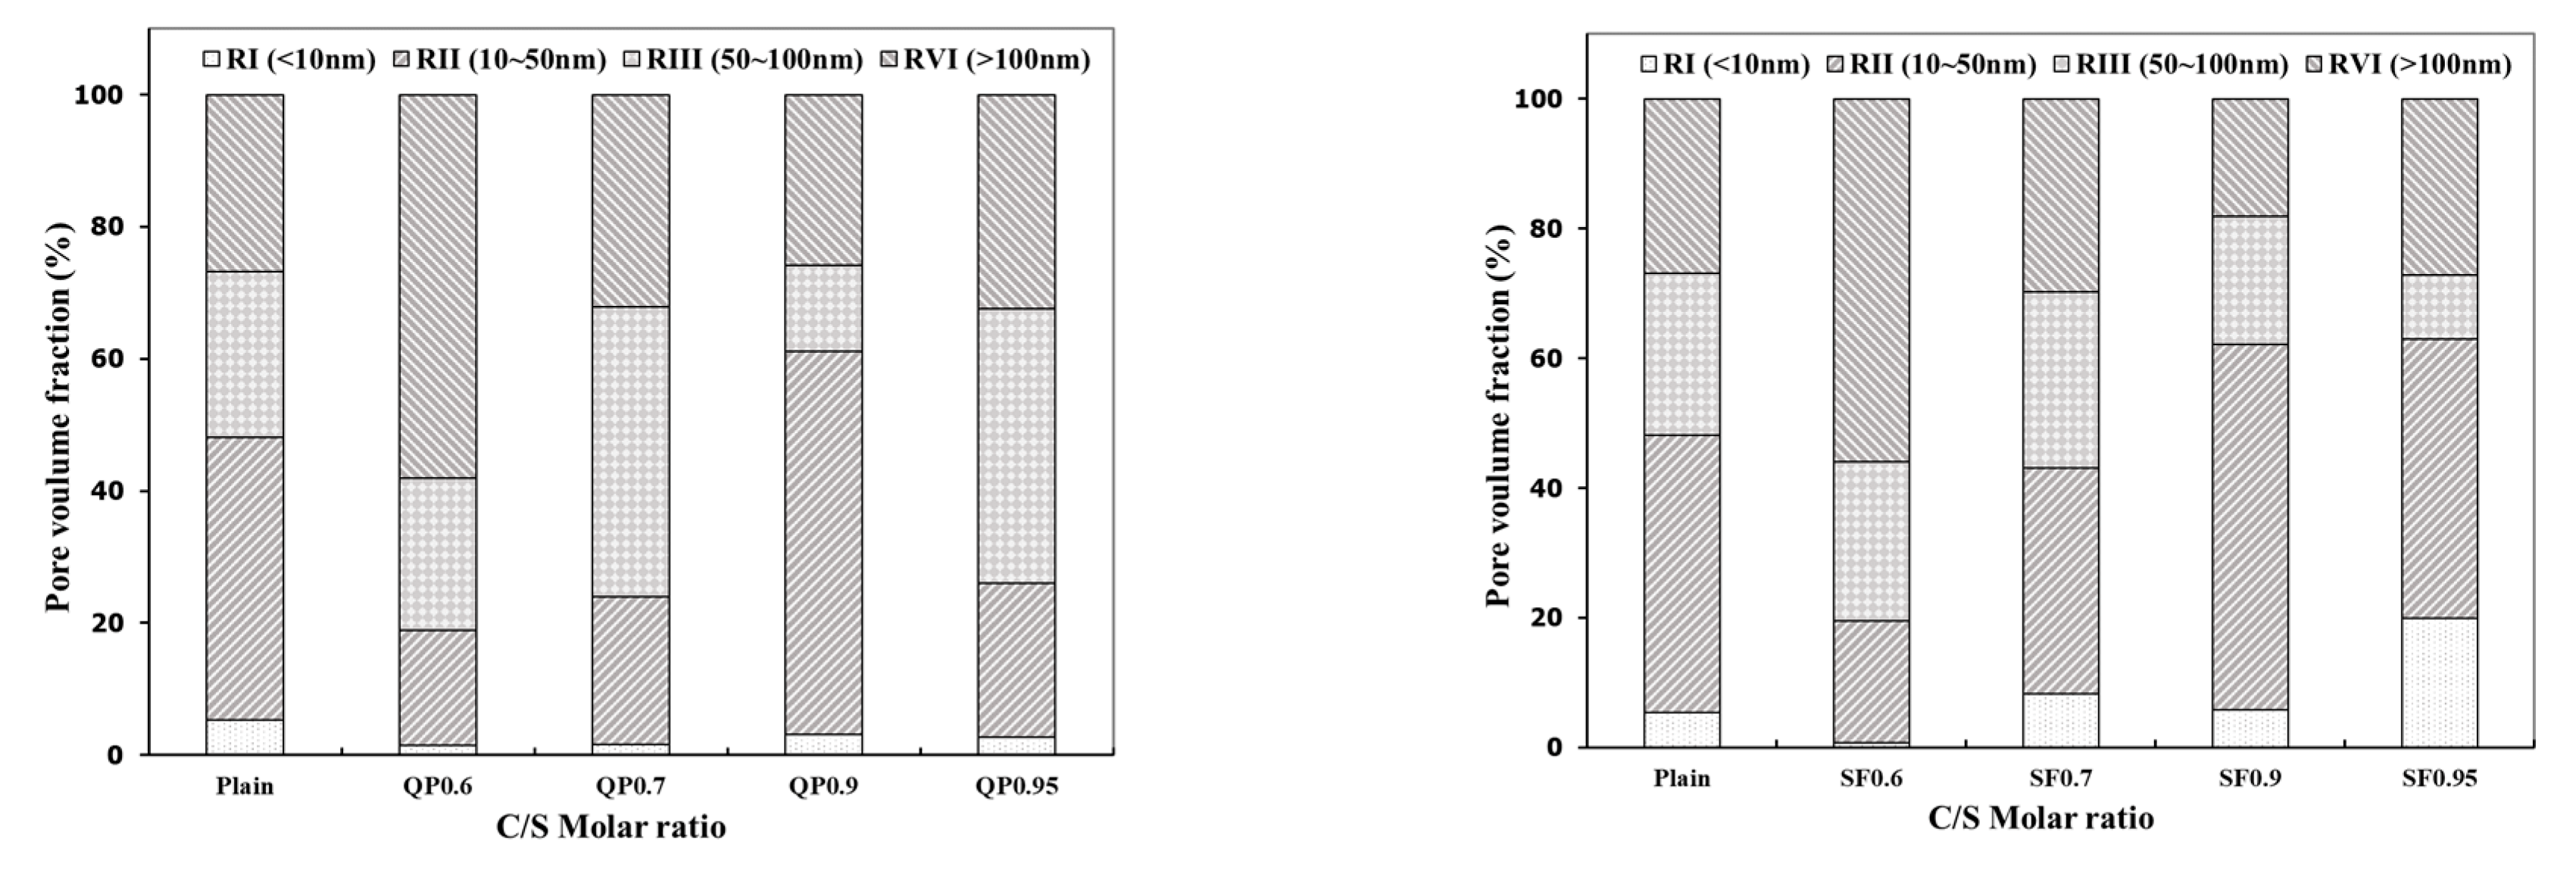
Zeng Liu et al. emphasized the importance of pore-structure identification because the durability of hardened concrete is affected more by pore-size distribution than by total porosity [32,33]. Figure 11 shows the pore-volume fractions of the specimens, with pore sizes classified into meso-pores (<10 nm, 10–50 nm), macro-pores (50–100 nm), and capillary pores (>100 nm) [33,34]. In all specimens, meso-pores increased and capillary pores decreased as the C/S molar ratio increased, presumably due to a decrease in pores, with the pores having been filled by the C-S-H hydrates generated by the hydration reaction as the C/S molar ratio increased [35].
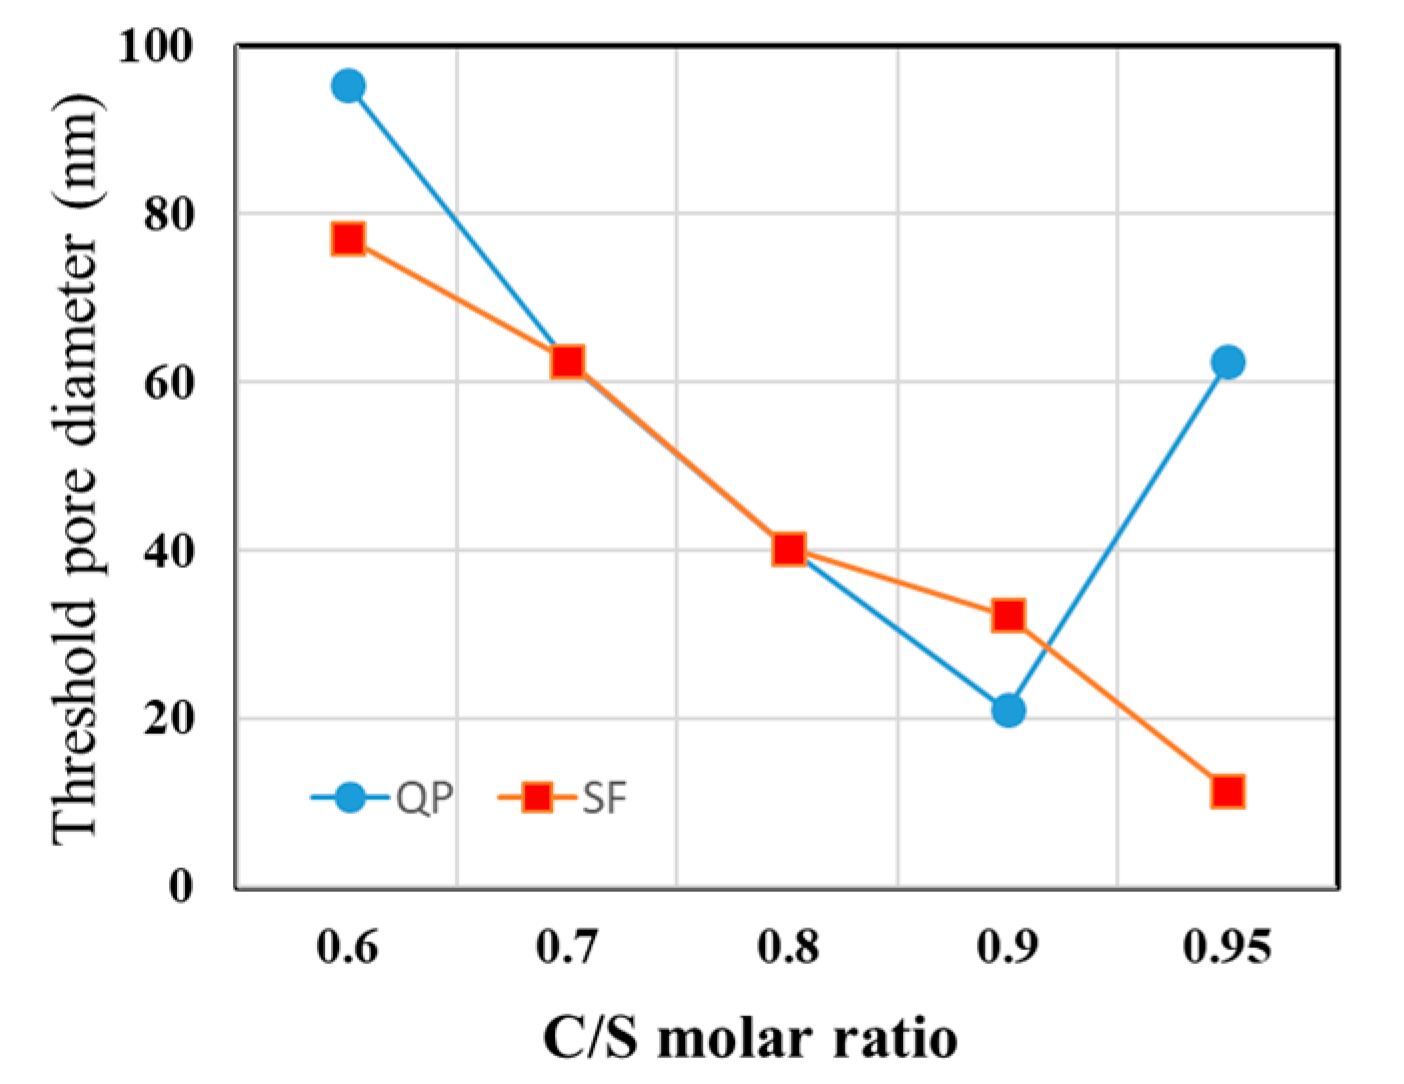
Figure 12 shows the threshold pore diameter of the specimens according to the C/S molar ratio. The threshold pore diameter, which is defined as the pore size at which mercury begins to penetrate a specimen during MIP, is the minimum continuous pore diameter throughout the interior of the specimen [36]. It is associated with durability-related properties of cementitious materials such as porosity, specific surface area, and pore volume [37,38]. The threshold pore diameter tended to decrease with an increase in the C/S molar ratio, with values distributed within the range of 20 to 100 nm. The threshold pore diameter decreased as the C/S molar ratio increased due to the increase in the C-S-H hydrates, which filled the internal pores.
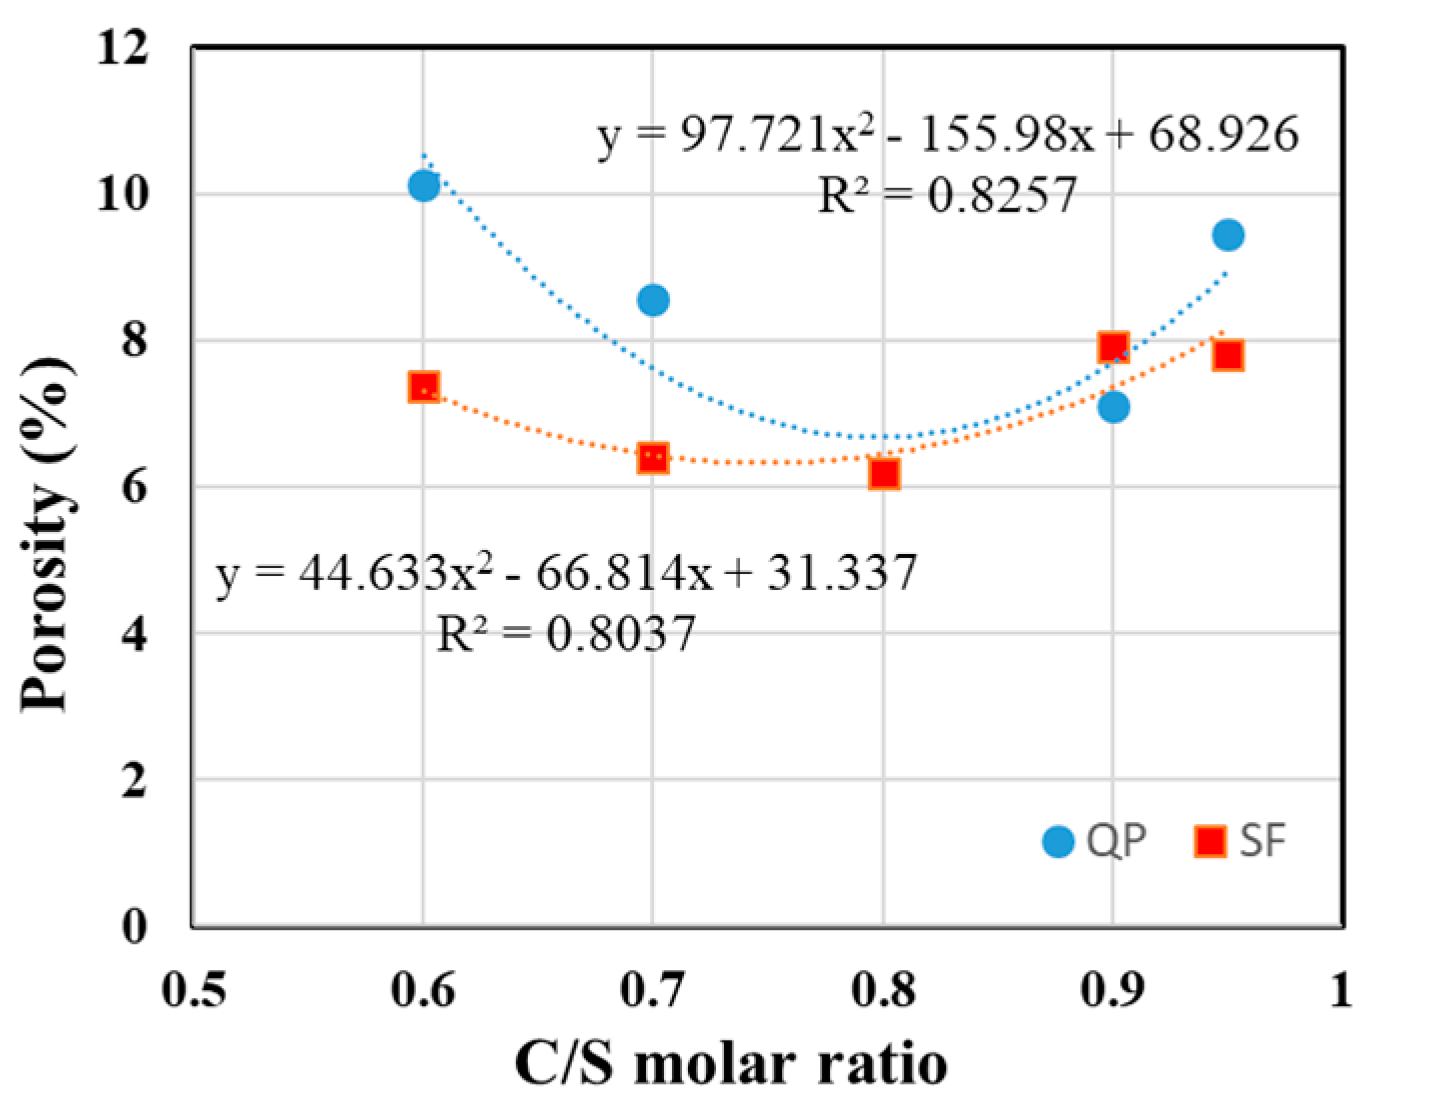
The above results were combined, and regression analysis was performed to examine the relationship between C/S molar ratio and porosity, as shown in Figure 13. The result is inversely proportional to the compressive strength result, consistent with the result of a previous study [39].

3.6. Microstructure

Figure 14 shows the SEM images of the specimens using silica fume and quartz powder according to the C/S molar ratio. In all specimens, the presence of C-S-H hydrates and portlandites was confirmed. Quartz powder specimens, in particular, were found to contain more hydrates generated by the pozzolanic reaction of silica fume compared with the plain specimen [40]. This result suggests that silica fume exhibits high fineness and pozzolanic reactivity. The C-S-H formed by the pozzolanic reaction of silica fume fills the interior of the matrix, reducing pores and contributing to the improvement of compressive strength.
Figure 15 and Table 5 show the images and results, respectively, obtained by EDS point analysis. In both QP0.9 and SF0.9 specimens, in addition to the plain specimen, the presence of portlandites and C-S-H hydrates was confirmed, as shown in Figure 15. The generally known C/S molar ratio of C-S-H hydrates ranges from 0.8 to 1.6 [16]. Specimen QP0.9, with the C/S molar ratios of the points measured at 0.82, 0.88, and 0.96, respectively, was found to have the molar ratio of the C-S-H hydrate tobermorite [41]. Specimen SF0.9 showed a lower C/S molar ratio than specimen QP0.9 and the plain specimen, with the C/S molar ratios of its internal hydrates ranging from 0.5 to 0.8. These hydrates were identified as Z-phase and gyrolite [42], C-S-H hydrates with low C/S ratios, which are known to be more easily synthesizable in a mixing design containing crystalline silica rather than amorphous silica [43,44].

4. Conclusions

In this study, the characteristics of high-strength concrete according to the C/S molar ratio were analyzed by adjusting the mixing quantities of silica fume and quartz powder, which are silica-based materials, under high-temperature/high-pressure conditions to create a microstructure with the minimum possible porosity in concrete. The experimental results can be summarized by the following conclusions:
1. In the quartz powder-centered specimens with a C/S molar ratio ranging from 0.6 to 0.95, compressive strength increased and absorption rate decreased as the C/S molar ratio increased. In terms of the quantity of hydrates according to ignition loss, it was confirmed that the higher the C/S molar ratio, the higher the quantity of C-S-H hydrates.
2. In the silica fume-centered specimens with a C/S molar ratio ranging from 0.6 to 0.95, the highest compressive strength and the lowest absorption rate were shown at the C/S molar ratio of 0.8, and the concrete performance decreased at other C/S molar ratios. Despite high reactivity of silica fume, its optimum mixing ratio is judged to be around 10% of the cement weight in terms of optimum particle size composition.
3. Pore size and volume analysis revealed that the pore size and volume decreased as the C/S molar ratio increased, whereby meso-pores increased and capillary pores decreased. In all specimens, the pore volume distribution ratio tended to coincide with the result of the compressive strength test, which implies that the threshold pore diameter decreases with an increase in the C/S molar ratio due to the pore-filling effect of the hydrates generated in the specimens of hardened concrete.
4. In high-temperature/high-pressure curing conditions, the optimum C/S molar ratio according to the use of silica fume and quartz powder ranged from 0.8 to 0.9, and an optimal mix ratio of powder power was identified. The mixing design adjusted by quartz powder showed excellent results in terms of absorption rate and compressive strength, which allows the conclusion that it is appropriate to derive and utilize the optimum amount of silica fume taking into account the increase in pore volume according to the increase in specific surface area.
Overall, this study confirmed that the C/S molar ratio is a major factor that affects the compressive strength and porosity, and that the optimal molar ratio exists. However, the reactivity varies depending on the material used and curing condition employed. Therefore, the hydration products obtained using the curing conditions should be investigated further.

Author Contributions

Conceptualization, J.K.; methodology, J.K. and J.R.; software, J.R.; validation, J.K. and S.S.; formal analysis, J.R.; investigation, J.K.; resources, J.K. and S.S.; data curation, J.R. and S.S.; writing—original draft preparation, J.K. and J.R.; writing—review and editing, J.K. and J.R. and S.S.; visualization, J.R.; supervision, J.K.; project administration, J.K.; funding acquisition, J.K. All authors have read and agreed to the published version of the manuscript.

Funding

This research received no external funding.

Institutional Review Board Statement

Not applicable.

Informed Consent Statement

Not applicable.

Data Availability Statement

Not applicable.

Acknowledgments

This work was supported by the National Research Foundation of Korea(NRF) grant funded by the Korea government(MSIT) (No. NRF-2020R1A2C2013161).

Conflicts of Interest

The authors declare no conflict of interest.

References

  1. Binici, H.; Aksogan, O.; Shah, T. Investigation of fibre reinforced mud brick as a building material. Constr. Build. Mater. 2005, 19, 313–318. [Google Scholar] [CrossRef]
  2. Rodrigues, R.; de Brito, J.; Sardinha, M. Mechanical properties of structural concrete containing very fine aggregates from marble cutting sludge. Constr. Build. Mater. 2015, 77, 349–356. [Google Scholar] [CrossRef]
  3. Chang, Y.; Huang, P.; Wu, B.; Chang, S. A study on the color change benefits of sustainable green building materials. Constr. Build. Mater. 2015, 83, 1–6. [Google Scholar] [CrossRef]
  4. Ribeiro, C.E.G.; Rodriguez, R.J.S.; de Carvalho, E.A. Microstructure and mechanical properties of artificial marble. Constr. Build. Mater. 2017, 149, 149–155. [Google Scholar] [CrossRef]
  5. da Cunha Demartini, T.J.; Rodríguez, R.J.S.; Silva, F.S. Physical and mechanical evaluation of artificial marble produced with dolomitic marble residue processed by diamond-plated bladed gang-saws. J. Mater. Res. Techno. 2018, 7, 308–313. [Google Scholar] [CrossRef]
  6. Chen, X.; Wu, S.; Zhou, J. Experimental study and analytical model for pore structure of hydrated cement paste. Appl. Clay Sci. 2014, 101, 159–167. [Google Scholar] [CrossRef]
  7. Mehta, P.K.; Monteiro, P.J. Concrete: Microstructure, Properties, and Materials, 4th ed.; ProtoView; McGraw-Hill Education: New York, NY, USA, 2014; Volume 1. [Google Scholar]
  8. Birchall, J.D.; Howard, A.J.; Kendall, K. Flexural strength and porosity of cements. Nature 1981, 289, 388–390. [Google Scholar] [CrossRef]
  9. Donatello, S.; Tyrer, M.; Cheeseman, C.R. Recent developments in macro-defect-free (MDF) cements. Constr. Build. Mater. 2009, 23, 1761–1767. [Google Scholar] [CrossRef]
  10. Drabik, M.; Mojumdar, S.C.; Slade, R.C.T. Prospects of novel macro-defect-free cements for the new millennium. Ceramics 2002, 46, 68–73. [Google Scholar]
  11. Rodrigues, F.A.; Joekes, I. Macro-defect free cements: A new approach. Cem. Concr. Res. 1998, 28, 877–885. [Google Scholar] [CrossRef]
  12. Eker, H.; Bascetin, A. Influence of silica fume on mechanical property of cemented paste backfill. Constr. Build. Mater. 2022, 317, 126089. [Google Scholar] [CrossRef]
  13. Tuylu, S. Investigation of the effect of using different fly ash on the mechanical properties in cemented paste backfill. J. Wuhan Univ. Technol. Mat. Sci. Edit. 2022, 37, 620–627. [Google Scholar] [CrossRef]
  14. Goñi, S.; Frías, M.; de la Villa, R.V.; Vegas, I. Decalcification of activated paper sludge—Fly ash-portland cement blended pastes in pure water. Cem. Concr. Compos. 2013, 40, 1–6. [Google Scholar] [CrossRef]
  15. Ma, Y.; Li, W.; Jin, M.; Liu, J.; Zhang, J.; Huang, J.; Lu, C.; Zeng, H.; Wang, J.; Zhao, H.; et al. Influences of leaching on the composition, structure and morphology of calcium silicate hydrate (C–S–H) with different Ca/Si ratios. J. Build. Eng. 2022, 58, 105017. [Google Scholar] [CrossRef]
  16. Lothenbach, B.; Nonat, A. Calcium silicate hydrates: Solid and liquid phase composition. Cem. Concr. Res. 2015, 78, 57–70. [Google Scholar] [CrossRef]
  17. ASTM C150; Standard Specification for Portland Cement. American Society of Testing and Materials: West Conshohocken, PA, USA, 2012.
  18. KS F 2405; Standard Test Method for Compressive Strength of Concrete. Korea Standard Committee: Seoul, Republic of Korea, 2017.
  19. Kumar, R.; Bhattacharjee, B. Study on some factors affecting the results in the use of MIP method in concrete research. Cem. Concr. Res. 2003, 33, 417–424. [Google Scholar] [CrossRef]
  20. Shi, D.; Winslow, D.N. Contact angle and damage during mercury intrusion into cement paste. Cem. Concr. Res. 1985, 15, 645–654. [Google Scholar] [CrossRef]
  21. Yang, Z.; Kang, D.; Zhang, D.; Yan, C.; Zhang, J. Crystal transformation of calcium silicate minerals synthesized by calcium silicate slag and silica fume with increase of C/S molar ratio. J. Mater. Res. Technol. 2021, 15, 4185–4192. [Google Scholar] [CrossRef]
  22. Wang, Z.; Chen, Y.; Xu, L.; Zhu, Z.; Zhou, Y.; Pan, F.; Wu, K. Insight into the local C–S–H structure and its evolution mechanism controlled by curing regime and Ca/Si ratio. Constr. Build. Mater. 2022, 333, 127388. [Google Scholar] [CrossRef]
  23. Alhozaimy, A.; Fares, G.; Al-Negheimish, A.; Jaafar, M.S. The autoclaved concrete industry: An easy-to-follow method for optimization and testing. Constr. Build. Mater. 2013, 49, 184–193. [Google Scholar] [CrossRef]
  24. Wei, Y.; Yao, W.; Xing, X.; Wu, M. Quantitative evaluation of hydrated cement modified by silica fume using QXRD, 27Al MAS NMR, TG–DSC and selective dissolution techniques. Constr. Build. Mater. 2012, 36, 925–932. [Google Scholar] [CrossRef]
  25. Wang, S.; Scrivener, K.L. Hydration products of alkali activated slag cement. Cem. Concr. Res. 1995, 25, 561–571. [Google Scholar] [CrossRef]
  26. Trauchessec, R.; Mechling, J.; Lecomte, A.; Roux, A.; Le Rolland, B. Hydration of ordinary portland cement and calcium sulfoaluminate cement blends. Cem. Concr. Compos. 2015, 56, 106–114. [Google Scholar] [CrossRef]
  27. Wang, L.; Jin, M.; Wu, Y.; Zhou, Y.; Tang, S. Hydration, shrinkage, pore structure and fractal dimension of silica fume modified low heat portland cement-based materials. Constr. Build. Mater. 2021, 272, 121952. [Google Scholar] [CrossRef]
  28. Wongkeo, W.; Thongsanitgarn, P.; Poon, C.; Chaipanich, A. Heat of hydration of cement pastes containing high-volume fly ash and silica fume. J. Therm. Anal. Calorim. 2019, 138, 2065–2075. [Google Scholar] [CrossRef]
  29. Shang, C.; Wu, C.; Wang, J.; Lu, L.; Fu, Q.; Zhang, Y.; Song, X. Investigating mechanical properties and microstructure of reactive powder concrete blended with sulfoaluminate cement. Case Stud. Constr. Mater. 2022, 17, e01552. [Google Scholar] [CrossRef]
  30. Kostakis, G. Characterization of the fly ashes from the lignite burning power plants of northern greece based on their quantitative mineralogical composition. J. Hazard. Mater. 2009, 166, 972–977. [Google Scholar] [CrossRef]
  31. Sakai, E.; Miyahara, S.; Ohsawa, S.; Lee, S.; Daimon, M. Hydration of fly ash cement. Cem. Concr. Res. 2005, 35, 1135–1140. [Google Scholar] [CrossRef]
  32. Liu, Z.; Winslow, D. Sub-distributions of pore size: A new approach to correlate pore structure with permeability. Cem. Concr. Res. 1995, 25, 769–778. [Google Scholar] [CrossRef]
  33. Fu, Q.; Wu, Y.; Zhang, N.; Hu, S.; Yang, F.; Lu, L.; Wang, J. Durability and mechanism of high-salt resistance concrete exposed to sewage-contaminated seawater. Constr. Build. Mater. 2020, 257, 119534. [Google Scholar] [CrossRef]
  34. Zeng, Q.; Li, K.; Fen-chong, T.; Dangla, P. Pore structure characterization of cement pastes blended with high-volume fly-ash. Cem. Concr. Res. 2012, 42, 194–204. [Google Scholar] [CrossRef]
  35. Choi, Y.C.; Kim, J.; Choi, S. Mercury intrusion porosimetry characterization of micropore structures of high-strength cement pastes incorporating high volume ground granulated blast-furnace slag. Constr. Build. Mater. 2017, 137, 96–103. [Google Scholar] [CrossRef]
  36. Brue, F.; Davy, C.A.; Skoczylas, F.; Burlion, N.; Bourbon, X. Effect of temperature on the water retention properties of two high performance concretes. Cem. Concr. Res. 2012, 42, 384–396. [Google Scholar] [CrossRef]
  37. Zeng, Q.; Li, K.; Fen-Chong, T.; Dangla, P. Surface fractal analysis of pore structure of high-volume fly-ash cement pastes. Appl. Surf. Sci. 2010, 257, 762–768. [Google Scholar] [CrossRef]
  38. Kim, J.; Choi, S. A fractal-based approach for reconstructing pore structures of GGBFS-blended cement pastes. Constr. Build. Mater. 2020, 265, 120350. [Google Scholar] [CrossRef]
  39. Chen, X.; Wu, S.; Zhou, J. Influence of porosity on compressive and tensile strength of cement mortar. Constr. Build. Mater. 2013, 40, 869. [Google Scholar] [CrossRef]
  40. Zhao, D.; Khoshnazar, R. Hydration and microstructural development of calcined clay cement paste in the presence of calcium-silicate-hydrate (C–S–H) seed. Cem. Concr. Compos. 2021, 122, 104162. [Google Scholar] [CrossRef]
  41. Richardson, I.G. The calcium silicate hydrates. Cem. Concr. Res. 2008, 38, 137–158. [Google Scholar] [CrossRef]
  42. Nocuń-Wczelik, W. Effect of some inorganic admixtures on the formation and properties of calcium silicate hydrates produced in hydrothermal conditions. Cem. Concr. Res. 1997, 27, 83–92. [Google Scholar] [CrossRef]
  43. Black, L.; Garbev, K.; Stemmermann, P.; Hallam, K.R.; Allen, G.C. Characterisation of crystalline C–S–H phases by X-ray photoelectron spectroscopy. Cem. Concr. Res. 2003, 33, 899–911. [Google Scholar] [CrossRef]
  44. Siauciunas, R.; Baltakys, K. Formation of gyrolite during hydrothermal synthesis in the mixtures of CaO and amorphous SiO2 or quartz. Cem. Concr. Res. 2004, 34, 2029–2036. [Google Scholar] [CrossRef]
Figure 1. Particle distribution of binder and aggregate.
Applsci 13 06190 g001
Figure 2. Manufacture method of specimen.
Applsci 13 06190 g002
Figure 3. Specimen curing temperature gradient.
Applsci 13 06190 g003
Figure 4. Compressive Strength of concrete depending on C/S molar ratio.
Applsci 13 06190 g004
Figure 5. Absorption of concrete depending on C/S molar ratio.
Applsci 13 06190 g005
Figure 6. Ignition loss of concrete depending on C/S molar ratio, (a) QP, (b) SF.
Applsci 13 06190 g006
Figure 7. Hydrated product content of concrete depending on C/S molar ratio, (a) QP, (b) SF.
Applsci 13 06190 g007
Figure 8. XRD patterns depending on C/S molar ratio, (a) QP, (b) SF.
Applsci 13 06190 g008
Figure 9. Differential pore size distributions of the specimens.
Applsci 13 06190 g009
Figure 10. Cumulative pore volumes of the specimens.
Applsci 13 06190 g010
Figure 11. Pore volume fractions of the specimens.
Applsci 13 06190 g011
Figure 12. Threshold pore diameters of the specimens.
Applsci 13 06190 g012
Figure 13. Porosities as a functions of C/S molar ratio.
Applsci 13 06190 g013
Figure 14. SEM image of the specimens.
Applsci 13 06190 g014
Figure 15. SEM images using EDS analysis of the specimens.
Applsci 13 06190 g015
Table 1. Properties of raw materials.
Chemical Properties (%)Physical
Properties
CaOSiO2Al2O3SO3MgOFe2O3K2Oetc.SumFineness
(cm2/g)
Specific
Gravity
OPC72.70 17.20 4.003.561.35 0.34 0.11 0.74100.0 34003.14
QP0.0298.001.450.01 0.04 0.13 0.31 0.04100.0 60002.6
SF0.1297.100.12 1.730.14 0.08 0.47 0.2499.9 200,0002.2
OPC: Ordinary Portland Cement, QP: Quartz Powder, SF: Silica Fume.
Table 2. Properties of Quartz.
Physical PropertiesChemical Properties
AppearanceMoisture
(wt.%)
Color
(ΔE)
Specific gravitySiO2
(%)
Fe2O3
(ppm)
QuartzGood0.040.832.6399.290
Table 3. Experimental plan.
Type of BinderC/S Molar RatioTest Items
QP
SF
0.6
0.7
0.9
0.95
  • Compressive Strength
  • Water Absorption
  • Ignition loss
  • Hydration properties
  • Pore properties
  • Microstructure
Table 4. Mixing design.
IDW/B
(%)
C/S
Ratio
 SP
(wt.%)
Total Weight
(kg)
WOPCSFQPQ1
(0.1–0.3)
Q2
(0.3–0.7)
Plain
(C/S = 0.8)
19.80.79124.1 341.734.2250.0200.050.01.0993.9
QP0.618.90.60 118291.134.2300.6
QP0.718.90.70 319.1272.6
QP0.918.90.90 366.3225.4
QP0.9518.90.95 375.7216.0
SF0.618.90.60 290.685.3250.0
SF0.718.90.70 318.957.0
SF0.918.90.90 366.49.5
SF0.9518.90.95 375.90.0
W/B: Water-Binder rW/B: Water-Binder ratio, SP: Superplasticizer.
Table 5. EDS point analysis (at.%) of the specimen in Figure 15.
PlainQP0.9SF0.9
CaSiCaSiCaSi
Point 132.217.9121.0725.5516.3129.72
Point 212.4834.0212.5414.1320.1531.15
Point 318.812.5617.718.337.1761.11
Disclaimer/Publisher’s Note: The statements, opinions and data contained in all publications are solely those of the individual author(s) and contributor(s) and not of MDPI and/or the editor(s). MDPI and/or the editor(s) disclaim responsibility for any injury to people or property resulting from any ideas, methods, instructions or products referred to in the content.