Article

Pharmacophore-Modeling-Based Optimal Placement and Sizing of Large-Scale Energy Storage Stations in a Power System including Wind Farms

1
Electromechanics Engineering Department, Heliopolis University, Cairo 11785, Egypt
2
Faculty of Pharmacy, German University in Cairo, Cairo 11835, Egypt
3
Department of Mechanical Engineering, Faculty of Engineering, University Dunarea de Jos of Galati, 800008 Galați, Romania
*
Author to whom correspondence should be addressed.
Appl. Sci. 2023, 13(10), 6175; https://doi.org/10.3390/app13106175
Submission received: 23 December 2022 / Revised: 21 February 2023 / Accepted: 16 May 2023 / Published: 18 May 2023
(This article belongs to the Special Issue Advances in Natural Computing: Methods and Application)

Abstract

:
The world is targeting fully sustainable electricity by 2050. Energy storage systems have the biggest role to play in the 100% renewable energy scenario. This paper presents an optimal method for energy storage sizing and allocation in a power system including a share of wind farms. The power system, which is used as a test system, is a modified version of the IEEE 39 bus system. The optimization is applied using novel pharmacophore modeling (PM), which is compared to state-of-the-art techniques. The objective of the optimization is to minimize the costs of power losses, peak demand and voltage deviation. The PM optimization is applied using two methods, namely, weighting factor and normalization. The optimization and simulation are applied in the DIgSILENT power factory software application. The results show that normalization of PM optimization drives the power system to less cost in terms of total power losses by up to 29% and voltage deviation by up to 4% and better covers peak demand than state-of-the-art optimization techniques.

1. Introduction

The integration of energy storage systems with power grids is now essential since power systems nowadays face more variability than before due to the increase in the penetration level of renewable energies and electric vehicles. The operation of power systems should be optimal to ensure achieving minimum operation cost, less power losses, maximum lifetime and minimum voltage deviation. The dream for 2050 is to achieve zero carbon dioxide emissions through 100% renewable power generation in the electricity aspect to achieve sustainable development goal (SDG) number 7 in addition to other disciplines, aspects and the rest of the SDGs such as organic agriculture and sustainable water management [1].
Energy storage systems are now essential due to the high penetration level of renewable energies in power grids. There are many energy storage technologies that are considered at a large scale (transmission level), such as hydro-pumped systems, battery systems, hydrogen storage systems, compressed-air storage systems, super capacitors and thermal energy systems. Each of the mentioned technologies can store energy in different forms when there is an excess of generation with respect to electricity demand [2].
Energy storage systems in the power grid can play a big role in the optimal and reliable operation of the system. Energy storage systems can improve the voltage profile, maximize the penetration level of renewable energy, minimize carbon dioxide emissions, reduce the power losses and minimize the operation cost of the power system at both transmission and distribution levels [2,3,4].
In [5], the authors used energy storage systems to operate a large-scale wind energy system interconnected with a power system; the research focused on achieving grid code requirements in operation, but there was no focus on the optimal sizing and placement of the energy storage system to achieve optimal power system operation. In [6], the authors presented different techniques to optimally size the battery energy storage system to achieve generation adequacy with different renewable energy technologies but did not consider the optimal operation of the power system. In [7], the authors applied optimal sizing of the battery energy storage system for electric vehicle charging considering power outages only. In [8], the authors applied optimal sizing of the energy storage system based on economic value in the Korean power system, which includes wind energy generation without considering optimal operation of the power system. In [9], the authors applied optimal sizing for controlling wind farm production interconnected with a distribution power system but not in transmission-level power grids. In [2,4], optimal sizing and placement of battery energy storage system is applied to achieve optimal power system operation at the distribution level only without considering integration to the transmission level.
Many researchers applied different optimization techniques to optimally operate different power grids and micro-grids by controlling HVDCs and renewable energy generation. In [10,11], the authors applied corona virus optimization and teaching- and learning-based optimization to optimally operate the Egyptian power system with minimum losses and maximum penetration level of renewable energies. In [12], the authors applied TFWO to optimally operate an IEEE 68 bus system in the presence of high-voltage dc cables (HVDCs). In [13], the authors applied the doctor and patient algorithm to optimally regulate the voltage and frequency of two interconnected micro-grids with 100% renewable power generation including energy storage systems. In [14], the authors applied poor and rich optimal control of a 100% interconnected farm in Egypt. In [15], the authors applied black widow optimization to optimally manage the operation of a coastal micro-grid operated by wind, wave and tidal energy technologies.
From the previous research’s conclusions, the gap clearly lies in optimally sizing and placing large-scale energy storage systems in a transmission system including renewable energies such as wind energy generation. Optimal sizing and placement should be achieved for the optimal operation of the transmission system in terms of minimum operation cost, losses and voltage deviation in addition to generation adequacy.
Nowadays, pharmacophore-based techniques have become an essential part of many computer-aided drug design workflows and have been successfully used for many tasks such as virtual screening, lead optimization and de novo design. Pharmacophores are easy to comprehend and intuitive, which makes them also useful as a tool for medicinal chemists to describe, explain and visualize ligand–target binding modes. Virtual screening is considered the most common application of pharmacophore modeling; it is used as a query for the virtual screening of large compound libraries. The main target of virtual screening is the discovery of novel compounds that exhibit a set of desired pharmacophoric features that are considered crucial for biological activity toward a particular target of interest. The generation of a ligand-based pharmacophore model has become a key for facilitating drug discovery in the absence of a macromolecular target structure. It is usually performed by selecting the common chemical features from the 3D structures of a set of known ligands representative of essential interactions between the ligands and a specific macromolecular target. In general, pharmacophore model development relies on multiple ligands (usually called training set compounds). Pharmacophore model generation comprises two main steps: first, creating the conformational space for each ligand in the training set to represent the conformational flexibility of ligands and, second, aligning the multiple ligands in the training set to select the essential common chemical features to develop pharmacophore models [16,17].
The main contributions of this paper are as follows:
  • Application of optimal placement and sizing of large-scale energy storage stations in a power system (transmission level) including wind farms while achieving optimal power system operation.
  • Applying pharmacophore modeling as an optimization technique outside the pharmacy discipline.
  • Comparison between weighting factor and normalization methods for building the multi-objective function.
  • Employing energy storage system sizing and placement to achieve optimal operation of a power system in terms of minimum cost and generation adequacy.
The rest of this paper is presented as follows: Section 2 illustrates the modeling of the energy storage system(s), while Section 3 illustrates the optimization process to optimally size and place the energy storage systems in transmission power systems. Section 4 illustrates the pharmacophore modeling as an optimization technique applied in this research. Section 5 presents the main simulation results, while Section 6 presents the discussions. Section 7 presents the main conclusions.

2. Energy Storage System Modeling

The energy storage systems are modeled in this research in the form of rates of charge and discharge in equal intermissions, normally a period of one day (24 h). Those 24 h are partitioned into m equal intervals from which the rates of charge and discharge (   C i T ) are calculated at m value to include 24, 48 and 96, respectively.
C i T = [ E B ( 1 ) : E B ( m ) ]
where the energy in the energy storage system is E B ( t ) at time interval ranges from 1 to m .
To calculate E B ( t ) at each interval of time, Equation (2) is used based on Fourier Series.
E B ( t ) = a 0 + a 1 cos ( 2 π t T ) + b 1 sin ( 2 π t T ) + +   a n cos ( 2 π t T ) + b n sin ( 2 π t T )
where   a 0 ,   a n and b n are Fourier coefficients, while T is the total period.
The charging and discharging rates are calculated in Equations (3)–(5) [4].
Δ E B = E B ( t ) E B ( t 1 )
P B ( t ) = Δ E B Δ t × η c h a r g i n g
P B ( t ) = Δ E B Δ t × η d i s c h a r g i n g
where the charging efficiency ( η c h a r g i n g ) is assumed to be the same as the discharging efficiency ( η d i s c h a r g i n g ). Equation (4) represents the charging power   P B ( t ) (usually positive), while Equation (5) represents the discharging power P B ( t ) (usually negative). Δ t is the sampling time interval in both equations. In this study, we assumed the energy storage system efficiency to be 85%.
The optimal size of the energy storage system is shown in Equation (6).
S t o r a g e   s y s t e m   s i z e = | E B m a x E B m i n | D O D m a x
where D O D m a x is assumed to be 80% as the maximum depth of discharge, while E B m a x   and   E B m i n are the maximum and minimum values of energy, respectively.

3. Optimization Problem Definition

The power systems nowadays, with the great achievements in technology, have to be operated in an optimal way. Due to the increase in the share of renewable energy in power systems, the presence of energy storage systems is essential.
In this research, the sizing and optimal positioning of the energy storage systems acts as a variable to achieve the minimization of many cost objectives as a multi-objective optimization problem namely minimum power losses cost ( C L ) , minimum voltage deviation cost ( C D ) and minimum peak demand cost ( C P ) .
C L = m i n ( ( K = 1 N L G k [ V i   2 + V j 2 2 | V i | | V j | c o s δ i δ j ] ) × γ L )
C D = m i n ( ( i = 1 N L 1 V i ) × γ D )
C P = m i n ( P m a x × Δ t × γ P )
where N L is the maximum number of power lines connected in the power system; G k is the conductance value in the transmission line ‘ K ’; the sending-end as well as the receiving-end line voltages can be represented as V i and V j ; the voltage angles of the line can be given as δ i and δ j ; while P m a x is the maximum real power at the reference bus in a certain range of time. γ L , γ D and γ P are the rate of the line losses cost, rate of the voltage deviation cost and rate of the peak demand cost, respectively. The rates of cost were assumed to be γ L = 284   USD / MWh , γ D = 142   USD / MWh and γ P   =   200 , 000   USD MWh / year according to [4].
The multi-objective optimization is solved by two different methods, namely, the weighting method ( C W ) , assuming all objectives have the same weights, and the normalization method ( C N ) , by solving each optimization problem as a single objective for each objective and then applying (11).
C W = 1 3 C L + 1 3 C D + 1 3 C P
C N = 1 o p t i m a l C L   C L + 1 o p t i m a l   C D C D + 1 o p t i m a l   C P   C P
The variables of the optimization process are simply the buses that will host the energy storage systems and the capacities of the energy storage systems.
The optimization process is subjected to many constraints related to energy storage boundary limits during operation and also power system operation constraints in terms of voltage limits, transmission lines’ thermal limits and power stations’ generation limits.
  • Energy storage constraints
P C h a r g i n g t     P B m i n
P D i s c h a r g i n g t     P B m a x
E B m i n     E B t     E B m a x
The energy storage constraints in (12) and (13) are to ensure that the charging power over the time should not be less than minimum energy storage power while the discharging power should not be more than that of the maximum energy storage system power. The energy storage capacity should lie between the minimum and maximum capacities as shown in (14).
  • Bus voltage constraints
0.95   P U V i t 1.05   P U
Each bus voltage over the time should have a value ranging from 95% to 105% of its rated value.
  • Transmission lines’ limits
S L i t     S L i m a x
Each line’s loading over time should not exceed its maximum limit.
  • Power stations’ operation limits
P G m i n     P G t     P G m a x
Q G m i n     Q G   t   Q G m a x
Each power station’s active and reactive powers over time should have values between its acceptable maximum and minimum limits according to the capability limits.

4. Pharmacophore Modeling

The pharmacophore concept was first introduced by Ehrlich in 1909 [17]. The pharmacophore model is ‘a molecular framework that carries (phoros) the essential features responsible for a drug’s (pharmacon) biological activity’. It can be defined as ‘an ensemble of steric and electronic features that is essential to ensure the optimal interactions with a specific biological target and to trigger (or block) its biological response’. A pharmacophore model can be generated either in a ligand-based manner, by overlaying a set of active molecules and extracting common chemical features that are crucial for their bioactivity, or in a structure-based manner, by spotting the possible interaction points between the macromolecular target—mostly a protein and the ligands [16,17,18,19]. Recently, pharmacophore modeling has been used in virtual screening, de novo design and other applications such as lead optimization and multi-target drug design. In this study, we detail the steps in the generation of a ligand-based pharmacophore model. A set of active molecules were aligned over each other until the perfect superimposition was reached to allow the choosing of the common features in these active molecules. The pharmacophore model was then generated with the chosen common features, each feature with its tolerance radius. Increasing the number of features and the radius of each feature makes the model more tolerant, while decreasing the number and the radius of the features makes the model more restricted. Then, the generated model was validated using a test set comprising known actives and inactive molecules; the aim of this validation step was to evaluate the performance in discriminating between the actives and inactives before using this model in virtual screening over the coming steps. Evaluation of the performance of the model occurred by calculating the true-positive percentage (TPP) and the false-positive percentage (FPP); after calculating the TPP and the FPP (shown in Equations (19) and (20)), we can assess the discrimination ability of the model between the actives and inactives. In case the TPP and FPP results are not satisfactory, the model can be refined by tuning the features’ radius, either increasing the features’ radius if the TPP was low or decreasing it in case the FPP was high [11,20,21]. The number of features can also be increased or decreased during model refinement; if the strategy is to make the model more restricted, the number of features should be decreased, and the contrary should take place in case we need a more tolerant model. Several trials were conducted until the optimum form of the model features with their radius was reached, i.e., when the TPP is above 90% and the FPP is below 20%. Figure 1 shows the flowchart of pharmacophore modeling as an optimization method.
T P % =   N u m b e r   o f   a c t i v e s   f i l t e r e d T o t a l   n u m b e r   o f   a c t i v e s × 100
F P % = N u m b e r   o f   i n a c t i v e s   f i l t e r e d T o t a l   n u m b e r   o f   i n a c t i v e s × 100
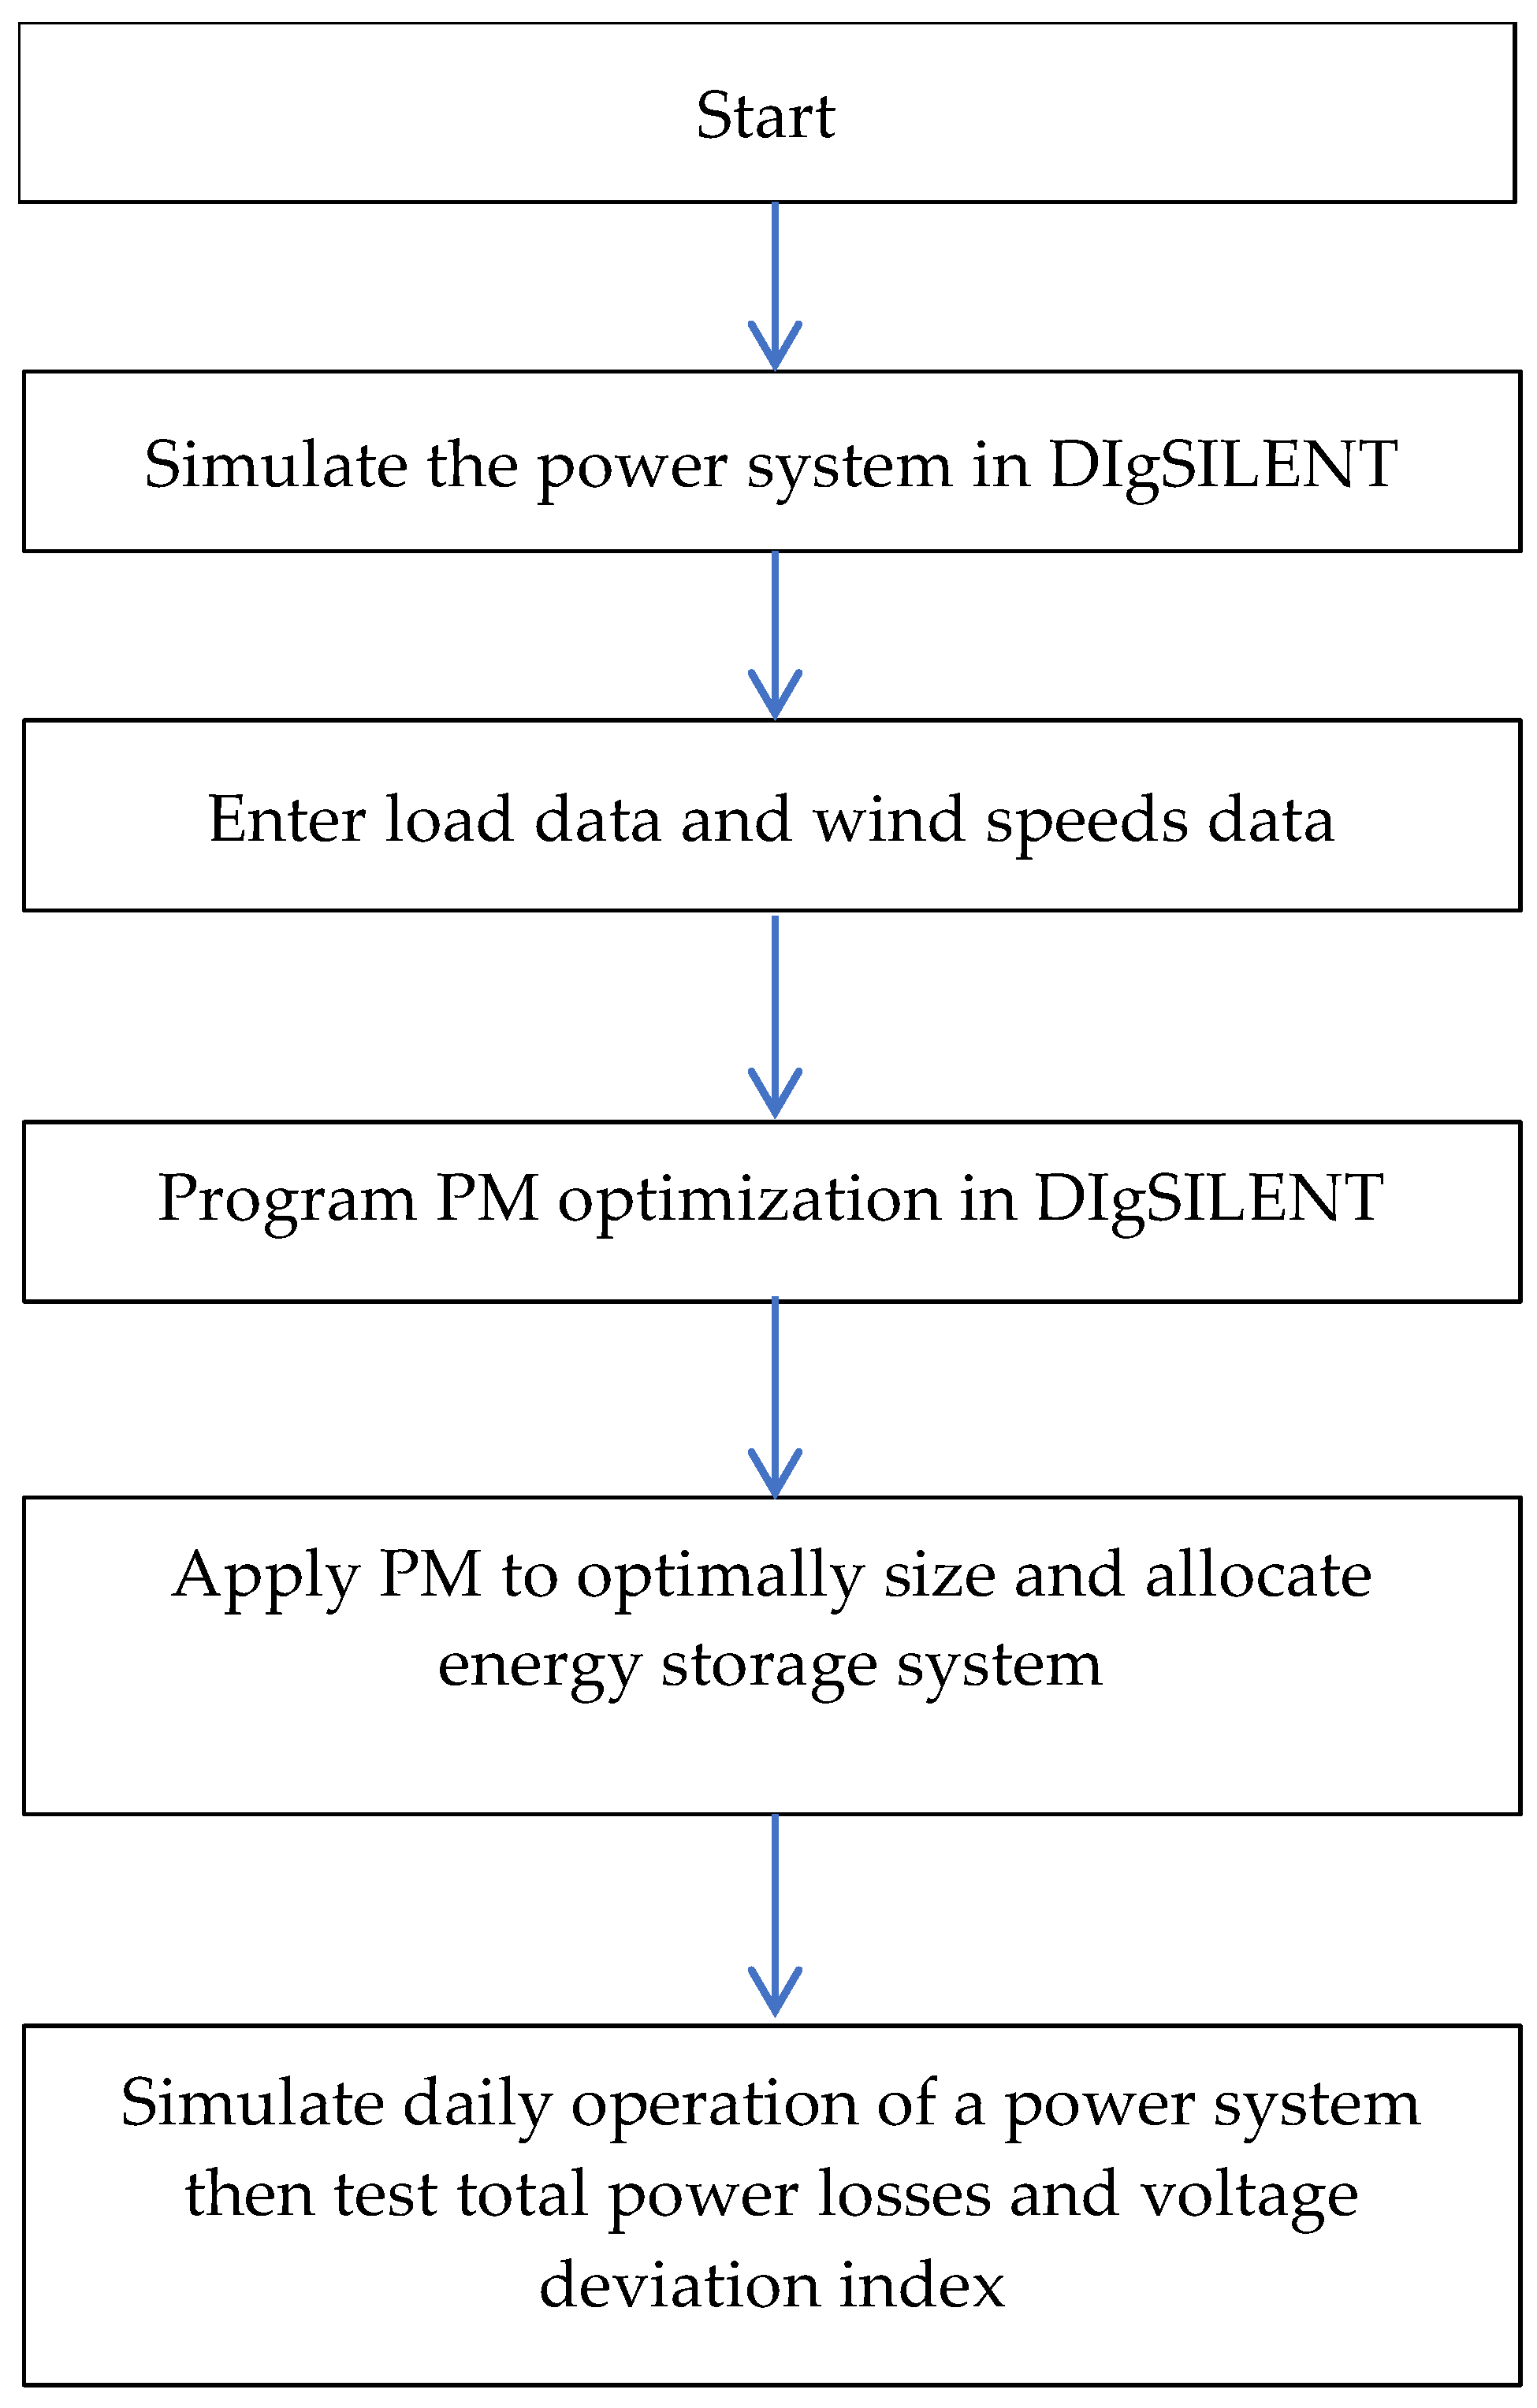
Figure 2 illustrates how PM is applied in this research to optimally size and allocate the energy storage systems in a power system. When the objective function is changed, the optimization process is repeated to optimally select the location and size of the energy storage systems.

5. Simulation Results

5.1. Test System

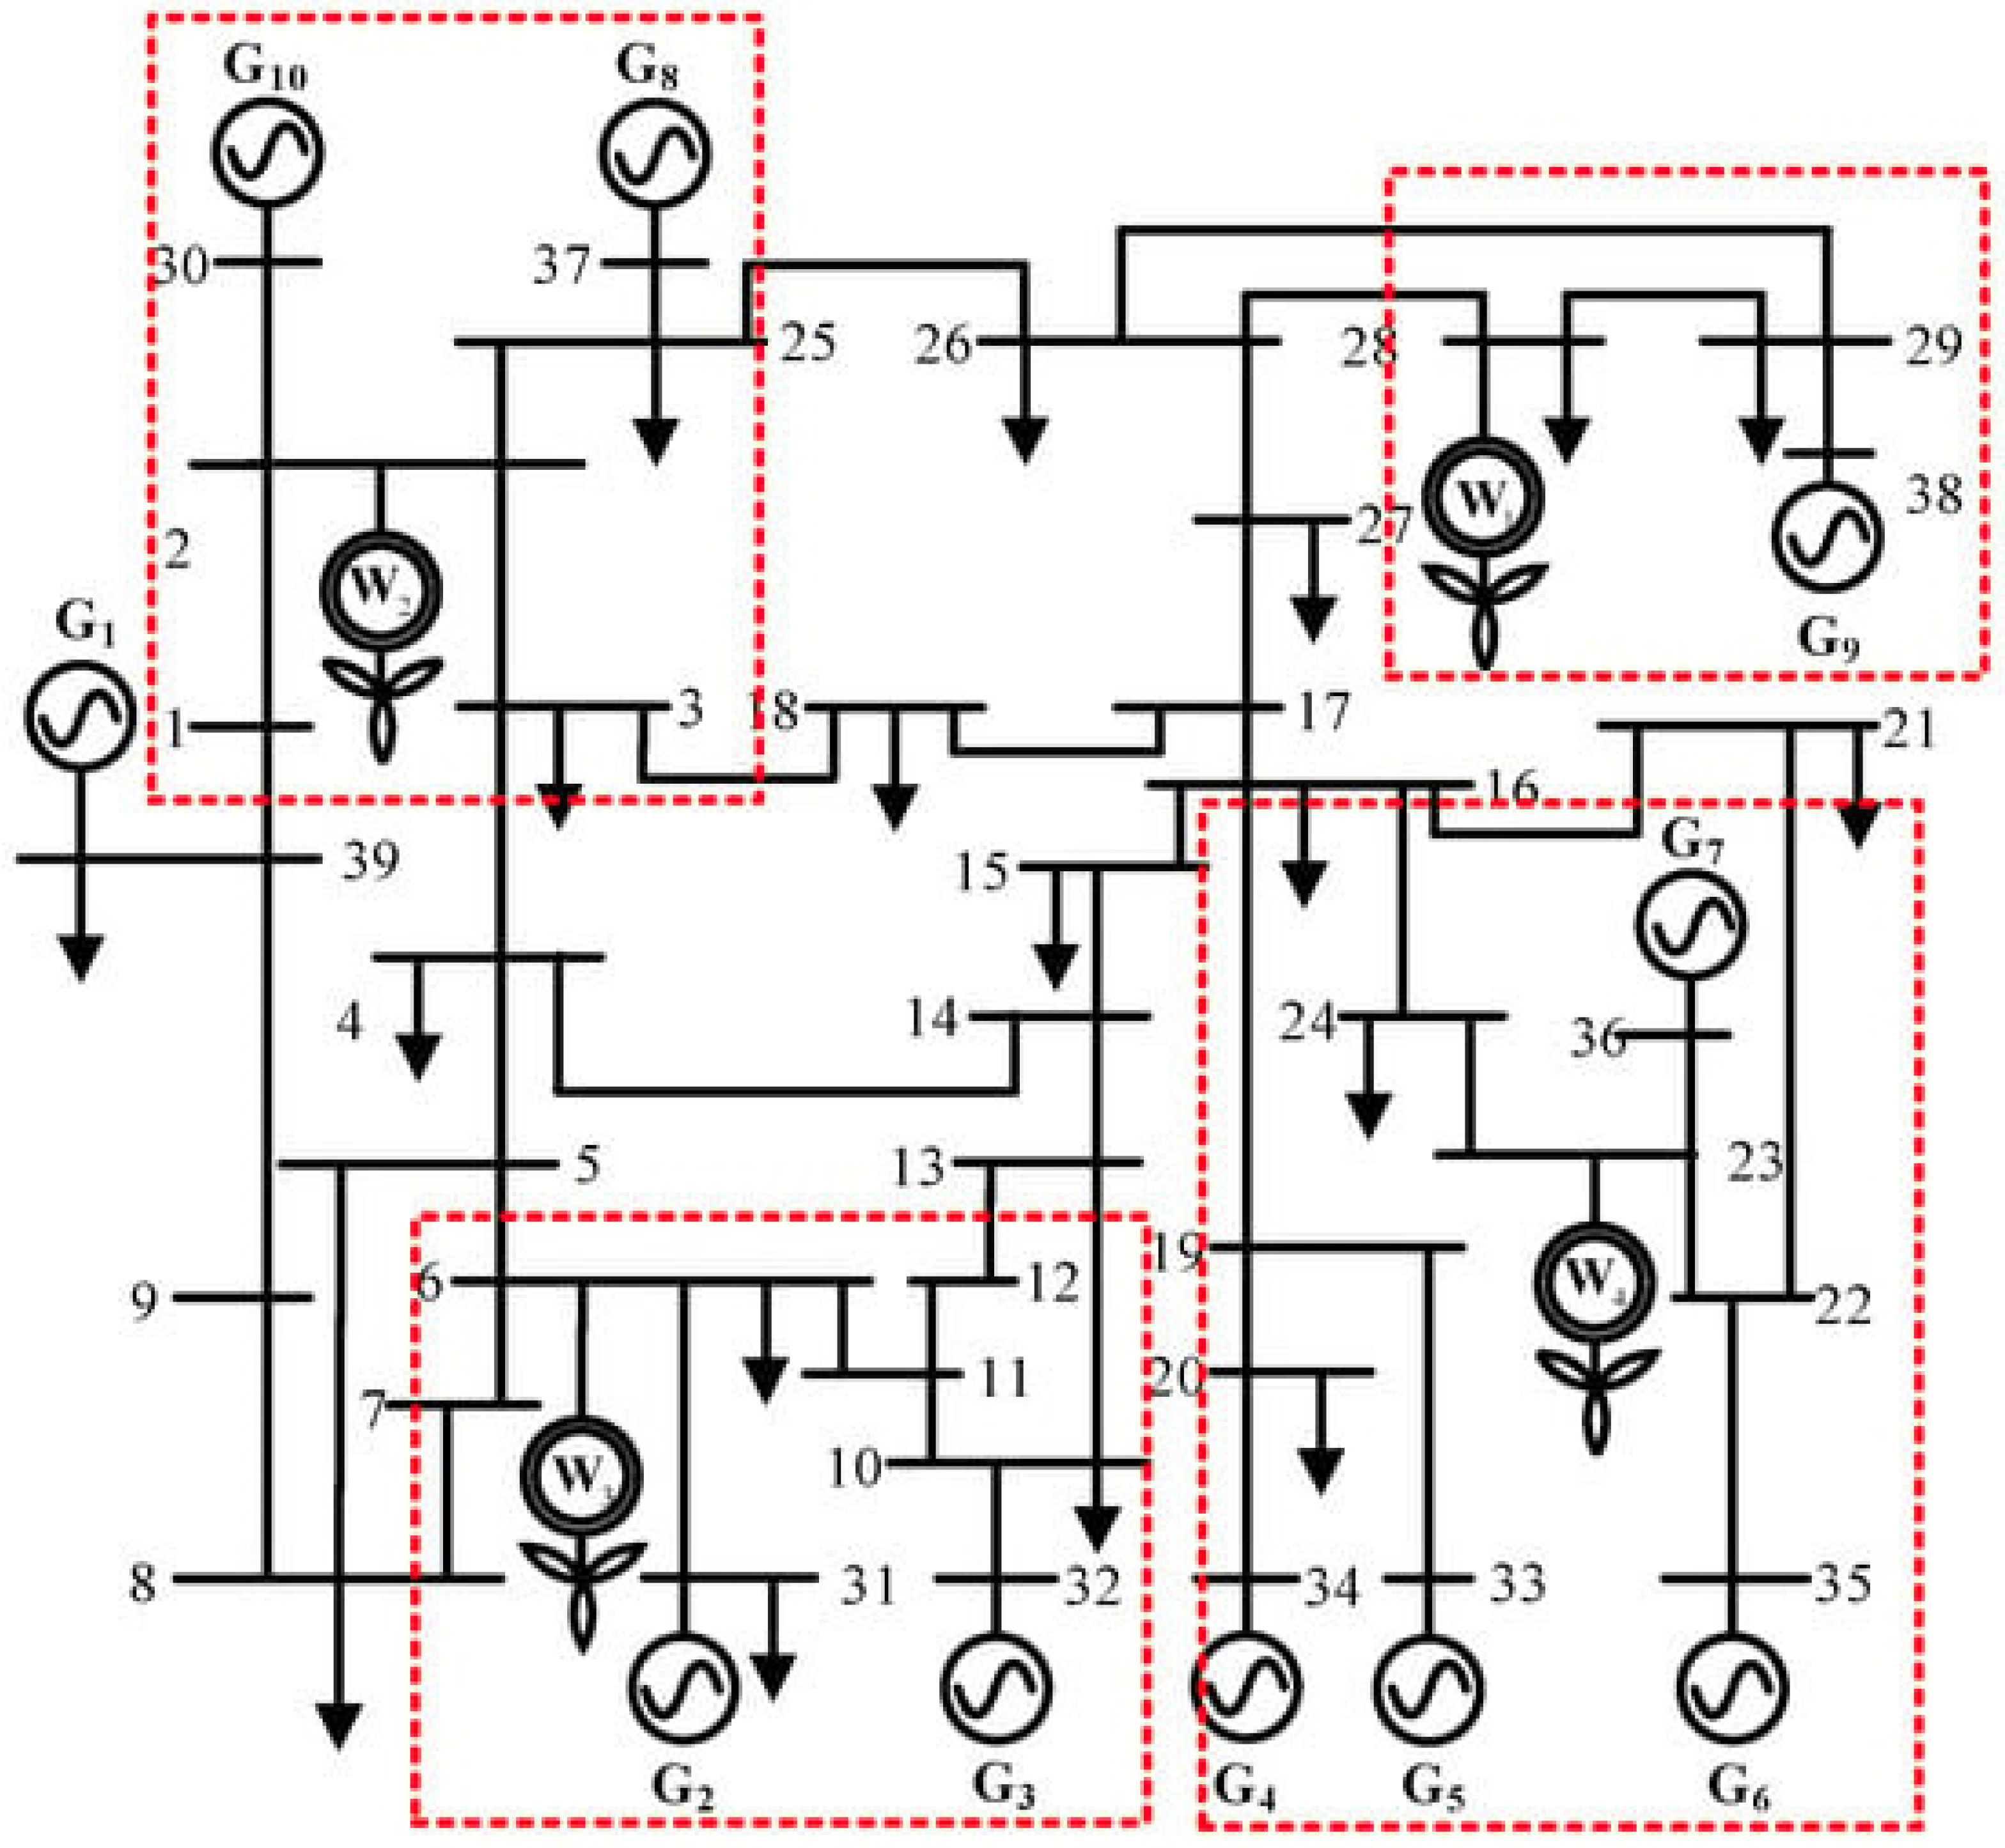
The applied technique was tested in a modified IEEE 39 bus system shown in Figure 3 [22], which is the conventional IEEE 39 bus system, in addition to four wind farms at buses 2, 6, 23 and 28 with wind speeds of 7.54, 8.12, 9.08 and 8.62 m/s, respectively, and active power of 200, 250, 350 and 300 MW, respectively. The system was simulated in the DIgSILENT power factory. The optimization process for the optimal size and placement of energy storage systems was applied using DIgSILENT power factory 15.1 [23].

5.2. Optimal Allocation and Sizing of Energy Storage Stations

The optimal sizing and allocation of the energy storage stations was applied to the system using four different optimization techniques, namely, genetic algorithm (GA) using weighting-factor multi-objective optimization [24], particle swarm optimization (PSO) using weighting-factor multi-objective optimization [25], pharmacophore modeling using weighting-factor multi-objective (WPM) and pharmacophore modeling using normalization multi-objective (NPM). The results of the optimal sizing and allocation of energy storage stations using each optimization alternative are shown in Table 1. The optimization was applied considering a 30.6 GW total demand and a 7 m/s wind speed for all wind farms. Table 2 shows the difference between the four alternatives in terms of total costs due to losses ( C s ) and time taken to apply optimization.
  C s = C L + C D + C P

5.3. Testing System after Energy Storage Stations’ Allocation in a Day under Normal Operation Conditions

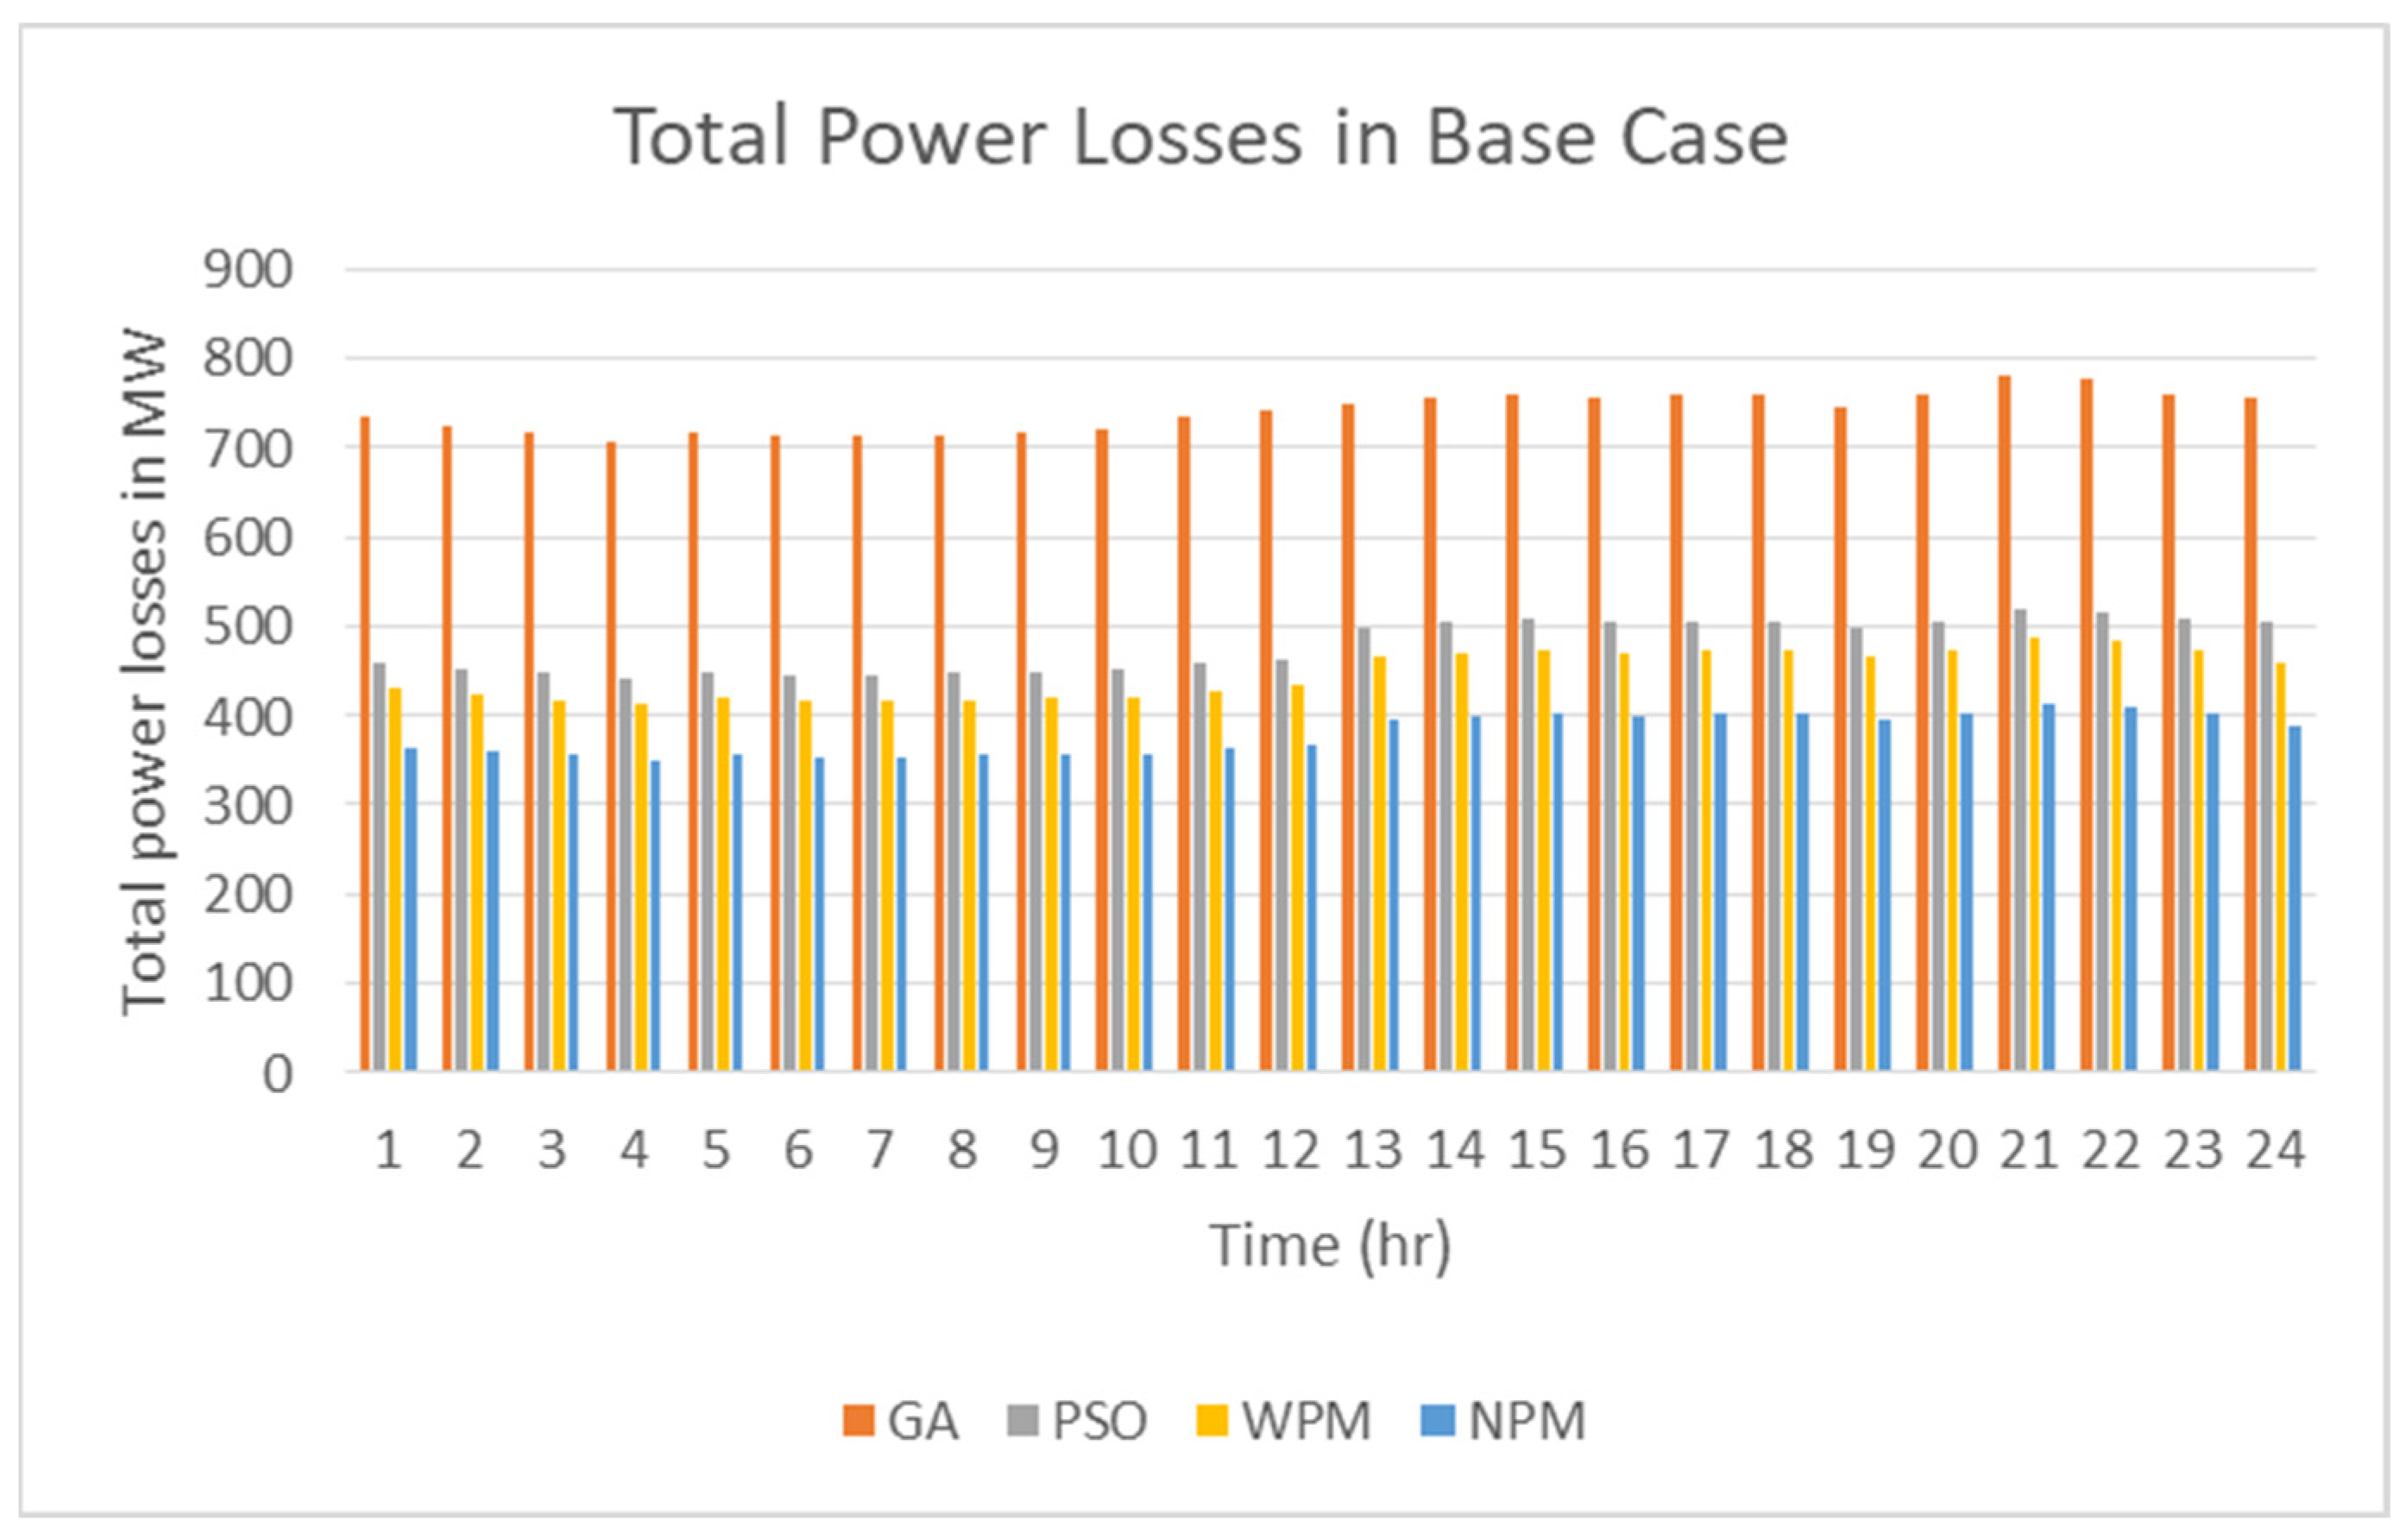
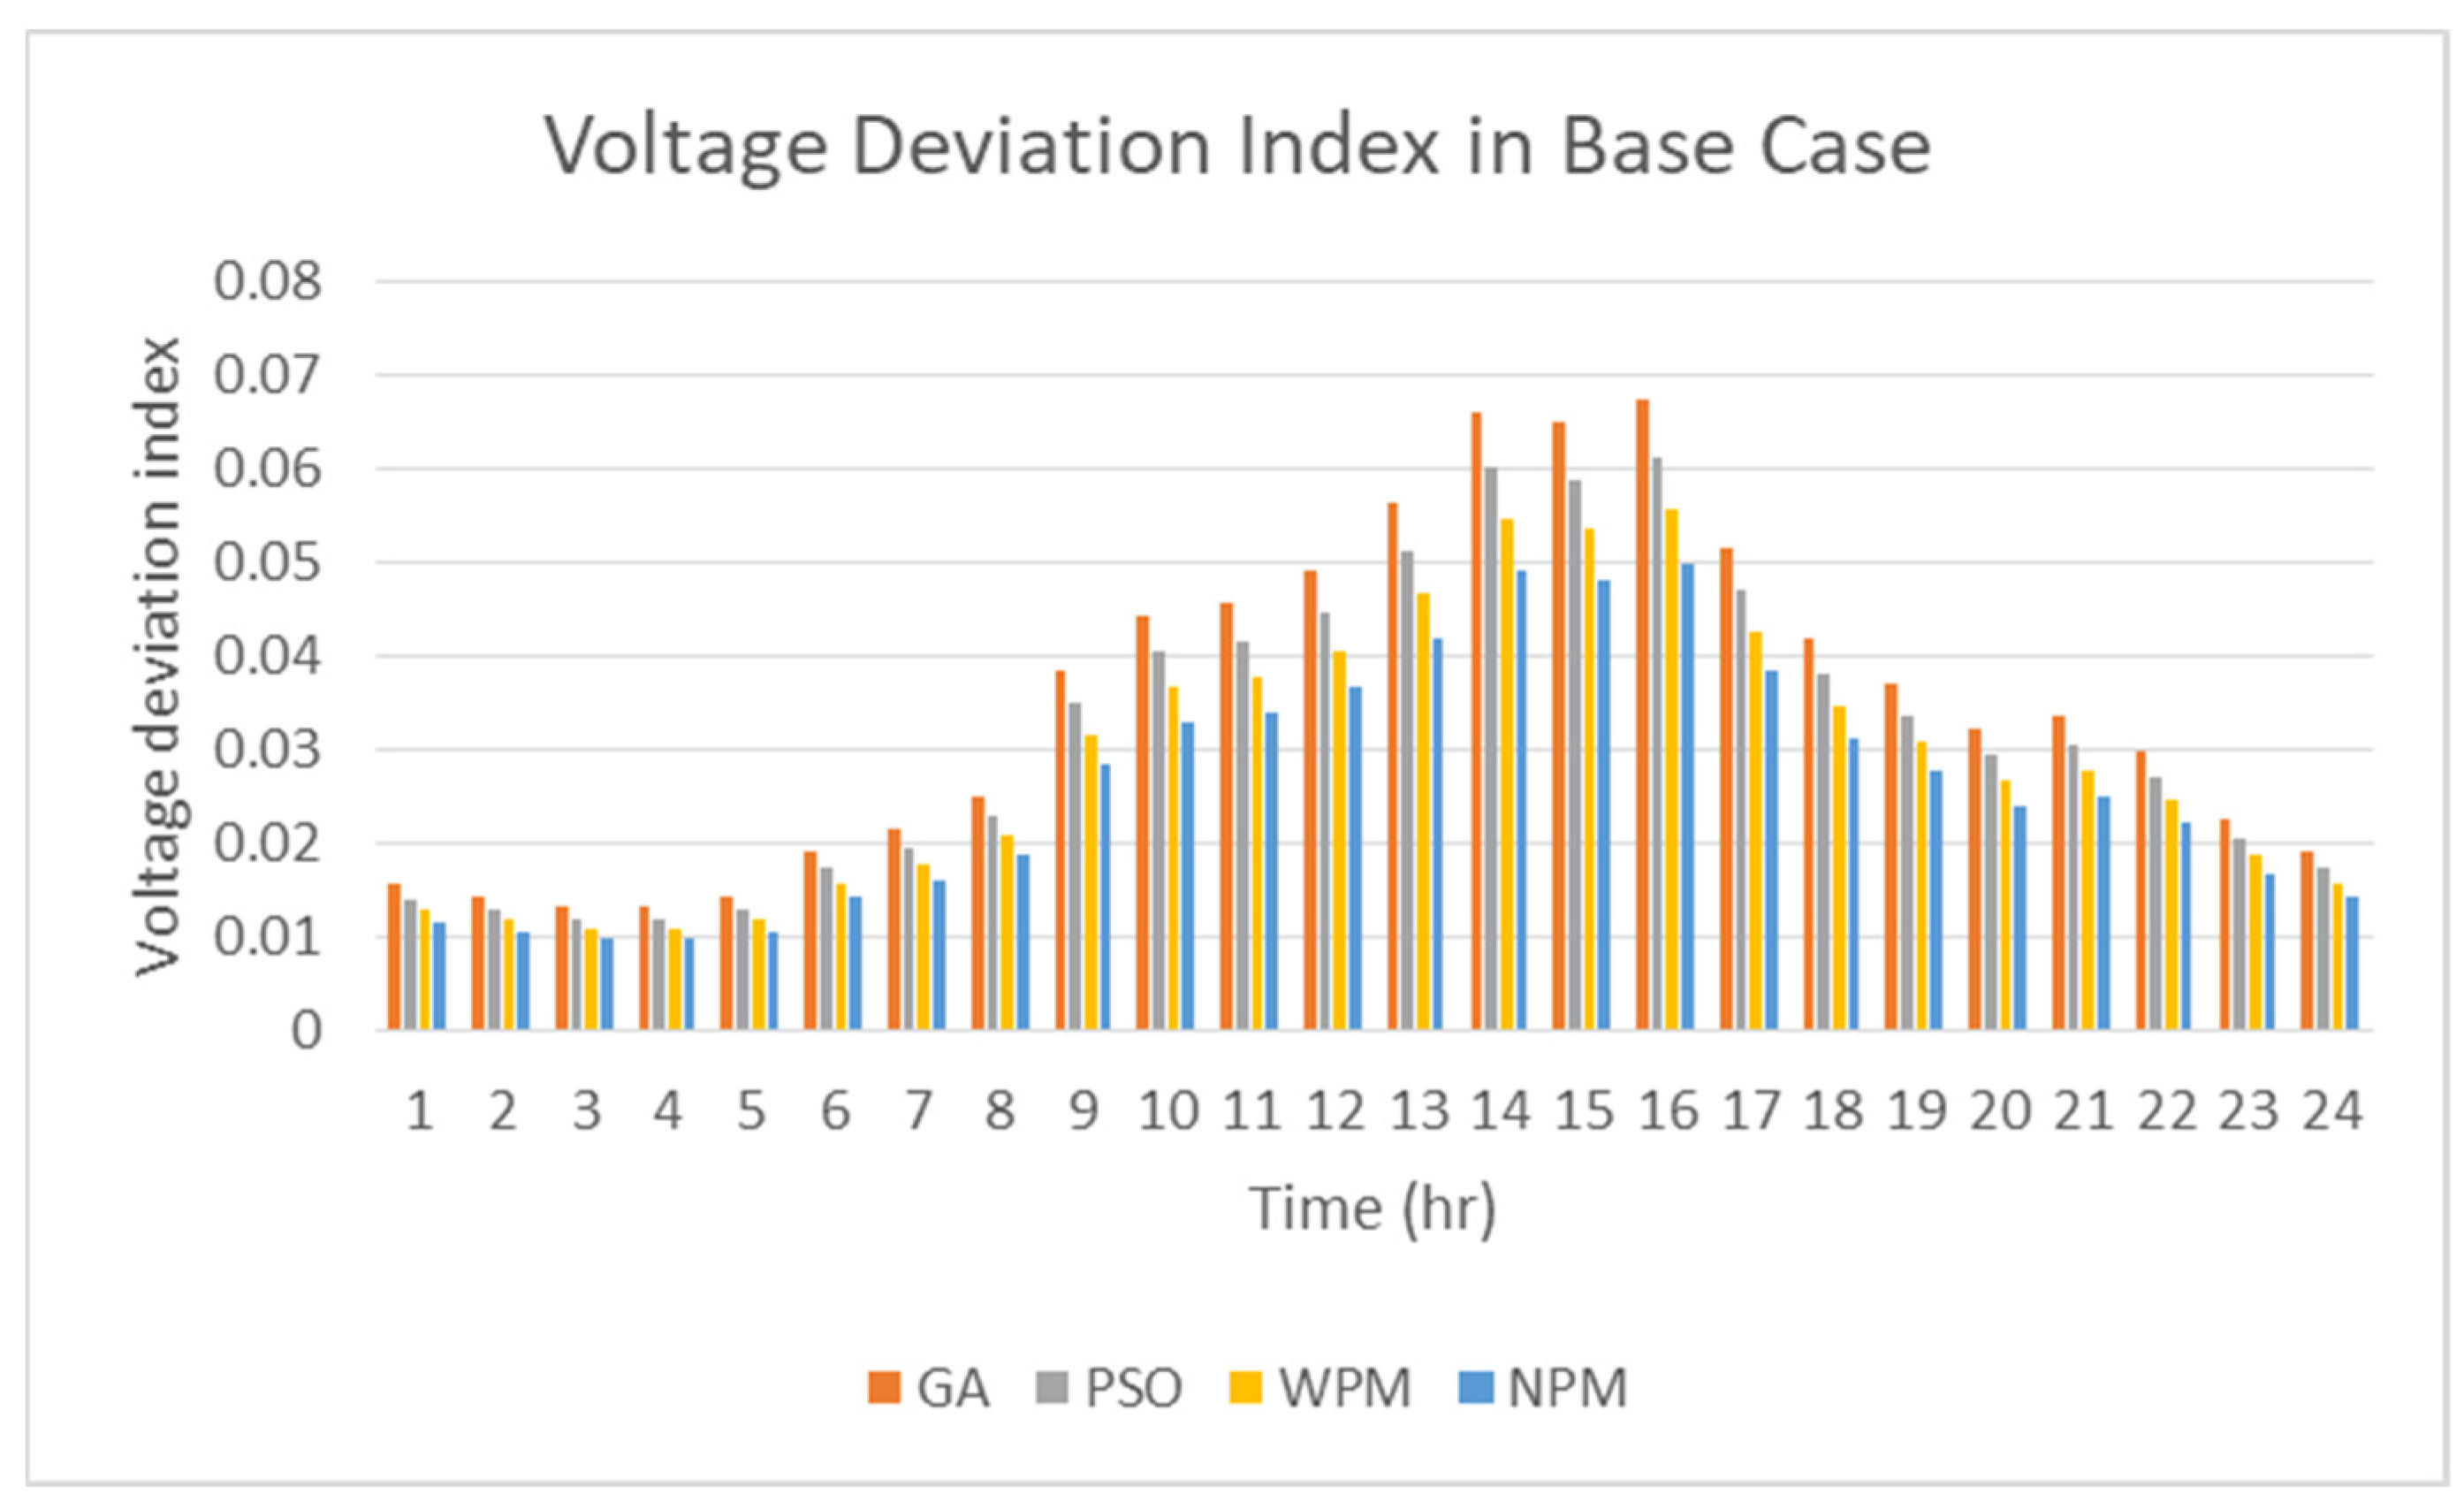
After allocating the energy storage stations in the power system, the change in hourly demand and wind speeds in a day was assumed to be as shown in Table 3. The total power losses for each hour were calculated using the four optimization alternatives as shown in Figure 4, showing that NPM drove the power system to 8% lower power losses than that of WPM. The results also showed that WPM was better than PSO by 13%. GA was the worst scenario with 32% more losses than that of PSO. The voltage deviation index for each hour was simulated using the four optimization alternatives as shown in Figure 5, showing that NPM drove the power system to a 2% lower voltage deviation index than that of WPM. The results also showed that WPM was better than PSO by 3.5%, while GA was the worst scenario with 4.2% more deviation than that of PSO.

5.4. Testing System after Energy Storage Stations’ Allocation in a Day under Generator Contingency Condition

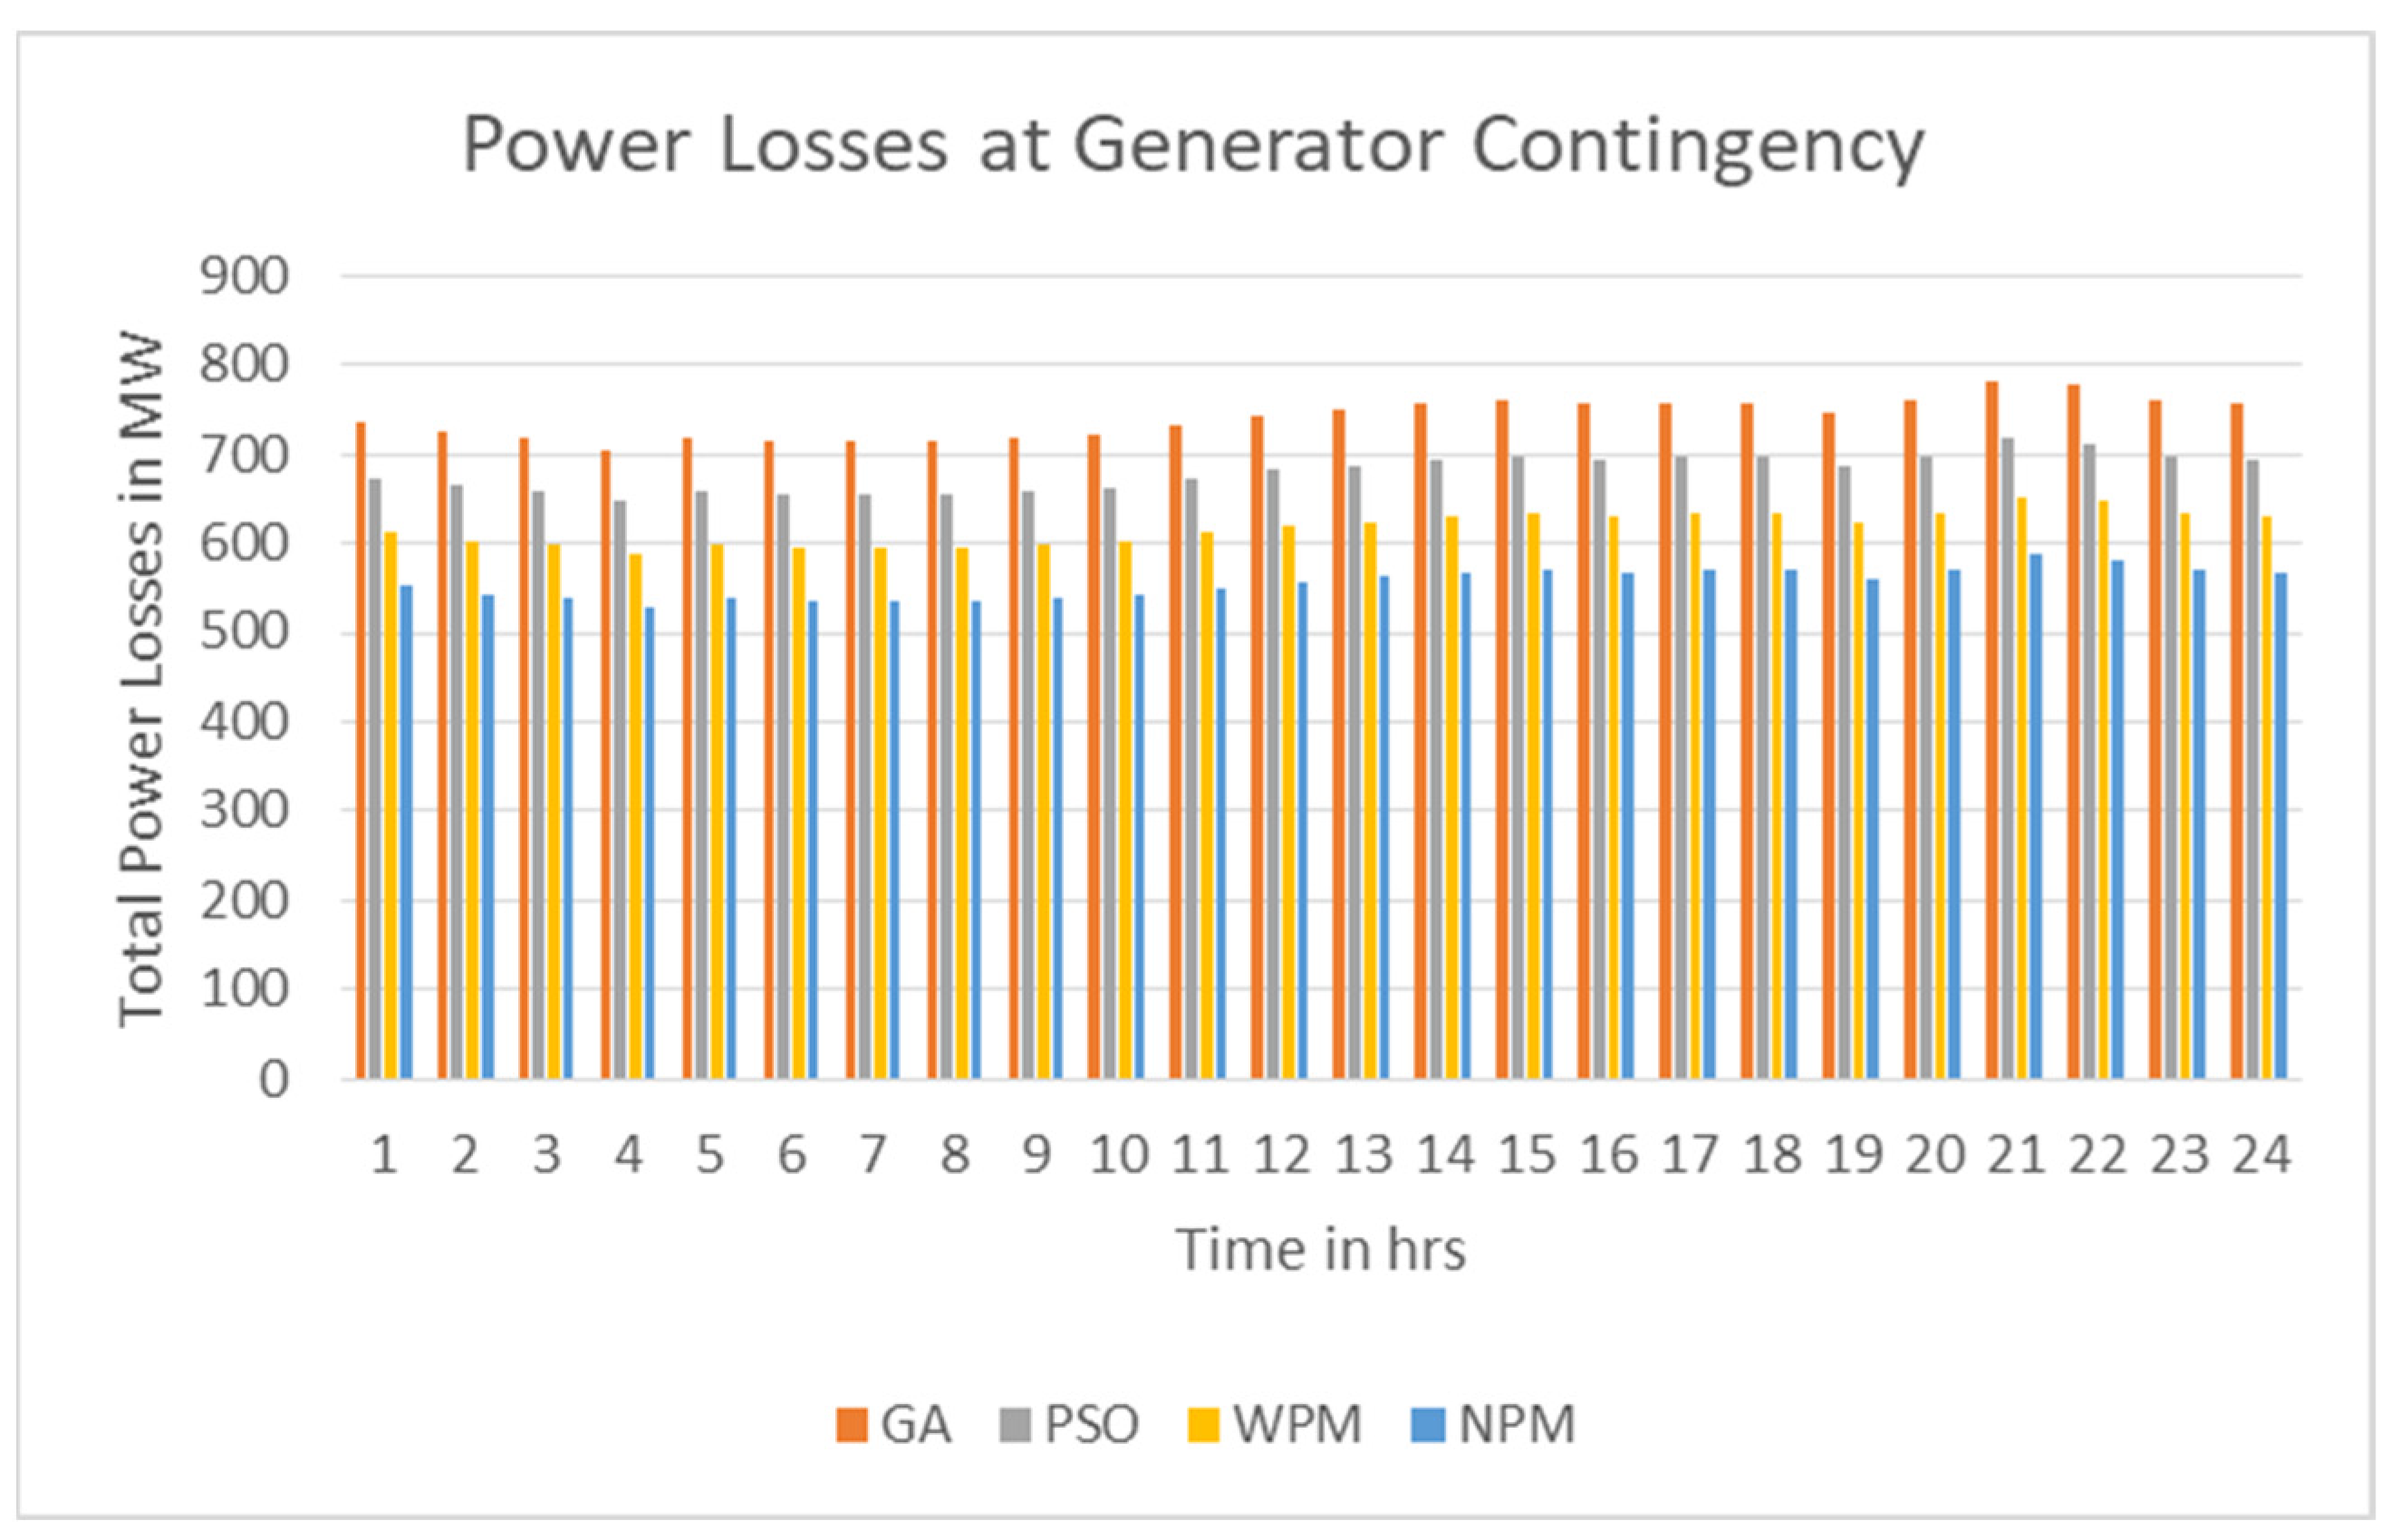
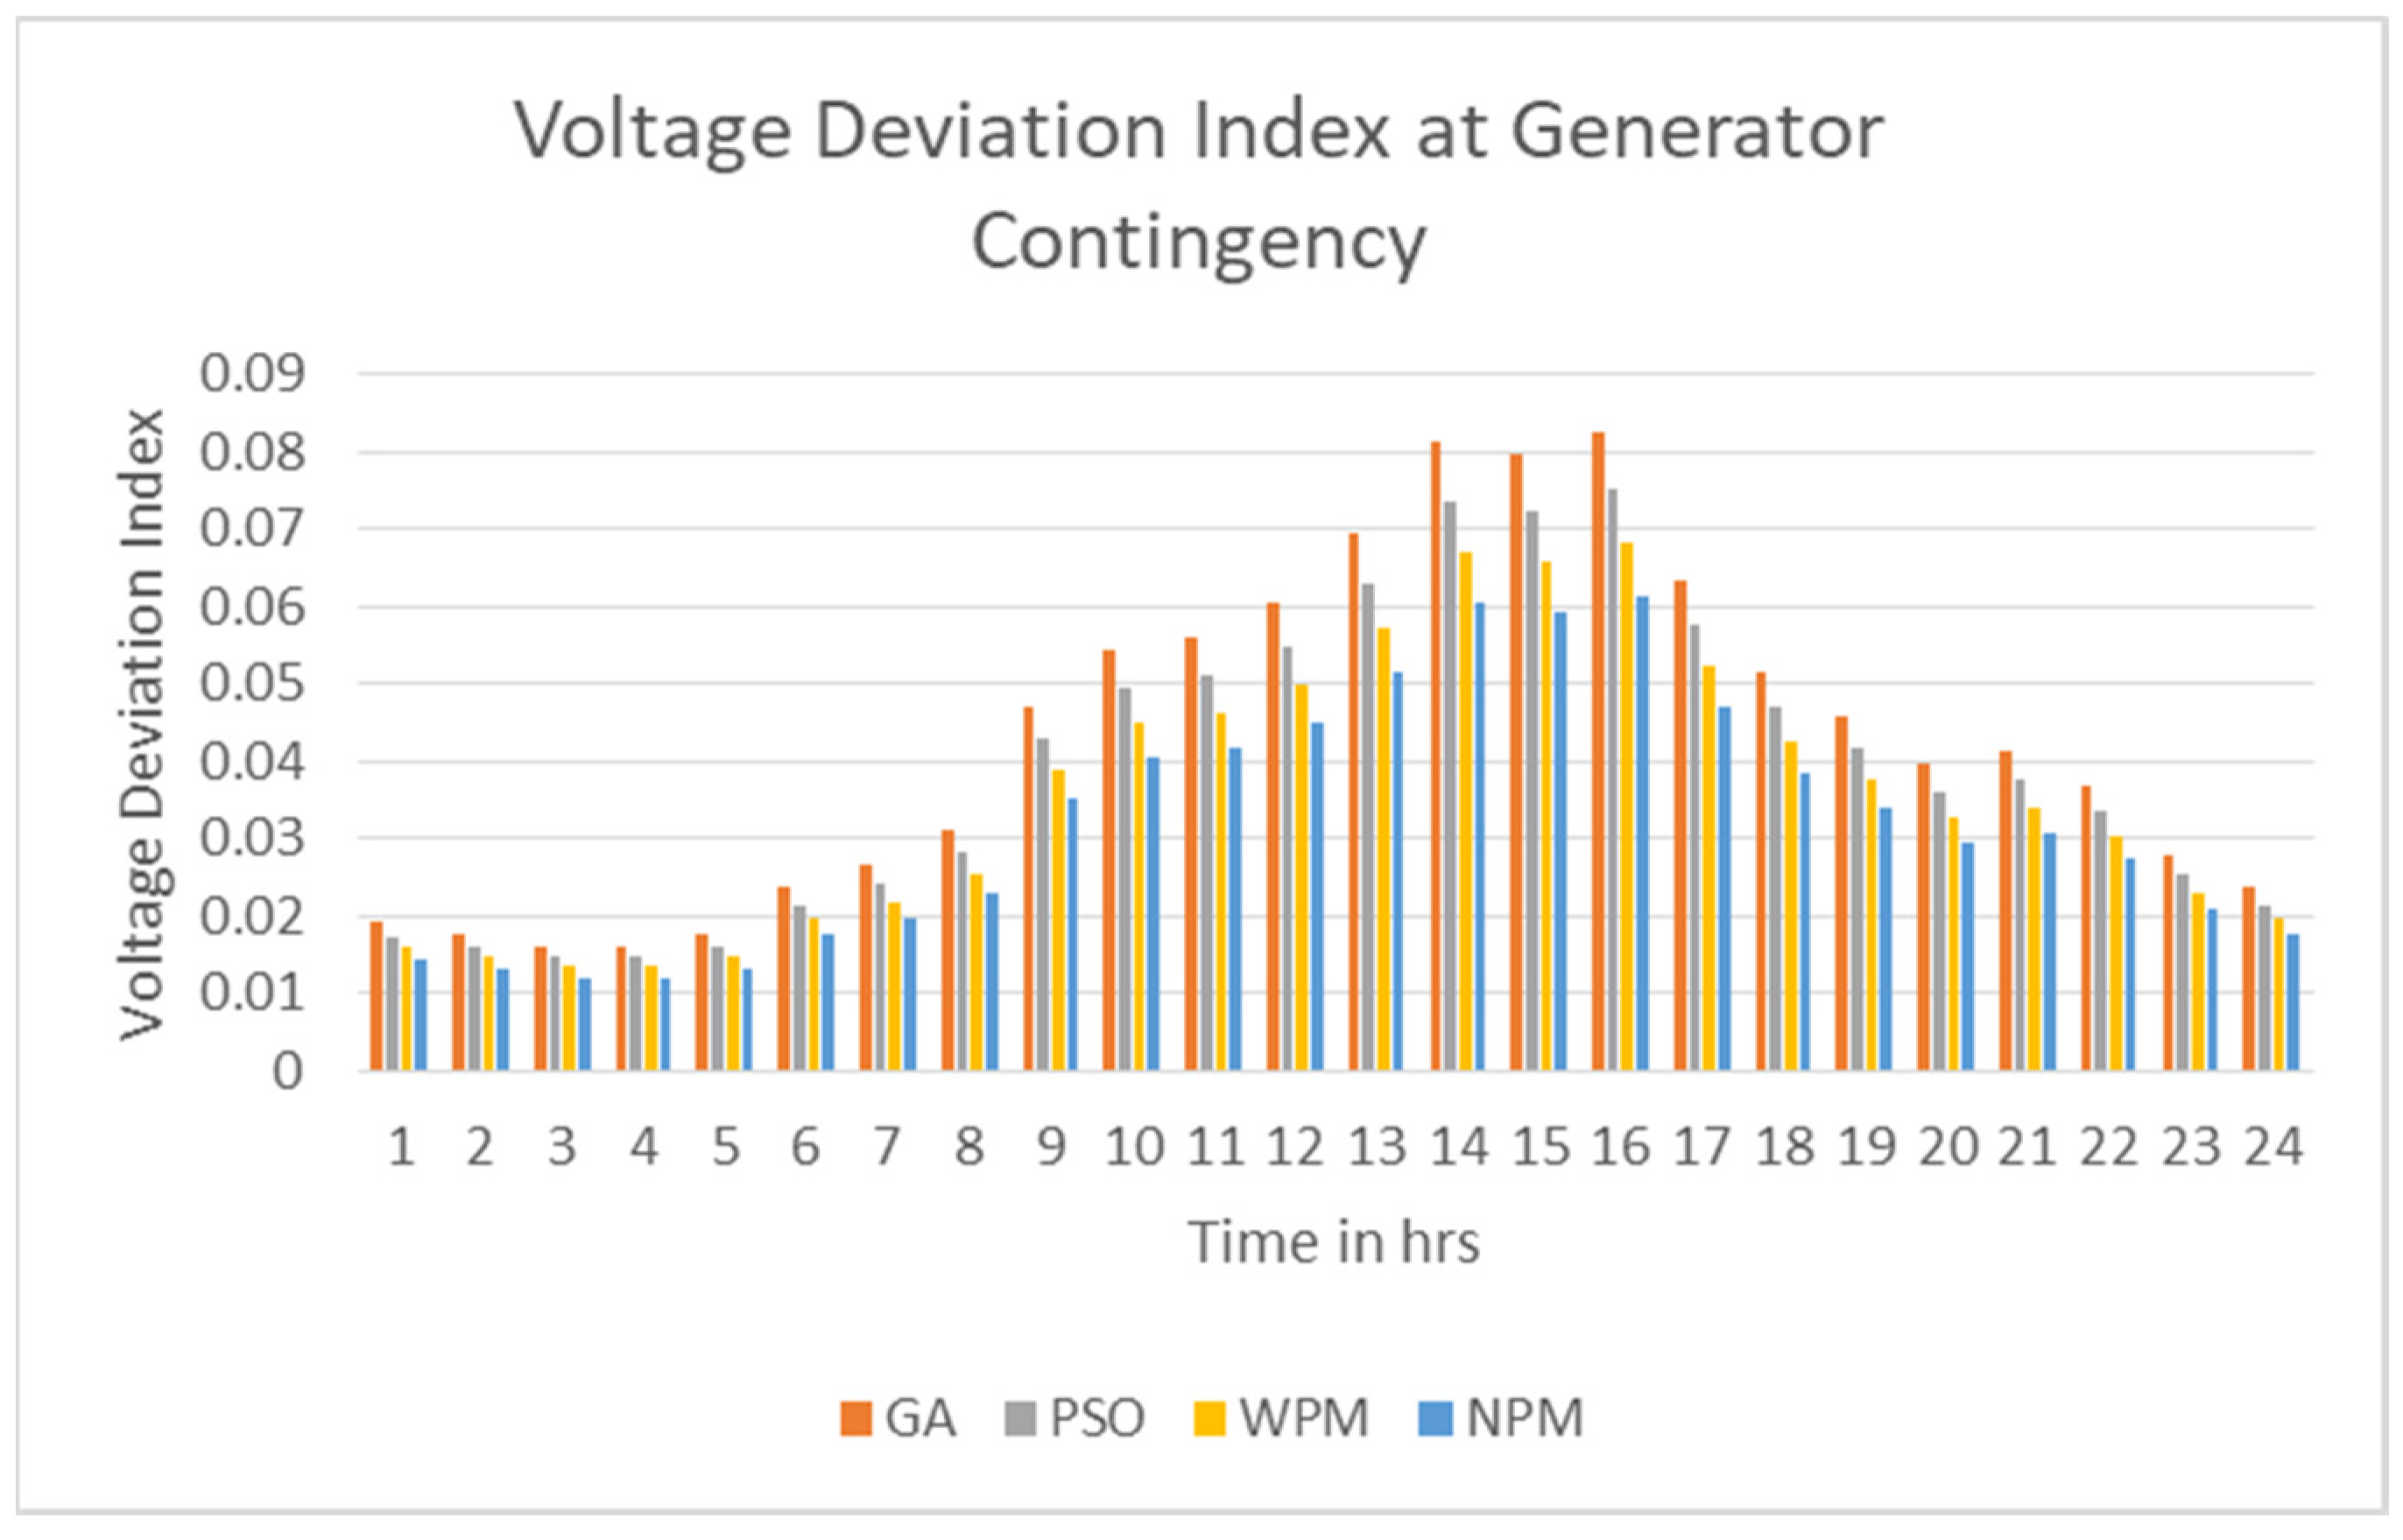
Next, the generator in bus 32 was assumed to be out of service, the changes in the hourly demand and the wind speeds were assumed to be as shown in Table 3. The total power losses for each hour were simulated using the four optimization alternatives as shown in Figure 6, showing that NPM drove the power system to 6% lower power losses than that of WPM. The results also showed that WPM was better than PSO by 14%, while GA was the worst scenario with 29% more losses than that of PSO. The voltage deviation index for each hour was simulated using the four optimization alternatives as shown in Figure 7, showing that NPM drove the power system to a 1.6% lower voltage deviation index than that of WPM. The results also showed that WPM was better than PSO by 3.1%, while GA was the worst scenario with 4.1% more deviation than that of PSO.

6. Discussions

With the target of 100% renewable energy power grids, large-scale energy storage stations will surely be required. The placement and sizing of such stations is going to control the operation of the transmission power system not only the distribution one. In this research, unlike previous work, an analysis of the optimal sizing and placement of the large-scale energy storage stations was performed for the optimal operation of a transmission power grid. The optimal operation focused on multiple objectives namely minimum operation cost, power losses and voltage deviation in addition to generation adequacy.
The optimization was applied using pharmacophore modeling, which is used in the medical sector in many applications [26], but this is the first time it has been applied in solving an engineering problem. PM has better performance than state-of-the-art techniques because it has parallel control on features and radius that pushes the search area toward a near global minima solution. The variables of the optimization process were the locations (buses that will host) and the sizing of the energy storage stations. The optimization was programmed in DigSILENT. Two methods, namely, weighting factors and normalization, were used and compared to express the multi-objective optimization process.
The results after simulating the hourly data of the power systems in terms of load and wind speeds showed that NPM had better performance than WPM in terms of total power losses by 8% and voltage deviation by 2%. NPM had better performance than PSO in terms of total power losses by 21% and voltage deviation by 5.5%. NPM had better performance than GA in terms of total power losses by 61% and voltage deviation by 9.7%. After simulating a generator outage from the power grid, the role of the energy storage stations turned out to be bigger, and the following results were achieved: NPM had better performance than WPM in terms of total power losses by 6% and voltage deviation by 1.6%. NPM had better performance than PSO in terms of total power losses by 20% and voltage deviation by 4.7%. NPM had better performance than GA in terms of total power losses by 49% and voltage deviation by 9.3%. The results also showed that the NPM optimization process was performed faster than WPM by 30 s, PSO by 39 s and GA by a minute.
In the future, the same procedure and optimization can be applied in 100% renewable energy transmission power grids [27] such that the role of energy storage will be bigger. Future studies will also include the aggregation of energy storage stations similar to the aggregation of wind energy stations [28]. The optimal allocation and sizing of energy storage stations will also drive the power system to achieve further objectives such as equal loading between transmission lines [29]. Since PM is fast enough, it can be applied for optimal controller design in the power systems [30]. The normalization process can be applied to better achieve the multi-objective optimal operation of power systems such as maximum reactive power reserve with minimum power losses [31]; this may keep the balance between the optimal management of active and reactive power in the power grid.

7. Conclusions

In future power systems, most of the power stations will be renewable energy based, where energy storage stations will play a big role. The results of this research show that pharmacophore modeling can optimally allocate and size energy storage stations in a power system better than the genetic algorithm and particle swarm optimization. The results of the research proved that the proposed NPM optimization drives the system to lower total costs due to losses than that of WPM, PSO and GA with less optimization time. The results also proved that NPM can drive the system to lower power losses and lower voltage deviation than that of WPM and other optimization techniques at different wind speeds and demand in normal operation conditions and in the generator contingency condition. The results also confirmed that energy storage stations if optimally sized and placed in a transmission system can drive the system to optimal operation in terms of generation adequacy in addition to minimum operation cost, power losses and voltage deviation.

Author Contributions

Conceptualization, H.H.F. and E.R.; methodology, F.H.F. and H.H.F.; software, F.H.F. and H.H.F.; validation, H.H.F.; formal analysis, H.H.F.; investigation, H.H.F.; resources, E.R.; data curation, F.H.F.; writing—original draft preparation, H.H.F. and F.H.F.; writing—review and editing, H.H.F. and E.R.; visualization, H.H.F.; supervision, E.R.; project administration, F.H.F.; funding acquisition, E.R. All authors have read and agreed to the published version of the manuscript.

Funding

The work of Eugen Rusu was carried out in the framework of the research project DREAM (Dynamics of the REsources and technological Advance in harvesting Marine renewable energy), supported by the Romanian Executive Agency for Higher Education, Research, Development and Innovation Funding—UEFISCDI, grant number PN-III-P4-ID-PCE-2020-0008.

Institutional Review Board Statement

Not applicable.

Informed Consent Statement

Not applicable.

Data Availability Statement

Not applicable.

Conflicts of Interest

The authors declare no conflict of interest.

References

  1. Papaefthymiou, G.; Dragoon, K. Towards 100% renewable energy systems: Uncapping power system flexibility. Energy Policy 2016, 92, 69–82. [Google Scholar] [CrossRef]
  2. Wong, L.A.; Ramachandaramurthy, V.K.; Walker, S.L.; Taylor, P.; Sanjari, M.J. Optimal placement and sizing of battery energy storage system for losses reduction using whale optimization algorithm. J. Energy Storage 2019, 26, 100892. [Google Scholar] [CrossRef]
  3. Unamuno, E.; Polat, H.; Cabezuelo, D.; Galarza, J.; Anta, A.; Toutain, E.; Geury, T.; Hegazy, O. An Interoperable EMS for the Provision of Grid Services with Hybrid Energy Storage Systems. In Proceedings of the IECON 2022—48th Annual Conference of the IEEE Industrial Electronics Society, Brussels, Belgium, 17–20 October 2022; pp. 1–7. [Google Scholar] [CrossRef]
  4. Boonluk, P.; Siritaratiwat, A.; Fuangfoo, P.; Khunkitti, S. Optimal Siting and Sizing of Battery Energy Storage Systems for Dis-tribution Network of Distribution System Operators. Batteries 2020, 6, 56. [Google Scholar] [CrossRef]
  5. Bui, V.-H.; Nguyen, X.Q.; Hussain, A.; Su, W. Optimal Sizing of Energy Storage System for Operation of Wind Farms Considering Grid-Code Constraints. Energies 2021, 14, 5478. [Google Scholar] [CrossRef]
  6. Yang, Y.; Bremner, S.; Menictas, C.; Kay, M. Battery energy storage system size determination in renewable energy systems: A review. Renew. Sustain. Energy Rev. 2018, 91, 109–125. [Google Scholar] [CrossRef]
  7. Hussain, A.; Bui, V.-H.; Kim, H.-M. Optimal Sizing of Battery Energy Storage System in a Fast EV Charging Station Considering Power Outages. IEEE Trans. Transp. Electrif. 2020, 6, 453–463. [Google Scholar] [CrossRef]
  8. Choi, D.G.; Min, D.; Ryu, J.-H. Economic Value Assessment and Optimal Sizing of an Energy Storage System in a Grid-Connected Wind Farm. Energies 2018, 11, 591. [Google Scholar] [CrossRef]
  9. Pang, M.; Shi, Y.; Wang, W.; Pang, S. Optimal sizing and control of hybrid energy storage system for wind power using hybrid Parallel PSO-GA algorithm. Energy Explor. Exploit. 2019, 37, 558–578. [Google Scholar] [CrossRef]
  10. Fayek, H.H.; Abdalla, O.H. Operation of the Egyptian Power Grid with Maximum Penetration Level of Renewable Energies Using Corona Virus Optimization Algorithm. Smart Cities 2022, 5, 34–53. [Google Scholar] [CrossRef]
  11. Fayek, H.H.; Abdalla, O.H. Maximization of Renewable Power Generation for Optimal Operation of the Egyptian Grid. In Proceedings of the 2020 IEEE 29th International Symposium on Industrial Electronics (ISIE), Delft, The Netherlands, 17–19 June 2020; pp. 1033–1038. [Google Scholar]
  12. Fayek, H.H.; Abdalla, O.H. Optimal Settings of BTB-VSC in Interconnected Power System Using TFWO. In Proceedings of the 2021 IEEE 30th International Symposium on Industrial Electronics (ISIE), Kyoto, Japan, 20–23 June 2021; IEEE: Piscataway, NJ, USA, 2021. [Google Scholar]
  13. Fayek, H.H.; Rusu, E. Novel Combined Load Frequency Control and Automatic Voltage Regulation of a 100% Sustainable Energy Interconnected Microgrids. Sustainability 2022, 14, 9428. [Google Scholar] [CrossRef]
  14. Fayek, H.H. 5G Poor and Rich Novel Control Scheme Based Load Frequency Regulation of a Two-Area System with 100% Renewables in Africa. Fractal Fract. 2020, 5, 2. [Google Scholar] [CrossRef]
  15. Fayek, H.H.; Mohammadi-Ivatloo, B. Tidal Supplementary Control Schemes-Based Load Frequency Regulation of a Fully Sustainable Marine Microgrid. Inventions 2020, 5, 53. [Google Scholar] [CrossRef]
  16. Seidel, T.; Wieder, O.; Garon, A.; Langer, T. Applications of the Pharmacophore Concept in Natural Product inspired Drug Design. Mol. Inform. 2020, 39, 2000059. [Google Scholar] [CrossRef] [PubMed]
  17. Ehrlich, P. Über den jetzigen Stand der Chemotherapie. Ber. Dtsch. Chem. Ges. 1909, 42, 17–47. [Google Scholar] [CrossRef]
  18. Chen, I.-J.; Foloppe, N. Conformational Sampling of Druglike Molecules with MOE and Catalyst: Implications for Pharmacophore Modeling and Virtual Screening. J. Chem. Inf. Model. 2008, 48, 1773–1791. [Google Scholar] [CrossRef]
  19. Sunseri, J.; Koes, D.R. Pharmit: Interactive exploration of chemical space. Nucleic Acids Res. 2016, 44, W442–W448. [Google Scholar] [CrossRef]
  20. Lu, I.-L.; Wang, H. Protein-specific Scoring Method for Ligand Discovery. J. Comput. Biol. 2012, 19, 1215–1226. [Google Scholar] [CrossRef]
  21. Janssens, A.C.J.W.; Martens, F.K. Reflection on modern methods: Revisiting the area under the ROC Curve. Leuk. Res. 2020, 49, 1397–1403. [Google Scholar] [CrossRef]
  22. Shen, P.; Guan, L.; Huang, Z.; Wu, L.; Jiang, Z. Active-Current Control of Large-Scale Wind Turbines for Power System Transient Stability Improvement Based on Perturbation Estimation Approach. Energies 2018, 11, 1995. [Google Scholar] [CrossRef]
  23. PowerFactory DIgSILENT GmbH. Available online: http://www.digsilent.de (accessed on 2 November 2021).
  24. Dracopoulos, D.C. Genetic Algorithms and Genetic Programming for Control. In Evolutionary Algorithms in Engineering Applications; Dasgupta, D., Michalewicz, Z., Eds.; Springer Science and Business Media LLC: Berlin, Germany, 1997; pp. 329–343. [Google Scholar]
  25. Ghoshal, S.P. Optimizations of PID gains by particle swarm optimizations in fuzzy based automatic generation control. Electr. Power Syst. Res. 2004, 72, 203–212. [Google Scholar] [CrossRef]
  26. Kumar, S.; Deepika, D.; Kumar, V. Pharmacophore Modeling Using Machine Learning for Screening the Blood–Brain Barrier Permeation of Xenobiotics. Int. J. Environ. Res. Public Health 2022, 19, 13471. [Google Scholar] [CrossRef] [PubMed]
  27. Abdalla, O.H.; Fayek, H.H.; Ghany, A.M.A. Secondary Voltage Control Application in a Smart Grid with 100% Renewables. Inventions 2020, 5, 37. [Google Scholar] [CrossRef]
  28. Abdalla, O.H.; Kamel, H.M.; Fayek, H.H. Aggregation of a Wind Farm Model for Grid Connection Planning Studies. In Proceedings of the 2022 23rd International Middle East Power Systems Conference (MEPCON), Cairo, Egypt, 13–15 December 2022; pp. 1–7. [Google Scholar]
  29. Han, C.; Lee, J.; Hwang, S.; Jang, G. Multi-Objective Optimized Operating Strategy of BTB-VSC for Grid Service. In Proceedings of the 2019 IEEE 28th International Symposium on Industrial Electronics (ISIE), Vancouver, BC, Canada, 12–14 June 2019; pp. 147–152. [Google Scholar] [CrossRef]
  30. Abdalla, O.H.; Fayek, H.H.; Ghany, A.G.M.A. Secondary and Tertiary Voltage Control of a Multi-Region Power System. Electricity 2020, 1, 37–59. [Google Scholar] [CrossRef]
  31. Abdalla, O.H.; Fayek, H.H. WAMS-Based Fuzzy Logic PID Secondary Voltage Control of the Egyptian Grid. Sustainability 2023, 15, 3338. [Google Scholar] [CrossRef]
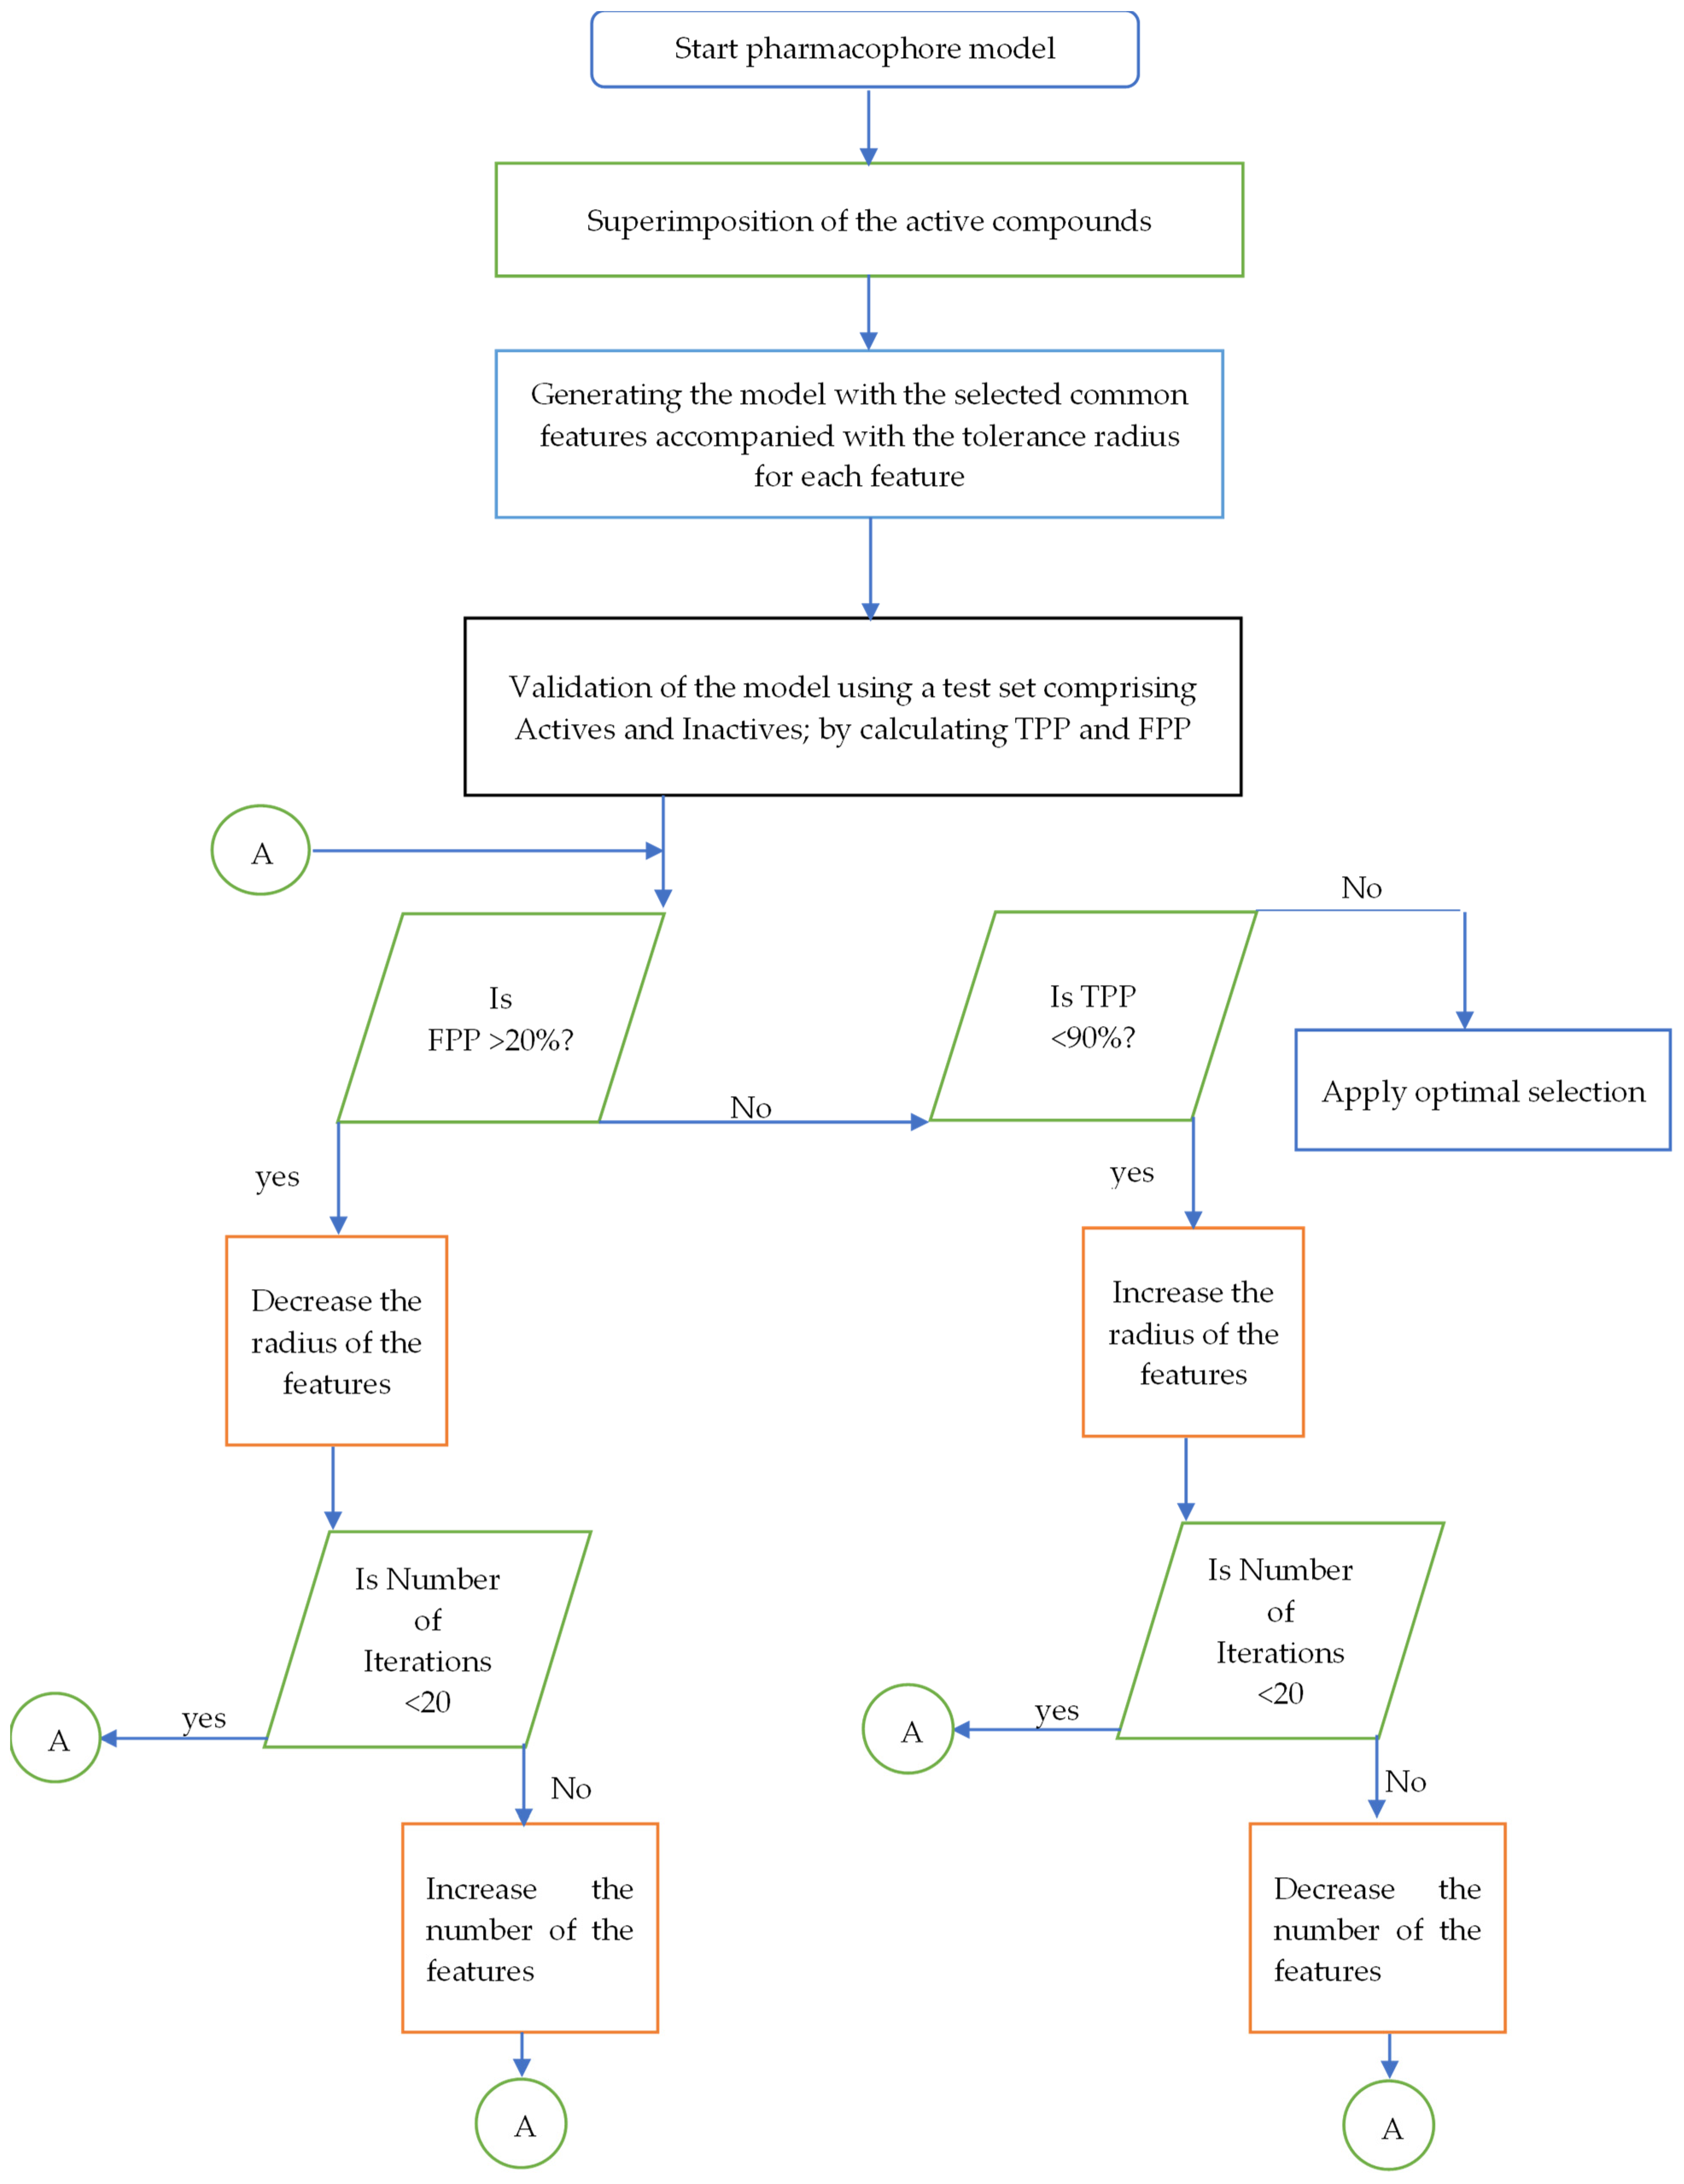
Figure 1. Pharmacophore modeling optimization technique flowchart.
Applsci 13 06175 g001
Figure 2. Flowchart of PM application for optimal sizing and allocation of energy storage in a power system.
Applsci 13 06175 g002
Figure 3. Modified IEEE 39 bus system [22].
Applsci 13 06175 g003
Figure 4. Power losses at normal operation conditions after optimal allocation of energy storage stations considering the daily change in demand and wind speeds.
Applsci 13 06175 g004
Figure 5. Voltage deviation at normal operation conditions after optimal allocation of energy storage stations considering the daily change in demand and wind speeds.
Applsci 13 06175 g005
Figure 6. Power losses in the generator contingency case after optimal allocation of energy storage stations considering the daily change in demand and wind speeds.
Applsci 13 06175 g006
Figure 7. Voltage deviation in the generator contingency case after optimal allocation of energy storage stations considering the daily change in demand and wind speeds.
Applsci 13 06175 g007
Table 1. Optimal sizing and allocation of energy storage stations using each optimization alternative.
MethodOptimal Buses Allocation and Power for Energy Storage Stations
GABus 4 with rating 574 MW and Bus 20 with rating 611 MW
PSOBus 7 with rating 152 MW, Bus 23 with rating 989 MW
WPMBus 26 with rating 252 MW, Bus 4 with rating 230 MW, Bus 8 with rating 307 MW and Bus 20 with rating 319 MW
NPMBus 27 with rating 268 MW, Bus 3 with rating 225 MW, Bus 8 with rating 309 MW and Bus 20 with rating 301 MW
Table 2. Difference between the four alternatives in terms of total costs due to losses and time taken to apply optimization.
Number of IterationsGAPSOWPMNPM
Cs (USD)Time (s)Cs (USD)Time (s)Cs (USD)Time (s)Cs (USD)Time (s)
3002566124524341177235510032311993
60023042570231623142122211820562008
90021103616209834182087325620373078
120020904022206640012006399220033962
Table 3. The change in hourly demand and wind speeds in a day.
Time (h)Total Load (MW)Wind Speed (m/s)
029,1845.5
128,7995.1
227,9044.6
327,3964
426,7284.2
525,9494.3
625,2084.8
725,3294.4
826,0864.3
928,1704.1
1029,1474.3
1129,5124.5
1230,2504.8
1330,4764.9
1430,8305.3
1530,5466.2
1630,6547.1
1730,6137.9
1830,1908.2
1930,7468.6
2031,7517.5
2131,3486.8
2230,8295.9
2330,5585.6
Disclaimer/Publisher’s Note: The statements, opinions and data contained in all publications are solely those of the individual author(s) and contributor(s) and not of MDPI and/or the editor(s). MDPI and/or the editor(s) disclaim responsibility for any injury to people or property resulting from any ideas, methods, instructions or products referred to in the content.