

Eco-Efficiency in Mushroom Production: A Study on HVAC Equipment to Reduce Energy Consumption and CO2 Emissions


Abstract
1. Introduction
2. State-of-the-Art
- Direct Emissions—include losses that are not refrigerant gases released over the life of the equipment.
- Indirect Emissions—fossil fuels are used in the generation of electricity, which have an environmental impact from the CO2 emitted during the operation of equipment throughout its useful life.
3. Materials and Methods
4. Analysis and Discussion of Results
- COP (kW/kW) =4.28;
- Mass flow (kg/s) = 0.0472;
- Compression ratio = 2.7;
- Diameter of the gas line (mm) = 15.82;
- Suction speed (m/s) = 9;
- Liquid line diameter (mm) = 8.09;
- Discharge line speed (m/s) = 1.
5. Conclusions
Author Contributions
Funding
Institutional Review Board Statement
Informed Consent Statement
Data Availability Statement
Conflicts of Interest
References
- Modern Forager. Sustainable Mushroom Picking. Available online: https://www.modern-forager.com/sustainable-mushroom-picking (accessed on 30 January 2023).
- Mushroom Market. Report Mushroom Market; IMARC Group: Brooklyn, NY, USA, 2022; 145p. [Google Scholar]
- Correio Braziliense. Consumo e Produção de Cogumelos No Brasil. Available online: https://www.correiobraziliense.com.br/app/noticia/economia/2018/01/29/internas_economia,656318/consumo-e-producao-de-cogumelos-no-brasil.shtml (accessed on 30 January 2023).
- Machado, H.; Sapata, M.M.; Ramos, A.R.; Barrento, M.J.; Bastidas, M.; Ferreira, M.; Coelho, R.; Banza, A.; Belchior, B.; Vitorino, C.; et al. Cogumelos em Portugal; Impressão: Europress—Indústria Gráfica Tiragem: 500 Nº Depósito Legal: 47993/21; Instituto Nacional de Investigação Agrária e Veterinária: Oeiras, Portugal, 2021; ISBN 978-972-579. [Google Scholar]
- Wang, M.; Zhao, R. A review on nutritional advantages of edible mushrooms and its industrialization development situation in protein meat analogs. J. Future Foods 2023, 3, 1–7. [Google Scholar] [CrossRef]
- The Times. Mushrooms the New Meat. Available online: https://www.thetimes.co.uk/article/are-mushrooms-the-new-meat-9r36366fm (accessed on 30 January 2023).
- Campo e Negócios. Producao de Cogumelos Comestíveis-No-Brasil-um-Mercado-em-Ascensao. Available online: https://revistacampoenegocios.com.br/producao-de-cogumelos-comestiveis-no-brasil-um-mercado-m-ascensao/ (accessed on 30 January 2023).
- Hamdane, S.; Pires, L.C.C.; Silva, P.D.; Gaspar, P.D. Evaluating the thermal performance and environmental impact of agricultural greenhouses using earth-to-air heat exchanger: An experimental study. Appl. Sci. 2023, 13, 1119. [Google Scholar] [CrossRef]
- Ten, S.T.; Krishnen, G.; Khulidin, K.A.; Tahir, M.A.M.; Hashim, M.H.; Khairudin, S. Automated Controlled Environment Mushroom House. Adv. Agric. Food Res. J. 2021, 2, 230. [Google Scholar] [CrossRef]
- Gaspar, P.D.; Fernandez, C.M.; Soares, V.N.G.J.; Caldeira, J.M.L.P.; Silva, H. Development of technological capabilities through the Internet of Things (IoT): Survey of opportunities and barriers for IoT implementation in Portugal’s agro-industry. Appl. Sci. 2021, 11, 3454. [Google Scholar] [CrossRef]
- Gaspar, P.D.; Soares, V.N.G.J.; Caldeira, J.M.L.P.; Andrade, L.P.; Soares, C.D. Technological modernization and innovation of traditional agri-food companies based on ICT solutions—The Portuguese case study. J. Food Process. Preserv. 2022, 46, e14271. [Google Scholar] [CrossRef]
- MSAE. Air conditioning systems for mushroom cultivation: Choosing the right sensors is crucial. In Advances in Agricultural and Food Research Journal (AAFRJ); Sociedade Malaia de Engenheiros Agrícolas e Alimentares (MSAE): Serdang, Malaysia, 2022; Volume 3. [Google Scholar]
- Jaiswal, B.; Agrawal, M. Carbon footprints of agriculture sector. Carbon Footpr. 2020, 81–99. [Google Scholar] [CrossRef]
- Dorr, E.; Koegler, M.; Gabrielle, B.; Aubry, C. Life cycle assessment of a circular, urban mushroom farm. J. Clean. Prod. 2021, 288, 125668. [Google Scholar] [CrossRef]
- Salehpour, T.; Khanali, M.; Rajabipour, A. Environmental impact assessment for ornamental plant greenhouse: Life cycle assessment approach for primrose production. Environ. Pollut. 2020, 266, 115258. [Google Scholar] [CrossRef] [PubMed]
- Khanali, M.; Kokei, D.; Aghbashlo, M.; Nasab, F.K.; Hosseinzadeh-Bandbafha, H.; Tabatabaei, M. Energy flow modeling and life cycle assessment of apple juice production: Recommendations for renewable energies implementation and climate change mitigation. J. Clean. Prod. 2020, 246, 118997. [Google Scholar] [CrossRef]
- Khanali, M.; Akram, A.; Behzadi, J.; Mostashari-Rad, F.; Saber, Z.; Chau, K.-w.; Nabavi-Pelesaraei, A. Multi-objective optimization of energy use and environmental emissions for walnut production using imperialist competitive algorithm. Appl. Energy 2021, 284, 116342. [Google Scholar] [CrossRef]
- Gaspar, J.P.; Gaspar, P.D.; Silva, P.D.; Simões, M.P.; Santo, C.E. Energy life-cycle assessment of fruit products-case study of Beira Interior’s Peach (Portugal). Sustainability 2018, 10, 3530. [Google Scholar] [CrossRef]
- Mostashari-Rad, F.; Ghasemi-Mobtaker, H.; Taki, M.; Ghahderijani, M.; Kaab, A.; Chau, K.-w.; Nabavi-Pelesaraei, A. Exergoenvironmental damages assessment of horticultural crops using ReCiPe2016 and cumulative exergy demand frameworks. J. Clean. Prod. 2021, 278, 123788. [Google Scholar] [CrossRef]
- Gaspar, P.D.; Godina, R.; Barrau, R. Influence of orchard cultural practices during the productive process of cherries through life cycle assessment. Processes 2021, 9, 1065. [Google Scholar] [CrossRef]
- Pakpahan, O.P.; Moreira, L.; Camelo, A.; Gaspar, P.D.; Santo, C.E. Evaluation of comparative scenarios from different sites of chestnut production using life cycle assessment (LCA): Case study in the Beira Interior region of Portugal. Heliyon 2023, 9, e12847. [Google Scholar] [CrossRef] [PubMed]
- El Kolaly, W.; Ma, W.; Li, M.; Darwesh, M. The investigation of energy production and mushroom yield in greenhouse production based on mono photovoltaic cells effect. Renew. Energy 2020, 159, 506–518. [Google Scholar] [CrossRef]
- Gaspar, P.D.; Silva, P.D.; Nunes, J.; Andrade, L.P. Characterization of the specific electrical energy consumption of agrifood industries in the central region of Portugal. Appl. Mech. Mater. 2014, 590, 878–882. [Google Scholar] [CrossRef]
- Silva, P.D.; Gaspar, P.D.; Nunes, J.; Andrade, L.P.A. Specific electrical energy consumption and CO2 emissions assessment of agrifood industries in the central region of Portugal. Appl. Mech. Mater. 2014, 675–677, 1880–1886. [Google Scholar] [CrossRef]
- Morais, D.; Gaspar, P.D.; Silva, P.D.; Andrade, L.P.; Nunes, J. Energy consumption and efficiency measures in the Portuguese food processing industry. J. Food Process. Preserv. 2022, 46, e14862. [Google Scholar] [CrossRef]
- Malhi, G.S.; Kaur, M.; Kaushik, P. Impact of climate change on agriculture and its mitigation strategies: A review. Sustainability 2021, 13, 1318. [Google Scholar] [CrossRef]
- SureHarvest. The Mushroom Sustainability Story: Water, Energy, and Climate Environmental Metrics. 2017. Available online: https://www.mushroomcouncil.com/wp-content/uploads/2017/12/Mushroom-Sustainability-Story-2017.pdf (accessed on 28 January 2023).
- Castellet, L.; Molinos-Senante, M. Efficiency assessment of wastewater treatment plants: A data envelopment analysis approach. integrating technical, economic, and environmental issues. J. Environ. Manag. 2016, 167, 160–166. [Google Scholar] [CrossRef]
- Ji, L.; Wu, T.; Xie, Y.; Huang, G.; Sun, L. A novel two-stage fuzzy stochastic model for water supply management from a water-energy nexus perspective. J. Clean. Prod. 2020, 277, 123386. [Google Scholar] [CrossRef]
- Yapıcıoğlu, P.; Yeşilnacar, M.İ. Energy cost optimization of groundwater treatment using biochar adsorption process: An experimental approach. Water Supply 2023, 23, 14–33. [Google Scholar] [CrossRef]
- Yapıcıoğlu, P.; Yeşilnacar, M.İ. Economic performance index assessment of an industrial wastewater treatment plant in terms of the European Green Deal: Effect of greenhouse gas emissions. J. Water Clim. Chang. 2022, 13, 3100–3118. [Google Scholar] [CrossRef]
- Silva, M.M. Cultivo de Cogumelos Comestíveis pela Técnica Jun-Cao; Instituto de Ciências Biológicas da Universidade Federal de Minas Gerais: Belo Horizonte, Brazil, 2011. [Google Scholar]
- Herrero, C.; Berraondo, I.; Bravo, F.; Pando, V.; Ordóñez, C.; Olaizola, J.; Martín-Pinto, P.; Oria de Rueda, J.A. Predicting Mushroom Productivity from Long-Term Field-Data Series in Mediterranean Pinus pinaster Ait. Forests in the Context of Climate Change. Forests 2019, 10, 206. [Google Scholar] [CrossRef]
- Bhandaria, R.; Dhunganab, R.; Neupane, P. Benefit-cost ratio analysis of pleurotus mushroom cultivation using dif-ferent substrates in campus of live sciences, Dang, Nepal. Food Agribus. Manag. 2021, 2, 85–87. [Google Scholar] [CrossRef]
- Figueirêdo, V.R.; Dias, E.S. Buton mushroom cultivation in function of temperature. Fitotécnica–Ciência Rural 2014, 44, 241–246. [Google Scholar] [CrossRef]
- Wahab, M.Z.; Manap, M.Z.I.A.; Ismail, A.E.; Ong, P. Investigation of temperature and humidity control system for mushroom house. Int. J. Integr. Eng. 2019, 11, 23–37. [Google Scholar] [CrossRef]
- Marzuki, A.; Ying, Y. Environmental monitoring and controlling system for mushroom farm with online interface. Int. J. Comput. Sci. Inf. Technol. 2017, 9, 17–28. [Google Scholar] [CrossRef]
- CAREL. Cultivo de Cogumelos. Available online: https://www.carelusa.com/environment/-/journal_content/56_INSTANCE_UlkJTljut2ly/10191/24161 (accessed on 8 March 2023).
- Urben, A.F. Produção de Cogumelos por Meio de Tecnologia Chinesa Modificada, 3rd ed.; Embrapa: Manaus, Brazil, 2017; 274p; ISBN 978-85-7035-651-2. [Google Scholar]
- AHRI Standard 210/240-2017; Performance Rating of Unitary Air Conditioning and Air Source Heat Pump Equipment (with Addendum 1). AHRI: Arlington, VA, USA, 2017.
- IPCC. Fifth Assessment Report; Intergovernmental Panel on Climate Change (IPCC): Geneva, Switzerland, 2014; Available online: https://www.ipcc.ch/report/ar5/syr/ (accessed on 30 January 2023).
- Yapıcıoğlu, P.; Demir, Ö. Minimizing greenhouse gas emissions of an industrial wastewater treatment plant in terms of water–energy nexus. Appl. Water Sci. 2021, 11, 180. [Google Scholar] [CrossRef]
- Demir, Ö.; Yapıcıoğlu, P. Investigation of GHG emission sources and reducing GHG emissions in a municipal wastewater treatment plant. Greenh. Gase Sci. Technol. 2019, 9, 948–964. [Google Scholar] [CrossRef]
- Santos, A.F.; Gaspar, P.D.; de Souza, H.J.L. Evaluating the energy efficiency and environmental impact of COVID-19 vaccines coolers through new optimization indexes: Comparison between refrigeration systems using hfc or natural refrigerants. Processes 2022, 10, 790. [Google Scholar] [CrossRef]
- EPE. Balanço Energético Nacional Relatório Síntese/Ano Base. Ministério de Minas e Energia—MME/Empresa de Pesquisa Ener-gética—EPE; República Federativa do Brasil: Brasilia, Brasil, 2019. Available online: https://www.epe.gov.br/sites-pt/publicacoes-dados-abertos/publicacoes/PublicacoesArquivos/publicacao-377/topico-470/Relat%C3%B3rio%20S%C3%ADntese%20BEN%202019%20Ano%20Base%202018.pdf (accessed on 30 January 2023).
- ASHRAE. ASHRAE Equipment Life Expectancy Chart; American Society of Heating, Refrigerating and Air-Conditioning Engineers Inc.: Atlanta, GA, USA, 2022; Available online: https://www.naturalhandyman.com/iip/infhvac/ASHRAE_Chart_HVAC_Life_Expectancy.pdf (accessed on 30 January 2023).
- IPCC. Four Assessment Report; Intergovernmental Panel on Climate Change (IPCC): Geneva, Switzerland, 2007; Available online: https://www.ipcc.ch/site/assets/uploads/2018/05/ar4_wg1_full_report-1.pdf (accessed on 16 February 2023).
- AIRHA. Best Practice Guideline: Methods of Calculating Total Equivalent Warming Impact (TEWI); The Australian Institute of Refrigeration, Air Conditioning and HeAting (AIRHA): Melbourne, Australia, 2012. [Google Scholar]
- Walter-Terrinoni, H. New U.S. Energy Efficiency Standards and Refrigerants for Residential ACs and Heat Pumps; Air Conditioning, Heating, and Refrigeration Institute (AHRI): Arlington, VA, USA, 2022. [Google Scholar]
- Shen, B.; Li, Z.; Gluesenkamp, K.R. Experimental study of R452B and R454B as drop-in replacement for R410A in split heat pumps having tube-fin and microchannel heat exchangers. Appl. Therm. Eng. 2022, 204, 117930. [Google Scholar] [CrossRef]
- OPTEON. Um Substituto de Refrigerante r-410a de Alto Desempenho e Ambientalmente Sustentável Para AC e Chillers. Available online: https://www.opteon.com/en/products/refrigerants/xl41 (accessed on 28 February 2023).
- HITACHIAIRCON. Manual de Instalação. Available online: https://www.hitachiaircon.com/br/downloads/primairy/tecnico-3/manual-de-instalacao-operacao-e-manutencao-primairy-hiom-cspar001-rev01-jun2021 (accessed on 13 January 2023).
- NBR16069 DE 04/2018; Segurança em Sistemas Frigoríficos em Sistemas Frigoríficos. Target Engenharia e Consultoria Ltda: São Paulo, Brasil, 2018.
- Chemours Refrigerants. Software Chemours Expert 1.0. Available online: https://pages.chemours.com/cre-chemours-refrigerants-expert-software.html. (accessed on 13 February 2023).
- ASHRAE. 2015 ASHRAE Handbook: HVAC Applications, SI ed.; American Society of Heating, Refrigerating and Air-Conditioning Engineers (ASHRAE): Atlanta, GA, USA, 2015; ISBN 9781936504947. [Google Scholar]
- Gunady, M.G.A.; Biswas, W.; Solah, V.A.; James, A.P. Evaluating the global warming potential of the fresh produce supply chain for strawberries, romaine/cos lettuces (Lactuca sativa), and button mushrooms (Agaricus bisporus) in Western Australia using life cycle assessment (LCA). J. Clean. Prod. 2012, 28, 81–87. [Google Scholar] [CrossRef]
- Robinson, B.; Winans, K.; Kendall, A.; Dlott, J.; Dlott, F. A life cycle assessment of Agaricus bisporus mushroom production in the USA. Int. J. Life Cycle Assess. 2019, 24, 456–467. [Google Scholar] [CrossRef]
- Leiva, F.J.; Saenz-Diez, J.C.; Martinez, E.; Jimenez, E.; Blanco, J. Environmental impact of Agaricus bisporus cultivation process. Eur. J. Agron. 2015, 71, 141–148. [Google Scholar] [CrossRef]
- Santos, A.F.; Gaspar, P.D.; de Souza, H.J.L. New HVAC Sustainability Index—TWI (Total Water Impact). Energies 2020, 13, 1590. [Google Scholar] [CrossRef]
- EC. Delivering the European Green Deal—The Decisive Decade. COM/2020/381 Final; Document 52020DC0381; European Commission (EC): Bruxels, Belgium, 2021; Available online: https://commission.europa.eu/strategy-and-policy/priorities-2019-2024/european-green-deal_en (accessed on 28 April 2023).
- Globo. EUA Agência Ambiental Propõe Regras para Reduzir Uso de Hidrofluorcarbonos. Available online: https://valor.globo.com/mundo/noticia/2021/05/03/eua-agencia-ambiental-propoe-regras-para-reduzir-uso-de-hidrofluorcarbonos.ghtm (accessed on 14 February 2023).
- Hunt, D.V.L.; Shahab, Z. Sustainable water use practices: Understanding and awareness of masters level students. Sustainability 2021, 13, 10499. [Google Scholar] [CrossRef]
- Yapıcıoğlu, P.; Yeşilnacar, M.İ. Investigating energy costs for a wastewater treatment plant in a meat processing industry regarding water-energy nexus. Environ. Sci. Pollut. Res. 2022, 29, 1301–1313. [Google Scholar] [CrossRef]


| Parameters | Inoculation | Incubation | Harvest |
|---|---|---|---|
| Relative humidity (%) | 90 | 95 | 85 |
| Temperature (°C) | 25 | 19 | 20 to 25 |
| CO2 concentration (ppm) | 20,000 | 600 | <600 |
| Lighting (lux) | Off | 2000 (12 h) | >500 |
| Parameter | Air Return Data | Air Supply Data |
|---|---|---|
| Dry bulb Temperature (°C) | 25 | 13.8 |
| Wet bulb Temperature (°C) | 23.7 | 12.8 |
| Dew point temperature (°C) | 22.83 | 11.86 |
| Enthalpy (kJ/kg) | 76.47 | 38.83 |
| Specific volume (m3/kg) | 0.9726 | 0.9211 |
| Specific mass (kg/m3) | 1.0281 | 1.0857 |
| Relative humidity (%) | 90 | 90 |
| Absolute humidity (g/kg) | 20.1581 | 9.8765 |
| Airflow (m3/h) | 1500 | 1500 |
| Parameter | Air Return Data | Air Supply Data |
|---|---|---|
| Dry bulb Temperature (°C) | 25 | 15 |
| Wet bulb temperature (°C) | 23.7 | 14.7 |
| Dew point temperature (°C) | 22.83 | 14.18 |
| Enthalpy (kJ/kg) | 76.47 | 44.21 |
| Specific volume (m3/kg) | 0.9726 | 0.9262 |
| Specific mass (kg/m3) | 1.0281 | 1.0796 |
| Relative humidity (%) | 90 | 97 |
| Absolute humidity (g/kg) | 20.1581 | 11.52 |
| Airflow (m3/h) | 1500 | 1500 |
| Characteristic | Value |
|---|---|
| Surface (m2) | 100 |
| Refrigerating capacity (BTU; kW) | 2 × 36,000 (10.548 kW) |
| COP Original equipment (kW/kW) | 3 |
| Water pump (kW) | 0.5 |
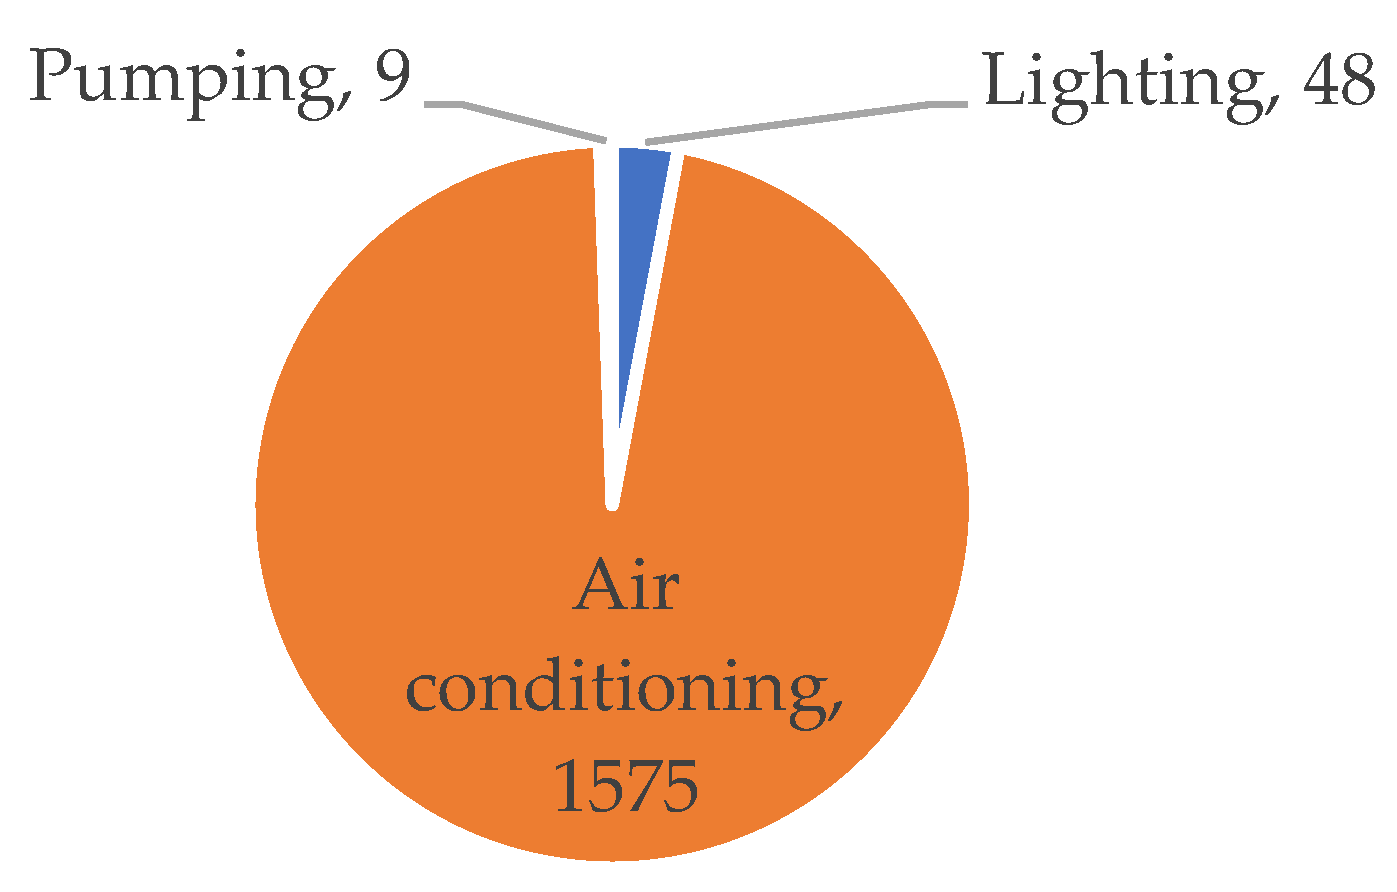
| Lighting (kW) | 0.05 kW |
| Harvest capacity in one cycle (kg) | 2200 |
| Full cycle time in refrigeration days | 21 |
| Parameters | Inoculation | Incubation | Harvest |
|---|---|---|---|
| Relative humidity (%) | 90 | 95 | 85 |
| Temperature (°C) | 25 | 19 | 19 |
| CO2 concentration (ppm) | 20,000 | 600 | <600 |
| Lighting (lux) | OFF | 2000 (12 h) | >500 |
| Time Process days | 5 | 5 | 11 |
| Operating Condition | Hours |
|---|---|
| 2 Active units | 24 |
| 1 Active units | 352 |
| Turned off by the thermostat | 128 |
| Total process time | 504 |
| Characteristics | Air Return Data (Harvest) | Air Supply Data |
|---|---|---|
| Dry bulb Temperature (°C) | 19 | 9 |
| Wet bulb temperature (°C) | 17.30 | 8.2 |
| Dew point temperature (°C) | 16.06 | 7.13 |
| Enthalpy (kJ/kg) | 52.18 | 27.04 |
| Specific volume (m3/kg) | 0.9414 | 0.90 |
| Specific mass (kg/m3) | 1.0623 | 1.11 |
| Relative humidity (%) | 85 | 90 |
| Absolute humidity (g/kg) | 13.04 | 7.146 |
| Airflow (m3/h) | 1500 | 1500 |
| Characteristics | Air Return Data (Harvest) | Air Supply Data (New Condition) |
|---|---|---|
| Dry bulb Temperature (°C) | 19 | 14.5 |
| Wet bulb Temperature (°C) | 17.30 | 14.2 |
| Dew point temperature (°C) | 16.06 | 13.68 |
| Enthalpy (kJ/kg) | 52.18 | 42.76 |
| Specific volume (m3/kg) | 0.9414 | 0.9241 |
| Specific mass (kg/m3) | 1.0623 | 1.0821 |
| Relative humidity (%) | 85 | 97 |
| Absolute humidity (g/kg) | 13.04 | 11.148 |
| Airflow (m3/h) | 3400 | 3400 |
| Parameter | Value |
|---|---|
| Airflow (m3/h) | 3400 |
| Evaporator fan consumption (kW) | 0.315 |
| Condenser fan consumption (kW) | 0.188 |
| Individual Thermal Load (kW) | 9.58 |
| Condensing temperature (°C) | 41 (based on the 10 K air intake approach) [36]. |
| Evaporation temperature (°C) | 4.5 |
| Refrigerant gas | R-454-B |
| Refrigerant gas Charge (kg) | 2 |
| Gas superheating (°C) | 5 |
| Gas subcooling (°C) | 3 |
| Isentropic Efficiency. | 0.70 |
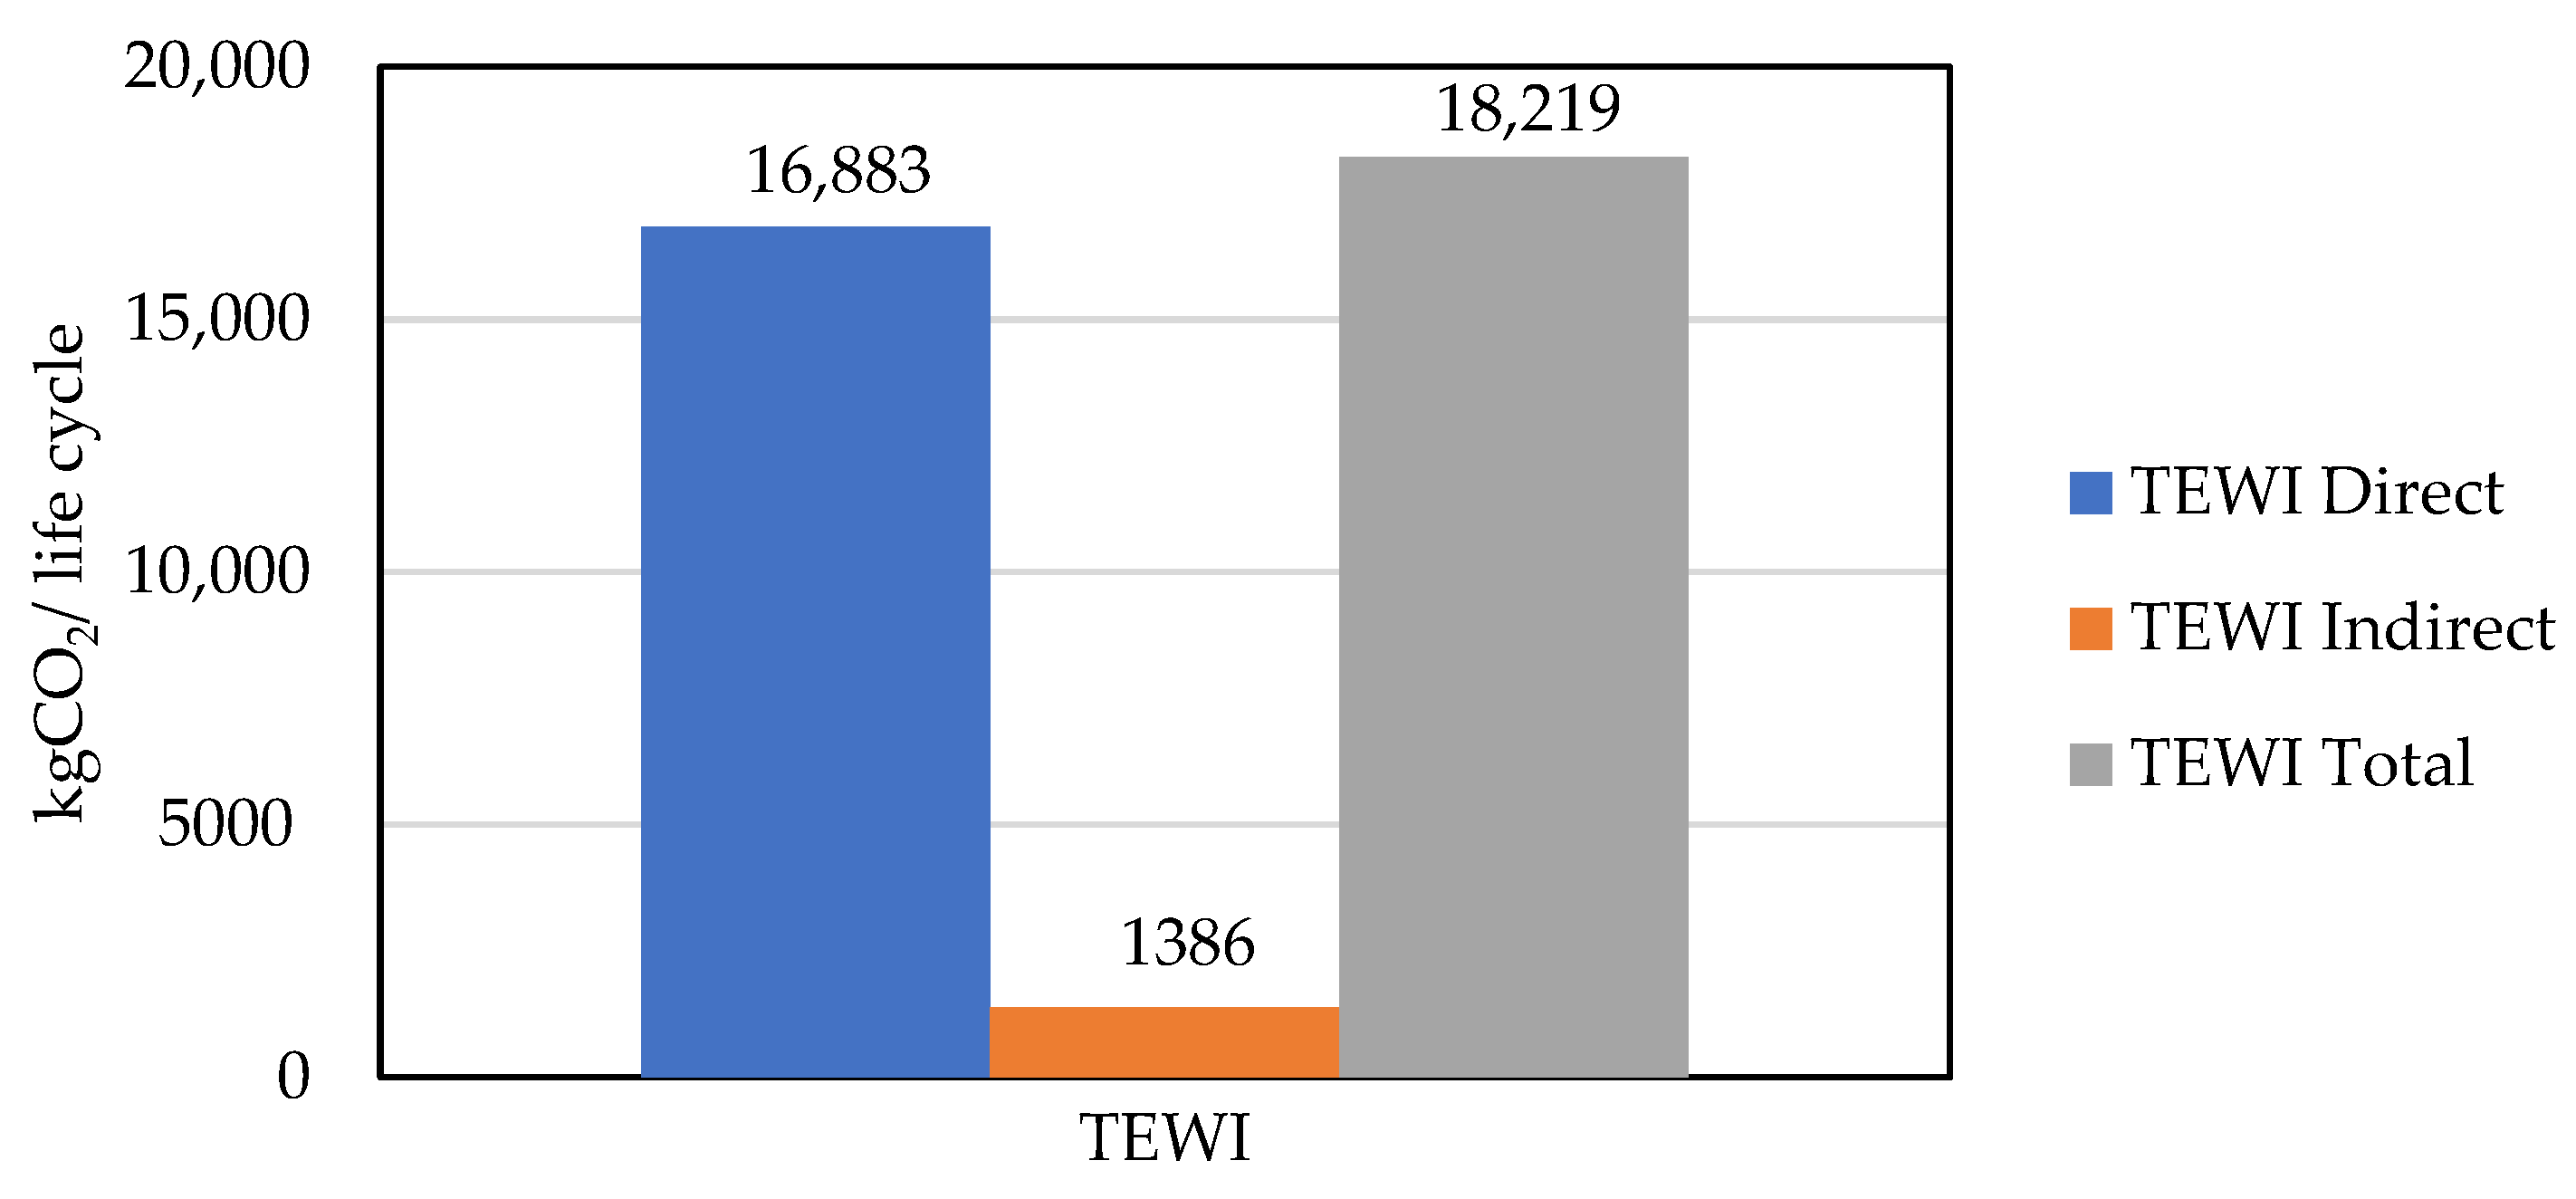
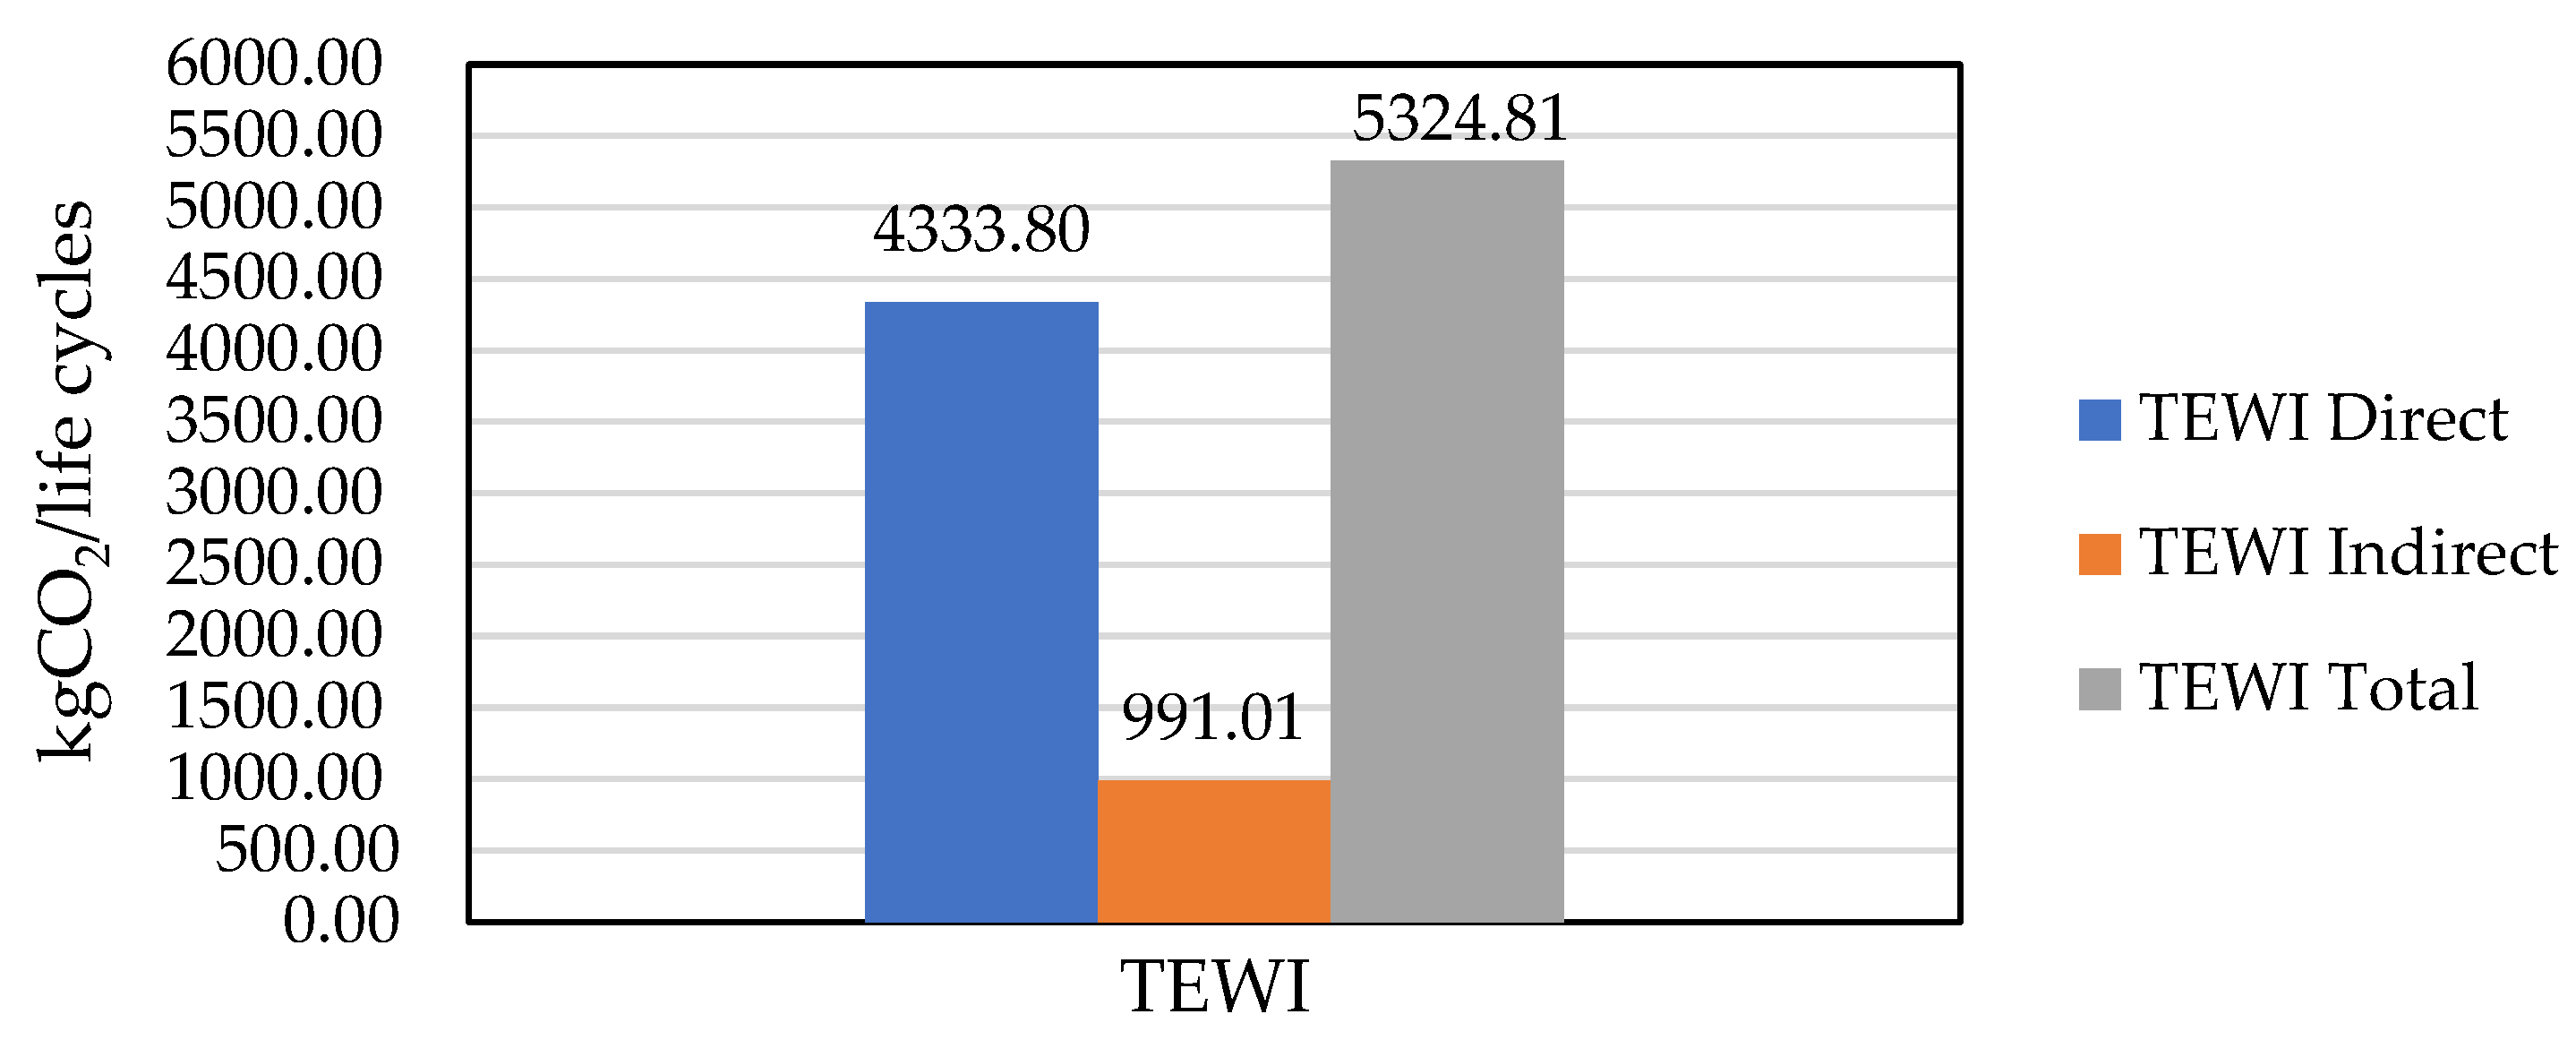
| Condition | Air Conditioning Energy Consumption Service Life 10 Years kWh (Air Conditioning Only) | Consumption Water Air Conditioning Useful Life 10 Years Liters (Only Air Conditioning) | TEWI kgCO2/10 Years | Energy Consumption kwh per Kg of Mushroom per 21-Day Cycle |
|---|---|---|---|---|
| In current operation | 189,000 | 2,616,240 | 18,219 | 0.7515 |
| Improved design condition | 135,138 | 18,690,000 | 5324.81 | 0.537 |
Disclaimer/Publisher’s Note: The statements, opinions and data contained in all publications are solely those of the individual author(s) and contributor(s) and not of MDPI and/or the editor(s). MDPI and/or the editor(s) disclaim responsibility for any injury to people or property resulting from any ideas, methods, instructions or products referred to in the content. |
© 2023 by the authors. Licensee MDPI, Basel, Switzerland. This article is an open access article distributed under the terms and conditions of the Creative Commons Attribution (CC BY) license (https://creativecommons.org/licenses/by/4.0/).
Share and Cite
Santos, A.F.; Gaspar, P.D.; de Souza, H.J.L. Eco-Efficiency in Mushroom Production: A Study on HVAC Equipment to Reduce Energy Consumption and CO2 Emissions. Appl. Sci. 2023, 13, 6129. https://doi.org/10.3390/app13106129
Santos AF, Gaspar PD, de Souza HJL. Eco-Efficiency in Mushroom Production: A Study on HVAC Equipment to Reduce Energy Consumption and CO2 Emissions. Applied Sciences. 2023; 13(10):6129. https://doi.org/10.3390/app13106129
Chicago/Turabian StyleSantos, Alexandre F., Pedro D. Gaspar, and Heraldo J. L. de Souza. 2023. "Eco-Efficiency in Mushroom Production: A Study on HVAC Equipment to Reduce Energy Consumption and CO2 Emissions" Applied Sciences 13, no. 10: 6129. https://doi.org/10.3390/app13106129
APA StyleSantos, A. F., Gaspar, P. D., & de Souza, H. J. L. (2023). Eco-Efficiency in Mushroom Production: A Study on HVAC Equipment to Reduce Energy Consumption and CO2 Emissions. Applied Sciences, 13(10), 6129. https://doi.org/10.3390/app13106129