Article

Design of a Cargo-Carrying Analysis System for Mountain Orchard Transporters Based on RGB-D Data

1
College of Electronic Engineering (College of Artificial Intelligence), South China Agricultural University, Guangzhou 510642, China
2
Pazhou Lab, Guangzhou 510330, China
3
Mechanization Laboratory of National Modern Agriculture (Citrus) Industrial Technology System, South China Agricultural University, Guangzhou 510642, China
4
Engineering Fundamental Teaching and Training Center, South China Agricultural University, Guangzhou 510642, China
5
Automatic Control School, Liuzhou Railway Vocational Technical College, Liuzhou 545616, China
*
Author to whom correspondence should be addressed.
Appl. Sci. 2023, 13(10), 6059; https://doi.org/10.3390/app13106059
Submission received: 7 March 2023 / Revised: 26 April 2023 / Accepted: 14 May 2023 / Published: 15 May 2023
(This article belongs to the Section Agricultural Science and Technology)

Abstract

:
To create a digital unmanned orchard with automation of “picking, load and transportation” in the hills and mountains, it is vital to determine a cargo-carrying situation and monitor the real-time transport conditions. In this paper, a cargo-carrying analysis system based on RGB-D data was developed, taking citrus transportation as the scenario. First, the improved YOLOv7-tiny object detection algorithm was used to classify and obtain 2D coordinate information on the carried cargo, and a region of interest (ROI) was obtained from the coordinate information for cargo height measurement. Second, 3D information was driven by 2D detection results using fewer computing resources. A depth map was used to calculate the height values in the ROI using a height measurement model based on spatial geometry, which obtained the load volume of the carried cargo. The experimental results showed that the improved YOLOv7 model had an accuracy of 89.8% and an average detection time of 63 ms for a single frame on the edge-computing device. Within a horizontal distance of 1.8 m from the depth camera, the error of the height measurement model was ±3 cm, and the total inference time of the overall method was 75 ms. The system lays a technical foundation for generating efficient operation paths and intelligently scheduling transport equipment, which promote the intelligent and sustainable development of mountainous agriculture.

1. Introduction

Citrus and other Lingnan fruits are produced in mountain orchards in South China. Owing to the topography, the orchards are primarily distributed in the hills and mountains. The manual transportation of agricultural materials in mountain orchards is not only labor-intensive but also inefficient [1,2,3,4]. To increase efficiency, monorail transporters for mountain orchards have an efficient structure, are highly reliable and safe, and are economically beneficial, so they are being widely promoted in hilly areas in China [5,6,7,8]. However, as shown in Figure 1, most mountain orchards have large slopes and poor site conditions, so they are unsuitable for the manual supervision of transportation safety. Determining the transportation situation, such as not exceeding the rated capacity, is vital for safety, transporter scheduling, and operational efficiency. Therefore, we need to accurately detect the carried cargo and study the determination of the load volume of the transporter.
In mountain orchards, transporters mainly carry goods such as fruit, fertilizers, and small agricultural machinery. The working environment is complex, the light changes, and the cargo overlaps. To accurately determine the cargo from 2D images, researchers have conducted studies with classic and deep-learning-based detection algorithms. For example, Davide et al. [9] constructed a multi-camera-based vision system with an eye-in-hand 2D camera and a TOF camera to depalletize boxes using automatic grabbing. The images were processed using the Canny operator and Hough transform to detect the gaps between the boxes and pallets. When the surface patterns and textures of the boxes were rich, many edges were detected, resulting in detection errors. Zhang et al. [10] designed a cigarette parcel stacking system based on machine vision. The system extracted the Harris corner features and used the RANSAC algorithm to eliminate the mismatched points to detect cigarette parcels. The accuracy was high in a specific lighting environment but was seriously affected by light changes. Since 2012, with the development of the convolutional neural network, a deep-learning-based detection algorithm has been developed. For example, Yang et al. [11] optimized RetinaNet by embedding the offset prediction to improve the performance in classification and localization, achieving the high-accuracy segmentation and detection of cartons in warehouses and logistics. Jin et al. [12] introduced the ZF + RPN structure into the backbone of faster-RCNN to recognize and locate cargo in storage environments, but the height and volume of the cargo could not be determined using RGB images. Wang et al. [13] introduced the MobileNetv3 network to optimize the backbone of YOLOv4 and used the attention mechanism to efficiently detect goods in warehouse environments. Therefore, the traditional algorithms are not ideal for object detection in mountain orchards. Single-stage detectors based on deep learning are more robust and can meet the detection needs in mountain orchards.
To determine the cargo load volume from 3D information, RGB-D images, LiDAR devices, and 3D point cloud models have been used. For example, Kong et al. [14] proposed a method for measuring the cargo volume in train carriages based on LiDAR. The method uses the relative motion between the radar and the train to perform dynamic scanning and obtain a depth map. A Delaunay triangular network is then constructed through projection to segment the point clouds on the carrier body plane to determine the load capacity. Dilotis et al. [15] proposed a detection algorithm based on RGB-D images that uses 3D point cloud data and segmentation methods to determine the cargo’s location; in combination with the grasping robot’s running posture, cargo can be automatically loaded and unloaded in a warehouse. However, the method is hard to deploy on an embedded device. Wu et al. [16] proposed a visual system for cartons based on RGB-D images in the logistics industry. It optimized the localization accuracy using an IOU, and a depth map was used to determine the distance between the manipulator and the cartons. The system was widely applied to robot grasping but needed to be deployed on high-performance computers. In summary, we can determine the coordinates of objects using RGB images, but obtaining spatial information, such as height and volume, using 2D data is challenging. Three-dimensional data record spatial distance, so they are suitable for constructing spatial models to measure volume and height. However, using 3D LiDAR to obtain a point cloud is costly, and volume measurement is computationally expensive, making them unsuitable for deployment in edge-computing devices. Conversely, RGB-D vision-based systems are inexpensive and broadly applicable.
In this study, in order to obtain the real-time transportation situation and create a digital unmanned orchard with automation of “picking, load and transportation” in the hills and mountains. We took citrus transportation as the scenario and designed a cargo-carrying analysis system based on RGB-D data. Specifically, we used an improved YOLOv7-tiny object detection algorithm to classify and obtain the 2D coordinate information of the cargo, fused the coordinate information and depth map, used the correspondence between the image plane and the camera coordinate system to determine the load volume of the carried cargo using the height analysis method, and deployed the method for edge-computing applications. It can improve efficiency and enhance the intelligence and automation of transportation, which promotes the sustainable development of mountain agriculture.

2. Materials and Methods

2.1. Overview of the Cargo-Carrying Analysis System

To classify and determine the load volume of the cargo carried by a monorail transporter in citrus transportation, a cargo-carrying analysis system was developed based on RGB-D data, as shown in Figure 2. The scheme had two parts: a deep-learning-based object detection algorithm for classification and localization, and a carried cargo height measurement model based on 3D vision technology.
During citrus transportation, the depth camera captured RGB-D images in the front of the loading platform, and the improved YOLOv7-tiny object detection algorithm was used to detect the RGB images to classify the objects (“basket”, “orange”, and “fullbasket”) and obtain 2D coordinate information. Second, the 2D coordinate information of the predicted box was converted into the region of interest (ROI) for height measurement. By combining it with a depth map, we randomly sampled the points in the ROI and used the spatial point height measurement model to calculate the height of the cargo to determine the number of layers where the carried cargo was located. Finally, the classification and load volume were obtained.

2.2. Acquisition System and Data Construction

2.2.1. Data Acquisition System and Condition

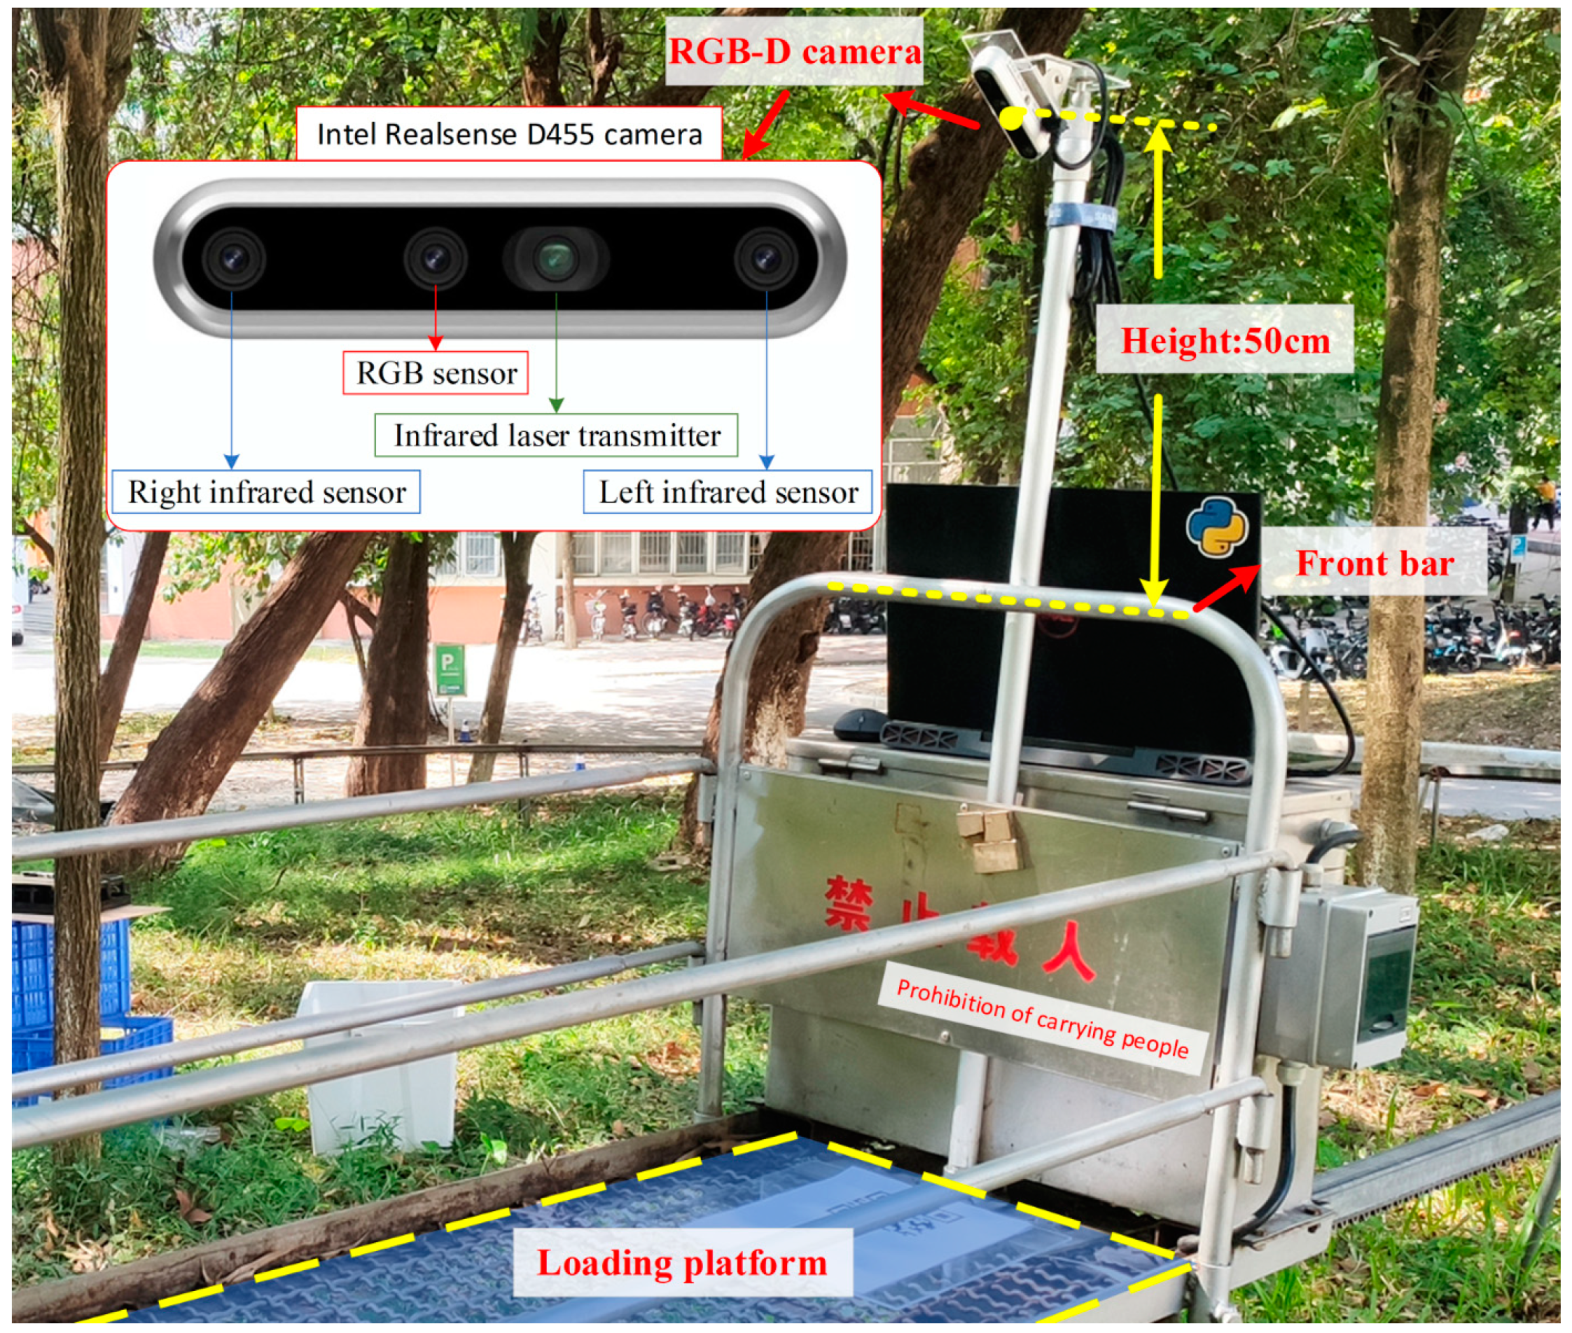
The custom dataset was collected from the monorail transporter testing platform at South China Agricultural University (23°9′29.52″ N, 113°20′53.52″ E). During transportation, the monorail transporter loads and unloads agricultural materials anywhere around the mountain orchards, and a battery provides power for the system. An Intel RealSense D455, a powerful RGB-D camera with an infrared laser transmitter, was installed in front of the trailer and 50 cm higher than the front bar at an angle of 45° relative to the loading platform, as shown in Figure 3. Therefore, the RGB-D camera could capture complete images of the trailer. We set the resolution of the RGB and depth images to 1280 × 720 pixels. We used the RGB images to train the object detection algorithm and used the depth images in the height measurement model to determine the load volume.

2.2.2. Construction of the Object Detection Dataset

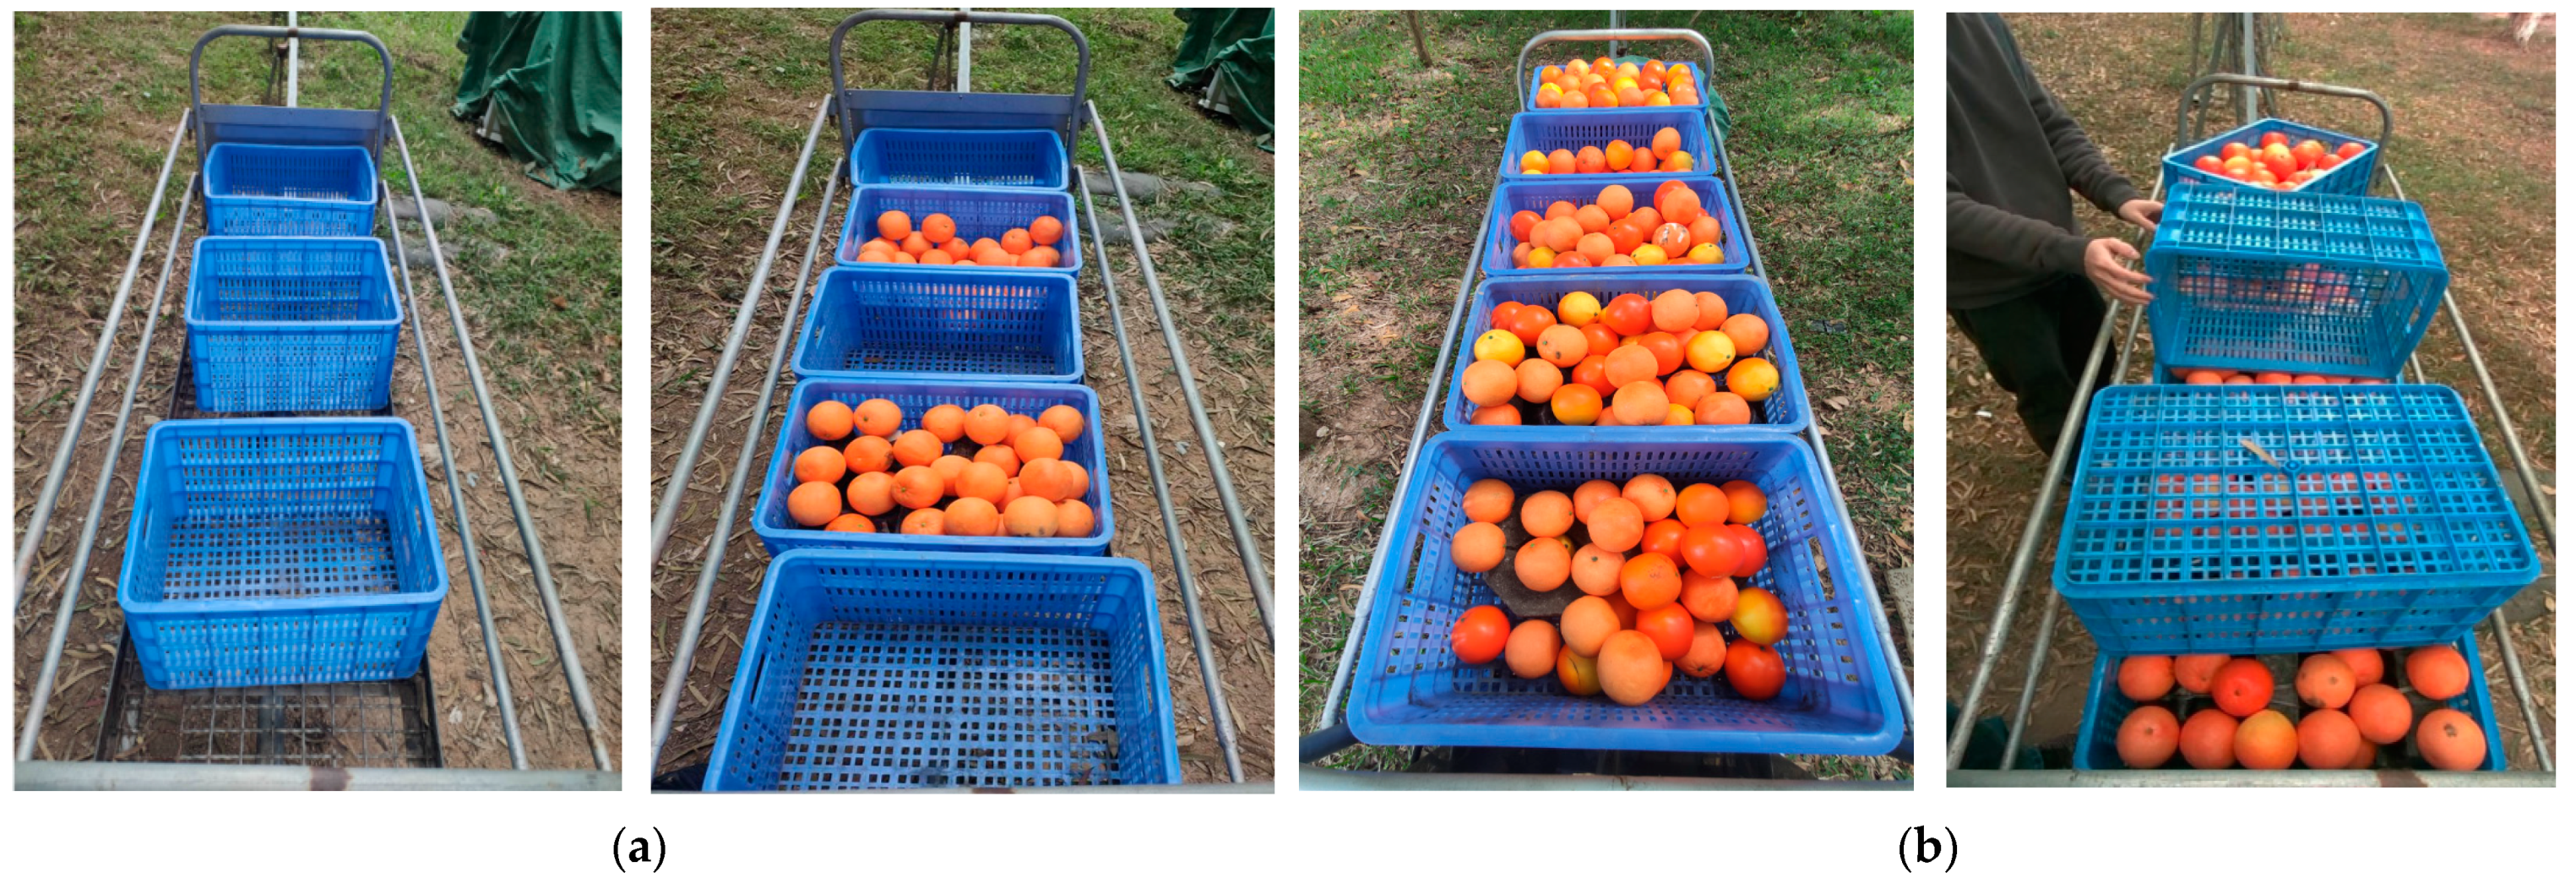
The scenarios included a transporter carrying single- and two-layer fruit baskets, as shown in Figure 4. During citrus transportation, the fruit baskets were full or empty, and the unfilled baskets were not loaded on the trailer. The study considered the situation of empty and full baskets. The initial dataset included 1447 RGB images, and we used LabelImg software to annotate the detection objects (“basket”, “orange”, and “fullbasket”), which had 1392, 8542, and 781 instances, respectively. To improve the diversity of the dataset, we performed random brightness adjustments and added Gaussian noise to augment the data. The augmented dataset included 4341 images, which were divided into training and validation sets at a ratio of 8:2. These sets included 3472 and 869 training and validation images, respectively.

3. Model Construction and Volume Measurement Strategy and Deployment

3.1. YOLOv7-Tiny Object Detection Algorithm

We needed to optimize an efficient detection model that was suitable for edge-computing devices to quickly and accurately detect the cargo carried by the monorail transporter. In 2022, the real-time object detection algorithm YOLOv7 was proposed. The YOLOv7 family includes state-of-the-art models, such as YOLOv7x, YOLOv7d6, and YOLOv7-tiny [17]. In this study, we optimized the YOLOv7-tiny model to classify and obtain the 2D coordinate information of the detected objects, including “basket”, “orange”, and “fullbasket”, because it has fewer parameters and is highly efficient.
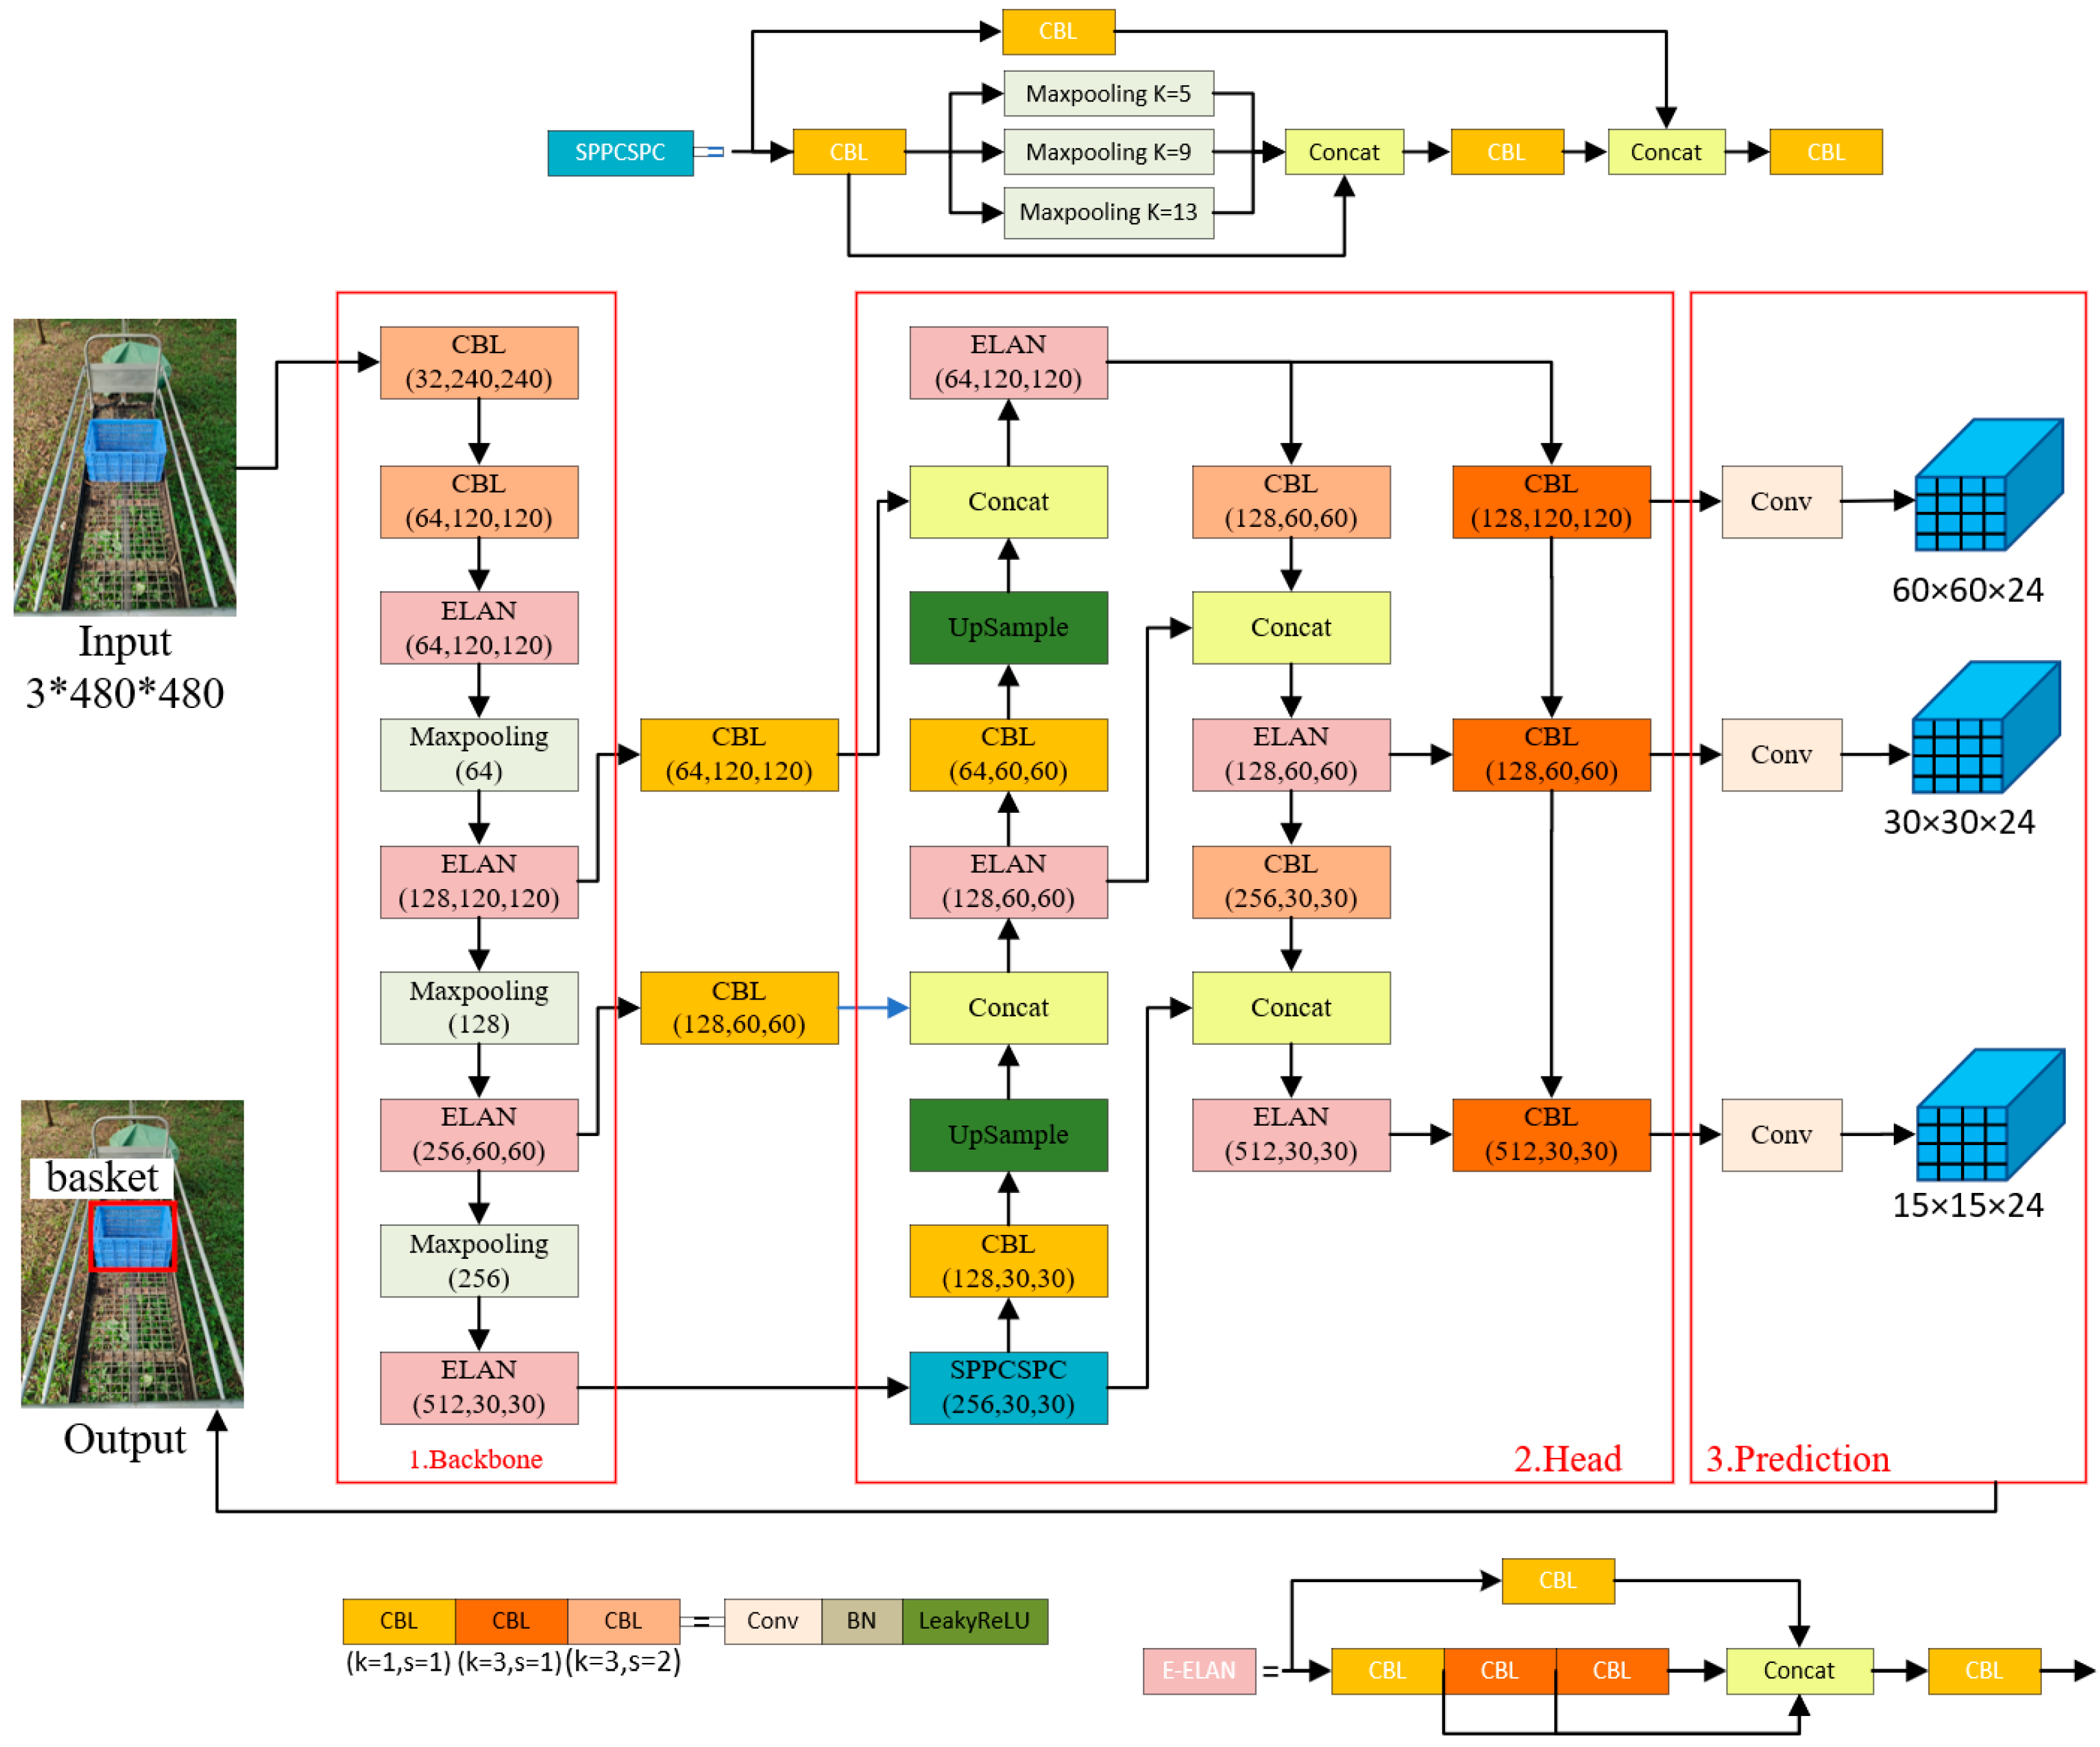
The YOLOv7-tiny network is divided into three parts: the backbone, the head network, and prediction [18], as shown in Figure 5. In the backbone, we modified the image frames to 480 × 480 pixels and extracted features using two CBL modules and four E-ELAN modules. E-ELAN enabled the framework to learn better without destroying the original gradient path, considering the tradeoff between speed and accuracy. In the head network, the path aggregation network (PAN) [19] structure fused the spatial and semantic information of the backbone and the head network to enhance the learning ability of the model. YOLOv7-tiny predicts boxes at three different scales, so the detection is more accurate than that of YOLOv3-tiny [20] and YOLOv4-tiny. In this study, we predicted three bounding boxes at each scale, so the 3D tensor was N × N × [ 3 × ( 4 + 1 + 3 ) ] for the four bounding box offsets, one objectness prediction, and three class predictions.

3.1.1. Optimization of Loss Function

The loss function of the YOLOv7-tiny model is composed of three parts: localization, confidence, and classification loss [21]. Among them, the classification and confidence loss are evaluated by the cross-entropy (CE) loss. However, the YOLOv7-tiny model generates many bounding boxes during prediction, but only a few of them contain detection objects, which creates the problem of imbalance between positive and negative examples and can easily lead to a deviation in model optimization. We introduced focal loss to address the imbalance and optimize the loss function.
The cross-entropy loss for binary classification ( p t ) is defined as
p t = { p y = 1 1 p o t h e r w i s e C E ( p , y ) = C E ( p t ) = log ( p t )
where y specifies the ground-truth class and p t is the estimated probability for the class.
Focal loss [22] introduces α t [ 0 ,   1 ] to balance the importance of positive and negative examples and adds a modulating factor, ( 1 p t ) γ , with a tunable focusing parameter, γ 0 , to differentiate between easy and hard examples, as shown in Formulas (2) and (3). The focal loss is shown in Formula (4).
α t = { α y = 1 1 α o t h e r w i s e C E ( p , y , α ) = { log ( p ) α y = 1 log ( 1 p ) ( 1 α ) y = 0
F C E ( p t ) = ( 1 p t ) γ log ( p t )
F L ( p t ) = α t ( 1 p t ) γ log ( p t )

3.1.2. Model Pruning

Although the improved detection model had good performance in accuracy, the embedded device still had significant limitations. Therefore, we used a channel-wise pruning method to speed up detection.
Inspired by Liu, the factor γ of the batch normalization was multiplied with the previous layer, which could measure the importance of the channel [23]. Then, we added the L1 norm with γ to the loss function. We obtained the pruned strategy based on γ, as shown in Figure 6.
Inspired by Li, using a vanilla evaluation to evaluate a candidate model will lead to poor pruning results. Therefore, an adaptive-BN-based evaluation [24] and the channel-wise pruning method were used to prune the improved YOLOv7-tiny algorithm. A flowchart is illustrated in Figure 7.
First, we defined the max pruning rate (R) and randomly sampled L real numbers in the range [0, R] to output a pruning vector such as ( r 1 , r 2 , , r L ) for a L-layer model to generate a large number of pruning strategies, where r L is the pruning ratio for the l t h layer. The second step was filter pruning. We ranked the trained model obtained in the first step using the L1 norm of the filter and then permanently pruned the least important filters. Next, we used the adaptive-BN-based evaluation to evaluate the candidate models. Specifically, given a pruned network, we froze all learnable parameters and used a small amount of the training data to calculate the adaptive statistics μ t and σ t 2 , as illustrated in Formula (5). m refers to the momentum coefficient, and subscript t is the number of training iterations. We used a part of the training set to evaluate the candidate network and picked those with the highest accuracy. After fine tuning, we obtained the pruned model.
μ t = m μ t 1 + ( 1 m ) μ B   σ t 2 = m σ t 1 2 + ( 1 m ) σ 2

3.2. Volume Measurement Strategy

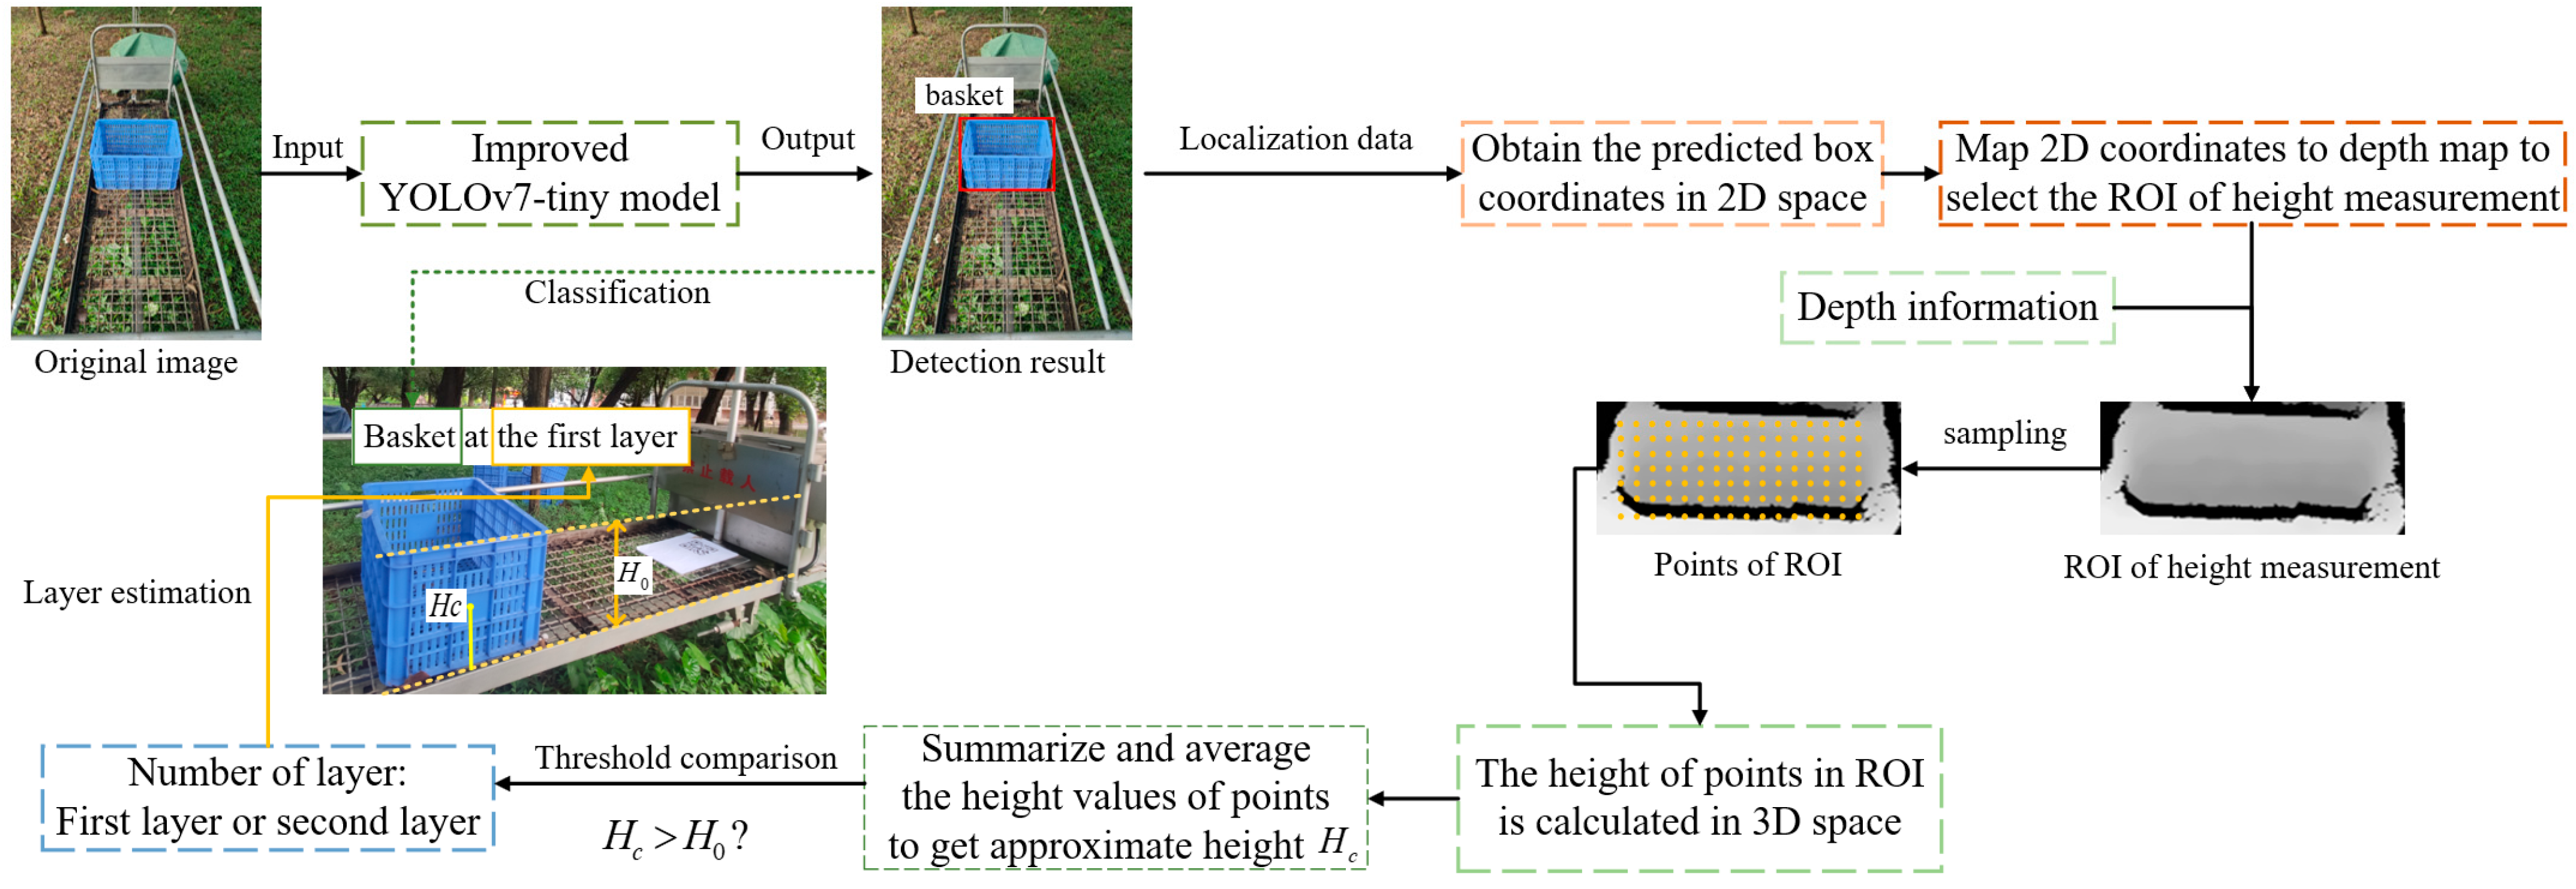
To obtain the load volume for citrus transportation, we used detection results, depth maps, and the spatial point height measurement model to determine the number of layers where a fruit basket was located. We converted the 2D coordinate information into an ROI for height analysis. The depth values were converted into the height values in the ROI by fusing the depth map with the height measurement model to obtain the number of layers of the carried cargo. A flowchart is shown in Figure 8.
According to the transport, the load reached the rated carrying capacity when the transporter carried two layers of “fullbasket”, so we considered the cases of the transporter carrying one or two layers of fruit baskets. Because we used standardized baskets (length × width × height = 490 × 350 × 260 mm) for transportation, when a basket was located on the first or second layer, the heights of the spatial points in the ROI were more or less than 260 mm. Considering the measurement error and the analysis of the experiment, we set 300 mm as the threshold to determine whether a fruit basket was on the first or second layer.
The steps for the height analysis of the fruit baskets were as follows:
  • The improved YOLOv7-tiny model was used to obtain the 2D coordinate information ( ( x 1 , y 1 ) R G B ,   ( x 2 , y 2 ) R G B ) in the RGB image;
  • The ROI of the height measurement in the depth map was obtained according to the 2D coordinate information;
  • The depth value ( D e p t h ( x , y ) x [ x 1 , x 2 ] , y [ y 1 , y 2 ] ) and the spatial point height measurement model were combined to obtain the height value ( H ( x , y ) x [ x 1 , x 2 ] , y [ y 1 , y 2 ] ) of each point in the ROI;
  • The height values of each spatial point in the ROI were summed and averaged to obtain the approximate height value ( H c ) of the basket;
  • The approximate height of the basket was compared to the height threshold to determine the number of layers where the basket was located;
  • Combined with the classification and the number of layers, the load volume measurement was realized.

3.2.1. Construction of 3D Spatial Trailer Model

To calculate the height value in the ROI, it was necessary to establish a 3D spatial model. The 3D spatial model described the projection of a point from the 3D camera coordinate system and the 2D image plane, including an RGB-D camera, a trailer, and a loading platform, as shown in Figure 9.
O C X C Y C Z C was the camera coordinate system, O C was the camera’s optical center, O was the center of the image plane, U and V were the coordinate axes of the image plane, and the point in the upper left corner of the image plane was the origin [25]. According to the imaging principle, we denoted the coordinates of the depth map as P ( u , v , d ) . The depth value was the distance between the RGB-D camera and the corresponding point in 3D space, and P C ( x C , y C , z C ) was a point in the camera coordinate system.
The projection of the camera coordinate system to the 2D image plane was defined as
z C [ u v 1 ] = [ f x 0 u 0 0 f y v 0 0 0 1 ] [ x C y C z C ] = K [ x C y C z C ]
where K is the intrinsic matrix; f is the camera’s focal length; f x and f y represent the physical width and height of a pixel, respectively; f x = f / d x ; and f y = f / d y .

3.2.2. Spatial Point Height Measurement Model

To measure the height of the cargo, we needed to obtain the height value of any spatial point in the trailer. Inspired by the PnP [26,27] method, we obtained the height value using the projection from the image plane to the camera coordinate system. As shown in Figure 10, O C was the camera’s optical center, also known as the center of projection; P 1 , P 2 , and P 3 in { P } were three known 3D points in the camera coordinate system; and P 1 I , P 2 I and P 3 I in { P I } were their projections on the image plane, respectively. We solved angle θ using the projection of 3D coordinates { P } to 2D coordinates { P I } and constructed a spatial geometry model to measure the height values in the trailer. P 1 , the center of the QR code, was perpendicular to the bottom of the camera as a reference point for solving spatial angle θ .
The height measurement steps were as follows:
  • To obtain the intrinsic matrix, we used Zhang’s [28] calibration method to calibrate the RGB-D camera;
  • We initialized the variables, measured the height value ( h 0 ) from the RGB-D camera to the loading platform, and obtained the 2D coordinate information ( P 1 I ) corresponding to spatial point P 1 ;
  • For coordinate normalization, we normalized the 2D coordinates as ( x c z c , y c z c , 1 ) , according to the camera projection model:
    u = f x x c z c + c x x c z c = u f x c x f x v = f y y c z c + c y y c f y = v f y c y f y
  • We calculated angle θ . We defined the normalized coordinates of P 1 I and P 2 I as P 1 I = ( u 1 , v 1 , 1 ) and P 2 I = ( u 2 , v 2 , 1 ) , and we calculated angle θ as follows:
    cos θ = O P 1 I O P 2 I | O P 1 I | | O P 2 I | = e 1 · e 2
    e 1 = ( u 1 u 1 2 + v 1 2 + 1 , v 1 u 1 2 + v 1 2 + 1 , 1 u 1 2 + v 1 2 + 1 )
    e 2 = ( u 2 u 2 2 + v 2 2 + 1 , v 2 u 2 2 + v 2 2 + 1 , 1 u 2 2 + v 2 2 + 1 )
  • We obtained the height value ( h 2 ) of P 2 using Formula (11). We determined the lengths of O C P 1 and O c P 2 in the depth map, and O C P 1 h 0 .
    h 2 = h 0 O C P 2 cos θ

3.3. Hardware and Deployment

The hardware of the cargo-carrying analysis system was mainly composed of an edge-computing device (Jetson Nano B01), an RGB-D camera (Intel RealSense D455), a display screen, and a regulated power supply module (EV25-K2405). We deployed the improved YOLOv7-tiny model and the volume measurement method on a Jetson Nano.
The Jetson Nano had an ARM Cortex-A57 CPU processor, 128 CUDA units, 4 GB of DDR4 memory, and a CUDA-X acceleration library for deep learning. The operating system was Ubuntu 18.04. The RGB-D camera integrated RGB images with a projected IR pattern, and its depth error was less than 2% at 4 m. Figure 11 shows the hardware of the system.

4. Results

4.1. Training and Evaluation of Object Detection Algorithm

RGB images were used for training and evaluating the improved YOLOv7-tiny object detection algorithm, which classified and localized the detection objects, including baskets, oranges, and full baskets. This section introduces the detection algorithm’s training details and evaluation methods.

4.1.1. Experimental Training Settings

The model was trained on a cloud computing platform running Ubuntu 18.04, and its configuration was as follows: Intel(R) Xeon(R) Gold 6330, 29 GB of memory, and an NVIDIA GeForce RTX 3090 24 GB graphics card. We tested using Ubuntu 18.04 with an Intel(R) Core i5-11400 CPU, 16 GB of memory, and an NVIDIA GeForce RTX 3060 graphics card. The embedded platform was a Jetson Nano B01 with 4 GB of RAM and AI acceleration [29].
We trained 500 epochs on the custom dataset with a batch size of 32 and used the stochastic gradient descent (SGD) algorithm to optimize the detection model. We used mosaic data augmentation to improve the efficiency of single-GPU training [30].

4.1.2. Model Evaluation

The mean average precision (mAP) and average precision (AP) [31,32] were used to evaluate the model’s accuracy, as shown in Formulas (12) and (13), where N represents the number of classes and N = 3. Additionally, floating point operations (FLOPs) and milliseconds per image (ms/img) were used to evaluate the complexity of the detection algorithm.
A P = 0 1 P ( r ) d r  
m A P @ 0.5 : 0.95 = 1 N i = 1 N j A P i ( I O U t h r e s = j )

4.2. Ablation Experiment

To verify the influence of the improved substructure or training strategy, we carried out an ablation experiment. Based on YOLOv7-tiny, we introduced focal loss to improve the accuracy and used the EagleEye pruning method to speed up the detection. We tested the detection speed on the Jetson Nano B01.
As shown in Table 1, FL and prune represent the focal loss and the model pruning. When we introduced focal loss, the mAP increased by 1.3% and the AP of fullbasket increased by 2.8%. After model pruning, the detection speed was 63 ms/img on the embedded platform, which was 52.9% of the value of YOLOv7-tiny. Therefore, the proposed method had better performance in accuracy and detection speed.

4.3. Performances of Different Detection Algorithms

To evaluate the performance of the proposed method, we tested several detection algorithm methods, including Faster R-CNN, RetinaNet-Res50, YOLOv3-tiny, and YOLOv5s.
As shown in Table 2, the mAP of the proposed method was 89.8%, which was 8.2% and 6.9% higher than those of Faster-RCNN and RetinaNet-Res50, respectively. Moreover, Faster-RCNN and RetinaNet-Res50 were not suitable for embedded devices. YOLOv3-tiny was similar to YOLOv7-tiny in model size, but the mAP of the latter was 12.5% higher. The main reason was that YOLOv3-tiny had only two outputs of different sizes. YOLOv7-tiny had three outputs, which resulted in better performance in detecting small objects. Therefore, the proposed method had better performance in detection speed and accuracy.
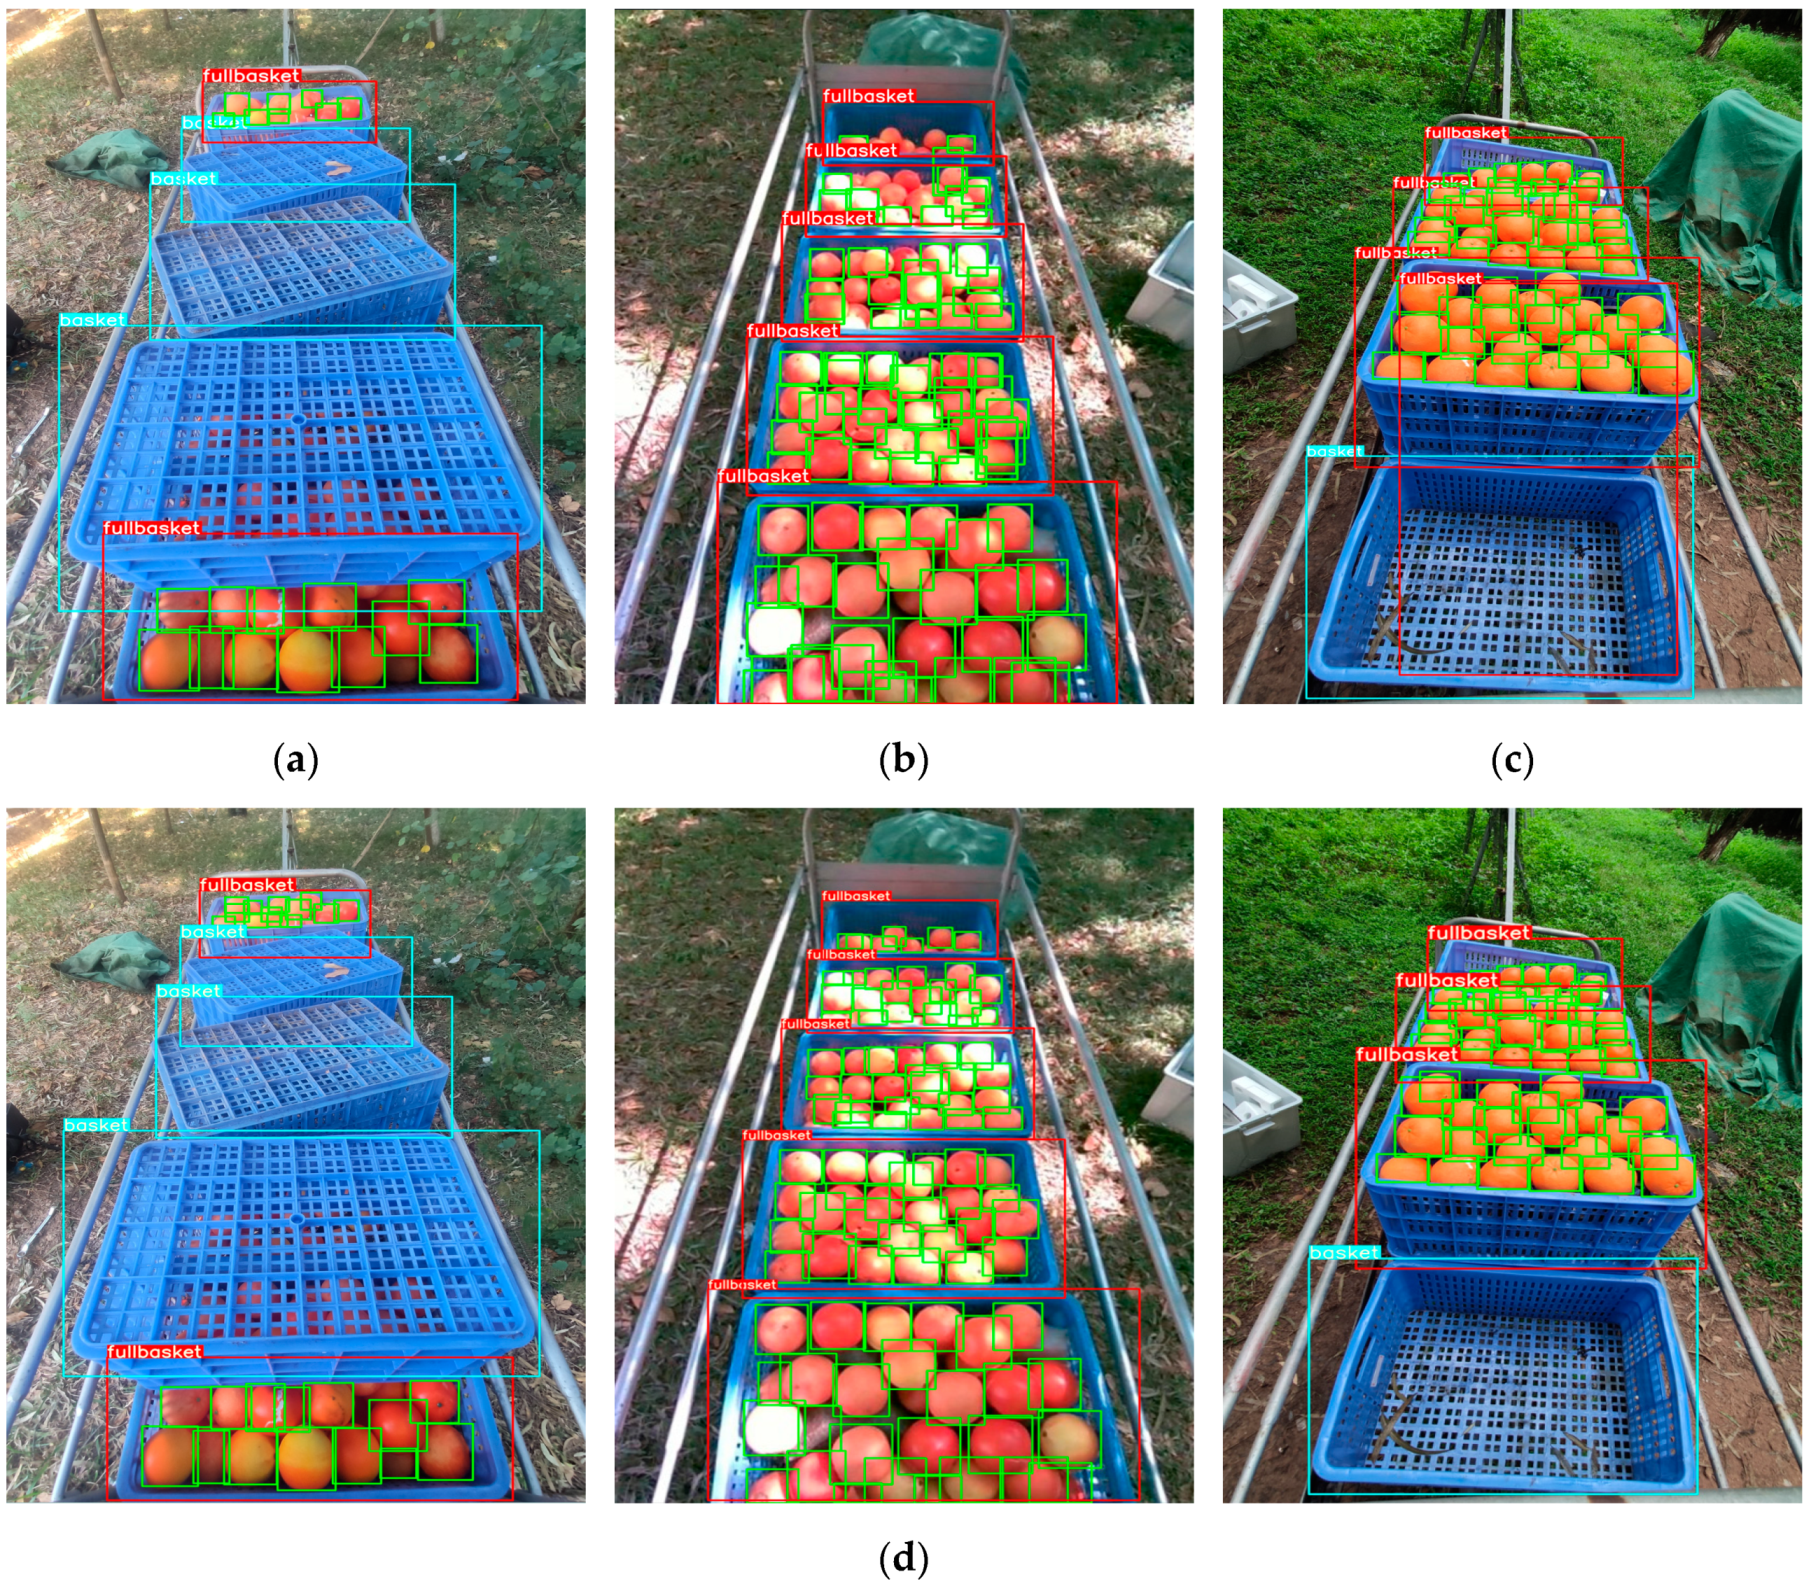
Figure 12 shows the detection results of the different models. When the YOLOv3-tiny model detected the small object “orange”, the detection would be missed, resulting in an error, which was consistent with the results in Table 2.

4.4. Performance of Height Measurement Model

According to the official parameters of the Intel RealSense D455 camera and the transportation case, the accuracy of the depth value would affect the accuracy of the height measurement, which influenced the determination of the number of layers where the cargo was carried. We conducted an experiment in an orchard environment with natural light changes, considering the influence and error of the depth value obtained by the depth camera. We used the standardized baskets and divided the experiments into two groups according to height: 274 and 536 mm. For each group, the horizontal distances (D) from the camera to the test point were 200, 500, 800, 1100, 1400, and 1800 mm, as shown in Figure 13.
As shown in Table 3, a gradual increase in error occurred in the height measurement model as the depth value increased, which was consistent with the trend in error as the distance changed. As shown in Figure 14, the height values in the two groups of experiments were distributed on both sides of the H 1 and H 2 values, but the bias in the height error calculated at the horizontal distances of 1100 and 1400 mm was high, which was caused by the abnormality of the loading platform. We regarded the values as anomalies. Therefore, the height error of the height measurement model was within 3 cm within a horizontal distance of <1.8 m, which met the requirements.

4.5. Experimental Results of Overall Method

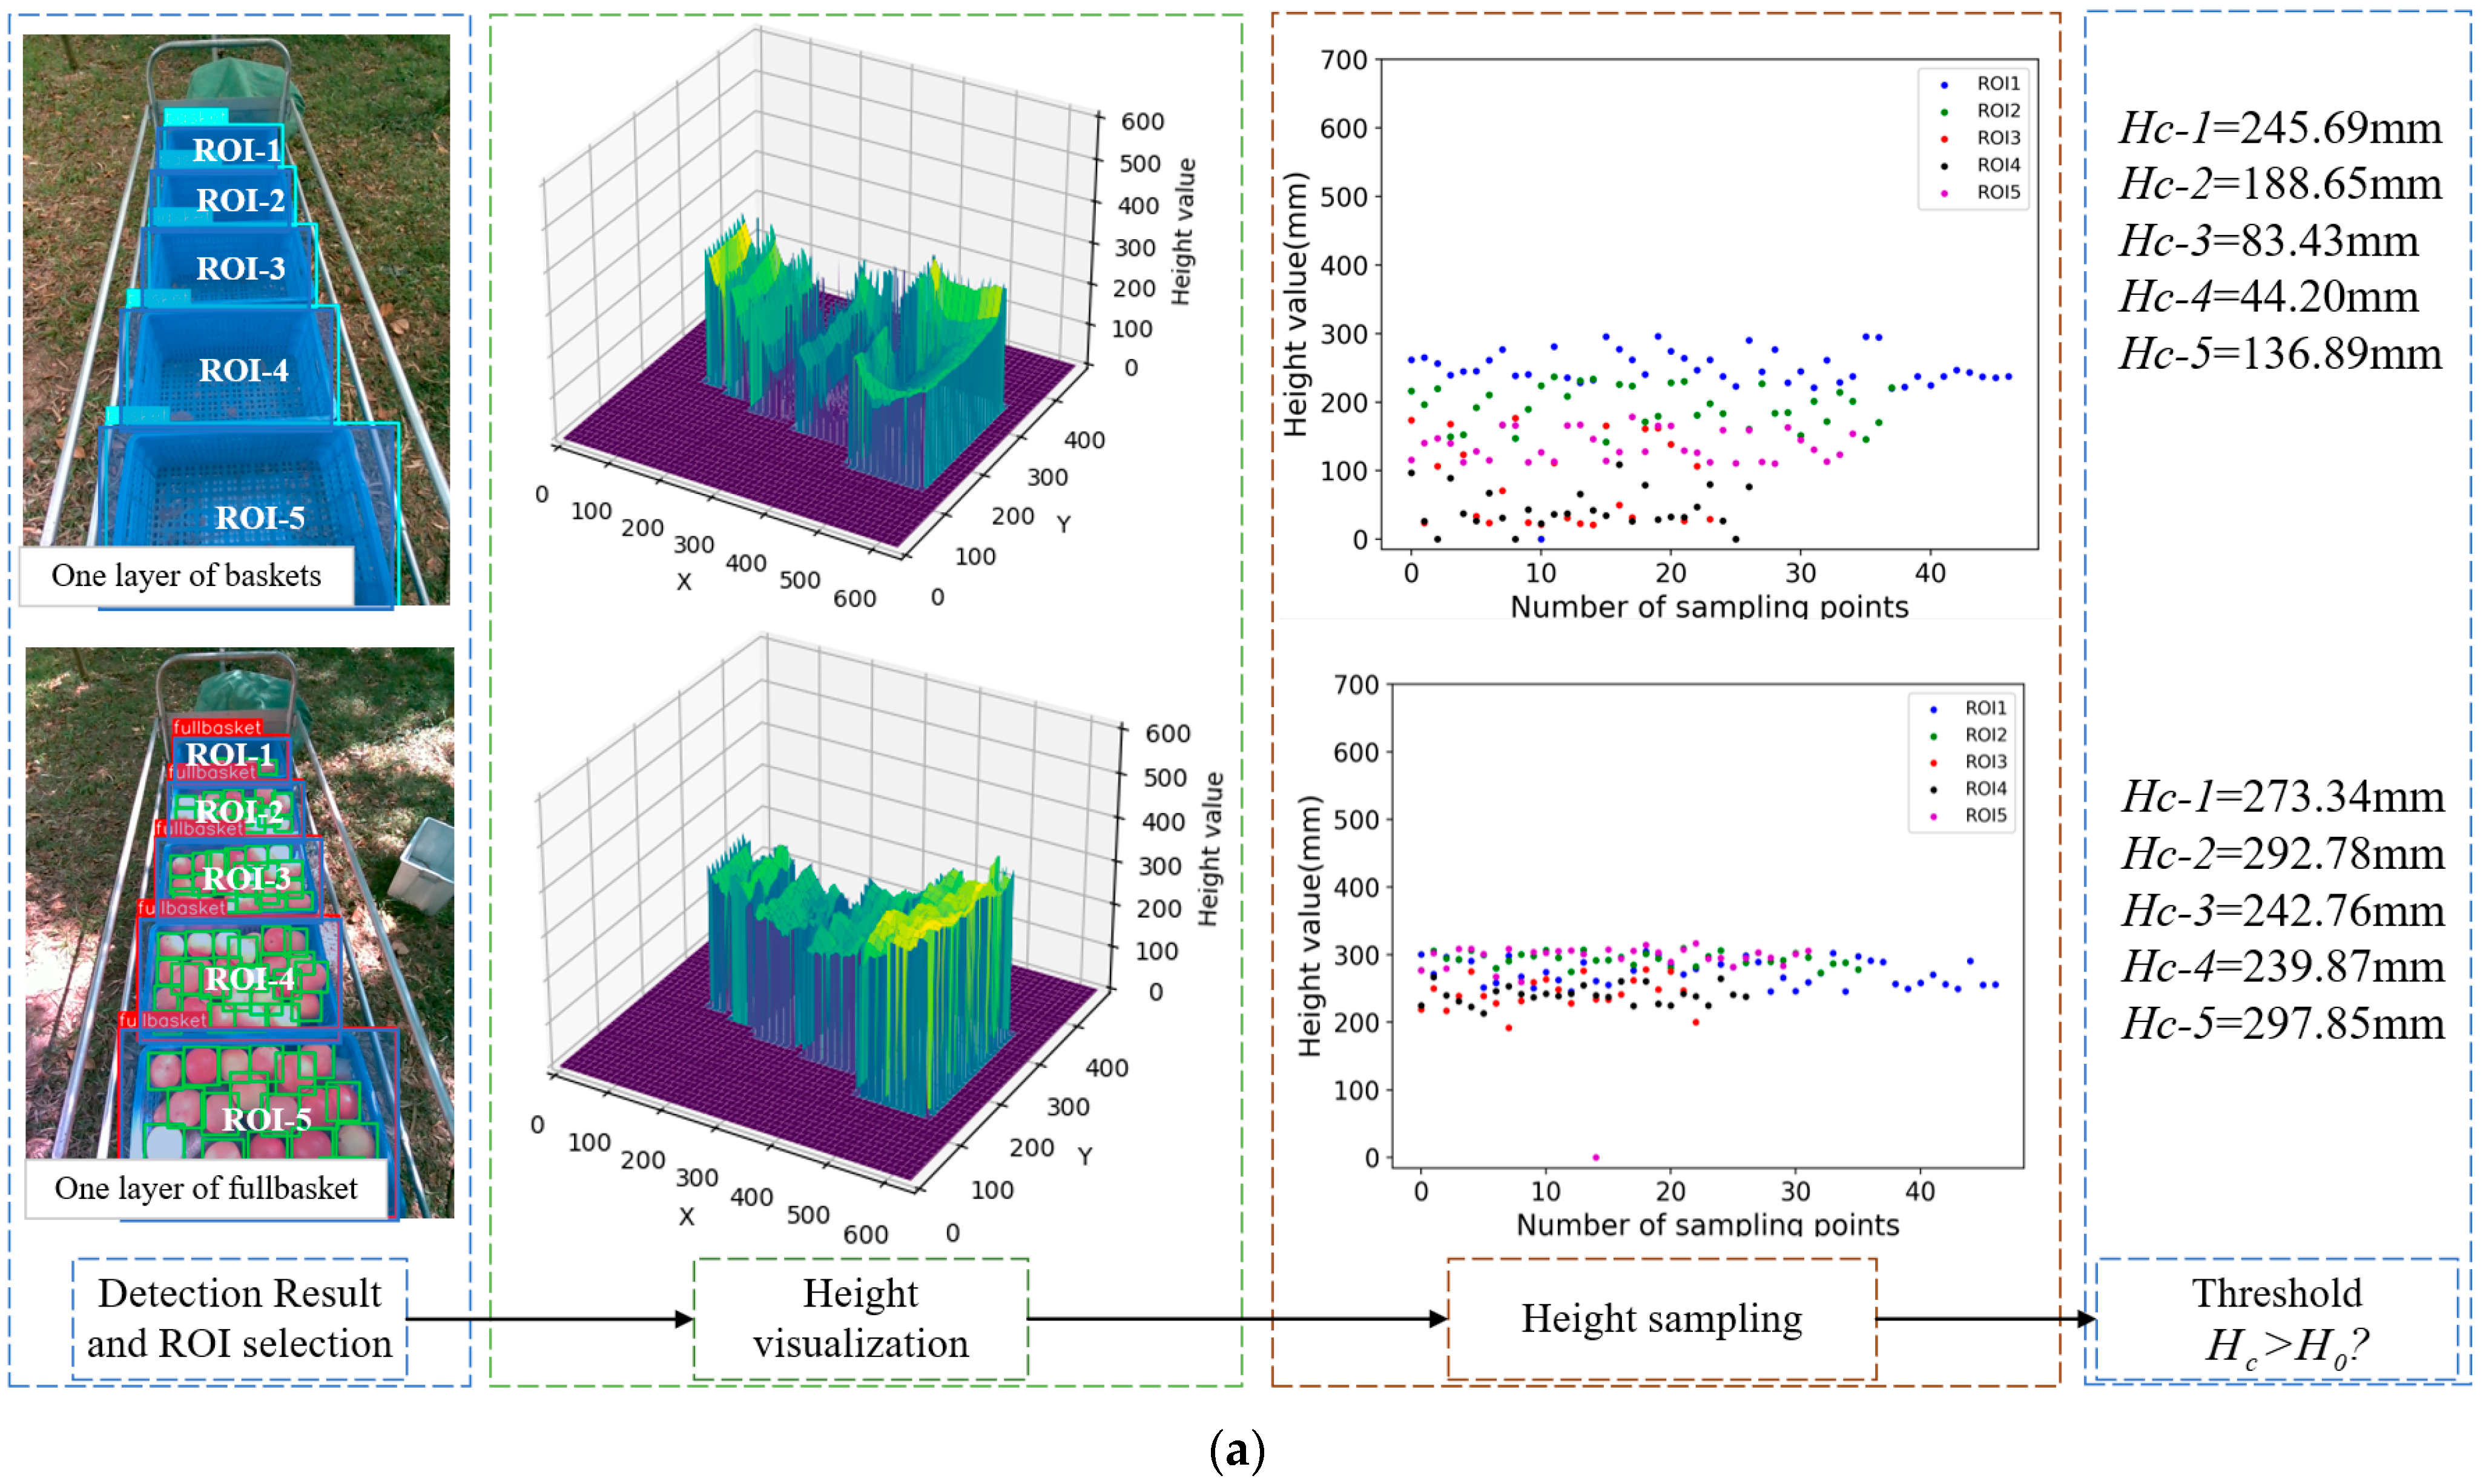
To evaluate the performance of the overall method, we tested the scenarios of transporters carrying one or two layers of baskets or full baskets. We used the height measurement model to calculate the height value of the ROI, as shown in Figure 15.
When the transporter carried a layer of full baskets, the height values in the ROI and the sampled points were less than 300 mm. When we summarized and averaged the height values in the ROI, the approximate height ( H c ) was less than the height threshold ( H 0 = 300   mm ). The analysis method inferred that the objects were in the first layer. Otherwise, when the transporter carried two layers of baskets or full baskets, H c > H 0 , and the objects were in the second layer. The total time for the overall method was 75 ms, with the object detection and height analysis taking 63 ms and 12 ms, respectively.
When the classification and the layer of the cargo were obtained, the cargo-carrying situation could be determined using video streaming detection. Specifically, the detection results were saved as the intermediate state if the first layer was filled with cargo. When the cargo was in the second layer, we could obtain the load volume using the intermediate state and the real-time detection result. When the cargo was not in the second layer, there was no obstruction between the cargo. The load volume could be obtained by analyzing the detection results of the image.
When we determined the cargo-carrying situation using the analysis system, we combined expert experience and the operating status of the transporter to propose optimal path planning and efficiently schedule the transporter.

5. Discussion

In recent years, researchers have realized the intelligent measurement of cargo using non-contact sensors, and the methods can be divided into three categories according to the types of sensers:
  • Methods using infrared, laser, and RFID sensors. Zhao et al. [33] used laser sensors to measure the geometric dimensions of mechanical parts. Mohammed [34] used RFID technology to locate cargo. Kong et al. [14] measured the cargo volumes of train carriages based on lidar. This method has a simple hardware structure and a low cost, but it cannot obtain the classification of the cargo.
  • Methods that use RGB images to obtain the classification and location. For example, Cong et al. [35] used an edge operator to position cargo for a vision robot application. Guan et al. [36] obtained an edge contour using the Canny operator. Jin et al. [12] used Faster-RCNN to detect overlapping cargo. Although the above methods can obtain the classification of cargo, it is difficult to obtain the height and volume.
  • Methods that use multi-sensor information fusion. Although the structures of sensors are different, the sensing data can be summarized as RGB and depth information. Pang et al. [37] realized the detection overrun of railway cargo using vision and lidar technology. Liu [38] obtained the classification and the spatial distance of an object using RGB-D data. Li et al. [39] used stereo vision technology to obtain classification and localization, and realized the dimension measurement of logistics materials.
In summary, it is necessary to obtain the RGB and depth information of cargo to classify and obtain load volumes. Lidar has high precision and a fast measurement speed, but it is difficult to use widely due to its high cost. RGB-D depth cameras, such as Intel RealSense cameras, are not only affordable but also obtain accurate depth data. Therefore, we chose a RealSense camera as a sensing device, which was used to obtain the classification and load volume.

6. Conclusions

In this study, we designed a cargo-carrying analysis system for mountain orchard transporters based on RGB-D data. We used an Intel RealSense D455 depth camera to capture RGB-D images of the trailer. Then, the RGB images were used to train the improved YOLOv7-tiny algorithm to classify and obtain 2D coordinate information. We fused the 2D coordinate information and the depth map to determine the ROI for height measurement. We used a height measurement model to calculate the sampled points in the ROI to determine the number of layers in which the cargo was carried. Our conclusions were as follows:
  • Compared to 3D data, 2D images are easily available and computationally efficient. In this study, we used a lightweight detection method to detect 2D images and produce the classification and localization. The 3D information was driven by 2D detection results to determine the load volume using fewer computing resources.
  • Focal loss and the EagleEye pruning method were used to improve YOLOv7-tiny, which allowed the model to converge more quickly and speed up detection. The mean average precision (mAP) of the proposed method was 89.8%, which was 8.2%, 6.9%, and 1.6% higher than those of Faster-RCNN, RetinaNet-Res50, and YOLOv5s, respectively. The model had 6.7 GFLOPs, and the detection speed was 63 ms/img on the embedded platform, a Jetson Nano.
  • The spatial-geometry-based height measurement model proposed in this paper had a height measurement error of less than 3 cm at a range of 1.8 m horizontally from the depth camera, which met the requirements for load analysis in mountain orchards.
  • The method determined the load volume when the transporter was carrying one or two layers of fruit baskets. The total time required by the method was 75 ms/img. The method provides technical support for achieving the accurate transport of cargo in mountain orchards and is valuable for rationally dispatching transport equipment and for operational safety.

Author Contributions

Conceptualization, Z.L. and Y.H.; methodology, Z.L. and Y.Z.; software, Y.Z., C.Z. and Y.G.; validation, Y.H., S.L. and C.Z.; formal analysis, Y.Z.; investigation, Z.L. and Y.Z.; resources, Y.Z. and J.C.; data curation, Y.Z.; writing—original draft preparation, Z.L. and Y.Z.; writing—review and editing, Z.L., Y.Z. and Y.H.; visualization, C.Z., Y.G., W.W. and J.C.; supervision, Z.L. and Y.H.; project administration, Z.L. and Y.H.; funding acquisition, Z.L., S.L. and Y.H. All authors have read and agreed to the published version of the manuscript.

Funding

This research was funded by the National Natural Science Foundation of China (31971797 and 32271997); the Subtopics of National Key R&D Program Projects (2020YFD1000107); the China Agriculture Research System of MOF and MARA (CARS-26); the General Program of the Guangdong Natural Science Foundation (2021A1515010923); and the Guangdong Provincial Strategy for Rural Revitalization (Yue Cai Nong [2021] No. 37).

Institutional Review Board Statement

Not applicable.

Informed Consent Statement

Not applicable.

Data Availability Statement

Not applicable.

Acknowledgments

The authors would like to thank the anonymous reviewers for their criticism and suggestions.

Conflicts of Interest

The authors declare no conflict of interest.

References

  1. Huang, H.; Huang, T.; Li, Z.; Lyu, S.; Hong, T. Design of Citrus Fruit Detection System Based on Mobile Platform and Edge Computer Device. Sensors 2021, 22, 59. [Google Scholar] [CrossRef] [PubMed]
  2. Sheng, L.; Song, S.; Hong, T.; Li, Z.; Dai, Q. The Present Situation and Development of Mountainous Orchard Mechanization in Guangdong Province. J. Agric. Mech. Res. 2017, 39, 257–262. [Google Scholar] [CrossRef]
  3. Li, Z.; Hong, T.; Sun, T.; Ou, Y.; Luo, Y. Design of battery powered monorail transporter for mountainous orchard. J. Northwest A F Univ. Nat. Sci. Ed. 2016, 44, 221–227. [Google Scholar]
  4. Li, Z.; Hong, T.; Lu, S.; Wu, W.; Liu, Y. Research Progress of Self-Propelled Electric Monorail Transporters in Mountainous Orchards. Mod. Agric. Equip. 2020, 41, 2–9. [Google Scholar]
  5. Liu, Y.; Hong, T.; Li, Z. Influence of Toothed Rail Parameters on Impact Vibration Meshing of Mountainous Self-Propelled Electric Monorail Transporter. Sensors 2020, 20, 5880. [Google Scholar] [CrossRef] [PubMed]
  6. Lu, S.; Wei, Z.; Wu, B.; Li, Z.; Hong, T. Development of on-orbit status sensing system for orchard monorail conveyer. Trans. Chin. Soc. Agric. Eng. 2020, 36, 56–64. [Google Scholar]
  7. Lu, S.; Liang, Y.; Li, Z.; Wang, J.; Wang, W. Orchard monorail conveyer location based on ultra high frequency RFID dual antennas and dual tags. Trans. Chin. Soc. Agric. Eng. 2018, 34, 71–79. [Google Scholar]
  8. Chuang, J.; Li, J.; Hong, T. Design and test of ultrasonic obstacle avoidance system for mountain orchard monorail conveyor. Trans. Chin. Soc. Agric. Eng. 2015, 31, 69–74. [Google Scholar]
  9. Chiaravalli, D.; Palli, G.; Monica, R.; Aleotti, J.; Rizzini, D.L. Integration of a Multi-Camera Vision System and Admittance Control for Robotic Industrial Depalletizing. In Proceedings of the 25th IEEE International Conference on Emerging Technologies and Factory Automation (ETFA), Vienna, Austria, 8–11 September 2020; pp. 667–674. [Google Scholar] [CrossRef]
  10. Zhang, Y.; Wang, Y.; Fu, H.; Shi, J.; Chen, N. Irregular cigarette parcel stacking system coupled with machine vision- based parcel identification. Tob. Sci. Technol. 2019, 52, 105–111. [Google Scholar]
  11. Yang, J.; Wu, S.; Gou, L.; Yu, H.; Lin, C.; Wang, J.; Wang, P.; Li, M.; Li, X. SCD: A Stacked Carton Dataset for Detection and Segmentation. Sensors 2022, 22, 3617. [Google Scholar] [CrossRef]
  12. Jin, Q.; Li, T. Object recognition method based on deep learning in storage environment. J. Beijing Inf. Sci. Technol. Univ. 2018, 33, 60–65. [Google Scholar] [CrossRef]
  13. Wang, C.; Yuan, Q.; Bai, H.; Li, H.; Zong, W. Lightweight object detection algorithm for warehouse goods. Laser Optoelectron. 2022, 59, 74–80. [Google Scholar]
  14. Kong, D.; Zhang, N.; Huang, Z.; Chen, X.; Shen, Y. Measurement method of volume of freight carriages based on laser radar detection technology. J. Yanshan Univ. 2019, 43, 160–168. [Google Scholar]
  15. Doliotis, P.; McMurrough, C.D.; Criswell, A.; Middleton, M.B.; Rajan, S.T. A 3D Perception-Based Robotic Manipulation System for Automated Truck Unloading. In Proceedings of the IEEE International Conference on Automation Science & Engineering, Fort Worth, TX, USA, 21–25 August 2016. [Google Scholar] [CrossRef]
  16. Shengkai, W. Carton Dataset Construction and Research of Its Vision Detection Algorithm. Ph.D. Thesis, Huazhong University of Science and Technology, Wuhan, China, 2021. [Google Scholar]
  17. Wang, C.; Bochkovskiy, A.; Liao, H.M. YOLOv7: Trainable bag-of-freebies sets new state-of-the-art for real-time object detectors. arXiv 2022, arXiv:2207.02696. [Google Scholar]
  18. Liu, X.; Zhang, B.; Liu, N. CAST-YOLO: An Improved YOLO Based on a Cross-Attention Strategy Transformer for Foggy Weather Adaptive Detection. Appl. Sci. 2023, 13, 1176. [Google Scholar] [CrossRef]
  19. Liu, S.; Qi, L.; Qin, H.; Shi, J.; Jia, J. Path Aggregation Network for Instance Segmentation. In Proceedings of the 2018, IEEE/CVF Conference on Computer Vision and Pattern Recognition (CVPR), Salt Lake City, UT, USA, 18–23 June 2018; pp. 8759–8768. [Google Scholar] [CrossRef]
  20. Redmon, J.; Farhadi, A. YOLOv3: An Incremental Improvement. arXiv 2018, arXiv:1804.02767. [Google Scholar]
  21. Wang, Y.; Li, D. Improved YOLO Framework Blood Cell Detection Algorithm. Comput. Eng. Appl. 2022, 58, 191–198. [Google Scholar]
  22. Lin, T.Y.; Goyal, P.; Girshick, R.; He, K.; Dollár, P. Focal Loss for Dense Object Detection. IEEE Trans. Pattern Anal. Mach. Intell. 2017, 99, 2999–3007. [Google Scholar]
  23. Liu, Z.; Li, J.; Shen, Z.; Huang, G.; Yan, S.; Zhang, C. Learning Efficient Convolutional Networks through Network Slimming. arXiv 2017, arXiv:1708.06519. [Google Scholar]
  24. Li, B.; Wu, B.; Su, J.; Wang, G. Eagleeye: Fast Sub-Net Evaluation for Efficient Neural Network Pruning. In Proceedings of the Computer Vision—ECCV 2020: 16th European Conference, Glasgow, UK, 23–28 August 2020; Proceedings, Part II 16. Springer: Berlin/Heidelberg, Germany, 2020; pp. 639–654. [Google Scholar]
  25. He, J.; Liu, X. Ground Obstacle Detection Technology Based on Fusion of RGB-D and Inertial Sensors. J. Comput.-Aided Des. Comput. Graph. 2022, 34, 254–263. [Google Scholar] [CrossRef]
  26. Kneip, L.; Scaramuzza, D.; Siegwart, R. A Novel Parametrization of the Perspective-Three-Point Problem for a Direct Computation of Absolute Camera Position and Orientation. In Proceedings of the CVPR 2011, Colorado Springs, CO, USA, 20–25 June 2011; pp. 2969–2976. [Google Scholar]
  27. Quan, L.; Lan, Z. Linear N-point camera pose determination. IEEE Trans. Pattern Anal. Mach. Intell. 1999, 21, 774–780. [Google Scholar] [CrossRef]
  28. Zhang, Z. Flexible Camera Calibration by Viewing a Plane from Unknown Orientations. In Proceedings of the 7th IEEE International Conference on Computer Vision (ICCV’99), Kerkyra, Greece, 20–27 September 1999; pp. 666–673. [Google Scholar]
  29. Xiang, X.; Song, X.; Zheng, Y.; Wang, H.; Fang, Z. Research on embedded face detection based on MobileNet-YOLO. J. Chin. Agric. Mech. 2022, 43, 124–130. [Google Scholar] [CrossRef]
  30. Hu, J.; Li, Z.; Huang, H.; Hong, T.; Jiang, S.; Zeng, J. Citrus psyllid detection based on improved YOLOv4-Tiny model. Trans. Chin. Soc. Agric. Eng. 2021, 37, 197–203. [Google Scholar]
  31. Lu, S.; Lu, S.; Li, Z.; Hong, T.; Xue, Y.; Wu, B. Orange recognition method using improved YOLOv3-LITE lightweight neural network. Trans. Chin. Soc. Agric. Eng. 2019, 35, 205–214. [Google Scholar]
  32. Farid, A.; Hussain, F.; Khan, K.; Shahzad, M.; Khan, U.; Mahmood, Z. A Fast and Accurate Real-Time Vehicle Detection Method Using Deep Learning for Unconstrained Environments. Appl. Sci. 2023, 13, 3059. [Google Scholar] [CrossRef]
  33. Zhao, Z.; Liu, W.; Liu, L. Geometric dimension measurement of parts based on laser sensor. Las. J. 2018, 39, 55–58. [Google Scholar] [CrossRef]
  34. Mohammed, A.M. Modelling and optimization of an RFID-based supply chain network Diss. Ph.D. Thesis, University of Portsmouth, Portsmouth, UK, 2018. [Google Scholar]
  35. Cong, K.; Han, J.; Chang, F. Goods contour detection and positioning by a vision robot. J. Shandong Univ. 2010, 40, 15–18. [Google Scholar]
  36. Guan, X.; Chen, L.; Lyu, Z. Visual Servo Technology Research of Industrial Palletizing Robot. Mach. Des. Res. 2018, 34, 54–56. [Google Scholar] [CrossRef]
  37. Pang, T.; He, J. Automatic detection system of railway out of gauge goods based on faster r-cnn. Autom. Instrum. 2021, 8, 72–76. [Google Scholar] [CrossRef]
  38. Liu, H. Research on Fast Object Detection and Ranging Algorithm Based on Improved YOLOv4 Model. Master’s Thesis, Zhengzhou University, Zhengzhou, China, 2021. [Google Scholar]
  39. Li, J.; Zhou, F.; Li, Z.; Li, X. Intelligent Geometry Size Measurement System for Logistics Industry. Comput. Sci. 2018, 45, 218–222. [Google Scholar]
Figure 1. Transportation situation.
Applsci 13 06059 g001
Figure 2. Overview of the system.
Applsci 13 06059 g002
Figure 3. Diagram of RGB-D camera installation.
Applsci 13 06059 g003
Figure 4. Custom RGB dataset. (a) Carrying one layer of fruit or baskets. (b) Carrying two layers of fruit or baskets.
Applsci 13 06059 g004
Figure 5. Structure of YOLOv7-tiny.
Applsci 13 06059 g005
Figure 6. Model pruning principle.
Applsci 13 06059 g006
Figure 7. The workflow of model pruning.
Applsci 13 06059 g007
Figure 8. Flowchart of classification and layer estimation.
Applsci 13 06059 g008
Figure 9. Spatial model of the camera and the loading platform.
Applsci 13 06059 g009
Figure 10. Height measurement of a single point in 3D space.
Applsci 13 06059 g010
Figure 11. Hardware design and deployment.
Applsci 13 06059 g011
Figure 12. Detection result visualization. (a) RetinaNet-Res50. (b) YOLOv3-tiny. (c) YOLOv5s. (d) The proposed method.
Applsci 13 06059 g012
Figure 13. Experimental scene of the height measurement model: (a) lateral view; (b) overhead view.
Applsci 13 06059 g013
Figure 14. Performance of height measurement model: (a) height value distribution; (b) height error distribution.
Applsci 13 06059 g014
Figure 15. Experimental results of overall method: (a) carrying one layer of fruit or baskets; (b) carrying two layers of fruit or baskets.
Applsci 13 06059 g015aApplsci 13 06059 g015b
Table 1. Experimental results of ablation experiment.
ModelAP%mAP%GFLOPsSpeed
(ms/img)
BasketOrangeFullbasket
YOLOv7-tiny97.576.592.788.913.2119
YOLOv7 + FL97.477.195.590.213.2119
YOLOv7 + FL + Prune97.277.195.189.86.763
Table 2. Experimental results of different algorithms.
ModelAP%mAP%Size
(MB)
GFLOPs
BasketOrangeFullbasket
Faster-RCNN88.972.483.781.6165.8-
RetinaNet-Res5090.772.884.382.9145.8156
YOLOv3-tiny95.044.689.676.417.412.9
YOLOv5s96.477.191.388.214.416.4
YOLOv7-tiny97.576.592.788.912.313.2
Proposed Method97.277.195.189.86.36.7
Table 3. Results of height measurement model.
HeightGroup 1 (H1 = 274 mm)Group 2 (H2 = 536 mm)
Horizontal Distance (mm)200500800110014001800200500800110014001800
Depth value (mm)6918911065116913791472558692850101811671349
Height value (mm)276.5276.7278.6292.3320.2289.7534.6528.5556.3580.1599.2552.3
Height error (mm)2.52.74.618.346.215.71.47.520.328.663.216.3
Disclaimer/Publisher’s Note: The statements, opinions and data contained in all publications are solely those of the individual author(s) and contributor(s) and not of MDPI and/or the editor(s). MDPI and/or the editor(s) disclaim responsibility for any injury to people or property resulting from any ideas, methods, instructions or products referred to in the content.