Article

Olive Leaf Extract of Olea europaea Reduces Blood Glucose Level through Inhibition of AS160 in Diabetic Rats

by
Abd Al-Rahman Al-Shudiefat
1,*,†,
Hadeel Alturk
1,†,
Hamzeh J. Al-Ameer
2,3,4,
Malek Zihlif
2 and
Maha Alenazy
5
1
Department of Medical Laboratory Sciences, Faculty of Applied Medical Sciences, The Hashemite University, Zarqa 13133, Jordan
2
Department of Pharmacology, Faculty of Medicine, The University of Jordan, Amman 11942, Jordan
3
Department of Biology and Biotechnology, Faculty of Science, American University of Madaba, Madaba 11821, Jordan
4
Department of Biological Sciences, Faculty of Science, Yarmouk University, Irbid 21163, Jordan
5
Department of Physiology, College of Medicine, King Saud University, Riyadh 4545, Saudi Arabia
*
Author to whom correspondence should be addressed.
These authors contributed equally to this work.
Appl. Sci. 2023, 13(10), 5939; https://doi.org/10.3390/app13105939
Submission received: 11 April 2023 / Revised: 28 April 2023 / Accepted: 1 May 2023 / Published: 11 May 2023

Abstract

:

Featured Application

Olive leaf extract could be a natural good alternative to the drug metformin for the management of blood glucose in diabetic patients, with few side effects.

Abstract

Introduction: It has been shown that olive leaf extract exerts (OLE) a positive effect on lipid and blood glucose levels; however, the mechanism remains poorly understood. This study aimed to examine the mechanism behind this effect by evaluating the proteins related to glucose metabolism, including glucose transporter 4 (Glut4), Akt Substrate of 160 kDa (AS160), and adenosine monophosphate-activated protein kinase (AMPK α2). Methods: Eighty-four male Sprague–Dawley rats were divided into three major groups: group one (control); group two, which was treated with OLE or metformin (Met.) before streptozotocin (STZ) injection; and group three, which was treated with OLE or Met. after STZ injection. The body weights, fasting blood sugar, postprandial sugar levels, insulin levels, and lipid profile were assessed. Western blot was used to measure the Glut4, AS160, and AMPKα 2 levels. Results: Treatments with (1% and 3% OLE) significantly decreased the glucose level, AS160 expression level, and STZ toxicity; additionally, insulin levels were maintained within the normal range and similar to Met. treatment. Conclusions: These findings indicated that OLE exerted antihyperglycemic effects via AS160 inhibition and it could be used as an alternative to Met. treatment. Further studies on the long-term effects of OLE on diabetes are warranted.

1. Introduction

Presently, diabetes mellitus (DM) is one of the most widely spread diseases [1]. It is a chronic metabolic disorder that results from elevated levels of blood glucose and may be inherited or caused by other lifestyle factors [1]. It is characterized by a defect in the beta cells of the pancreas; consequently, the pancreas either does not produce sufficient amounts of insulin, the utilization of insulin is impaired, or both [1].
In 2019, according to the World Health Organization (WHO) [2], approximately 422 million people worldwide were estimated to have diabetes, and approximately 1.6 million people died of this condition each year. By 2045, this figure is estimated to reach 629 million people globally [3]. Recent studies conducted among different population groups reported prevalence rates of up to 20% in the United Arab Emirates, 16% in Qatar, 24% in Saudi Arabia, and 8% in Oman [4]. According to the WHO, the number of people suffering from diabetes in Jordan was 195,000 in 2000, and this number is predicted to increase to 680,000 in 2030 [4].
DM can be classified as type 1 diabetes (T1D), which is characterized by autoimmune damage of the beta cells in the pancreas. Autoimmune destruction usually occurs via autoantibodies mediated by T cells against beta-cell antigens, leading to a decrease in the level of insulin production [1]. The frequency of T1D is reported to range from 5% to 10% of all cases of diabetes [5]. Some environmental factors such as toxins, viral infection, and dietary components can stimulate an autoimmune reaction against beta cells in individuals who are genetically susceptible to T1D. Patients with T1D require exogenous insulin to manage the disease.
Type 2 diabetes (T2D) is the result of insulin resistance and impaired beta cell function, which accounts for approximately 90% of all diabetes cases [1,5,6]. In the case of insulin resistance, muscles, fat, and liver cells do not respond properly to insulin, resulting in the accumulation of glucose in the bloodstream and a decrease in the amount of glucose entering the cells. This leads to an increase in the production of insulin from the beta cells in the pancreas to compensate for the decreased levels of glucose in the cells [5,7]. The suggested reasons for insulin resistance include insulin receptor mutation, excess weight, physical inactivity, older age, and smoking [5,8]. Insulin resistance causes alterations in glucose levels from normal to low (impaired beta cells function) or high (insulin resistance) in patients suffering from T2D. T2D typically occurs in obese individuals and those with a family history of diabetes [5,9].
Although lifestyle and diet modifications are the basis for the treatment and management of diabetes, most patients will require pharmacotherapy, such as biguanides, sulfonylureas, metformin, and thiazolidinediones. Patients with both types of diabetes suffer from polyuria, thirst, blurred vision, and general fatigue [10].
Nevertheless, the use of diabetes medications is usually accompanied by different side effects, including gastrointestinal anomalies, weight gain, hypoglycemia, edema, anemia, and congestive heart failure [11,12]. Therefore, it is necessary to look for alternative medications with fewer or no side effects.
Complementary and alternative medicine approaches that include herbs may prove to be promising. Several medicinal herbs have been used in traditional medicine for many years to improve or prevent diabetes. Bitter melon, aloe vera [9], ginseng [10], fenugreek [12], and fig leaf [11] are some of the commonly used herbs to manage diabetes.
Several studies have shown that Olea europaea leaf extract is involved in multiple biological activities, such as the reduction of free radicals during tissue injury, normalization of the lipid profile, increase in immune function, lowering of the blood glucose level and blood pressure, decrease in arrhythmia, and prevention of intestinal muscle spasms, antioxidant and antimicrobial effects [13,14,15,16]. These important bioactivities could be attributed to its bioactive components, which include oleuropein, hydroxytyrosol, tyrosol, tocopherol, elenolic acid derivatives, caffeic acid, polyphenols (verbascoside, apigenin-7-glucoside, and luteolin-7-glucoside), and flavonoids (rutin and diosmin) [13,14,15].
There are no detailed studies on the efficiency of olive leaf extract (OLE) in managing and treating diabetes; additionally, the role of OLE in modulating the metabolic markers associated with insulin resistance and diabetes is poorly understood. Therefore, the objective of this study was to investigate and confirm the possible antihyperglycemic effects of Olea europaea leaf extract on streptozotocin (STZ)-induced diabetic rats. Additionally, the possible mechanism/(s) by which the leaf extracts attenuate or prevent diabetes were evaluated. The rats were rendered diabetic by a single intraperitoneal injection of STZ, which is a chemical agent that can damage the beta cells in the pancreas [17]. Subsequently, insulin sensitivity was restored using different concentrations of Olea europaea leaf extract, and the effects were compared with those after treatment with metformin, which is a drug used to manage diabetes by suppressing glucose production in the liver [17].
We hypothesized that OLE reduces glucose and lipid levels through cell signals and glucose metabolism-related molecules, such as glucose transporter 4 (glut4), 160 kDa Akt substrate (AS160) and adenosine monophosphate (AMP) protein kinase (AMPK)2. Both AS160 and AMPK2 participate in the transfer of the glucose transporter [18,19,20]. AMPK is an enzyme that plays an important role in cell energy homeostasis. It is activated by AMPK kinase by the phosphorylation of Thr172 in the alpha subunit. The activation of AMPK catalytic activity accelerates the ATP-generating catabolic pathways, including glycolysis, and suppresses the anabolic pathways, including cholesterol synthesis, while consuming ATP [21]. In addition, activation of AMPK improves glucose absorption by regulating GLUT4 translocation to cell membranes and genetic expression [22,23,24]. Previous studies have shown that homocysteine sulfinic acid and curcumin have an antidiabetic effect that can improve glucose absorption through the AMPK pathway [25,26]. 6-gingerol stimulates glucose uptake and GLUT4 translocation in L6 myotube cells [27]. An in vitro study showed that the activation of AMPK is associated with 6-gingerol-mediated glucose uptake [28].

2. Materials and Methods

2.1. Animals

Eighty-four male Sprague–Dawley rats were purchased from Jordan University of Science and Technology and treated according to a protocol approved by the Institute Review Board at The Hashemite University in Jordan. The animals were acclimatized for a week before the commencement of the experiment and maintained under controlled temperature (22 ± 2 °C) with a constant 12 h light/dark cycle. All animals were allowed free access to food and water. The average body weight of the animals was 200 ± 20 g, which is consistent with previous similar studies [29,30,31,32,33]. The rats were fed, treated, and sacrificed after being anesthetized intra-peritoneally with a mixture of 9:1 ketamine (90 mg/kg) to xylazine (10 mg/kg) in the animal house at the Faculty of Medicine, University of Jordan. The measurements and analysis of different parameters (The body weights, fasting blood sugar, postprandial sugar levels, insulin levels, lipid profile, and Western blot) were performed in the research laboratory at The Hashemite University.

2.2. OLE

The OLE purchased from Nature’s Care Manufacture (Sydney; Australia; www.healthycare.com.au, accessed on 22 April 2022) consisted of water and glycerin (no alcohol or sugar was added). Every 5 mL of OLE contained Olea europaea leaf extract equivalent to 5 g of dry leaf and 22 mg of oleuropein. A reverse phase High-performance liquid chromatography (HPLC) method was conducted to analyze the concentration of Oleuropein [34], HP 1100 HPLC-UV with an MZ Perfect Aqua C18 column (50 × 2.1 mm, 5 µm particle size + precolumn 10 × 2.1 mm). Oleuropein was analyzed from the Olea europaea leaf extract (OLE) to detect the validity of the OLE. An 80% (v/v) of Acetonitrile: water solution was used as a solvent and 10 mg of OLE was dissolved in 1 mL of the solvent. The resultant mixture was filtered through a 0.45 µm membrane filter into 2 mL HPLC vials before injecting it into the HPLC device. The mobile phase used was 20% (v/v) of Acetonitrile: water [34].

2.3. Protocol

After 1 week of acclimatization, the animals were divided into three major groups (n = 28 each) as follows: group 1 (control; G1), which did not receive STZ injection; group 2, which received treatments with OLE and Metformin (Met.) 2 weeks before STZ injection and for 3 weeks after the injection (G2); group 3, which received treatments with OLE and Met. 1 week after STZ injection for 2 weeks (G3). Two forms of olive leaf extracts, water or alcohol based, can be used medically [35,36]. All the animals in the present study received a dose of 1 mL (1%, 3% v/v) of OLE and 100 mg/kg of Met. daily via oral gavage. At the beginning of the third week, 56 rats from groups 2 and 3 were injected with a single intraperitoneal dose of STZ (AppliChem GmbH in Darmstadt, Germany) at a concentration of 35 mg/kg body weight, as described previously [37]. The rats in group 1 were injected with 0.1 M of citrate buffer only, which was used to dissolve the STZ.
As shown in Table 1, the rats in the three groups were further divided into four subgroups (n = 7 rats each) based on the treatment received: distilled water (D.W); 1% OLE; 3% OLE; and Met. (100 mg/kg).

2.4. Biochemical Tests

2.4.1. Measurement of Fasting Blood Sugar (FBS) and Postprandial Sugar (PPS) Levels

The glucose level was measured every day after 8 h of fasting to diagnose diabetes [38]. The postprandial sugar level was determined 2 h after eating to determine glucose tolerance in their bodies. A glucose meter (Prodigy, Prodigy Diabetes Care Inc., London, UK) was used to measure the glucose concentration in one drop of tail blood from each rat in all the groups.

2.4.2. Measurement of Serum Insulin Level

The rats in G2 and G3, which received STZ, were tested for T1D during the third week by measuring the glucose level, observing the symptoms of polydipsia and polyuria, and checking the insulin level using a commercially available kit (sandwich enzyme-linked immunosorbent assay kit; Abcam Plc, Cambridge, UK). The insulin levels in rats belonging to G1 were measured.
Blood was collected from the rats before (at the beginning of the third week) and after (at the end of the third week) STZ injection to measure the insulin levels in all groups. The rats were anesthetized with ether, following which 5 mL of whole blood was collected from the retro-orbital capillary vessels (before and after STZ injection). The blood was centrifuged at 3000 rpm for 5 min to obtain the serum, which was then stored at −20 °C for future analysis.

2.4.3. Serum Lipid Profile

The lipid concentration was measured and analyzed using Humalyzer 3500 and kits from human diagnostic worldwide (Germany) according to the manufacturer’s instructions. Blood serum samples were used to measure the total cholesterol (T.Ch.), HDL, and triglyceride (T.G) levels, which were expressed as mg/dL. Subsequently, the low-density lipoprotein–concentration (LDL-C) was calculated from the concentrations of T.Ch., HDL, and T.G using the Friedwald equation as follows [39]:
Low Density Lipoprotein Concentration = Total Cholesterol. − High Density Lipoprotein − (Triglyceride/5)

2.5. Muscle Biopsies

At the end of the experiment, two soleus muscles were obtained from each rat and stored at −80 °C for analysis. This muscle was used because of its rich microvasculature and susceptibility to the pathophysiological effects of T1D [40,41].

2.6. Western Blot Analysis

The soleus muscle (0.4 g) was homogenized in 1 mL of cold lysis buffer (0.01 mL of 1 M Tris pH 7.5, 0.02 mL of 0.1 M EGTA, 0.01 mL of 1 M DTT, 0.2 mL of 10% SDS, 0.01 mL of NaF, and 0.05 mL deionized water) for 5 s using a homogenizer, and the concentrations of the proteins were estimated using the filter paper assay [42]. Briefly, grids (1.5 cm × 1.5 cm) were drawn on circular Whatman filter papers. Protein standards (1–5 µg/mL egg albumin) and protein samples (volume, 1 µL) were applied to the center of each square of the grid and air dried. The filter paper was rinsed in methanol for 20 s and air dried. The samples were stained in Coomassie blue (0.5% Coomassie blue G, 7% acetic acid) for 10 min, destained in 7% acetic acid until the background was evenly pale with no spots, and air dried. The squares were cut and each one was placed in a 1.5 mL centrifuge tube; 1 mL of extraction buffer (66% methanol, 33% water, and 1% ammonium hydroxide) was added to each tube, and vortexed on a rack for 1 min. Then, 300 µL of each sample was added to a well in a 96-well plate and read at an absorbance of 600–405 nm using a microplate reader.
Subsequently, the cell lysates were heated at 95 °C for 5 min and solubilized with 4× sample preparation buffer (glycerol, 2-mercaptoethanol [Sigma, St. Louis, MO, USA], 10% SDS, and 0.5 M Tris/HCL; pH 6.8). The proteins were separated by SDS-PAGE using either 7% or 10% polyacrylamide gels, according to the molecular weights of the proteins, and transferred to a nitrocellulose membrane for 2 h at 200 mA.
The membranes were blocked for 1 h with Tris-buffered saline (TBS; pH 7.5) containing 1% bovine serum albumin (BSA) and incubated overnight at 4 °C with the following specific primary antibodies: AMPK α2 (dilution, 1:500; rabbit polyclonal antibody; Abcam), AS160 (dilution, 1:100; goat polyclonal antibody; Santa Cruz Biotechnology), and Glut 4 (dilution, 1:500; rabbit polyclonal antibody; Abcam). The antibodies were diluted in 1% BSA in TBS-tween20 (TBST). To verify the increase or decrease in protein expression, the GAPDH antibody (dilution, 1:500; purified mouse monoclonal antibody; R&D systems, Minneapolis, MN, USA) was used as a control. The membranes were incubated overnight at 4 °C with continuous shaking, washed thrice with TBST for 1 h, and incubated with horseradish peroxidase-conjugated antirabbit/goat secondary antibody (1:4000 in 1% BSA in TBST) for 1 h at 25 °C. Finally, the membranes were washed three times for 1 h with TBST and subjected to Western blotting using a Pierce ECL substrate (Thermo Scientific, Waltham, MA, USA). The bands were visualized using X-ray films (AGFA) or 3,3,5,5 tetramethylbenzene (Sigma, USA), and quantified using image analysis software (Quantity One, Bio-Rad Laboratories).

2.7. Statistical Analysis

Differences between groups were considered significant at a p-value of <0.05. Standard deviation was used to express variations in the data compared with the mean values. The groups were compared using the one-way analysis of variance test (ANOVA) followed by Bonferroni’s test. All statistical analyses were performed using the Graph Pad Instant program (Sacramento, CA, USA).

3. Results

3.1. Body Weight

The body weights of all the rats in the various groups ranged from 180 to 220 g and were not significantly different at the beginning of the experiment. A significant increase (p < 0.05) in weight was observed in the 1% OLE subgroup in G1 when compared with the 1% OLE and 3% OLE subgroups in G3. Similarly, a significant increase (p < 0.05) was observed in the 3% OLE G1 subgroup compared with the 3% OLE G3 subgroup (Table 2). There was a significant increase (p < 0.05) in body weight changes in all subgroups of G1 (D.W, 1% OLE, 3% OLE, Met.) compared with 1% OLE G3 as seen in Table 2.

3.2. Effects of Various Treatments (1% OLE, 3% OLE, and Met.) on Glucose Levels

The blood glucose concentration was measured daily throughout all 5 weeks to assess the effects of various treatments on the FBS and PPS levels in all the groups. In the fifth week, significant increases (p < 0.05) in both FBS and PPS were observed in D.W G2 and the D.W and 1% OLE subgroups from G3 when compared with those in G1; the values in the other subgroups from G2 (1% OLE, 3% OLE, and Met.) and subgroups (3% OLE and Met.) of G3 were comparable with those from G1 (Figure 1).

3.3. STZ Induces T1D

3.3.1. Protective Effect of OLE and Met. against STZ Toxicity in the Beta Cells

In week 3, the rats in G2 and G3 were injected with STZ. A significant decrease in the development of diabetes (p < 0.05) was observed in G2 compared with G3 (Table 3).

3.3.2. Effect of STZ on Insulin Levels

The insulin levels were similar among the groups of rats on week 3 before the STZ injection was provided to the G2 rats. After STZ treatment, the levels in most of the subgroups in G2 and G3 were significantly decreased (p < 0.05) when compared with those in G1 (Figure 2). However, the levels in the 1% OLE and 3% OLE subgroups in G2 were not significantly different from those in the 3% OLE and Met. subgroups in G1. Furthermore, the insulin levels in the 1% OLE and 3% OLE subgroups from G2 were significantly higher (p < 0.05) than those in the D.W and Met. subgroups in the same group. Similarly, significant increases (p < 0.05) in insulin levels were observed in the 1% OLE and 3% OLE subgroups in G2 when compared with all untreated subgroups in G3 (Figure 2).

3.4. Effects of Various Treatments on the Lipid Profile Levels

Figure 3 and Figure 4 show the serum T.Ch., T.G, HDL, and LDL levels in the rats in all groups, which were measured at the end of the experimental period (after week 5). No significant differences in cholesterol levels were observed between the groups (Figure 3A). A significant increase (p < 0.05) in the triglyceride level was observed in the 1% OLE G1 subgroup compared with the 1% OLE G3 subgroup (Figure 3B). No significant differences in HDL levels were noted among the groups (Figure 4A). Nevertheless, a significant increase in the LDL level (p < 0.05) was observed in the 1% OLE G3 subgroup compared with all the subgroups in G1; similarly, a significant increase in LDL was noted in the 3% OLE G3 subgroup compared with the 3% OLE and Met. subgroups in G1 (Figure 4B).

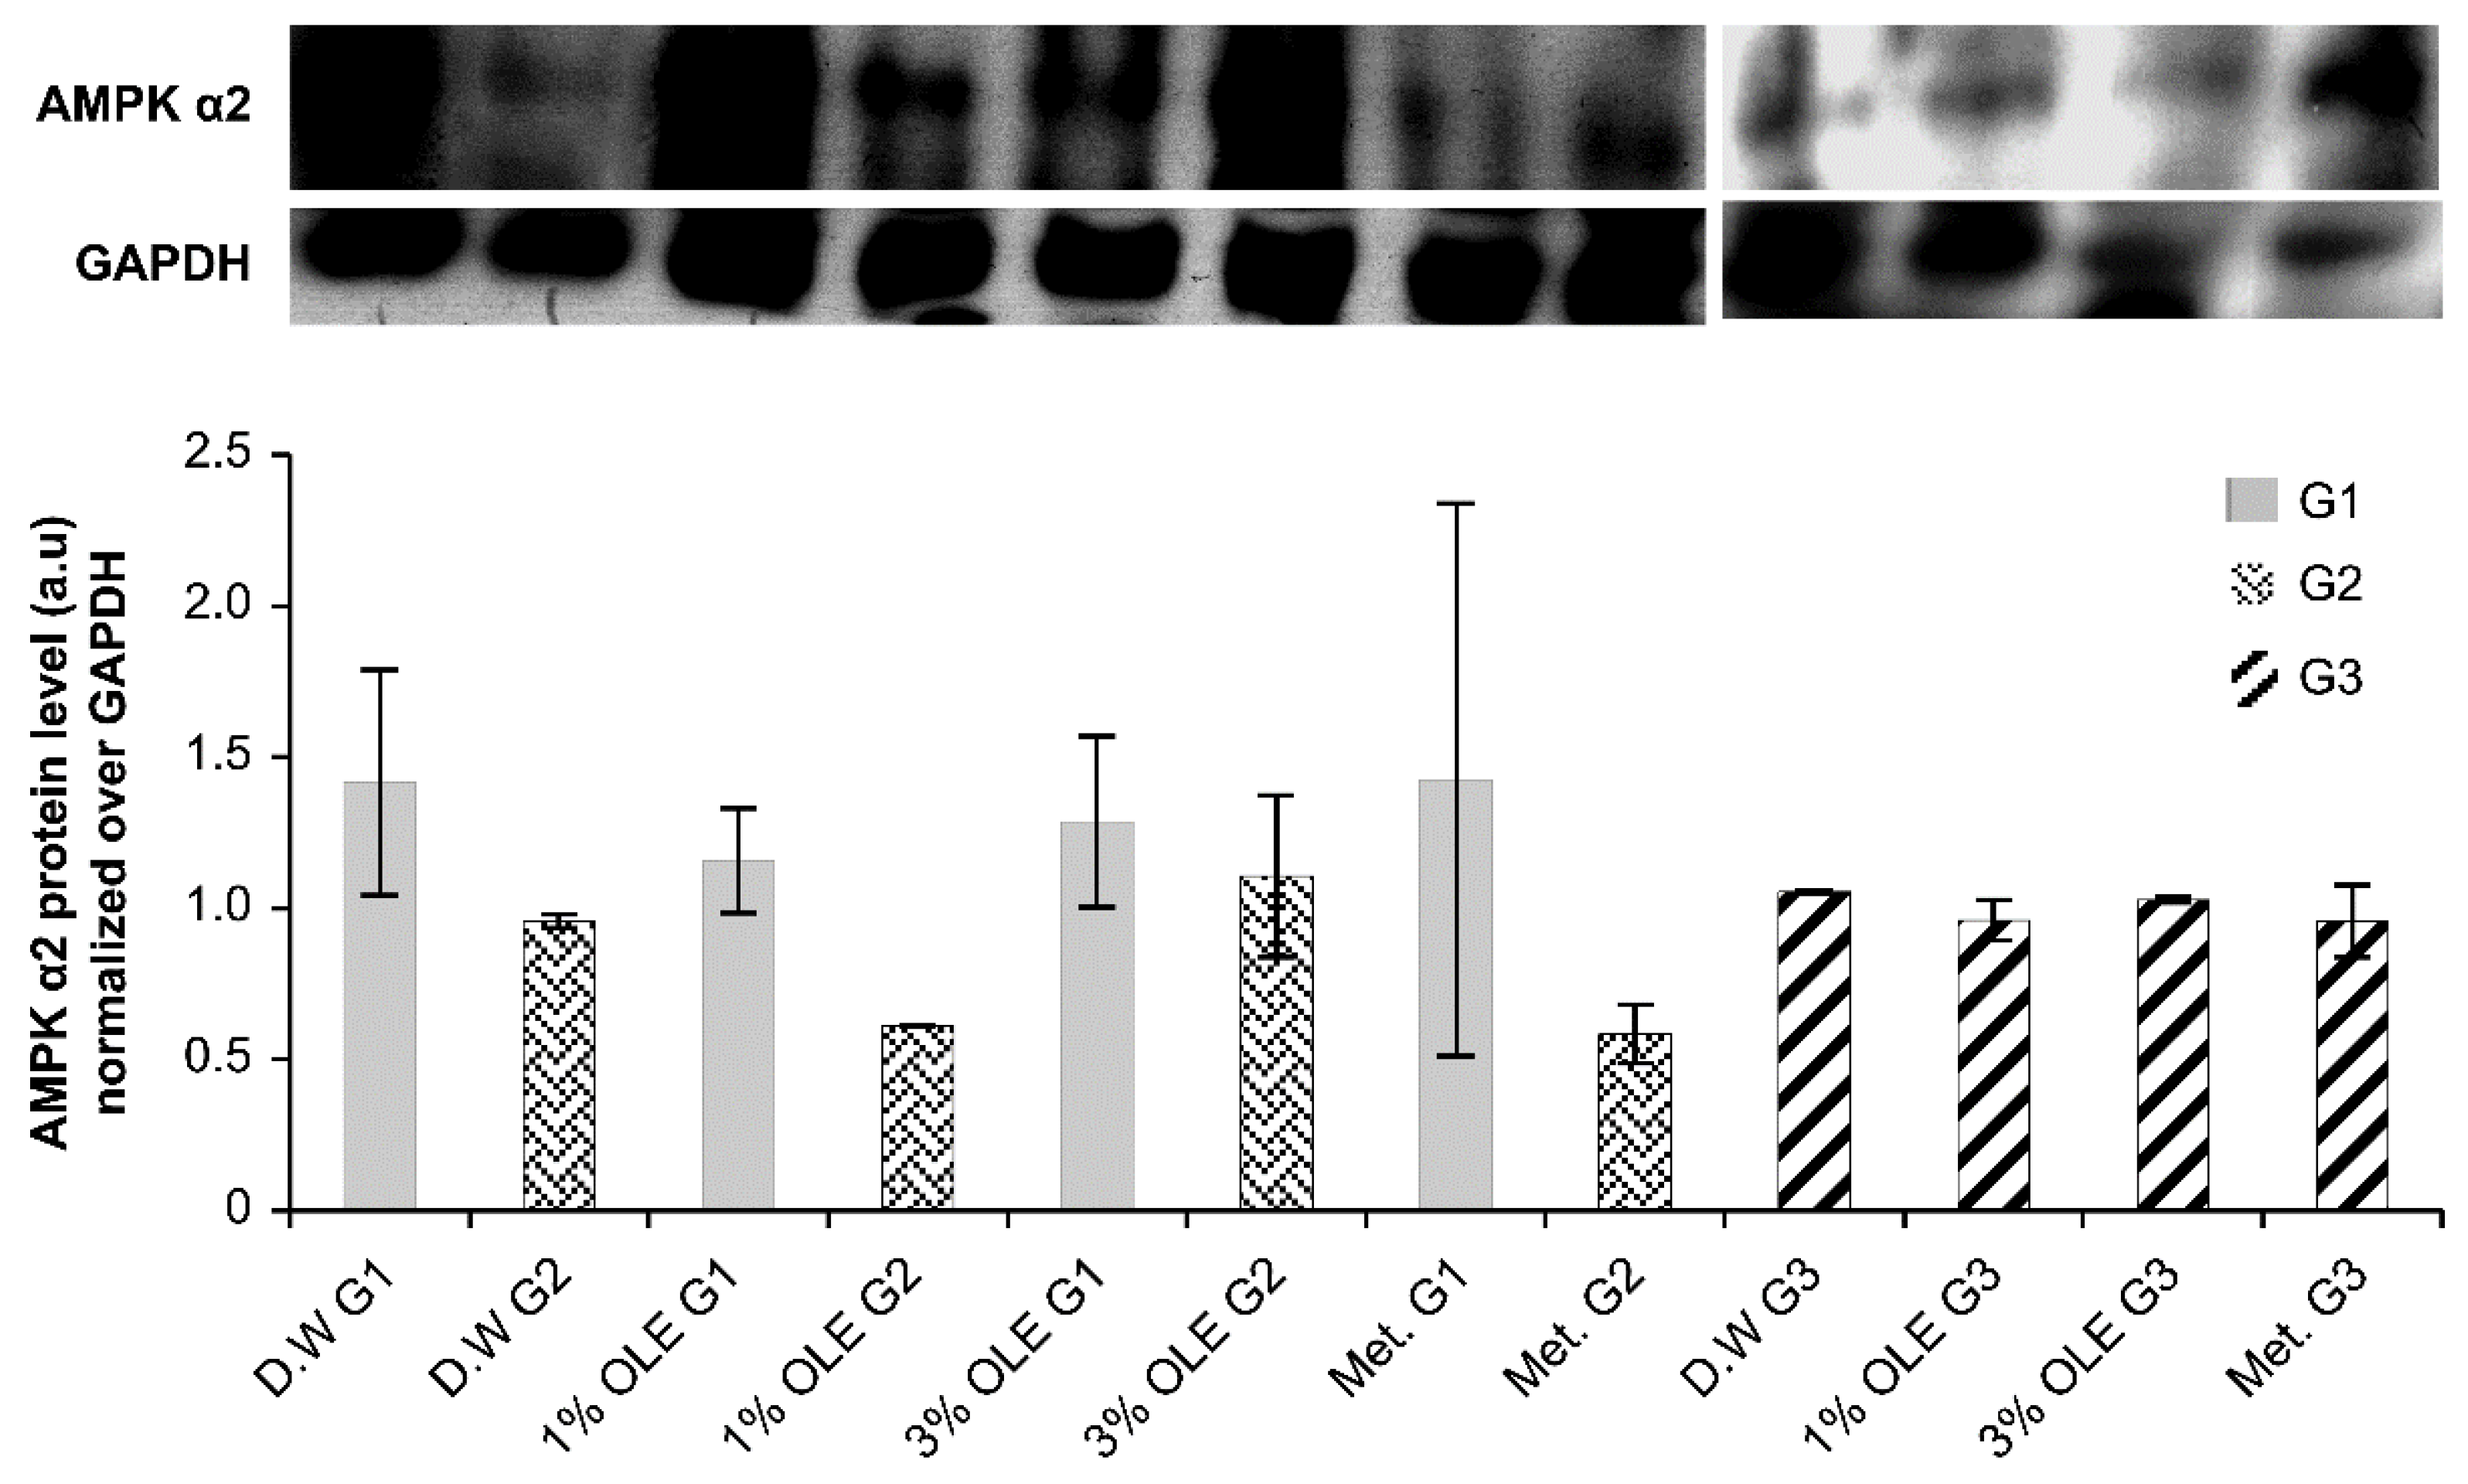
3.5. AMPK α2 Expression

The results of AMPK α2 expression revealed no significant differences in the AMPK α2 expression levels among all the groups (Figure 5).

3.6. AS160 Expression

The expression levels of AS160 were not comparable among all groups at the end of the experiments (5 weeks). Significant differences were observed among all groups (Table 4 and Figure 6). The general trend was a decrease in AS160 in groups 2 and 3 compared with group 1. Treatment with both Met. and OLE significantly decreased the expression levels of AS160 when compared with those observed in the controls.

3.7. GLUT4 Expression

No significant differences (p < 0.05) in the expression levels of GLUT4 were observed among the groups (Figure 7).

4. Discussion

Olea europaea leaves have been used to treat diabetes owing to their ability to decrease glucose, triglyceride, cholesterol, and LDL levels and increase high-density lipoprotein (HDL) levels. Many studies on the toxicity of OLE reported that it is generally safe for use even at high doses [34,35]. The purpose of this study was to explore the effect of OLE on glucose and lipid metabolism in diabetic rats. The mechanism involved in the management of hyperglycemia by OLE in diabetic animals has not been explored in previous studies [29,30,31,32]. Two concentrations of OLE (1% and 3%) were used to determine the protective effect on the animals in the present study. Although several drugs have been used for the treatment of diabetes, their high cost and adverse effects have resulted in the search for alternative therapies. Several types of herbs have been used to manage diabetes, and approximately 80% of people with diabetes are reported to depend on medicinal plants for successful treatment [33].
In agreement with the findings of previous studies, no significant effect of OLE or Met. was observed on the body weights of the rats in the present study [29,43]. Alternatively, significant increases in both FBS and PPS were observed in the D.W subgroups in groups 2 and 3 when compared with all the subgroups in G1 at the end of week 5, indicating the effect of STZ in these animals (Figure 1). Furthermore, the 1% OLE G3 subgroup presented with significantly higher levels of FBS and PPS than the other subgroups in G1, thus indicating that the low dose used (1% OLE) was not effective. A previous study showed that approximately 2–6 weeks of treatment with OLE were required to observe the desired effects [29,32,44]. The glucose levels in the 1% OLE G2 and 3% OLE G2 subgroups and the 3% OLE G3 subgroup were similar to G1; therefore, OLE might prove beneficial in reducing STZ toxicity, as reported previously [29,32,45]. Additionally, the STZ toxicity in the 1% OLE G2 subgroup was lower than that in the 1% OLE G3 subgroup, indicating that treatment with OLE before and after STZ injection might be more effective in preventing STZ toxicity and thereby preventing diabetes (Figure 1).
The Met. subgroups in both groups 2 and 3 showed comparable results to those in the G1 subgroups, indicating the protective effect of Met. against diabetic hyperglycemia, as reported previously [43,46]. Moreover, decreased glucose levels were observed in the 1% OLE, 3% OLE, and Met. subgroups in G2 when compared with their negative controls (D.W-treated); similarly, decreased levels of FBS and PPS were observed in the 3% OLE G3 and Met. G3 subgroups when compared with their relative negative controls, statistical significance was notwithstanding. This may be explained by the increase in the duration and concentration required to lower the glucose levels, as reported in previous studies [29,32,47], which remained for 2–6 weeks when treated with OLE and may reach 6% OLE and 1–3 months when treated with Met. [43,46].
A previous study showed that STZ can partially damage beta cells and induce T1D (type 1 diabetes (<50 mg/kg) or completely damage the beta cells in the pancreas leading to T1D (type 1 > 50 mg/kg), based on the dose used [37]. In the present study, the protective effect of 1% and 3% OLE against STZ toxicity was higher in G2 than in G3; 35% of the rats in G2 developed diabetes compared with 57% in G3. This difference in response to STZ toxicity may be attributed to the OLE treatment provided to the G2 rats before STZ injection.
The insulin levels in the 1% and 3% OLE G2 subgroups were similar to those in the 3% OLE and Met. G1 subgroups, which might be due to the protective effect of OLE against STZ cytotoxicity in the beta cells (Figure 2). Furthermore, significant increases (p < 0.05) in insulin levels in the G2 subgroups treated with OLE were observed when compared with those in the D.W and Met. subgroups of the same group, thus indicating that OLE treatment was more effective than the Met. treatment in terms of enhancement of the insulin level. This enhancement might be due to the protective effect of OLE against STZ toxicity in the beta cells (Figure 2). A significant increase (p < 0.05) in insulin levels was observed in the G2 subgroups treated with OLE compared with those in the G3 subgroups. Alternatively, treatment with Met. did not lead to any significant enhancement in the insulin level in G2 compared with G3 (Figure 2).
The induction of T1D in the rats was confirmed by the elevated levels of fasting plasma glucose and decreased levels of insulin. Similar results have been reported, wherein OLE was effective in increasing insulin sensitivity, reducing the fasting blood glucose level, and improving the glucose-induced release of insulin [14,48]. Additionally, previous studies showed that metformin increased hepatic insulin sensitivity and insulin dependence in the muscles and reduced blood glucose levels in humans [49,50]. One study reported that metformin was responsible for the release of insulin from beta cells [44], whereas another showed that it enhanced glucose uptake without any increase in insulin secretion [43].
Previous studies have shown that OLE reduces T.Ch., T.G, and LDL, and increase HDL in diabetic animals due to the antioxidant effect of phenolic compounds such as oleuropein, aglycone, and hydroxytyrosol [29,32,45,51]. In the present study, OLE did not appear to alter the levels of T.Ch., T.G, HDL, and LDL; except increase in LDL in 1% OLE G3 and in 3% OLE G3 this may be due to the short duration of 5 weeks used in this study. Another explanation of LDL increase in G3 treated with 1% and 3% OLE could be treatment with OLE were after two weeks of streptozotocin injection not like G2 in which treatment with OLE was before streptozotocin injection, while G1 was control group without streptozotocin injection. The reason for the increase of LDL in G3 treated with 1% or 3% OLE is streptozotocin treatment, not OLE treatment, since G1 control without streptozotocin and treated with 1% and 3% OLE showing normal comparable LDL levels to control treated with distilled water in Figure 4. These results are supported by previous studies, which have been shown that streptozotocin treatment significantly increased LDL in rats [52,53]. Long-term use of OLE or alcoholic extract with higher OLE concentrations has been reported to decrease the levels of cholesterol, triglyceride, and LDL, and increase the HDL level [29,32,51]. Nonetheless, consistent with the findings of previous studies [31,54], Met. treatment did not appear to have any effect on the lipid profile.
No significant changes in the expression of AMPK α2 were observed in any of the groups, thus indicating that both OLE and Met. did not affect AMPK α2 expression; additional studies are required to assess the long-term effects (Figure 5). One study reported an increase in AMPK α2 expression after 10 weeks of Met. treatment, which may have caused an improvement in the glucose level [51,54,55].
Treatment with both OLE and Met. resulted in a significant decrease in AS160 levels in groups 2 and 3 when compared with their relative negative controls (D.W treatment; Table 4, Figure 6). This result agrees with a previous finding, wherein the knockdown or loss of AS160 increased the level of surface GLUT4 in adipocytes, whereas activation of AS160 led to the accumulation of GLUT4 in the cytosol [18]. Therefore, decreased phosphorylation or deactivation of AS120 is required for the increase in GLUT4 expression on the cell membrane. Another study showed that Met. stimulated the phosphorylation of AS160 [51]; alternatively, Met. unaltered insulin-stimulated AS160 phosphorylation after Met. treatment [56]. This finding is different from that observed in the present study, which may be due to differences in the type of cell and concentration of metformin used; moreover, the previous study was an in vitro study. Both OLE and Met. treatment decreased the AS160 expression level in the rats in this study. This might suggest that both treatments have the same mechanism in diabetes management via glucose transporter translocation onto the surface of the skeletal muscle cell.
No significant effects of 1% OLE, 3% OLE, and Met. on GLUT 4 expression were observed in all the groups in this study. The level of the signaling protein GLUT 4 in G2 and G3 was not altered when compared with that in G1. Our results agreed with that of a previous study [50], which reported no significant effects of OLE on Glut 4 translocation when a specific concentration was used. Conversely, this result was not in agreement with a recent study, which reported that olive leaf polyphenols stimulated GLUT4 expression and translocation in skeletal muscles in diabetic rats dose-dependently. This disagreement may be due to the use of a higher concentration of OLE in their study; at low concentrations, the translocation of GLUT 4 was comparable with that observed in diabetic animals without OLE treatment in the study [57]. Three proteins in the soleus muscles of rats (Rab8A, Rab13, and Rab14) were activated dynamically and expressed more with a high concentration of olive leaf extract than the lower concentrations, in a dose dependent manner in which they are colocalized with Glut4 and suggested to be responsible for insulin-stimulated Glut4 translocation [57]. Additional time may be required for Met. to increase the translocation of GLUT 4, and this might explain why the results of the present study were different from those of previous studies [51,54].

5. Conclusions

OLE treatment protected the rats from developing hyperglycemia and maintained the insulin at levels that were comparable with those of the controls; these effects were found to be better than those observed after treatment with metformin. These findings may suggest the use of olive leaf extract as an alternative treatment to metformin in the treatment of diabetes. The antihyperglycemic effect of olive leaf extract may be due to a decrease in the phosphorylation of AS160. There was no effect of OLE on the lipid profile or on the levels of AMPK and Glut 4, which are needed for glucose metabolism and the prevention of hyperglycemia. This may be due to the short duration of this study, or the low concentration of the OLE used. Hence, additional long-term studies using various concentrations of OLE are required to assess the possible beneficial effects on glucose metabolism. We suggest to increase the duration of the treatments to at least 10 weeks, which could probably give better results. Moreover, a molecular approach might prove useful in evaluating the effects of OLE on glucose metabolism at the genetic and protein levels.

Author Contributions

A.A.-R.A.-S.: Conceptualization, methodology, supervision, Writing—original draft, correspondence. H.A.: Data curation, investigation, formal analysis, Writing—original draft, H.J.A.-A.: Data curation, Resources, Investigation. M.Z.: Writing—reviewing editing, validation M.A.: Writing—reviewing editing, validation. Authors A.A.-R.A.-S. and H.A. contributed equally to the manuscript. All authors have read and agreed to the published version of the manuscript.

Funding

This research received no external funding.

Institutional Review Board Statement

The animal study protocol was approved by Institutional Review Board in the Hashemite University/Jordan approval number 1/1/2014, date 1 January 2014.

Informed Consent Statement

Not applicable (animal study).

Data Availability Statement

Data used to support the findings of this study may be released upon application to the authors, namely, Abd Al-Rahman Al-Shudiefat via [email protected].

Acknowledgments

We would like to thank the Hashemite University for supporting the project, our colleagues in the Department of Biology, and our colleagues at Jordan University for their assistance.

Conflicts of Interest

The authors declare no conflict of interest.

References

  1. Fernandez Mejia, C. Molecular basis of type-2 diabetes. Mol. Endocrinol. 2006, 87, 87–108. [Google Scholar]
  2. World Health Organization. Diabetes. Available online: https://www.who.int/health-topics/diabetes#tab=tab_1 (accessed on 20 April 2022).
  3. World Health Organization. Guidelines for the Prevention, Management and Care of Diabetes Mellitus; World Health Organization: Geneva, Switzerland, 2006. [Google Scholar]
  4. Alyaarubi, S. Diabetes care in Oman: Obstacles and solutions. Sultan Qaboos Univ. Med. J. 2011, 11, 343. [Google Scholar] [PubMed]
  5. Kahanovitz, L.; Sluss, P.M.; Russell, S.J. Type 1 diabetes–A clinical perspective. Point Care 2017, 16, 37. [Google Scholar] [CrossRef]
  6. Olokoba, A.B.; Obateru, O.A.; Olokoba, L. Type 2 diabetes mellitus: A review of current trends. Oman Med. J. 2012, 27, 269–273. [Google Scholar] [CrossRef] [PubMed]
  7. Bastaki, S. Diabetes mellitus and its treatment. Int. J. Diabetes Metab. 2005, 13, 111–134. [Google Scholar] [CrossRef]
  8. Mohammed, S.; Yaqub, A.; Nicholas, A.; Arastus, W.; Muhammad, M.; Abdullahi, S. Review on diabetes, synthetic drugs and glycemic effects of medicinal plants. J. Med. Plants Res. 2013, 7, 2628–2637. [Google Scholar]
  9. Shane-McWhorter, L. Biological complementary therapies: A focus on botanical products in diabetes. Diabetes Spectr. 2001, 14, 199–208. [Google Scholar] [CrossRef]
  10. Liu, C.X.; Xiao, P.G. Recent advances on ginseng research in China. J. Ethnopharmacol. 1992, 36, 27–38. [Google Scholar]
  11. Dey, L.; Attele, A.S.; Yuan, C.-S. Alternative therapies for type 2 diabetes. Altern. Med. Rev. 2002, 7, 45–58. [Google Scholar]
  12. Sauvaire, Y.; Baccou, J.-C.; Valette, G.; Chenon, D.; Trimble, E.; Loubatières-Mariani, M.-M. Effects of fenugreek seeds on endocrine pancreatic secretions in dogs. Ann. Nutr. Metab. 1984, 28, 37–43. [Google Scholar]
  13. Ghanbari, R.; Anwar, F.; Alkharfy, K.M.; Gilani, A.-H.; Saari, N. Valuable nutrients and functional bioactives in different parts of olive (Olea europaea L.)—A review. Int. J. Mol. Sci. 2012, 13, 3291–3340. [Google Scholar] [CrossRef]
  14. Pereira, A.P.; Ferreira, I.C.; Marcelino, F.; Valentão, P.; Andrade, P.B.; Seabra, R.; Estevinho, L.; Bento, A.; Pereira, J.A. Phenolic compounds and antimicrobial activity of olive (Olea europaea L. Cv. Cobrançosa) leaves. Molecules 2007, 12, 1153–1162. [Google Scholar] [CrossRef]
  15. Wainstein, J.; Ganz, T.; Boaz, M.; Bar Dayan, Y.; Dolev, E.; Kerem, Z.; Madar, Z. Olive leaf extract as a hypoglycemic agent in both human diabetic subjects and in rats. J. Med. Food 2012, 15, 605–610. [Google Scholar] [CrossRef]
  16. Baysal, G.; Kasapbaşı, E.E.; Yavuz, N.; Hür, Z.; Genç, K.; Genç, M. Determination of theoretical calculations by DFT method and investigation of antioxidant, antimicrobial properties of olive leaf extracts from different regions. J. Food Sci. Technol. 2021, 58, 1909–1917. [Google Scholar] [CrossRef] [PubMed]
  17. Lenzen, S. The mechanisms of alloxan-and streptozotocin-induced diabetes. Diabetologia 2008, 51, 216–226. [Google Scholar] [CrossRef]
  18. Brewer, P.D.; Romenskaia, I.; Kanow, M.A.; Mastick, C.C. Loss of AS160 Akt substrate causes Glut4 protein to accumulate in compartments that are primed for fusion in basal adipocytes. J. Biol. Chem. 2011, 286, 26287–26297. [Google Scholar] [CrossRef] [PubMed]
  19. Webster, I.; Friedrich, S.O.; Lochner, A.; Huisamen, B. AMP kinase activation and glut4 translocation in isolated cardiomyocytes: Cardiovascular topics. Cardiovasc. J. Afr. 2010, 21, 72–78. [Google Scholar] [PubMed]
  20. Winder, W. AMP-activated protein kinase: Possible target for treatment of type 2 diabetes. Diabetes Technol. Ther. 2000, 2, 441–448. [Google Scholar] [CrossRef]
  21. Henin, N.; Vincent, M.F.; Gruber, H.E.; Van Den Berghe, G. Inhibition of fatty acid and cholesterol synthesis by stimulation of AMP-activated protein kinase. FASEB J. 1995, 9, 541–546. [Google Scholar] [CrossRef] [PubMed]
  22. Holmes, B.F.; Kurth-Kraczek, E.; Winder, W. Chronic activation of 5′-AMP-activated protein kinase increases GLUT-4, hexokinase, and glycogen in muscle. J. Appl. Physiol. 1999, 87, 1990–1995. [Google Scholar] [CrossRef] [PubMed]
  23. Nishino, Y.; Miura, T.; Miki, T.; Sakamoto, J.; Nakamura, Y.; Ikeda, Y.; Kobayashi, H.; Shimamoto, K. Ischemic preconditioning activates AMPK in a PKC-dependent manner and induces GLUT4 up-regulation in the late phase of cardioprotection. Cardiovasc. Res. 2004, 61, 610–619. [Google Scholar] [CrossRef]
  24. Song, H.; Guan, Y.; Zhang, L.; Li, K.; Dong, C. SPARC interacts with AMPK and regulates GLUT4 expression. Biochem. Biophys. Res. Commun. 2010, 396, 961–966. [Google Scholar] [CrossRef]
  25. Kim, J.H.; Lee, J.O.; Lee, S.K.; Moon, J.W.; You, G.Y.; Kim, S.J.; Park, S.-H.; Park, J.M.; Lim, S.Y.; Suh, P.-G. The glutamate agonist homocysteine sulfinic acid stimulates glucose uptake through the calcium-dependent AMPK-p38 MAPK-protein kinase C ζ pathway in skeletal muscle cells. J. Biol. Chem. 2011, 286, 7567–7576. [Google Scholar] [CrossRef]
  26. Kim, J.H.; Park, J.M.; Kim, E.K.; Lee, J.O.; Lee, S.K.; Jung, J.H.; You, G.Y.; Park, S.H.; Suh, P.G.; Kim, H.S. Curcumin stimulates glucose uptake through AMPK-p38 MAPK pathways in L6 myotube cells. J. Cell. Physiol. 2010, 223, 771–778. [Google Scholar] [CrossRef] [PubMed]
  27. Rani, M.P.; Krishna, M.S.; Padmakumari, K.P.; Raghu, K.G.; Sundaresan, A. Zingiber officinale extract exhibits antidiabetic potential via modulating glucose uptake, protein glycation and inhibiting adipocyte differentiation: An in vitro study. J. Sci. Food Agric. 2012, 92, 1948–1955. [Google Scholar] [CrossRef]
  28. Li, Y.; Tran, V.H.; Koolaji, N.; Duke, C.; Roufogalis, B.D. (S)-[6]-Gingerol enhances glucose uptake in L6 myotubes by activation of AMPK in response to [Ca2+]i. J. Pharm. Pharm. Sci. 2013, 16, 304–312. [Google Scholar] [CrossRef]
  29. Eidi, A.; Eidi, M.; Darzi, R. Antidiabetic effect of Olea europaea L. in normal and diabetic rats. Phytother. Res. Int. J. Devoted Pharmacol. Toxicol. Eval. Nat. Prod. Deriv. 2009, 23, 347–350. [Google Scholar]
  30. El-Amin, M.; Virk, P.; Elobeid, M.; Almarhoon, Z.M.; Hassan, Z.K.; Omer, S.A.; Merghani, N.M.; Daghestani, M.H.; Al-Olayan, E.M. Anti-diabetic effect of Murraya koenigii (L.) and Olea europaea (L.) leaf extracts on streptozotocin induced diabetic rats. Pak. J. Pharm. Sci. 2013, 26, 359–365. [Google Scholar] [PubMed]
  31. Kahn, C.R.; White, M. The insulin receptor and the molecular mechanism of insulin action. J. Clin. Investig. 1988, 82, 1151–1156. [Google Scholar] [CrossRef] [PubMed]
  32. Moghadam, M. The effect of oral consumption of olive leaves on serum glucose level and lipid profile of diabetic rats. J. Basic Clin. Pathophysiol. 2013, 1, 39–44. [Google Scholar]
  33. Oloyede, H.; Bello, T.; Ajiboye, T.; Salawu, M. Antidiabetic and antidyslipidemic activities of aqueous leaf extract of Dioscoreophyllum cumminsii (Stapf) Diels in alloxan-induced diabetic rats. J. Ethnopharmacol. 2015, 166, 313–322. [Google Scholar] [CrossRef] [PubMed]
  34. Al-Rimawi, F. Development and validation of a simple reversed-phase HPLC-UV method for determination of oleuropein in olive leaves. J. Food Drug Anal. 2014, 22, 285–289. [Google Scholar] [CrossRef] [PubMed]
  35. Clewell, A.E.; Béres, E.; Vértesi, A.; Glávits, R.; Hirka, G.; Endres, J.R.; Murbach, T.S.; Szakonyiné, I.P. A comprehensive toxicological safety assessment of an extract of Olea europaea L. leaves (bonolive™). Int. J. Toxicol. 2016, 35, 208–221. [Google Scholar] [CrossRef]
  36. Guex, C.G.; Reginato, F.Z.; Figueredo, K.C.; da Silva, A.R.H.; Pires, F.B.; da Silva Jesus, R.; Lhamas, C.L.; Lopes, G.H.H.; de Freitas Bauermann, L. Safety assessment of ethanolic extract of Olea europaea L. leaves after acute and subacute administration to Wistar rats. Regul. Toxicol. Pharmacol. 2018, 95, 395–399. [Google Scholar] [CrossRef] [PubMed]
  37. Ugochukwu, N.H.; Bagayoko, N.D.; Antwi, M.E. The effects of dietary caloric restriction on antioxidant status and lipid peroxidation in mild and severe streptozotocin-induced diabetic rats. Clin. Chim. Acta 2004, 348, 121–129. [Google Scholar] [CrossRef]
  38. Carter, L.G.; Qi, N.R.; De Cabo, R.; Pearson, K.J. Maternal exercise improves insulin sensitivity in mature rat offspring. Med. Sci. Sport. Exerc. 2013, 45, 832. [Google Scholar] [CrossRef]
  39. Friedewald, W.T.; Levy, R.I.; Fredrickson, D.S. Estimation of the concentration of low-density lipoprotein cholesterol in plasma, without use of the preparative ultracentrifuge. Clin. Chem. 1972, 18, 499–502. [Google Scholar] [CrossRef]
  40. Copray, S.; Liem, R.; Brouwer, N.; Greenhaff, P.; Habens, F.; Fernyhough, P. Contraction-induced muscle fiber damage is increased in soleus muscle of streptozotocin-diabetic rats and is associated with elevated expression of brain-derived neurotrophic factor mRNA in muscle fibers and activated satellite cells. Exp. Neurol. 2000, 161, 597–608. [Google Scholar] [CrossRef]
  41. Fewell, J.G.; Moerland, T.S. Responses of mouse fast and slow skeletal muscle to streptozotocin diabetes: Myosin isoenzymes and phosphorous metabolites. Mol. Cell. Biochem. 1995, 148, 147–154. [Google Scholar] [CrossRef]
  42. Minamide, L.; Bamburg, J. A filter paper dye-binding assay for quantitative determination of protein without interference from reducing agents or detergents. Anal. Biochem. 1990, 190, 66–70. [Google Scholar] [CrossRef]
  43. Pournaghi, P.; Sadrkhanlou, R.-A.; Hasanzadeh, S.; Foroughi, A. An investigation on body weights, blood glucose levels and pituitary-gonadal axis hormones in diabetic and metformin-treated diabetic female rats. Vet. Res. Forum 2012, 3, 79–84. [Google Scholar] [PubMed]
  44. Kanazawa, I. A Novel Attribute of Insulin Secretion via Incretin Axis by Metformin. Int. J. Endocrinol. Metab. 2011, 9, 420–421. [Google Scholar] [CrossRef]
  45. Somova, L.; Shode, F.; Ramnanan, P.; Nadar, A. Antihypertensive, antiatherosclerotic and antioxidant activity of triterpenoids isolated from Olea europaea, subspecies africana leaves. J. Ethnopharmacol. 2003, 84, 299–305. [Google Scholar] [CrossRef]
  46. Hundal, R.S.; Krssak, M.; Dufour, S.; Laurent, D.; Lebon, V.; Chandramouli, V.; Inzucchi, S.E.; Schumann, W.C.; Petersen, K.F.; Landau, B.R. Mechanism by which metformin reduces glucose production in type 2 diabetes. Diabetes 2000, 49, 2063–2069. [Google Scholar] [CrossRef] [PubMed]
  47. Khan, R.A.; Baig, S.G.; Siddiq, A. Comparative effects of metformin and pioglitazone on lipid profile of rabbits. Pak. J. Pharm. Sci. 2015, 28, 553–555. [Google Scholar]
  48. Al-neaimy, K.S.A. Comparative effect of Metformin and Glibenclamide on Lipid profile in type 2 Diabetic Patients. Tikrit J. Pharm. Sci. 2011, 7, 46–50. [Google Scholar]
  49. Diamanti-Kandarakis, E.; Christakou, C.D.; Kandaraki, E.; Economou, F.N. Metformin: An old medication of new fashion: Evolving new molecular mechanisms and clinical implications in polycystic ovary syndrome. Eur. J. Endocrinol. 2010, 162, 193. [Google Scholar] [CrossRef]
  50. Kadan, S.; Saad, B.; Sasson, Y.; Zaid, H. In vitro evaluations of cytotoxicity of eight antidiabetic medicinal plants and their effect on GLUT4 translocation. Evid. Based Complement. Altern. Med. 2013, 2013, 549345. [Google Scholar] [CrossRef]
  51. Lee, J.O.; Lee, S.K.; Jung, J.H.; Kim, J.H.; You, G.Y.; Kim, S.J.; Park, S.H.; Uhm, K.O.; Kim, H.S. Metformin induces Rab4 through AMPK and modulates GLUT4 translocation in skeletal muscle cells. J. Cell. Physiol. 2011, 226, 974–981. [Google Scholar] [CrossRef]
  52. Almeida, D.A.T.d.; Braga, C.P.; Novelli, E.L.B.; Fernandes, A.A.H. Evaluation of lipid profile and oxidative stress in STZ-induced rats treated with antioxidant vitamin. Braz. Arch. Biol. Technol. 2012, 55, 527–536. [Google Scholar] [CrossRef]
  53. Andallu, B.; Kumar, A.V.; Varadacharyulu, N.C. Lipid abnormalities in streptozotocin-diabetes: Amelioration by Morus indica L. cv Suguna leaves. Int. J. Diabetes Dev. Ctries. 2009, 29, 123. [Google Scholar] [CrossRef] [PubMed]
  54. Lee, J.O.; Lee, S.K.; Kim, J.H.; Kim, N.; You, G.Y.; Moon, J.W.; Kim, S.J.; Park, S.H.; Kim, H.S. Metformin regulates glucose transporter 4 (GLUT4) translocation through AMP-activated protein kinase (AMPK)-mediated Cbl/CAP signaling in 3T3-L1 preadipocyte cells. J. Biol. Chem. 2012, 287, 44121–44129. [Google Scholar] [CrossRef]
  55. Musi, N.; Hirshman, M.F.; Nygren, J.; Svanfeldt, M.; Bavenholm, P.; Rooyackers, O.; Zhou, G.; Williamson, J.M.; Ljunqvist, O.; Efendic, S. Metformin increases AMP-activated protein kinase activity in skeletal muscle of subjects with type 2 diabetes. Diabetes 2002, 51, 2074–2081. [Google Scholar] [CrossRef]
  56. Karlsson, H.K.; Hällsten, K.; Bjornholm, M.; Tsuchida, H.; Chibalin, A.V.; Virtanen, K.A.; Heinonen, O.J.; Lonnqvist, F.; Nuutila, P.; Zierath, J.R. Effects of metformin and rosiglitazone treatment on insulin signaling and glucose uptake in patients with newly diagnosed type 2 diabetes: A randomized controlled study. Diabetes 2005, 54, 1459–1467. [Google Scholar] [CrossRef] [PubMed]
  57. Giacometti, J.; Muhvić, D.; Grubić-Kezele, T.; Nikolić, M.; Šoić-Vranić, T.; Bajek, S. Olive Leaf Polyphenols (OLPs) Stimulate GLUT4 Expression and Translocation in the Skeletal Muscle of Diabetic Rats. Int. J. Mol. Sci. 2020, 21, 8981. [Google Scholar] [CrossRef] [PubMed]
Figure 1. Blood glucose levels in all groups during the fifth week. G1: (control), G2: received OLE and Met. 2 weeks before and 3 weeks after STZ, G3: received treatments with OLE and Met. 1 week after STZ injection and continued for 2 weeks. a, p < 0.05 vs. D.W G1; b, p < 0.05 vs. 1% OLE G1; c, p < 0.05 vs. 3% OLE G1; d, p < 0.05 vs. Met. G1; e, p < 0.05 vs. D.W G2; f, p < 0.05 vs. D.W G3; g, p < 0.05 vs. 1% OLE G3. Data are presented as mean ± standard deviation (SD). n = 5–7 animals in each subgroup. FBS: Fast blood sugar, PPS: Postprandial sugar.
Applsci 13 05939 g001
Figure 2. Insulin concentration after injection with STZ on week 3. G1: (control), G2: received treatments with OLE and Met. 2 weeks before and 3 weeks after STZ injection, G3 (four subgroups without treatment and injected with STZ). a, p < 0.05 vs. D.W G1; b, p < 0.05 vs. 1% OLE G1; c, p < 0.05 vs. 3% OLE G1; d, p < 0.05 vs. Met. G1; e, p < 0.05 vs. D.W G2; f, p < 0.05 vs. 1% OLE G2; g, p < 0.01 vs. 3% OLE G2; h, p < 0.05 vs. Met. G2; i, p < 0.05 vs. G3; l, p < 0.01 vs. G3.
Applsci 13 05939 g002
Figure 3. Serum lipid profiles in all the groups after 5 weeks. (A) Cholesterol (T.Ch.); (B) Triglyceride (T.G). G1: (control), G2: received OLE and Met. 2 weeks before and 3 weeks after STZ injection, G3: received treatments with OLE and Met. 1 week after STZ injection for 2 weeks. a, p < 0.05 vs. 1% OLE G1; b, p < 0.05 vs. 1% OLE G3. Data are presented as mean ± SD in four to seven animals per subgroup.
Applsci 13 05939 g003
Figure 4. Serum lipid profiles of the rats in all the groups after 5 weeks. (A) HDL cholesterol. (B) LDL cholesterol. G1: (control), G2: received OLE and Met. 2 weeks before and 3 weeks after STZ injection, G3: received treatments with OLE and Met. 1 week after STZ injection for 2 weeks. a, p < 0.05 vs. D.W G1; b, p < 0.05 vs. 1% OLE G1; c, p < 0.05 vs. 3% OLE G1; d, p < 0.05 vs. Met. G1, j, p < 0.05 vs. 1% OLE G3, k, p < 0.05 vs. 3% OLE G3. Data are presented as mean ± SD. n = 4–7 rats per subgroup.
Applsci 13 05939 g004
Figure 5. Expression levels of AMPK α2 in all the groups at the end of week 5. G1: (control), G2: received OLE and Met. 2 weeks before and 3 weeks after STZ injection, G3: received treatments with OLE and Met. 1 week after STZ injection for 2 weeks. Data are presented as mean ± SD. n = 4–7 rats per subgroup. a.u, arbitrary units.
Applsci 13 05939 g005
Figure 6. AS160 expression in all the groups at the end of week 5. G1: (control), G2: received OLE and Met. 2 weeks before and 3 weeks after STZ injection, G3: received treatments with OLE and Met. 1 week after STZ injection for 2 weeks. Data are presented as mean ± SD. n = 4–7 animals in each subgroup. One-way analysis of variance is used. a.u, arbitrary units.
Applsci 13 05939 g006
Figure 7. Expression levels of GLUT4 in the groups at the end of week 5. G1: (control group), G2: received OLE and Met. 2 weeks before and 3 weeks after STZ injection, G3: received treatments with OLE and Met. 1 week after STZ injection for 2 weeks. Data are presented as mean ± SD in 4–7 animals per subgroup. a.u, arbitrary units.
Applsci 13 05939 g007
Table 1. Groups of rats in the study. n = 7 rats in each subgroup.
WeekG1G2G3
1D.W1%
OLE
3%
OLE
Met.D.W1%
OLE
3%
OLE
Met.N.T.N.T.N.T.N.T.
2D.W1%
OLE
3%
OLE
Met.D.W1%
OLE
3%
OLE
Met.N.T.N.T.N.T.N.T.
3D.W1%
OLE
3%
OLE
Met.STZ treatment + previous treatment.STZ treatment only.
4D.W1%
OLE
3%
OLE
Met.D.W1%
OLE
3%
OLE
Met.D.W1%
OLE
3%
OLE
Met.
5D.W1%
OLE
3%
OLE
Met.D.W1%
OLE
3%
OLE
Met.D.W1%
OLE
3%
OLE
Met.
G1: control group. G2: received OLE treatment before and after injection with streptozotocin. G3: received OLE treatment after injection with streptozotocin. D.W, distilled water; OLE, olive leaf extract; Met., metformin; N.T.: no treatment.
Table 2. Effect of various treatments on the body weights of the rats.
Experimental GroupsInitial Body Weight (g)Final Body Weight (g)Weight Changes (g)
G1D.W G1199.28 ± 15.39255 ± 37.7455.71 ± 27.14 e
1% OLE G1258.33 ± 18.34319.16 ± 10 ef60.833 ± 21.77 e
3% OLE G1220 ± 18.70291 ± 28.80 f71 ± 16.73 e
Met. G1244.5 ± 30.97280.83 ± 35.5536.33 ± 10.80 e
G2D.W G2254 ± 51.64252 ± 77.91−2 ± 50.81
1% OLE G2265 ± 14.71287.5 ± 45.7322.5 ± 55.45
3% OLE G2283 ± 19.55279 ± 63.38−4 ± 56.94
Met. G2268.75 ± 11.81285 ± 26.7716.25 ± 18.90
G3D.W G3254 ± 51.64252 ± 77.91−2 ± 50.81
1% OLE G3245 ± 14.71196 ± 26.31 b−49 ± 25.83 abcd
3% OLE G3226.66 ± 36.56235 ± 40.49 bc8.33 ± 26.39
Met. G3258 ± 43.09246 ± 32.86−12 ± 59.85
G1: control group; G2: received treatments with olive leaves extract (OLE) and Metformin (Met.) 2 weeks before injection with STZ and for another 3 weeks after STZ injection; G3: received treatments with OLE and Met. 1 week after STZ injection and continued for 2 weeks. a p < 0.05 vs. D.W G1, b p < 0.05 vs. 1% OLE G1, c p < 0.05 vs. 3% OLE G1, d p < 0.05 vs. Met. G1, e p < 0.05 vs. 1% OLE G3, and f p < 0.05 vs. 3% OLE G3.
Table 3. Streptozotocin toxicity.
% of Diabetic Rats% of Nondiabetic Rats
G2
Subgroups (1% OLE, 3% OLE)
n = 14
35% a
Five rats were not protected from STZ toxicity
65% a
Nine rats were protected from STZ toxicity
G3
Subgroups (1% OLE, 3% OLE)
n = 14
57% b
Eight rats were not protected from STZ toxicity
43% b
Six rats were protected from STZ toxicity
G2: received the treatments with OLE and Met. treatments 2 weeks before and 3 weeks after STZ injection. G3: received treatments with OLE and Met. 1 week after STZ injection for 2 weeks. ANOVA test; a p < 0.05 vs. G2 without treatment (D.W); b p < 0.05 vs. G3 without treatment (D.W).
Table 4. Expression levels of AS160 in all the groups (a.u) normalized over the expression level of GAPDH.
Experimental GroupsAS160
D.W G11.60 ± 0.11 bcfghjkl
D.W G21.58 ± 0.033 bcfghjkl
1% OLE G10.824 ± 0.025 acdefghi
1% OLE G21.097 ± 0.0005 abcdeghil
3% OLE G11.20 ± 0.017 abdefghikl
3% OLE G20.98 ± 0.0038 abcdefhil
Met. G11.46 ± 0.055 bcfghjkl
Met. G20.57 ± 0.082 abcdefgil
D.W G31.66 ± 0.08 bcfghjkl
1% OLE G30.92 ± 0.17 adehi
3% OLE G30.79 ± 0.153 acdefi
Met. G30.62 ± 0.06 acdefgi
G1: (control), G2: received OLE and Met. 2 weeks before and 3 weeks after STZ injection, G3: received treatments with OLE and Met. 1 week after STZ injection for 2 weeks. a p < 0.05 vs. D.W G1; b p < 0.05 vs. 1% OLE G1; c p < 0.05 vs. 3% OLE G1; d p < 0.05 vs. Met. G1; e p < 0.05 vs. D.W G2; f p < 0.05 vs. 1% OLE G2; g p < 0.01 vs. 3% OLE G2; h p < 0.05 vs. Met. G2; i p < 0.05 vs. D.W G3; j p < 0.05 vs. 1% OLE G3; k p < 0.05 vs. 3% OLE G3, l p < 0.05 vs. Met. G3. a.u, arbitrary units.
Disclaimer/Publisher’s Note: The statements, opinions and data contained in all publications are solely those of the individual author(s) and contributor(s) and not of MDPI and/or the editor(s). MDPI and/or the editor(s) disclaim responsibility for any injury to people or property resulting from any ideas, methods, instructions or products referred to in the content.

