Abstract
The main problem with counting vehicles in rest areas in Europe and America is the overflowing of parking lots in the rest areas. Thus it is impossible to count parked vehicles with traditional, direct methods, which use cameras and Lidar (light detection and ranging) to detect the presence of vehicles in individual parking spots. The solution to this problem may be an indirect method which uses cameras to count the vehicles entering and leaving the rest area and which sorts the vehicles into categories. This article introduces a method for determining car park occupancy in rest areas using indirect measurement and evaluates the uncertainty of this method for determining the occupancy. This indirect method counts the vehicles entering and leaving the car park and sorts the vehicles into categories. The difference between the number of vehicles that entered and the number of vehicles that left in a given time gives the number of vehicles occupying the car park, i.e., the parking space demand for a given time. This demand will vary over time. In order to register the vehicles entering and leaving, mains-free supply video cameras were installed next to the entrance and exit. The counting and categorizing could be conducted organoleptically, semi-automatically, or using an image computer analysis using artificial intelligence networks. Because the difference between the number of vehicles entering and leaving is calculated over a long period, a relative error (regarding car park capacity) might be grave even when the counting errors are minor. The authors will show how the certainty of this indirect counting method can be improved.
1. Introduction
The huge development of road infrastructure, including motorways, demands a precise evaluation of the necessary services for road transport. Among others, one such service is parking spaces next to motorways. They are essential because vehicle occupants and vehicles require places to stop. Thus designing an appropriate number of parking spaces for the users of motorways is a fundamental issue.
The existing literature concerning the methods for evaluating required parking spaces next to motorways can be divided into three groups with regard to the countries they derive from: German, British [], and American []. All three methods for evaluating the demand for parking spaces consider calculations based on imprecise coefficients, i.e., coefficients calculated on the basis of empirical research and statistical analysis. Determining the number of vehicles interested in stopping at a rest area is related to several factors, e.g., traffic volume on the adjacent section of the road, a driver’s working time and the related trip-length distribution, rest area qualitative factors, and the average daily traffic; however, the main parameter is accurate information about vacancies at existing rest area parking lots. This information is being used too by drivers who try to find available parking spaces for repose.
We can distinguish two fundamental methods for determining the occupancy of parking spaces. The first method is the so-called direct method. Figure 1 shows the distribution of occupancy detectors (cameras) used in the direct method. The main problem with counting vehicles in rest areas in Europe and America is the overflowing of parking lots in the rest areas. Thus, it is impossible to count parked vehicles with traditional, direct methods which use cameras and Lidar (light detection and ranging) to detect the presence of vehicles in individual parking spots. This makes it impossible, e.g., to meet the United Europa (EU) recommendations regarding information about, among other things, parking occupancy []. The solution to this problem may be the indirect method of counting vehicles. Thus we can point to two types of methods:
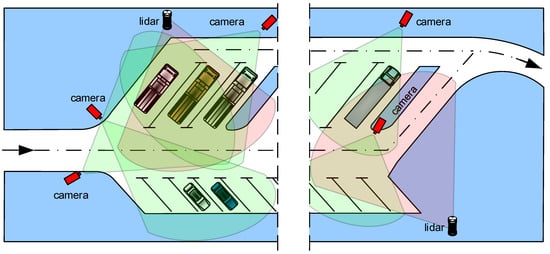
Figure 1.
An example of distributing cameras and lidars in a car park using the direct method.
- The direct method gives the number of vehicles in the parking lot by using cameras and Lidar (light detection and ranging) that focus on the parked cars.
- The indirect method gives the parameters for the entire lot using cameras that count the cars entering and exiting the lot.
Therefore, regarding the unsolved problem of counting vehicles in rest areas, we propose a method for determining a rest area’s car park occupancy using indirect measurement and assess how the certainty of this indirect counting method could be improved.
The authors have divided their research into the following sections. In Section 2, Research Background, we show how other authors have tried to resolve the problem of counting vehicles in parking lots. In Section 3, Traffic-Volume-Monitoring System, we discuss the system for measuring that we have been using. This system is fully automatic but without any calibration method. This system uses an AI application and was our primary source of real data. At the end of this section, we show a new solution for detectors without a mains supply which we started to use this year. In Section 4, Calculation of the Number of Vehicles Entering and Leaving the Car Park, we show a simulation of parking requests during a specified time. In Section 5, Evaluating the Uncertainty of Determining Parking Space Occupancy Duration in the Rest Area, we show how the certainty of the measurement using the indirect method can be improved using virtual calibration.
2. Research Background
The issue of parking-space-occupancy evaluation is currently a frequent subject of scientific analysis and study. It is part of the general scope of subjects related to intelligent transport systems and technologies [,,,], including image analysis []. This is a particularly important matter, as the increase in the number of cars (along with electric cars) results in longer search times for an available parking space, especially in city centers. For this reason, various concepts and technical solutions have been developed to determine the current number of vehicles in parking spaces, and thus inform subsequent drivers about the available number of parking spaces [,,]. In one study, the authors elaborated on the analysis of the above mentioned areas []. They characterized in detail the currently used parking models, adopting four modeling approaches: mathematical, probabilistic, economic, and analytical. It is a useful review of the models, especially in the context of a further analysis of the estimation of the measurement uncertainty of the number of vehicles in a car park.
The issue of the availability of parking spaces can be considered not only in terms of a given car park but also for a broader view, including car parks located in a specific area (e.g., district, city). In one of their publications, the authors of [] presented such an approach. They used a hierarchical approach that supported drivers in locating a parking space in a car park free of charge. For this purpose, they used two levels of decision making. In the first level, the algorithm checked only the nearest car park. In the second level, the algorithm focused on the car park closest to the one checked and looked for an available parking space there. This solution was effective and saved drivers’ time. Despite the positive outcome, the uncertainty regarding the number of available parking spaces in individual car parks was not taken into account.
To identify available parking spaces in a car park, other authors proposed a measure based on the cooperation of drivers who reported available parking spaces []. In return, they received some type of bonus. This concept was based on a blockchain block solution. Information about beacons from parked vehicles was also used. The idea is interesting from a practical point of view. Still, it is difficult to assess its correct functioning at the present stage (especially for estimating the measurement uncertainty of the number of vehicles in a car park).
In another study, the authors proposed using pressure sensors to determine the occupancy of parking spaces []. The designed system, thanks to the use of pressure sensors (detecting vehicles entering and leaving) and the Raspberry Pi, was characterized by low implementation and flexible adaptation to various car parks. This solution was interesting, but lacked an accurate evaluation method for the identification of entering vehicles. Thus, this method should be supplemented with data from a video monitoring system. This approach is presented in this article.
Another way to estimate the occupancy of parking spaces was proposed by the next study’s authors []. They used ultrasonic vehicle detection technology. The individual ultrasonic sensors were connected to a RS485 bus, which enabled data transmission to the parking management information technology (IT) system. As a result, drivers received information about the number of vacancies that they could then use. The article assessed the correctness of the system operation including, in particular, the correctness of the data from the ultrasonic sensor (the ambient temperature and the distance between the parked vehicle and the sensor were taken into account). Despite the proposed solution’s practical implementation, it was expensive as it required wiring to connect the ultrasonic sensors. For this reason, the proposal submitted in this article is more economically effective and, at the same time, the estimation of the number of vehicles is accurate.
In another publication, the authors paid particular attention to the vehicle location accuracy obtained from satellite global navigation systems in built-up areas []. These areas were characterized by a multipath propagation of radio signals, which resulted in inaccuracies in determining the position of vehicles. They proposed the use of a classifier to distinguish between multipath and direct GNSS signals. As a result, the accuracy of the vehicle location increased. This then enabled the location data to be used to identify the vehicle in the car park and, moreover, in which exact parking space.
The use of data from global navigation satellite systems was studied by another team []. To reduce the inaccuracy of the location, the authors proposed smartphone inertial sensors be used. As a result, it was possible to determine the vehicle’s location in real-time via GNSS and increase accuracy by tracking it with the phone’s inertial sensors. This solution is advantageous, especially in multi-story car parks.
The use of Bayes’s and Dempster-Shafer’s theory to determine the occupancy of the space in front of the vehicle was presented in one of the papers by the authors of []. Thus, obtaining information about the available space and using it efficiently became possible. However, the authors did not carry out a broader analysis that would have allowed the use of the obtained information to assess the occupancy of parking spaces.
In the field of parking spaces, researchers’ studies are not only focused on the assessment of the occupancy of parking spaces but also on the development of new methods for planning geometric paths that will be used for parking autonomous vehicles []. Thanks to these, it is possible to enhance the use of space in a car park and thus park more vehicles. Such solutions will reduce the uncertainty of measuring the number of vehicles in a car park, as the human factor will be eliminated in parking.
In another study, the authors used satellite images to determine the occupancy of parking spaces. This is a relatively new approach requiring high-resolution photos []. In this type of analysis, it is necessary to distinguish between moving and parked vehicles. Issues in this area were presented by the authors of the following study [].
This team tried to resolve problems in vehicle-type detection in the previous study caused by processing video data using the Digital Surface Model (DSM) [].
In this section, we have referenced many approaches that have been proposed for resolving the problem of counting vehicles in parking lots. This problem is more minor in parking areas where there is no additional surface for vehicles to stop. However, the parking lots of motorway rest areas, which we examined, have many areas without parking stands (e.g., access roads, gas stations, dedicated parking spaces for service vehicles, and parking in a space for other types of vehicles). Drivers park their vehicles in these areas, and it causes an overflowing of the rest area. Thus, there is no good solution for counting how many vehicles are on a rest area’s surface. A UE publication in ITS Directive 2010/40/EU supplements from 15 May 2013 [] recommended delivering certain and precise information for drivers in the Datex system about parking spaces close to their travel path. Still, we do not have a good measurement method ten years later. Thus, we propose using an indirect measurement to determine car park occupancy in rest areas.
As the introduction mentioned, the first method is the direct method shown in Figure 1. The second method is the indirect method. Figure 2 shows the vehicle detector localization for the indirect method as presented in [,]. Video cameras were used as vehicle detectors. We used mains-free supply video cameras with solar panels and batteries. The parts of the measurement points were: video cameras with full High Definition (HD) resolution, wireless networks, Long Term Evolution (LTE) system networks, camera servo systems, Secure Digital (SD) 128 GB storage systems, solar panels with a maximum power of 60 Watts, and a battery with a capacity of 40 Ah.
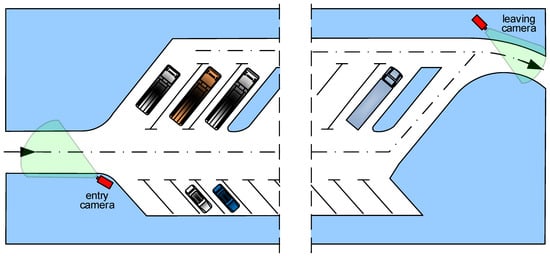
Figure 2.
Distribution of cameras for the indirect method.
The method for determining the demand for parking spaces in car parks at rest areas presented in this article is based on measuring car park occupancy based on the traffic volume at the entrance and exit of the car park [,]. This is an indirect method (Figure 2) in which the vehicles entering and the vehicles leaving the car park are counted and sorted into categories. The difference between the number of vehicles that entered and the number of vehicles that left in a given time gives the number of vehicles occupying the car park for a given time. This indirect method is insensitive to parking lots overflowing.
This paper shows how the certainty of this indirect counting method can be improved. A procedure for virtual calibration will be introduced, which makes the correction of counting errors possible without additional measurements and is open to other calibration methods.
3. Traffic-Volume-Monitoring System
Figure 3 depicts a schematic diagram revealing the architectural layout of the traffic- volume-monitoring system. The developed system consists of four central camera units for the indirect method. It can be used for multi-entry and multi-exit parking lots.
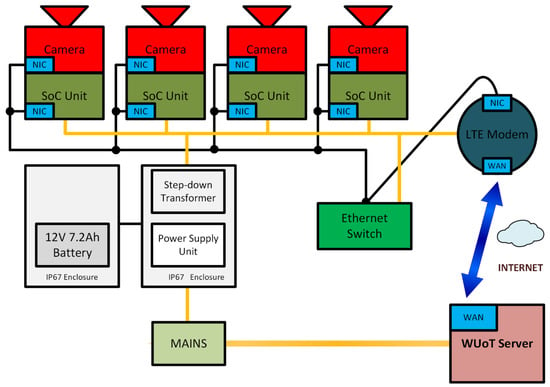
Figure 3.
Schematic diagram of the traffic-volume-monitoring system (NIC—Network Interface Controller; SoC—System on Chip; WAN—Wide Area Network).
The system layout presented in Figure 3 may be divided into five cofunctional entities: an uninterruptible power management system, visual data acquisition units (cameras), local visual-data-processing nodes (on-site SoC units), a networking layer (Ethernet switch, broadband radio modem), and a classification mainframe unit (WUoT server). Furthermore, presented in Figure 4 is the algorithmic path developed for the purpose of the designed and deployed measurement system referred to in Figure 3.
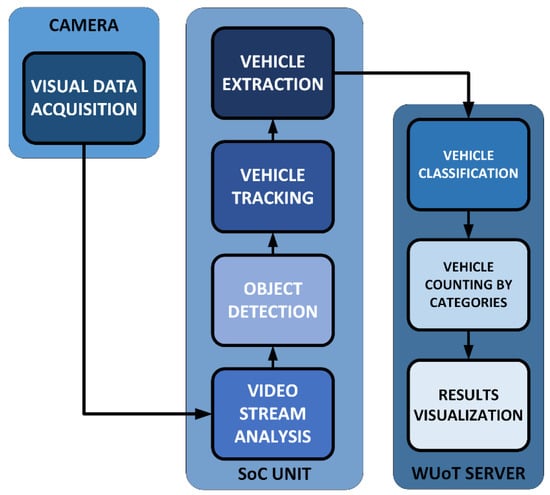
Figure 4.
The algorithm dedicated to the designed measurement system.
The dedicated algorithm (Figure 4), designed over the functional modules of the deployed measurement system, may be categorized into three sequentially connected layers. Those are a camera unit, a System-on-a-Chip node, and the main processing server (WUoT Server). As far as connectivity features are considered, the essential interconnection between the respective camera units and the SoC units was realized by means of a classical Local Area Network (i.e., ethernet interfaces) conversely to the SoC—WUoT Server path, where broadband data exchange was achieved through a Wide Area Network radio link (i.e., 4G/LTE networking stack). The essential stages of the aforementioned algorithm consisted of the following steps, divided over the three nodes:
- -
- IP Camera: visual data acquisition;
- -
- SoC unit: video stream analysis, object detection, vehicle tracking, and vehicle extraction;
- -
- WUoT server: vehicle classification, vehicle counting by categories, and result visualization.
After visual measurement data acquisition was performed (in a looped, cyclic manner), the first stage of data processing was run on the SoC unit. It was based on an optimal data decomposition—a video stream was prepared to be processed further (an optimal data structure was prepared based on a dynamic link to a video format). Secondly, the user-selected Region of Interest (ROI) determined the scope of the visual cues to be analyzed. Incoming data processing was held over the selected window while the rest of the data was withdrawn (bandwidth effectiveness was kept). Time averages of the pixel values within that region enabled the execution of the object detection stage, where by means of luminance masking (OpenCV’s featured procedure), a foreground detection was performed, and thus an object of interest could be detected. Based within Gaussian Mixture Models [], the algorithmic path enabled feedback tuning of the blocks-of-pixels being indicated as an object; therefore, the appropriate weighing of picture elements led to the creation of dynamic datasets (i.e., candidates) that were further tracked as a vehicle. Each plausible contender from the list must have beforehand met the requirements in terms of shape and size (aspect ratios relevant to the field of view (FoV) of the camera were preset empirically). Afterward during the tracking procedure, over the course of consecutive images, the optimal polling for the representative of a detected vehicle was performed, and the actual image was passed further to the extraction module, where the image was prepared to be sent over to the WUoT server. A set of bounded-box images was ready to be stored locally on the SoC unit (cyclic, limited-redundancy buffer) and simultaneously transferred via a secure link to the mainframe node. Whenever consecutive, preprocessed images were uploaded to the WUoT server, each SoC unit began its workflow in a looped manner. The initial stage of the algorithmic path realized over the resources of the WUoT mainframe was dedicated to image classification. Visual data processing procedures were developed using the Mathworks MATLAB programming environment. The core flow was dedicated to image processing with the use of the Artificial Intelligence (AI) algorithm of a Deep Convolutional Neural Network, [] based on a native AlexNET plug-in for the MATLAB environment. In that stage, each individual vehicle’s image was processed to address the ingest requirements of the AlexNET []. Next, each data module was processed as an individual classification flow that resulted in a list of the top five labels describing the analyzed vehicle (with a percentage of the credibility of classification). Amongst those labels were the following classes of vehicles: car, truck (lorry), bus, and others; moreover, optional sub-classes of certain vehicles were also stored. Finally, after the counting of categories, a proper, fully detailed data log file was written, as well as the crucial data depicted on-screen for the user.
Table 1 presents the traffic-volume-monitoring-system efficiency. As for the presented efficiency metrics, one can perceive the deployed system to have real-time characteristics, with a reasonably high effectiveness when it came to the success rates of the appropriate classification of objects. The efficiency mentioned above was evaluated over a long-term, real-life-conditions testing campaign, with over four months’ worth of measurement data.

Table 1.
Traffic-volume-monitoring system efficiency (pivotal parameters).
Table 1 presents measurement effectiveness data by means of tabular positioning. The table depicts both the time and accuracy averages of the specific parameters, namely the computational effectiveness and success rates of the video data stream analysis. The presented values (time averages) were calculated based upon a timestamp analysis (i.e., synchronized network data ingestion over specific network nodes) and algorithmic path logging (the final step performed on the WUoT Server). By means of the MATLAB environment’s built-in metrics (tic-toc paradigm), the aggregated values for the time and success rates averages were calculated. As per the video data stream analysis, the performance of the algorithmic flow followed the real-time characteristics and simultaneously featured high effectiveness in terms of the success rates. Correlating data gathered via probability metrics (i.e., AlexNET preprocessing data stream for classification and tagging) with the base data layer (i.e., ground truth for the training set where detection and classification was performed manually), the average success rates were calculated. Both the successful detection of objects and vehicle classification achieved a level of over 95% in terms of the success-rate coefficient within the aforementioned data measurement window.
Concerning the efficiency of the designed algorithm, a decision was made to utilize a deep learning approach. As an evolution of machine learning algorithms, a deep learning approach is based on end-to-end learning, where learning tasks follows directly from sets of data images. Data is transformed into tasks (results of classification) based on learned features over the convolutional neural network (CNN) []. As the overall performance of the classification procedures in the contemporary deep learning mechanisms outperforms average human accuracy [], it was of the utmost importance to empower the designed algorithm by means of the AlexNET module for the MATLAB environment. As the current-state performance of both hardware and software solutions creates a firm layer in terms of deep learning enablers (i.e., acceleration of the flow with the use of Graphics Processing Units—GPUs [], massive labeled data sources, and pre-trained models), the selected approach was based on a deep neural network fine-tuned with a pre-trained model []. Such an approach is called a transferred learning scheme, where only the weighing algorithm is tuned to work on a new measurement data cue. Already learned features and the network structure were retrieved from the widely tested AlexNET approach; thus, the following advances were obtained: less data needed for the training procedure, less time consumed in the overall process, longevity, and most importantly, pre-trained reference models for the feature extraction. Composing all of the abovementioned features, the dedicated algorithm for the traffic-volume-monitoring system was deployed.
Mains-Free-Power Supply Measurement Points
One of the problems to be solved during the measurements was the power supply to the measurement points (the video cameras, wireless network, LTE system network, and camera servo systems). In the previous solution, we used one power source system based on one solar panel, one battery, and an external power mains for one measurement system for the whole car park at a rest area (Figure 3). However, in the new solution for the new measurement plan, we wanted to keep our measurement points highly mobile. In addition, the cost of connecting power lines played a significant role in selecting power sources. So we used measurement points with an independent power supply. We used two measurement points for each rest area measurement system. Power was based on a photovoltaic panel and a battery (Figure 5).
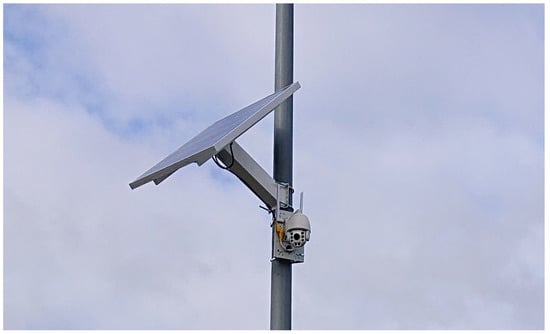
Figure 5.
Actual photo of one of the installed measurement points with a mains-free supply system.
A solar panel with a maximum power of 60 Watts and a battery with a capacity of 40 Ah enabled the cameras to work continuously, even if only one of every three days was sunny. Despite this, we tried to take measurements in the spring–summer–autumn time from equinox to equinox. This selected period of the year for measurements guarantees continuous measurement at night. Although in the target systems, we will additionally use a permanent power source from the power grid for a reliable power supply.
4. Calculation of the Number of Vehicles Entering and Leaving the Car Park
In the case of the indirect method some additional measurement uncertainties may appear (Figure 6), yet the cost of the occupancy-detecting equipment is lower.
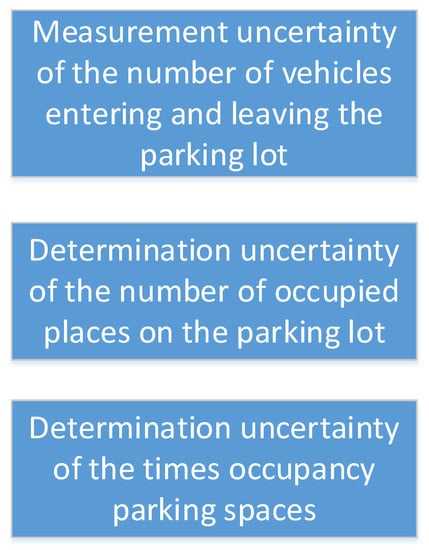
Figure 6.
The distinction of the elements introduced uncertainty in determining the number of vehicles in the rest areas.
The uncertainty in determining the number of vehicles entering and leaving can be evaluated on the basis of methods commonly applied for such calculations. Thus, this paper does not present these methods. Section 5 and Section 6 include a description of determining the characteristic measurement uncertainties for the presented method, determining car park occupancy uncertainty and determining car park occupancy duration uncertainty.
Using the indirect method and based on the given measurements the following can be determined.
The number of cars entering the rest area during the time of the measurement is
The number of cars leaving the rest area during the time of the measurement is
where the following stand for:
- -
- e1 and e2 are the instances of detecting the vehicle, respectively, at the entrance and exit of the rest area;
- -
- t1 and t2 are, respectively, the initial and final time (moment) for determining the values.
These parameters allow one to specify the number of vehicles occupying the rest area for a given time between t1 and t2:
If the rest area was occupied by some vehicles before t1 which left before t2, the value might be negative.
The number of vehicles in the rest area can be calculated in the following way:
The calculated result (z) is the mean value of the vehicles in the rest area in the period between t3 and t4.
C is the rest area equipment and location factor (in [], it was taken from survey data, but in this simulation C = 0). In the formula, it is 1 + C because C is assumed to be the coefficient for improving the rest area’s attractiveness (equipment and location). For example, rest area type I will have C = 0, and the rest area with the gas station will have, for instance, C = 0.2.
The abovementioned formulas were the basis for the computer simulation of the change in parking space demand for a given time. The results for cars in this simulation are presented in Figure 7.
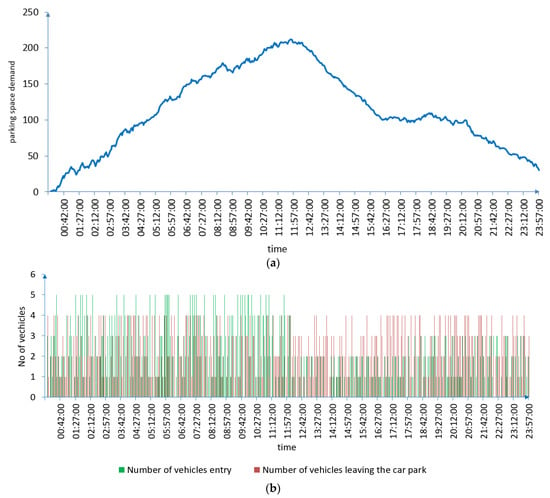
Figure 7.
The simulation results in the period of time from t3 till t4: (a) change in the parking space demand and (b) number of vehicles entering and leaving the car park.
Meanwhile, Figure 8 shows the real results of the measurements conducted at one rest area within the RID (The National Centre of Research and Development) project [].
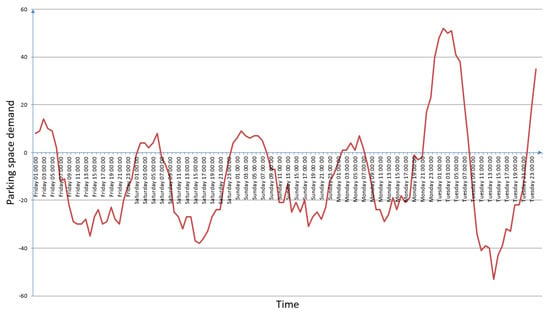
Figure 8.
The results for trucks at the Parma II rest area (change in parking space demand).
The descending tendency indicates a distortion of the measurements.
5. Evaluating the Uncertainty in Determining Rest Area Parking Spaces
The uncertainty in determining parking space occupancy with the indirect method is rather specific because the occupancy values are the differences between entrances and exits. Therefore, the relative error will depend on the error of the measurement of vehicles entering and leaving, on the division of vehicles into categories, on the proportion of vehicles entering the rest area, and the rest area capacity.
Because the volume of occupancy is determined with the indirect incremental method, the value of the error will also grow along with the measured period. Figure 9 demonstrates this with an exemplary set of diagrams for measurements conducted at the Parma II rest area for one week.
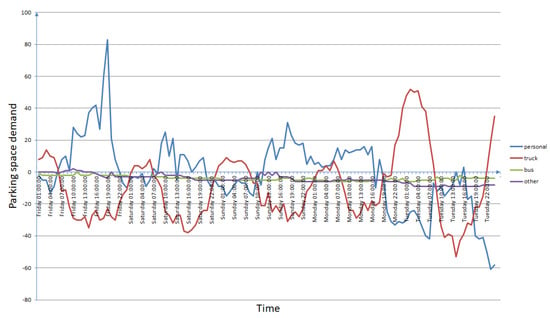
Figure 9.
Real example of determining parking space occupancy for a given time, separately for different categories of vehicles, at the rest area Parma II.
A characteristic change in the mean value position of the parking space occupancy of trucks suggests an uncertainty in counting or classifying vehicles at the entrance to or exit from the rest area.
The maximum uncertainty which can be committed in such measurements can be determined by the following []
where the following stand for:
δt—uncertainty of determining parking space occupancy in t, time;
δi, δo—uncertainty of measuring the number of vehicles either entering or leaving the rest area;
nt—the number of vehicles entering the rest area in t, time;
L—the number of parking spaces (the maximum number of a type of vehicle in the rest area).
The analysis of this dependency leads to a conclusion: the bigger the number of vehicles passing through the rest area, the greater the measurement error. In order to minimize the error, the measurement period should be short but not shorter than 24 h because of the daily character of the measurement result cycle []. A periodic calibration of the rest area occupancy can also be applied. Appendix A shows real parking space occupancy results without any calibration at the rest area. On the base shapes of the graphs in Appendix A, we can consider a daily cycle parking space occupancy.
6. Evaluating the Uncertainty of Determining Parking Space Occupancy Duration in the Rest Area
The method for determining parking space occupancy described in the previous sections was based on the instances of entering and exiting the rest area, i.e., the change in parking space demand.
The applied technology for counting and discriminating events, which have no pair during the day, enables a partial elimination of errors of this type in the counting of vehicles.
This led to achieving an effect called virtual calibration (VC). VC is an algorithmic calibration based on the results of analyzing the variability of parking space demand.
Figure 10 presents the operating rule of VC. Entering or exiting events are not taken into account when determining occupancy if they do not have a pair in the analyzed period of time. For the real case the daily ranges of such pairs were established.
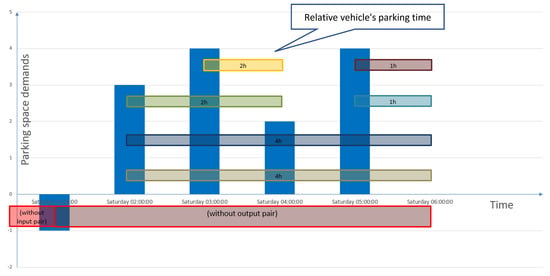
Figure 10.
An example of a virtual calibration for determining the parking space occupancy duration.
On the other hand, we could remove all demands in the afternoon hours using the assumption that the information needed is about the occupation of the parking lot during the evening, night, and morning hours (then overflow takes place). Taking all of the above elements together, we created the variability of the correction factor, as Figure 11 shows.
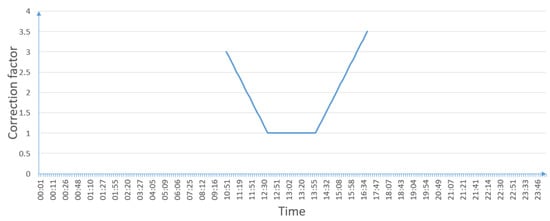
Figure 11.
Correction factor of VC.
Figure 12 shows a truck parking lot occupancy based on real data acquired from the RID project [] of the rest area Parma II. A fragment that corresponds to one day has been highlighted. This fragment defines the range of the calculation correction shown in Figure 13. The range of this fragment corresponds to the range of the correction values graph presented in Figure 11.
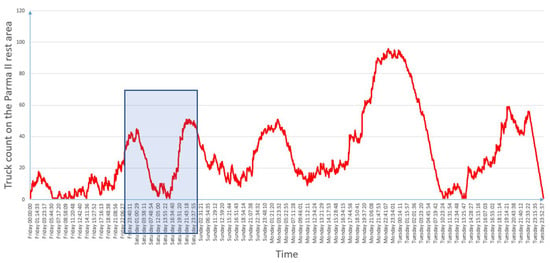
Figure 12.
The parking space occupancy result without virtual calibration at the rest area Parma II (marked range for Figure 12).
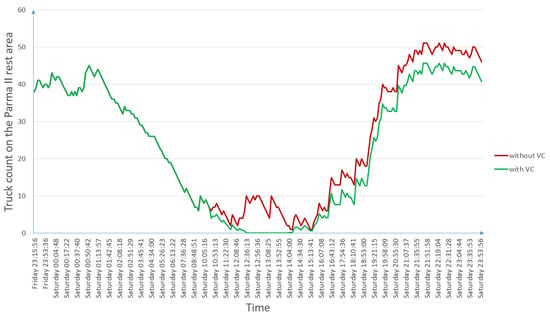
Figure 13.
The parking space occupancy results with and without virtual calibration (VC) for one day at the rest area Parma II.
Figure 13 shows the calculated correction. It was calculated in three parts:
- For the part up to 10 o’clock, nothing had changed.
- The part between 10 o’clock and 17 o’clock was calculated using Formula (6)
zi—item value of the calibrated truck count;
di—item value of the uncalibrated truck count;
hi—item value of the VC point;
i—iteration time counter.
- 3.
- The part after 17 o’clock was calculated using Formula (7)
dj—item value of the uncalibrated truck count from the range between js and je;
hj—item value of the VC point from the range between js and je;
dmax—maximum value of the uncalibrated truck count in the analyzing range;
js and je—indexes of the first and last elements from the part between 10 o’clock and 17 o’clock;
j—iteration time counter for the part between 10 o’clock and 17 o’clock.
Looking at the above diagram of the operation and results, it can be seen that the correction is effective for a daily cycle. The correction for the subsequent days will be similar, except it must consider the correction values from previous days. However, the correction of the system will still be required in a periodic or ad hoc mode, but less often than if we used a system without VC. We planned the correction to be made weekly using an organoleptic count of the parked vehicles at the lowest daily occupation time of the parking lot. However, in the future we plan to use autonomously charging drones for the periodic timed count of vehicles. Therefore, ultimately, a system based on the registration of vehicles at the entrance and exit of the parking lot and periodic occupancy counting using drones will result in a fully functional, autonomous system for counting and categorizing vehicles in a parking lot.
7. Conclusions
The main problem with counting vehicles in rest areas in Europe and America is the overflowing of parking lots in the rest areas. Thus, it is impossible to count parked vehicles with traditional, direct methods which use cameras and Lidar (light detection and ranging) to detect the presence of vehicles in individual parking spots. This makes it impossible, e.g., to meet United Europa (EU) recommendations regarding information about parking occupancy information, among others [].
At the beginning of this paper, we showed different approaches for car park occupancy measurements. There were two different types of measurements, namely:
- The direct method gives the number of vehicles in the parking lot by using cameras and Lidar (light detection and ranging) that focus on the parked cars.
- The indirect method gives parameters for the entire lot using cameras that count cars entering and exiting the lot.
We stated that our proposed solution to resolve the problem of counting vehicles in overflowing parking lots would be the presented indirect method of counting vehicles.
The indirect method presented in the article is based on precise, indirect measurements of car park occupancy. In contrast to the generally followed direct methods, this proposed method is insensitive to overflowing parking lots. Due to this, the exhibited measurement method can be more reliable. Additionally, certainty measurement improvement should increase after implementation of the virtual calibration method presented in Section 6.
The indirect method presented in the paper has two main advantages:
- The first advantage is a minimal number of measuring points. In the case of a rest area, only two are needed because rest areas on highways usually have one entry and one exit way. This property improves secure traffic. Although in Section 3 we presented a system for measuring more than two points, which we used in the RID project []. This measuring system makes it possible to use more than two measurement points.
- The second advantage is that we can calculate the number of vehicles in the parking lot without any data about where the vehicles park. The currently used method, based on the detection of parking place occupancy, does not give these results because, in an overcrowded parking lot, truck drivers will park on whatever surface is available. In this case, car parks are often overcrowded by up to 70% [].
The main disadvantage of the method presented in this article is the possibility of grave relative errors stemming from counting errors regarding the number of vehicles using the car park and the number of parking spaces. However, Section 6 presented a method that eliminates this error and improves the accuracy of determining parking space occupancy in rest areas.
In future research:
- We will try to implement our own system for the measurement of parking lot occupation by presenting an indirect method using AI, based on over 200,000 verified entrances and exits and the classification of the vehicles in the parking lots within project RID []. We need to note that most of the data used for preparing this article came from this project, in which the authors participated.
- In another project, we (at the beginning of the year 2023) installed our mains-free supply measurement points (cameras with internet access and an independent power source of a solar panel and battery) in the rest area of North Brwinów near Warsaw. We will detect and classify the vehicles entering and exiting this rest area until the end of 2025.
- The third part of our future research is to use unattended and mains-free supply autonomously charging drones for measurement calibration.
- In the future, we will try using information quality management (IQM) for the optimization of measurement quality using uncertainty modeling methods [,] created by the main author.
Author Contributions
Conceptualization, M.S. and K.P.; methodology, M.S. and T.C.; software, M.S. and G.W.; validation, M.S., A.R., K.P. and T.C.; formal analysis, M.S. and G.W.; investigation, M.S.; resources, M.S., A.R. and G.W.; data curation, M.S., G.W. and T.C.; writing—original draft preparation, M.S., A.R. and G.W.; writing—review and editing, M.S., A.R., K.P. and G.W.; visualization, M.S. and G.W.; supervision, M.S. and K.P.; project administration, M.S.; funding acquisition, M.S. and K.P. All authors have read and agreed to the published version of the manuscript.
Funding
This research was funded by a research grant from the Warsaw University of Technology supporting scientific activity in the discipline of Civil Engineering and Transport: 11/2022; and by the Excellence Initiative: Research University (IDUB) programme, Warsaw University of Technology: 1820.362.Z01.2021.
Institutional Review Board Statement
Not applicable.
Informed Consent Statement
Not applicable.
Data Availability Statement
Not applicable.
Acknowledgments
This paper was written under a research grant from the Warsaw University of Technology supporting scientific activity in the discipline of Civil Engineering and Transport. This paper was written under a research grant from the Warsaw University of Technology within the Excellence Initiative: Research University (IDUB) programme This article is a post-project of the project “Parking spaces in rest areas” financed by NCBiR/GDDKiA (The National Centre of Research and Development/The General Directorate for National Roads and Motorways) within the joint project “RID” (Road Innovations Development) contract DZP/RID-I-44/8/NCBR/2016.
Conflicts of Interest
The authors declare no conflict of interest.
Appendix A. Parking Space Occupancy Results from Four of the Many Rest Areas We Examined
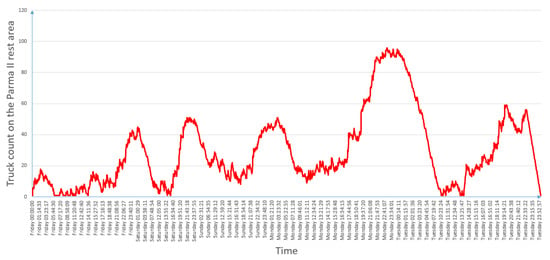
Figure A1.
The parking space occupancy results without virtual calibration for the rest area Parma II.
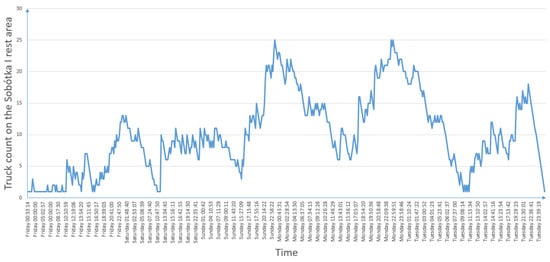
Figure A2.
The parking space occupancy results without virtual calibration for the rest area Sobótka I.
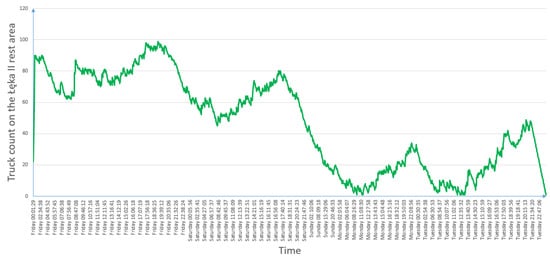
Figure A3.
The parking space occupancy results without virtual calibration for the rest area Łęka II.
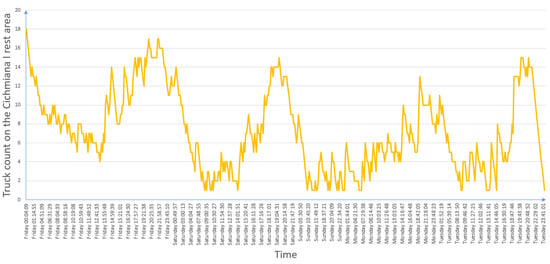
Figure A4.
The parking space occupancy results without virtual calibration for the rest area Cichmiana I.
References
- United Kingdom Government, Department for Transport. The Strategic Road Network and the Delivery of Sustainable Development. Available online: www.gov.uk (accessed on 15 May 2022).
- USA New York State Department of Transport. Guide for the Development of Rest Areas on Major Arterials and Freeways. (AASHTO). Available online: www.dot.ny.gov (accessed on 15 May 2022).
- Commission Delegated Regulation (EU) No 885/2013 of 15 May 2013 Supplementing ITS Directive 2010/40/EU of the European Parliament and of the Council with Regard to the Provision of Information Services for Safe and Secure Parking Places for Trucks and Commercial Vehicles; European Commission: Brussels, Belgium, 2013.
- Möller, D.P.F.; Haas, R.E. Automotive E/E and Automotive Software Technology. In Guide to Automotive Connectivity and Cybersecurity. Computer Communications and Networks; Springer: Cham, Switzerland, 2019. [Google Scholar] [CrossRef]
- Hu, J.; Zheng, B.; Wang, C.; Zhao, C.H.; Hou, X.L.; Pan, Q.; Xu, Z. A survey on multi-sensor fusion based obstacle detection for intelligent ground vehicles in off-road environments. Front. Inform. Technol. Electron. Eng. 2020, 21, 675–692. [Google Scholar] [CrossRef]
- Anthopoulos, L.G.; Tzimos, D.N. Carpooling Platforms as Smart City Projects: A Bibliometric Analysis and Systematic Literature Review. Sustainability 2021, 13, 10680. [Google Scholar] [CrossRef]
- Muntean, M.V. Multi-Agent System for Intelligent Urban Traffic Management Using Wireless Sensor Networks Data. Sensors 2022, 22, 208. [Google Scholar] [CrossRef] [PubMed]
- Rabbouch, H.; Saâdaoui, F.; Mraihi, R. Traffic Sensing and Assessing in Digital Transportation Systems. In Linking and Mining Heterogeneous and Multi-View Data. Unsupervised and Semi-Supervised Learning; Deepak, P., Jurek-Loughrey, A., Eds.; Springer: Cham, Switzerland, 2019. [Google Scholar] [CrossRef]
- Anusha, T.; Pushpalatha, M. Efficient Communication Model for a Smart Parking System with Multiple Data Consumers. Smart Cities 2022, 5, 1536–1553. [Google Scholar] [CrossRef]
- Biyik, C.; Allam, Z.; Pieri, G.; Moroni, D.; O’Fraifer, M.; O’Connell, E.; Olariu, S.; Khalid, M. Smart Parking Systems: Reviewing the Literature, Architecture and Ways Forward. Smart Cities 2021, 4, 623–642. [Google Scholar] [CrossRef]
- Fahim, A.; Hasan, M.; Chowdhury, M.A. Smart parking systems: Comprehensive review based on various aspects. Heliyon 2021, 7, e07050. [Google Scholar] [CrossRef] [PubMed]
- Chajae, H.; Jawab, F. Systematic Review of Macro Parking Models. In Advances in Integrated Design and Production, Proceedings of the 11th International Conference on Integrated Design and Production, CPI 2019, Fez, Morocco, 14–16 October 2019; Lecture Notes in Mechanical Engineering; Saka, A., Choley, J.-Y., Louati, J., Chalh, Z., Barkallah, M., Alfidi, M., Amar, M.B., Chaari, F., Haddar, M., Eds.; Springer: Cham, Switzerland, 2021. [Google Scholar] [CrossRef]
- Kizilkaya, B.; Caglar, M.; Al-Turjman, F.; Ever, E. An Intelligent Car Park Management System: Hierarchical Placement Algorithm Based on Nearest Location. In Proceedings of the 2018 32nd International Conference on Advanced Information Networking and Applications Workshops (WAINA), Krakow, Poland, 16–18 May 2018; pp. 597–602. [Google Scholar] [CrossRef]
- Ferreira, J.C.; Martins, A.L.; Gonçalves, F.; Maia, R. A Blockchain and Gamification Approach for Smart Parking. In Intelligent Transport Systems, From Research and Development to the Market Uptake. INTSYS 2018; Lecture Notes of the Institute for Computer Sciences, Social Informatics and Telecommunications Engineering; Ferreira, J., Martins, A., Monteiro, V., Eds.; Springer: Cham, Switzerland, 2019; Volume 267. [Google Scholar] [CrossRef]
- Khanna, P.R.; Howells, G. A novel cost-effective Pressure Sensor based Smart Car park system. In Proceedings of the 2020 XXXIIIrd General Assembly and Scientific Symposium of the International Union of Radio Science, Rome, Italy, 29 August–5 September 2020; pp. 1–4. [Google Scholar] [CrossRef]
- Zhou, H.; Li, Z. An Intelligent Parking Management System Based on RS485 and RFID. In Proceedings of the 2016 International Conference on Cyber-Enabled Distributed Computing and Knowledge Discovery (CyberC), Chengdu, China, 13–15 October 2016; pp. 355–359. [Google Scholar] [CrossRef]
- Adegoke, E.I.; Zidane, J.; Kampert, E.; Jennings, P.A.; Ford, C.R.; Birrell, S.A.; Higgins, M.D. Evaluating Machine Learning & Antenna Placement for Enhanced GNSS Accuracy for CAVs. In Proceedings of the 2019 IEEE Intelligent Vehicles Symposium (IV), Paris, France, 9–12 June 2019; pp. 1007–1012. [Google Scholar] [CrossRef]
- Gao, R.; Ye, F.; Luo, G.; Cong, J. Smartphone-Based Real-Time Vehicle Tracking in Indoor Parking Structures. In Smartphone-Based Indoor Map Construction; SpringerBriefs in Computer Science; Springer: Singapore, 2018. [Google Scholar] [CrossRef]
- Pae, D.S.; Jang, Y.S.; Park, S.K.; Lim, M.T. Track Compensation Algorithm Using Free Space Information with Occupancy Grid Map. Int. J. Control Autom. Syst. 2021, 19, 40–53. [Google Scholar] [CrossRef]
- Metin, F.; Sezer, V. Analysis and Improvement of Geometric Parallel Parking Methods with Respect to the Minimum Final Lateral Distance to the Parking Spot. Int. J. ITS Res. 2021, 19, 441–455. [Google Scholar] [CrossRef]
- Xuan, S.; Li, S.; Han, M.; Wan, X.; Xia, G.S. Object Tracking in Satellite Videos by Improved Correlation Filters with Motion Estimations. IEEE Trans. Geosci. Remote Sens. 2020, 58, 1074–1086. [Google Scholar] [CrossRef]
- Zambanini, S.; Loghin, A.-M.; Pfeifer, N.; Soley, E.M.; Sablatnig, R. Detection of Parking Cars in Stereo Satellite Images. Remote Sens. 2020, 12, 2170. [Google Scholar] [CrossRef]
- Loghin, A.-M.; Otepka-Schremmer, J.; Pfeifer, N. Potential of Pléiades and WorldView-3 Tri-Stereo DSMs to Represent Heights of Small Isolated Objects. Sensors 2020, 20, 2695. [Google Scholar] [CrossRef] [PubMed]
- Stawowy, M.; Perlicki, K.; Czarnecki, T. Incremental method of count parking spaces on motorway. WUT J. Transp. Eng. 2017, 119, 445–453. [Google Scholar]
- Stawowy, M.; Gałązka, K.; Perlicki, K.; Czarnecki, T. Vehicle surveillance system on the motorway car parks with video monitoring. WUT J. Transp. Eng. 2017, 116, 275–285. [Google Scholar]
- Stawowy, M.; Perlicki, K.; Mrozek, T. Application and simulations of uncertainty multilevel models for estimating the number of motorway parking spaces. In Proceedings of the European Safety and Reliability Conference ESREL, Portoroz, Slovenia, 18–22 June 2017; Cepin, M., Bris, R., Eds.; The Publisher CRC Press/Balkema: Boca Raton, FL, USA, 2017; pp. 2653–2657, ISBN 978-1-138-62937-0. [Google Scholar]
- True, N. Vacant Parking Space Detection in Static Images; University of California: San Diego, CA, USA, 2007. [Google Scholar]
- Wilczewski, G.; Czarnecki, T.; Perlicki, K. Optoelectronic systems for automatic vehicle counting and classification in rest areas. In Proceedings of the SPIE 10445, Photonics Applications in Astronomy, Communications, Industry, and High Energy Physics Experiments 2017, 104450C, Wilga, Poland, 27 May–5 June 2017. [Google Scholar]
- Long, J.; Shelhamer, E.; Darrell, T. Fully convolutional networks for semantic segmentation. In Proceedings of the 2015 IEEE Conference on Computer Vision and Pattern Recognition (CVPR), Boston, MA, USA, 7–12 June 2015; pp. 3431–3440. [Google Scholar]
- Krizhevsky, A.; Sutskever, I.; Hinton, G.E. ImageNet classification with deep convolutional neural networks. Commun. ACM 2017, 60, 84–90. [Google Scholar] [CrossRef]
- Deng, L.; Yu, D. Deep Learning: Methods and Applications. Found. Trends Signal Process. 2014, 7, 320–330. [Google Scholar] [CrossRef]
- Zhang, Z.; Xing, F.; Su, H.; Shi, X.; Yang, L. Recent Advances in the Applications of Convolutional Neural Networks to Medical Image Contour Detection. arXiv 2017, arXiv:1708.07281. [Google Scholar]
- Ahmad, A.U.; Starkey, A. Application of feature selection methods for automated clustering analysis: A review on synthetic datasets. Neural Comput. Appl. 2018, 29, 317–328. [Google Scholar] [CrossRef] [PubMed]
- Becherer, N.; Pecarina, J.; Nykl, S.; Hopkinson, K. Improving optimization of convolutional neural networks through parameter fine-tuning. Neural Comput. Appl. 2019, 31, 3469–3479. [Google Scholar] [CrossRef]
- Final Project Report, “Parking Spaces in Rest Areas” Financed by NCBiR/GDDKiA (The National Centre of Research and Development/The General Directorate for National Roads and Motorways) within the Joint Project “RID” (Road Innovations Development) Contract DZP/RID-I-44/8/NCBR/2016; Consortium MOPS: Warsaw, Poland, 2017.
- The General Directorate for National Roads and Motorways. Archiving and Analysis of Data from Continuous Traffic Meas-urement Stations from 2020. Archiving and Annual Analysis of Data from 2020 Warsaw 2021. Available online: https://www.gov.pl/web/gddkia/stacje-ciaglych-pomiarow-ruchu (accessed on 2 May 2021).
- Stawowy, M. Method of Multilayer Modeling of Uncertainty in Estimating the Information Quality of ICT Systems in Transport; Publishing House Warsaw University of Technology: Warsaw, Poland, 2019. (In Polish) [Google Scholar]
- Stawowy, M.; Duer, S.; Paś, J.; Wawrzyński, W. Determining Information Quality in ICT Systems. Energies 2021, 14, 5549. [Google Scholar] [CrossRef]
Disclaimer/Publisher’s Note: The statements, opinions and data contained in all publications are solely those of the individual author(s) and contributor(s) and not of MDPI and/or the editor(s). MDPI and/or the editor(s) disclaim responsibility for any injury to people or property resulting from any ideas, methods, instructions or products referred to in the content. |
© 2023 by the authors. Licensee MDPI, Basel, Switzerland. This article is an open access article distributed under the terms and conditions of the Creative Commons Attribution (CC BY) license (https://creativecommons.org/licenses/by/4.0/).