Abstract
The performance of speaker recognition systems is very well on the datasets without noise and mismatch. However, the performance gets degraded with the environmental noises, channel variation, physical and behavioral changes in speaker. The types of Speaker related feature play crucial role in improving the performance of speaker recognition systems. Gammatone Frequency Cepstral Coefficient (GFCC) features has been widely used to develop robust speaker recognition systems with the conventional machine learning, it achieved better performance compared to Mel Frequency Cepstral Coefficient (MFCC) features in the noisy condition. Recently, deep learning models showed better performance in the speaker recognition compared to conventional machine learning. Most of the previous deep learning-based speaker recognition models has used Mel Spectrogram and similar inputs rather than a handcrafted features like MFCC and GFCC features. However, the performance of the Mel Spectrogram features gets degraded in the high noise ratio and mismatch in the utterances. Similar to Mel Spectrogram, Cochleogram is another important feature for deep learning speaker recognition models. Like GFCC features, Cochleogram represents utterances in Equal Rectangular Band (ERB) scale which is important in noisy condition. However, none of the studies have conducted analysis for noise robustness of Cochleogram and Mel Spectrogram in speaker recognition. In addition, only limited studies have used Cochleogram to develop speech-based models in noisy and mismatch condition using deep learning. In this study, analysis of noise robustness of Cochleogram and Mel Spectrogram features in speaker recognition using deep learning model is conducted at the Signal to Noise Ratio (SNR) level from −5 dB to 20 dB. Experiments are conducted on the VoxCeleb1 and Noise added VoxCeleb1 dataset by using basic 2DCNN, ResNet-50, VGG-16, ECAPA-TDNN and TitaNet Models architectures. The Speaker identification and verification performance of both Cochleogram and Mel Spectrogram is evaluated. The results show that Cochleogram have better performance than Mel Spectrogram in both speaker identification and verification at the noisy and mismatch condition.
Keywords:
speaker identification; speaker verification; Mel Spectrogram; Cochleogram; 2DCNN; ResNet-50; VGG-16 1. Introduction
Speaker recognition is classification/identification of an individual person from others based on characteristics of voice. It is a biometrics technology which identification, verification, and classification of individual speakers based on the voice characteristics [1]. It has the capability of tracking, detecting, and segmenting specific speaker from the group of speakers. It is very important in the various application areas including forensics, financial transaction, business management, access control, surveillance and law enforcement [2,3]. Speaker recognition can be classified into two categories: Speaker identification and Speaker verification [2].
Speaker identification is the process of determining who is speaking from the set of known speakers by the model [4]. It performs 1: N classification, where a test sample compared with all the speaker classes in the trained model. Speaker identification also known as closed set identification because it is assumed the test speaker voice come from a known set of speakers. Speaker verification is the process of determining whether the speaker identity is who the person claims to be. In speaker verification the speaker is either accepted or rejected. It is also referred as open set classification. Speaker verification performs one to one classification, in which the test voice compared with claimed speaker class in the model.
Speaker recognition systems has two basic operations: feature extraction and speaker modeling/training [2]. Feature extraction converts raw waveform of the speech signal into low dimensional feature vectors which is important to train the model. Feature extraction plays important role in the performance of the speaker recognition. Handcrafted features such as Mel Frequency Cepstral Coefficient (MFCC), Gammatone Frequency Cepstral Coefficient (GFCC) and Linear Predictive Cepstral Coefficient (LPCC) has been used in conventional machine learning models [5]. Deep learning models automatically extracts feature from the input data during training [6]. The performance of speaker recognition systems is very good for the training and test speech without mismatch/noise [7]. In reality, mismatch or noise may occur between training and test speech which degrades performance of speaker recognition systems. Practical application of speaker recognition systems needs robustness of the system for each of the real-world conditions.
Convolutional Neural Network (CNN) [8], which is well known deep learning model achieved very good performance in variety of problems including image classification, speech recognition, natural language processing and other computer vision research. Because of superior performance of deep learning models related with conventional machine learning, recent Speaker recognition research are conducted using deep learning models, especially to CNN architecture. Most of the CNN architectures-based speaker recognition models are developed using Mel Spectrogram of the speech signal. However, the speaker recognition performance of the Mel Spectrogram gets degraded with the noise and other mismatch. In this study, we have analyzed noise robustness of Cochleogram and Mel Spectrogram in Speaker recognition using the CNN architectures: basic 2DCNN, ResNet-50, VGG-16, ECAPA-TDNN [9] and TitaNet [10] architectures. The deep learning-based speaker recognition models with Cochleogram feature is recommended for the noisy environment.
The rest of the paper is organized as follows. Related works conducted in the area of our study is discussed in Section 2. Section 3 explains about Cochleogram and Mel Spectrogram generation from speech data. Section 4 explains the detail of CNN architectures used in our study. In Section 5 we explained in detail how the experiment is conducted, and we represented the results in different types of ways. We concluded this study in Section 6.
2. Related Works
There is large number of references in the speaker recognition area. In this study, we reviewed the literatures more related to our study. A number of research is conducted to improve the noise robustness of speaker recognition models by using different types of feature extraction techniques and machine learning models. In the study [7] noise robustness of MFCC and GFCC features are analyzed, then GFCC feature is recommended. Therefore, either GFCC feature or its fusion with other features has been used in conventional machine learning models to develop robust speaker recognition. In the study [11], a speaker identification system is developed using GFCC feature and GMM classifier with the additive noises (i.e., babble, factory and destroyer noises); then it achieved better performs than MFCC features. The research work on [12] used a combination of GFCC and MFCC features to develop speaker identification using Deep Neural Network (DNN) classifiers in noisy conditions, the result shows that fusion of both features perform superior to individual features. Robustness of GFCC feature for additive noise and white Gaussian noise is also evaluated in speaker recognition using i-vector in the study [13] and the result shows that GFCC shows superior performance. Fusion of classifiers like fusion of GMM and SVM is applied together with the GFCC feature to develop a speaker recognition. In GFCC, speech is represented in equivalent rectangular bandwidth (ERB) scale which has finer resolution than Mel Scale in low frequency. Both ERB scale and nonlinear rectification are the main sources for the robustness of GFCC in noisy conditions.
Recently, deep learning models have attracted the attention of researchers of speaker recognition and other research areas. In the study [14] Convolutional Neural Network (CNN) and Long Short Memory Networks, respectively, showed superior performance than GMM and i-vector approaches in speaker recognition. In the paper [15], CNN model shows superior performance than Support Vector Machine (SVM) in based speaker recognition. Unlike classical machine learning models which use handcrafted features, CNN model extracts feature from input images automatically during training and classification. For CNN based speaker recognition input images are generated from speech at different steps of speech processing. In the study [16], raw waveform shows better speaker identification performance than MFCC features in noisy and reverberant environments. In the research work [17,18], performance of spectrogram in speaker recognition surpasses both raw waveform and MFCC features both in noisy and reverberant environments. Deep learning-based speaker recognition research works in [19,20,21] use Mel Spectrogram as an input. Like MFCC, Mel Spectrogram represents speech in Mel Scale whose performance degrades with noises, environmental changes, physical and behavioral changes of speaker during training and test. Like GFCC, in Cochleogram [22] speech represented in Equal Rectangular Band (ERB) scale and uses nonlinear rectification. ERB scale is more robust to noise because of its finer resolution in lower frequency. In the study [23] Sabbir Ahmed et al. proposed the speaker identification model using Cochleogram and a simple CNN architecture, the model achieved better accuracy in the noise condition. Even though Cochleogram can be used as an input for deep learning models, only limited speech-based research is conducted using Cochleogram and deep learning models. None of the research works also analyzed noise robustness of Cochleogram features in speaker recognition on the datasets with different types of noises at different Signal to Noise ratio (SNR) level. In addition, only limited deep learning based speaker recognition models are developed using Cochleogram. In this study, we have conducted analysis of noise robustness of Cochleogram and Mel Spectrogram features with three different types of noises (Babble noise, street noise and restaurant noise) at SNR level from −5 dB to 20 dB. The deep learning model architectures such as: basic two-dimensional CNN (2DCNN), ResNet-50, VGG-16, ECAPA-TDNN and TitaNet architectures are used to conduct analysis of noise robustness of Cochleogram and Mel Spectrogram features in speaker identification and verification.
3. Cochleogram and Mel Spectrogram Generation
Both Cochleogram and Mel Spectrogram represents speech in two-dimensional time-frequency using the Equal Rectangular Band (ERB) scale and Mel Scale, respectively. At the beginning steps of Cochleogram and Mel Spectrogram generation, the steps such as: Pre-emphasis, framing, windowing, Fast Fourier Transform (FFT) and power spectrum generation are applied in common.
Mel Filter banks, which simulates non-linear human auditory perception is computed from FFT, then it is stacked together to form the Mel Spectrogram of the speech. The sample Mel Spectrogram is shown in the Figure 1.
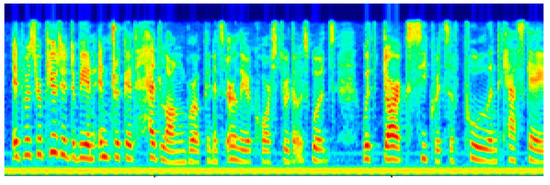
Figure 1.
Mel Spectrogram.
Gammatone filter bank (GFTB) provides a closer approximation to the bandwidths of filters in the human auditory system. It is specified on the Equivalent Rectangular Bandwidth (ERB) scale, which is a psychoacoustic measure of the width of the auditory filters. Representing low frequency speech in higher resolution [24], non-linear rectification [7] and measuring of psychoacoustics feature from the speech make Gammatone filter banks more preferable speaker characterization in noisy condition. GFTB is computed from the FFT, then stacked together to form Cochleogram. Sample Cochleogram is shown in Figure 2 below.
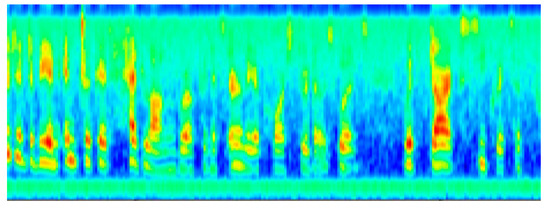
Figure 2.
Cochleogram.
4. CNN Architectures
This section discusses about the CNN architectures used in this study to analyze noise robustness of Cochleogram and Mel Spectrogram in speaker identification and verification. The most commonly used and recent deep learning model architectures such as: basic 2DCNN, ResNet-50, VGG-16, ECAPA-TDNN and TitaNet models are used in this study to analyze noise robustness of Cochleogram and Mel Spectrogram features in speaker identification and verification. The detail of basic 2DCNN, VGG-16 and ResNet-50 architectures is discussed in the Table 1, Table 2 and Table 3, respectively. An ECAPA-TDNN architecture which is proposed in the study [9] is also adopted in our study, its block architecture is presented in the Figure 3. The SE-Res2Block component of the ECAPA-TDNN is shown in the Figure 4. TitaNet architecture, which is proposed in the study [10] is also adopted in this study to evaluate the performance of the Cochleogram and Mel Spectrogram features in speaker recognition. Figure 5 presents the block diagram of TitaNet architecture.

Table 1.
Basic 2DCNN Architecture.

Table 2.
VGG-16 Architecture.

Table 3.
ResNet-50 Architecture.
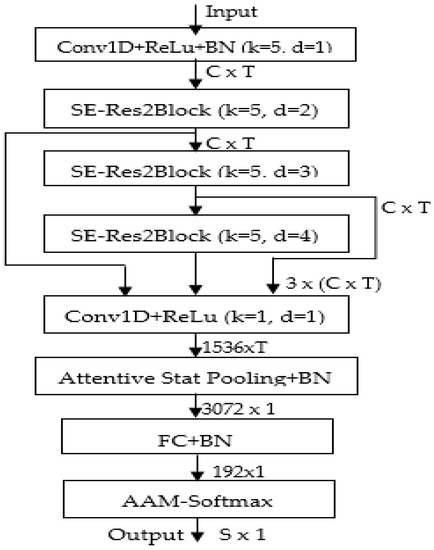
Figure 3.
ECAPA-TDNN Architecture [9].
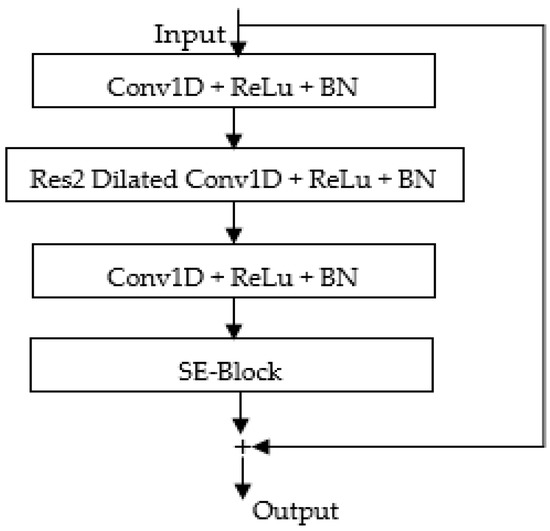
Figure 4.
SE-Res2Block Architecture [9].
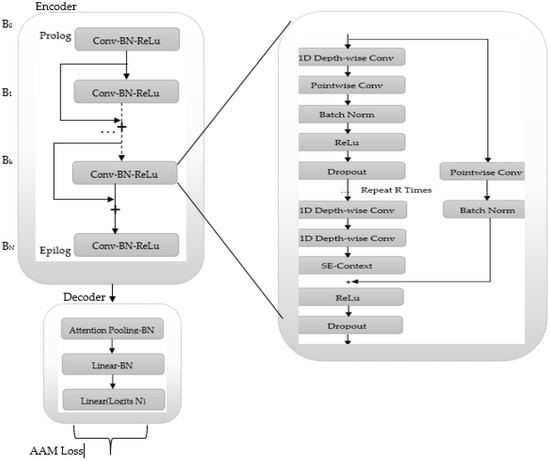
Figure 5.
TitaNet Architecture [10].
5. Experiment and Result
5.1. Dataset
The speech dataset used in this work were obtained from the public VoxCeleb1 audio files dataset. VoxCeleb1 [25] dataset contains 153,516 utterances which is collected from 1251 speakers. The utterances are extracted from different kinds of celebrities uploaded to YouTube. The ratio of male speaker in the dataset is balanced which is 55%. The speakers span a wide range of different ethnicities, accents, professions and ages. The VoxCeleb1 dataset has identification and verification split as shown in the Table 4 for speaker identification and verification, respectively.

Table 4.
Development and Test Split of VoxCeleb1 dataset for identification and verification.
Although VoxCeleb1 dataset is not strictly clean from noises, we assumed it as clean dataset and generated noisy VoxCeleb1 datasets by adding a real-world noises (such as: Babble, Street, and restaurant noises) to the clean dataset. The noises used in this study is obtained from the source at [26].
For speaker identification, firstly an original development and test split of the VoxCeleb1 dataset is mixed into one. Then the dataset is divided into training, validation and test split with the ratio of 80%, 10% and 10%, respectively. During speaker identification, randomly selected noise is added to each utterance of the training and validation split at the SNR level from −5 dB to 20 dB. The speaker identification performance is evaluated by adding randomly selected noise to each of the test split utterances at the SNR level −5 dB, 0 dB, 5 dB, 10 dB, 15 dB and 20 dB.
For speaker verification, the original development and test split of the VoxCeleb1 dataset is used without change during our experiment. The training split consists of 148,642 utterances from 1211 speakers and the test split consists of 4874 utterances from 40 speakers which produces a total of 37,720 trials. During training for speaker verification, for each clean utterances, the noisy utterances are generated by adding randomly selected noises at the random SNR level from −5 dB to 20 dB. The speaker verification performance is evaluated by using noise added verification test split. The randomly selected noise is added to each of the test utterances at the SNR level −5 dB, 0 dB, 5 dB, 10 dB, 15 dB and 20 dB during evaluating for speaker verification.
5.2. Implementation Details and Training
In this study, Cochleogram and Mel Spectrogram which is generated from the utterances is used as an input for the CNN architecture used to our experiment. For Cochleogram and Mel Spectrogram generation, a 30 ms hamming windows with the overlapping size of 15 ms are used for the 128 filters and 2048-point FFT. Finally, Cochleogram and Mel Spectrogram of size 1088 × 288 (frequency × time) is generated for each of the utterances and used as an input to each of the models. Since the aim of this study is to analyze the robustness of the Cochleogram and Mel Spectrogram features, none of the audio preprocessing such as voice activity detection or silence removal is applied. None of the normalization and data augmentation is applied to Cochleogram and Mel Spectrogram during training the model.
The implementation of this study is conducted by using TensorFlow deep learning frameworks written in Python, which can be executed on the graphics processing unit (GPU). Our experiment is conducted on the NVIDIA TITAN Xp GPU. The experiment is conducted by using the CNN architectures such as: basic 2DCNN, VGG-16, ResNet-50, ECAPA-TDNN and TitaNet architectures which are discussed on the Table 1, Table 2 and Table 3 and in the Figure 3 and Figure 5, respectively. For evaluating the performance of the Cochleogram and Mel Spectrogram, separate models are trained for speaker identification and verification on each of the CNN architectures. Separate models are trained for Cochleogram and Mel Spectrogram features during identification and verification. For evaluating the performance of Cochleogram and Mel Spectrogram features at different levels of SNR (−5 dB to 20 dB) and at different types of noises (i.e., Babble, Street and Restaurant noises), a single model is trained for each Cochleogram and Mel Spectrogram features. For evaluating the speaker identification and verification performance of Cochleogram and Mel Spectrogram features without additive noises, a separate model is trained for Cochleogram and Mel Spectrogram features. During conducting our experiment, publicly available python codes are used by customizing into appropriate forms.
During both speaker identification and verification, the models are trained for 20 epochs with a minibatch size of 32. For each of the epochs, the training pairs are re-shuffled. Each of the models used RMSprop optimizer with the minimum learning rate 0.0001 and categorical cross-entropy used as the loss function. The training is performed using the Softmax function. The weights in the models were initialized randomly at the start of the training process, and progressively updated throughout the process. The validation set of the dataset is used for hyper-parameter tuning and early stopping. The speaker identification performance is measured by using accuracy metrics for training, validation and test split of the dataset. Verification performance is measured by using Equal Error Rate (EER) for test split of the dataset.
5.3. Results
This section presents, the result of noise robustness analysis of Cochleogram and Mel Spectrogram features in speaker identification and verification. The performance of Cochleogram and Mel Spectrogram features in speaker identification and verification is presented in the Table 5 and Table 6, respectively. Sample speaker identification performance of both features using VGG-16 architecture is presented graphically as shown in the Figure 6, Figure 7 and Figure 8 for the dataset without additive noise, medium noise and high noise ratio, respectively. For the clarity of the readers, the ratio of noise added to the VoxCeleb1 dataset is classified into three categories such as: low noise ratio (without additive noise), medium noise ratio (10 dB, 15 dB and 20 dB) and high noise ratio (−5 dB, 0 dB and 5 dB). At each level of SNR, the performance of both Cochleogram and Mel Spectrogram features in speaker identification and verification is analyzed and presented in the Table 5 and Table 6, respectively. From the Figure 6, we can see that the speaker identification performance of both Cochleogram and Mel Spectrogram is approximately equal with the dataset without additive noise. Figure 7 presents that Cochleogram features achieved better performance than Mel Spectrogram features on the datasets with medium noise ratio. Figure 8 shows that Cochleogram shows superior performance than Mel Spectrogram features on the datasets with high noise ratio.

Table 5.
Speaker Identification Performance of the Cochleogram vs. Mel Spectrogram with and without additive noises on VoxCeleb1.

Table 6.
Speaker Verification Performance of the Cochleogram vs. Mel Spectrogram with and without additive noises on VoxCeleb1.
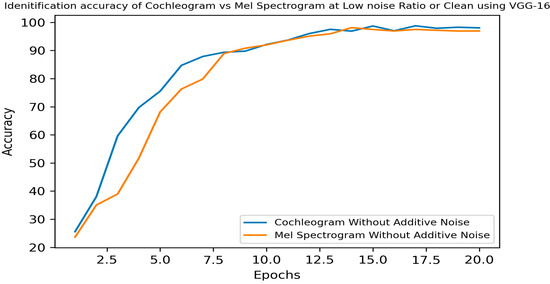
Figure 6.
Speaker identification Accuracy of Cochleogram and Mel Spectrogram at Low Noise Ratio (Without Additive Noise) using VGG-16 Architecture.
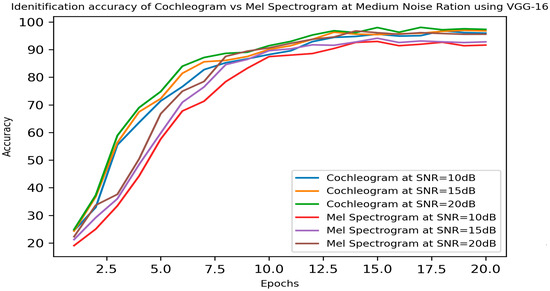
Figure 7.
Speaker Identification Accuracy of Cochleogram vs. Mel Spectrogram at Medium Noise Ratio using VGG-16 Architecture.
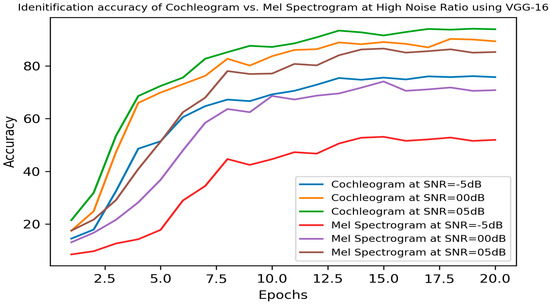
Figure 8.
Speaker identification performance of Cochleogram vs. Mel Spectrogram at high noise ratio using VGG-16.
Table 5 presents more detail about the identification performance of Cochleogram and Mel Spectrogram at different ratio of noise and using different types of deep learning architectures such as: (Basic 2DCNN, VGG-16, ResNet-50, TDNN and TitaNet). In the Table 5, the results show that the Cochleogram features achieved superior performance than Mel Spectrogram features on the dataset with high noise ratio. For example, the accuracy of Cochleogram features using VGG-16 at SNR of −5 dB 0 dB and 5 dB is 75.77%, 89.38% and 93.94% which is much better than the accuracy of Mel Spectrogram features at SNR of −5 dB, 0 dB and 5 dB which is 51.96%, 70.82% and 85.3%. The results in the Table 5, also shows that Cochleogram features achieved better performance than Mel Spectrogram features on the dataset with medium noise ratio. For example, the accuracy of Cochleogram using VGG-16 at SNR of 10 dB, 15 dB and 20 dB is 95.96%, 96.79% and 97.32%, respectively, which is better than the accuracy of Mel Spectrogram at SNR of 10 dB, 15 dB and 20 dB which is 91.64%, 92.81 and 95.77%, respectively. On the dataset without additive noise, Cochleogram features achieved comparative accuracy with Mel Spectrogram features. The accuracy of Cochleogram and Mel Spectrogram using VGG-16 network is 98% and 97%, which is comparatively approximate. Generally, Cochleogram features achieved better performance than Mel Spectrogram features in speaker identification on the noisy datasets.
Table 6, presents the Speaker verification performance of both Cochleogram and Mel Spectrogram features at SNR level from −5 dB to 20 dB using deep learning architectures which is discussed at Table 1, Table 2 and Table 3, at Figure 3 and Figure 5. The results in the Table 6, show that Cochleogram features have superior performance than Mel Spectrogram features in speaker verification at the high noise ratio (−5 dB, 0 dB and 5 dB) in the dataset. For instance, using VGG-16 architecture Cochleogram features achieved an EER of 15.42%, 12.86% and 9.10% at the SNR level −5 dB, 0 dB and 5 dB, respectively, which is minimum error rate compared to the EER of Mel Spectrogram at similar SNR level which is 18.83%, 15.71% and 11.92%. Cochleogram features also shows better performance than Mel Spectrogram feature in speaker verification at the medium noise ratio and without additive noise in the dataset. For example, VGG-16 architecture in the Table 6 show that Cochleogram achieved an EER of 7.95%, 6.61% and 4.55% at SNR level of 10 dB, 15 dB and 20 dB which is minimum error rate compared to the EER of Mel Spectrogram at similar SNR level which is 9.74%, 8.37% and 5.86% at 10 dB, 15 dB and 20 dB.
Generally, the results in the Table 3 and Table 4 show that Cochleogram features achieved superior performance in both speaker identification and verification on the noisy data compared to the Mel Spectrogram features. In addition, in the improved deep learning architectures the Cochleogram features performance also shows better performance.
The comparison of the speaker identification and verification performance of the Cochleogram features with the existing works is presented in the Table 7. The baselines such as: CNN-256-Pair Selection [27], CNN [24], Adaptive VGG-M [28], CNN-LDE [29], ECAPA-TDNN [9], and TitaNet [10] are selected for the comparison with the experiment results of our work. The results in the Table 7, show that Cochleogram features have better performance in speaker identification and verification in the noisy condition. For instance, the identification accuracy of Cochleogram features using architectures ResNet-50, VGG-16, ECAPA-TDNN and TitaNet is 97.85%, 98.04%, 97.89% and 98.02%, respectively, which is better than the performance of the baselines CNN [24], Adaptive VGG-M [28] and CNN-LDE [29] with the accuracies 92.10%, 95.31% and 95.70%, respectively. Similarly, Cochleogram features also achieved better performance in speaker verification compared to Mel Spectrogram features. For example, ECAPA-TDNN and TitaNet architectures using Cochleogram features achieved an EER of 0.61% and 0.54% which is error rate of the Mel Spectrogram features which is 0.87% and 0.68%.

Table 7.
Comparison of Speaker Identification and Verification Performance of Cochleogram with existing works.
Generally, the experiment results of this study and the comparison of results of this study with the existing works show that Cochleogram features have superior performance than Mel Spectrogram feature in deep learning-based speaker identification and verification on the high noise ratio in the dataset. It also has better and comparative performance with the Mel Spectrogram features on the medium noise ratio and low noise ratio in the dataset, respectively.
6. Conclusions
In this study, we have analyzed noise robustness of Cochleogram and Mel Spectrogram features in speaker identification and verification. The deep learning model networks such as: basic 2DCNN, ResNet-50, VGG-16, ECAPA-TDNN and TitaNet architectures are used for conducting our experiment. The input for deep learning architectures is generated from the VoxCeleb1 audio dataset and noise added VoxCeleb1 datasets. The noise added VoxCeleb1 dataset is obtained by adding three different types of noises (i.e., Babble noise, Street noise and Restaurant noise) at the SNR level from −5 dB to 20 dB. The Cochleogram and Mel Spectrogram features which is used for training and testing the models are generated from the VoxCeleb1 and noise added VoxCeleb1 datasets. For each of the deep learning architectures, separate models are trained for speaker identification and verification evaluation. The performance is evaluated using accuracy metrics during identification and using EER during verification. The analysis results of both Cochleogram and Mel Spectrogram features in speaker identification and verification shows that Cochleogram features performs superior to Mel Spectrogram features at high noise ratio (i.e., at SNR = −5 dB, 0 dB and 5 dB). The performance of Cochleogram features is also better than Mel Spectrogram at medium noise ratio (i.e., at SNR = 10 dB, 15 dB and 20 dB) during both speaker identification and verification. At clean dataset or dataset without additive noise both Mel Spectrogram and Cochleogram features achieved comparative performance in speaker identification and verification. The comparison of performance of Cochleogram features in speaker identification and verification with existing works also shows that Cochleogram has better performance than Mel Spectrogram features at noisy condition using similar deep learning model architectures. In conclusion, Cochleogram features has better performance than Mel Spectrogram features in deep learning-based speaker recognition at high and medium noise ratio in the dataset. In the future, this study can be extended by fusion of Cochleogram features with different types of features in order to improve the speaker recognition performance at real world conditions by incorporating the advantages of different types of features.
Author Contributions
The manuscript was written, and the experiment was conducted by W.L. The manuscript is supervised, reviewed and edited by R.S. and W.J. All authors have read and agreed to the published version of the manuscript.
Funding
This research got support under the annual funding track [GRANT 2432] from Deanship of Scientific Research, King Faisal University, Saudi Arabia. This research got support under the Post Graduate Studies program, Adama Science and Technology University, Ethiopia.
Institutional Review Board Statement
Not applicable.
Informed Consent Statement
Not applicable.
Data Availability Statement
The datasets generated and/or analyzed during this study is available at the URL: https://www.robots.ox.ac.uk/~vgg/data/voxceleb/vox1.html (accessed on 21 March 2022). Required hardware and software for our experiment is available.
Acknowledgments
The authors acknowledge the Deanship of Scientific Research, Vice Presidency for Graduate Studies and Scientific Research at King Faisal University, Saudi Arabia, for financial support under the annual funding track [GRANT 2432]. The authors acknowledge Adama Science and Technology University for financial support under Post Graduate Studies program. We thank the academic editors and anonymous reviewers for their kind suggestions and valuable comments.
Conflicts of Interest
The authors declare no conflict of interest.
References
- Beigi, H. Speaker Recognition. In Encyclopedia of Cryptography, Security and Privacy; Springer: Berlin, Germnay, 2021. [Google Scholar]
- Liu, J.; Chen, C.P.; Li, T.; Zuo, Y.; He, P. An overview of speaker recognition. Trends Comput. Sci. Inf. Technol. 2019, 4, 1–12. [Google Scholar]
- Nilu, S.; Khan, R.A.; Raj, S. Applictions of Speaker Recognition; Elsevier: Arunachal Pradesh, India, 2012. [Google Scholar]
- Paulose, S.; Mathew, D.; Thomas, A. Performance Evaluation of Different Modeling Methods and Classifiers with MFCC and IHC Features for Speaker Recognition. Procedia Comput. Sci. 2017, 115, 55–62. [Google Scholar] [CrossRef]
- Tamazin, M.; Gouda, A.; Khedr, M. Enhanced Automatic Speech Recognition System Based on Enhancing Power-Normalized Cepstral Coefficients. Appl. Sci. 2019, 9, 2166. [Google Scholar] [CrossRef]
- Liang, H.; Sun, X.; Sun, Y.; Gao, Y. Text feature extraction based on deeplearning: A review. EURASIP J. Wirel. Commun. Netw. 2017, 2017, 211. [Google Scholar] [CrossRef] [PubMed]
- Zhao, X.; Wang, D. Analyzing noise robustness of MFCC and GFCC features in speaker identification. In Proceedings of the 2013 IEEE International Conference on Acoustics, Speech and Signal Processing, Vancouver, BC, Canada, 26–31 May 2013. [Google Scholar]
- Gua, J.; Wang, Z.; Kuen, J.; Ma, L.; Shahroudy, A. Recent Advances in Convolutional Neural Networks. arXiv 2017, arXiv:1512.07108v6. [Google Scholar] [CrossRef]
- Desplanques, B.; Thienpondt, J.; Demuynck, K. ECAPA-TDNN: Emphasized Channel Attention, Propagation and Aggregation in TDNN Based Speaker Verification. arXiv 2020, arXiv:2005.07143v3. [Google Scholar]
- Koluguri, N.R.; Park, T.; Ginsburg, B. Titanet: Neural model for speaker representation with 1d depth-wise eparable convolutions and global context. arXiv 2021, arXiv:2110.04410v1. [Google Scholar]
- Shao, Y.; Wang, D. Robust speaker identification using auditory features and computational auditory scene analysis. In Proceedings of the 2008 IEEE International Conference on Acoustics, Speech and Signal Processing, Las Vegas, NV, USA, 31 March–4 April 2008. [Google Scholar]
- Zhao, X.; Wang, Y.; Wang, D. Robust speaker identification in noisy and reverberant conditions. In Proceedings of the 2014 IEEE International Conference on Acoustics, Speech and Signal Processing (ICASSP), Florence, Italy, 4–9 May 2014. [Google Scholar]
- Jeevan, M.; Dhingra, A.; Hanmandlu, M.; Panigrahi, B. Robust Speaker Verification Using GFCC Based i-Vectors. Lect. Notes Electr. Eng. 2017, 395, 85–91. [Google Scholar]
- Mobiny, A.; Najarian, M. Text Independent Speaker Verification Using LSTM Networks. arXiv 2018, arXiv:1805.00604v3. [Google Scholar]
- Torfi, A.; Dawson, J.; Nasrabadi, N.M. Text-independent speaker verification using 3D convolutional neural network. In Proceedings of the 2018 IEEE International Conference on Multimedia and Expo (ICME), San Diego, CA, USA, 23–27 July 2018. [Google Scholar]
- Salvati, D.; Drioli, C.; Foresti, G.L. End-to-End Speaker Identification in Noisy and Reverberant Environments Using Raw Waveform Convolutional Neural Networks. Interspeech 2019, 2019, 4335–4339. [Google Scholar]
- Khdier, H.Y.; Jasim, W.M.; Aliesawi, S.A. Deep Learning Algorithms based Voiceprint Recognition System in Noisy Environment. J. Phys. 2021, 1804, 012042. [Google Scholar] [CrossRef]
- Bunrit, S.; Inkian, T.; Kerdprasop, N.; Kerdprasop, K. Text-Independent Speaker Identification Using Deep Learning Model of Convolution Neural Network. Int. J. Mach. Learn. Comput. 2019, 9, 143–148. [Google Scholar] [CrossRef]
- Meftah, A.H.; Mathkour, H.; Kerrache, S.; Alotaibi, Y.A. Speaker Identification in Different Emotional States in Arabic and English. IEEE Access 2020, 8, 60070–60083. [Google Scholar] [CrossRef]
- Nagrani, A.; Chung, J.S.; Xie, W.; Zisserman, A. Voxceleb: Large-scale speaker verification in the wild. Comput. Speech Lang. 2019, 60, 101027. [Google Scholar] [CrossRef]
- Ye, F.; Yang, J. A Deep Neural Network Model for Speaker Identification. Appl. Sci. 2021, 11, 3603. [Google Scholar] [CrossRef]
- Tjandra, A.; Sakti, S.; Neubig, G.; Toda, T.; Adriani, M.; Nakamura, S. Combination of two-dimensional cochleogram and spectrogram features for deep learning-based ASR. In Proceedings of the 2015 IEEE International Conference on Acoustics, Speech and Signal Processing (ICASSP), South Brisbane, QLD, Australia, 19–24 April 2015. [Google Scholar]
- Ahmed, S.; Mamun, N.; Hossain, M.A. Cochleagram Based Speaker Identification Using Noise Adapted CNN. In Proceedings of the 2021 5th International Conference on Electrical Engineering and Information & Communication Technology (ICEEICT), Dhaka, Bangladesh, 18–20 November 2021. [Google Scholar]
- Tabibi, S.; Kegel, A.; Lai, W.K.; Dillier, N. Investigating the use of a Gammatone filterbank for a cochlear implant coding strategy. J. Neurosci. Methods 2016, 277, 63–74. [Google Scholar] [CrossRef] [PubMed]
- Nagrani, A.; Chung, J.S.; Zisserman, A. VoxCeleb: A large-scale speaker identification dataset. arXiv 2018, arXiv:1706.08612v2. [Google Scholar]
- Ellis, D. Noise. 26 October 2022. Available online: https://www.ee.columbia.edu/~dpwe/sounds/noise/ (accessed on 9 July 2022).
- Salehghaffari, H. Speaker Verification using Convolutional Neural Networks. arXiv 2018, arXiv:1803.05427v2. [Google Scholar]
- Kim, S.-H.; Park, Y.-H. Adaptive Convolutional Neural Network for Text-Independent Speaker Recognition. Interspeech 2021, 2021, 66–70. [Google Scholar]
- Cai, W.; Chen, J.; Li, M. Exploring the Encoding Layer and Loss Function in End-to-End Speaker and Language Recognition System. arXiv 2018, arXiv:1804.05160v1. [Google Scholar]
Disclaimer/Publisher’s Note: The statements, opinions and data contained in all publications are solely those of the individual author(s) and contributor(s) and not of MDPI and/or the editor(s). MDPI and/or the editor(s) disclaim responsibility for any injury to people or property resulting from any ideas, methods, instructions or products referred to in the content. |
© 2022 by the authors. Licensee MDPI, Basel, Switzerland. This article is an open access article distributed under the terms and conditions of the Creative Commons Attribution (CC BY) license (https://creativecommons.org/licenses/by/4.0/).