Abstract
China’s shallow coal resources are gradually diminishing, and deep coal resources have slowly become the main energy source. However, the destruction mechanism and evolution of deep rock formation structure are not clear, which seriously restricts the exploitation and utilization of deep energy. Here, the optimization of the physical parameters and the deformation law of the overlying rock in a deep mine in Shandong Province were studied with an integrated approach including similar simulation, mechanical analysis, numerical simulation, and measurement verification, etc. First, the paper simplified the rock formation and developed a numerical model using the field exploration data; second, we analyzed the mechanical properties of each rock formation, obtaining the key rock formation that affects the surface deformation of the mining area. Furthermore, we tested the physical parameters of rock formation by using the orthogonal test, optimizing the physical parameters of rock formation with the extreme difference, and variance analysis of the orthogonal test results. Then, using FLAC3D, we conducted numerical calculations for strip mining of deep wells with numerous working faces, analyzing the maximum surface subsidence value, the maximum horizontal movement value of ground surface at different mining depths, and the change in the subsidence coefficient. By analyzing the linkage relationship between the surface phenomenon and deep mining, we obtained the optimal mathematical model of the three and the coal seam mining depth, which revealed the linkage law of “deep formation–earth surface”. Finally, the model relationships of the influence boundary value, maximum subsidence value, maximum horizontal movement value, and mining depth for each rock layer were separately established.
1. Introduction
Gradually with the exhaustion of the shallow mineral resources of the Earth, the mining of deep mineral resources has become normal [1,2,3,4]. Uncertainty regarding the failure mechanism and evolution law of the deep rock structure as well as inadequate mining strategy and other factors contribute to the failure of the higher overlaying rock formation. All leads to increasingly serious secondary disasters in mine geology such as rock burst, water inrush of the roof aquifer, damage of surface buildings, deterioration of ecological environment, and so on [5,6,7,8]. The foundation of deep resource development is to study the law of deep science, and the key is to explore the structure and evolution law of deep rock mass. However, under the additional influence of the typical “high stress, high temperature, high osmotic pressure” deposit environment and “strong disturbance” and “strong timeliness” of resource mining, it is difficult to predict and effectively control the movement law of the deep rock mass [9,10].
The key problem in accurately predicting the movement and deformation rule of the deep rock mass is the accurate acquisition of the mechanical parameters of the deep rock mass [11,12,13]. Mechanical parameters of rock mass can effectively participate in the whole dynamic process of the inversion and prediction of the movement and deformation rule of the deep rock mass and energy exchange, and explain the relationship of the surface and surface geological phenomena and deep rock mass deformation, revealing the connection between the mechanism of action of the deep rock mass and kinetic process and the geological disaster formation under the action of coal resources mining in the deep earth [14,15,16,17]. Therefore, it is of great significance to study the optimization of the mechanical parameters of deep rock mass for explaining the scientific mechanism of action of deep earth, and improving the ability of the early warning, prevention, and control of geological disasters [18,19].
Research on the value technique of rock mass mechanical parameters is currently highly active. The most prevalent approaches include empirical, numerical, the rock mechanics test, inversion analysis, etc. [20,21,22,23]. The empirical method can be applied in the absence of experimental conditions and data, but it requires the necessary empirical guidance and is strongly influenced by the regional location [24]. The numerical method has complete research ideas, and can take values from the statistical point of view, but the computational amount is too large [25]. The rock mechanics test method can carry out different tests according to the actual engineering needs to obtain the basic indicators of the parameters of the rock mass mechanics. However, affected by the field environment and test sampling, the values of the parameters of the rock mass mechanics are largely random and uncertain [26]. By utilizing the displacement of the rock body as measured in the field and other data, the inversion analysis method can obtain the comprehensive value of the macroscopic properties of the rock body mechanics [27]. With the continuous development of science and technology and the continuous improvement in theoretical knowledge, the combination of the inversion analysis method and numerical simulation method is becoming more common [28,29,30,31]. However, for the problem of the formation of rock movement under the influence of a deep, large cutting height coal seam, exploration of the optimization method of deep formation mechanical parameters and the explanation of the linkage law of “deep formation and earth surface” still remains lacking.
Taking a mining area in Shandong Province as the research background and using the orthogonal test theory [32,33] and FLAC3D numerical simulation [34], this paper performed the inversion of rock mass mechanical parameters based on the observation of the rock movement and geophysical data of the rock formation of the study area. Through the extreme difference and variance analysis of the test results, we obtained the best mechanical parameters in the study area. Furthermore, we obtained the optimal mathematical model by studying the change rules of the maximum surface subsidence value, the maximum horizontal movement value of ground surface, and the surface subsidence coefficient under different depths. Meanwhile, we explored the maximum subsidence value under the different buried depths and the change rule under the impact on the boundary value of each rock formation subsidence basin. We found the different movement deformation mechanisms of rock formation in different layers. Finally, we revealed the linkage law of the “deep formation–earth surface”, which is of great significance to the prediction of the rock movement deformation, as well as the prevention and control of geological disasters.
2. Study Area
2.1. Geology Overview
The coal-bearing formation of this mine is the Taiyuan Formation and Shanxi Formation, with a total coal-bearing thickness of 245.04 m. There are seven minable layers of coal seams in the area and local coal seams that are 12.86 m thick. Among them, the No. 3 coal in the Shanxi Formation is the main minable coal seam, with an average thickness of 8.50 m, accounting for 66.8% of the total coal seam thickness in the area. It is minable in the whole region, and the thickness of the other layers is not more than 1 m.
All working faces are located in mining Zone 21 with a mining depth of about 784 m, a coal seam dip angle of 9~12°, and mining thickness of about 8.5 m. The 2103, 2105, 2016, 2017 and 2018 working faces were arranged in order from south to north, with mining lengths of 1440 m, 980 m, 1360 m, 920 m, and 1110 m, respectively. The widths of all working faces are 110 m, with the exception of 2107 and 2108, which are 80 m. The width of the residual pillar between the 2105 working surface and 2106 working surface is 140~200 m, while between 2103 and 2105, it is 10 m. The distribution of the 2106, 2107, and 2108 working faces is relatively uniform, and the remaining coal pillars between them are all 110 m. All working surfaces are arranged in Figure 1.
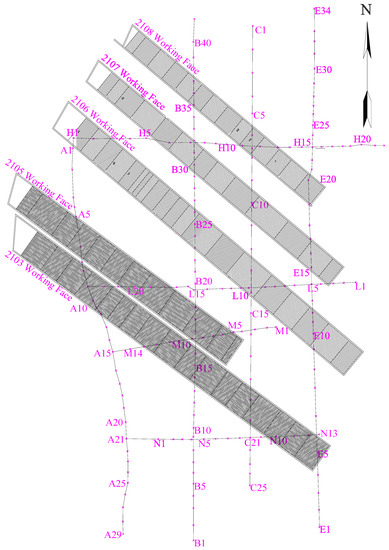
Figure 1.
Distribution map of the monitoring route.
2.2. Surface Movement Observation
During the mining process in mining area 21, the observation stations of surface movement were established. The observation stations were composed of four observation lines in the north–south extension direction and three observation lines in the east–west direction, as shown in Figure 1. The plane coordinates of the observation points were measured by the Network CORS system [35] and the 2-s total station, and the elevation was observed by the Dini03 electronic level produced by the Trimble Company in the USA [36].
2.3. Calculation of the Surface Movement Parameters
By using the software of the probability integral method [37,38,39,40] to invert the rock movement parameters, the parameter inversion calculation was carried out for the measured surface movement observation value, and the maximum surface subsidence and the subsidence factor of the work planes were 0.705 m and 0.083, respectively.
3. Inversion of Mechanical Parameters of Rock Mass by Orthogonal Test
The strip mining face of 2103, 2105, 2106, 2107, and 2108 in this mining area was studied. The mechanical parameters of the rock mass above the study area were tested by the orthogonal test. The optimal mechanical parameters of rock mass in this study area were finally obtained through range analysis and variance analysis.
3.1. Inversion Scheme
According to the comprehensive geological histogram of the working face of the mining area, the mining area of the working face can be roughly divided into three types of rock masses, namely, fine sandstone, sandy mudstone, and loose layer. According to experience, the mechanical parameters of rock mass that have a significant effect on rock mass deformation were mainly considered. The elastic modulus (E), Poisson’s ratio (μ), cohesion (C), and internal friction angle (Φ) of the three types of rock masses participated in the inversion, but not their tensile strength (T) and density (ρ). Because FLAC3D numerical simulation software was used for the simulation, it is necessary to convert the elastic modulus (E) and Poisson’s ratio (μ) into the bulk modulus (K) and shear modulus (G) according to Equation (1) [41]. A total of 12 parameters participated in the inversion. For each of the 12 parameters, three layers of data were collected. The corresponding relationship between the rock mass and the factors is shown in Table 1, and the test factor and level settings are shown in Table 2.

Table 1.
Correspondence between the rock mass and factors.
Table 2.
The tested factors and levels.
In this experiment, the orthogonal design table L27313 was selected as the orthogonal design table of three levels and 13 factors [42]. Among them, the first 12 columns were the 12 parameters involved in the inversion, and the 13th column was used as the error column to participate in the significance test of the orthogonal test. According to the orthogonal design table L27313, the factors of each column of the orthogonal design table and their corresponding test factor levels can be obtained. The different levels were replaced by the corresponding rock mass mechanical values to form the test scheme.
3.2. Test Results
According to the designed test scheme, a FLAC3D numerical simulation calculation was performed in turn to obtain the maximum surface subsidence value (the actual maximum surface subsidence value was 0.705 m) for each test scheme. The test results are shown in Table 3.
Table 3.
Test results.
3.3. Analysis of Inversion Results
As shown in Figure 2 and Table 4, respectively, the test results were analyzed by range analysis and variance analysis. From the range analysis curve, it can be seen that the curve fluctuations of factors C1 and Φ1 were the largest, indicating that these two factors had the greatest influence on the surface subsidence, while the curve fluctuation of factor G3 was the smallest, indicating that this factor had the least influence on the surface subsidence. According to the degree of curve fluctuation and the average maximum surface subsidence value corresponding to each level, the major and minor order of each factor’s influence on surface subsidence and the preferred level can be obtained. However, test errors inevitably exist in the test, and range analysis cannot estimate the magnitude of the test error, so further analysis of the test results is needed, and variance analysis was performed. According to the variance analysis table, when the significance level is 0.05, the factors G1, C1, and Φ1 are significant factors, that is, the influence on the surface subsidence is significant, and other factors are non-significant. The optimal level should be selected for the significant factors, while the non-significant factors can be selected according to the actual situation. Combining range analysis and variance analysis, the optimal level combination of various factors is finally obtained, that is, the best mechanical parameters of each rock mass, as shown in Table 5.
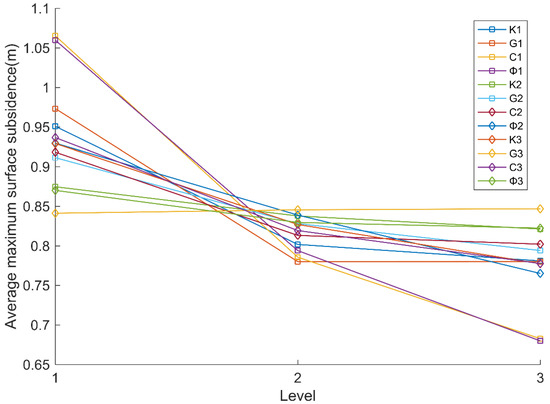
Figure 2.
Surface subsidence value of different factors and levels.
Table 4.
Analysis of variance.
Table 5.
Optimum mechanical parameters of the rock mass.
4. Numerical Simulation Analysis of Surface Subsidence
4.1. Establishment of the Numerical Model
A numerical simulation model was established based on the initial conditions of the mine’s geological data, geological structure, mechanical properties, boundary conditions, and excavation conditions. From the mine data, the coal seam in this coal mine has a small inclination angle, and some rock masses are thin. To reveal the regularity, the appropriate simplifications were performed when establishing the model. It was considered a horizontal coal seam, and the rock mass with the thinner thickness was amalgamated with the adjacent rock mass. The mechanical parameters of each rock mass were selected according to the best mechanical parameters obtained by the orthogonal tests. The mechanical parameters of the coal and rock mass participating in the model calculation are shown in Table 6.
Table 6.
Mechanical parameters of the coal and rock mass.
The model used 3440 m in the X direction and 2900 m in the Y direction. Based on the mining depth of the coal seam, 784 m, 884 m, 984 m, 1084 m, 1184 m, and 1284 m were taken in the Z direction. Five strips were mined, and four coal pillars were reserved. In order to reduce the influence of the boundary effects, the model boundary range was enlarged. To monitor the surface subsidence, monitoring lines were set up along the strike and inclination directions, respectively. Considering the large size of the model and in order to better monitor the surface subsidence, different monitoring point distances were set up. The monitoring points farther away from the excavation area had a larger distance, and the monitoring points closer to the excavation area had a smaller distance. Taking the mining depth of 1284 m as an example, the model established is shown in Figure 3a and the mining face is shown in Figure 3b.
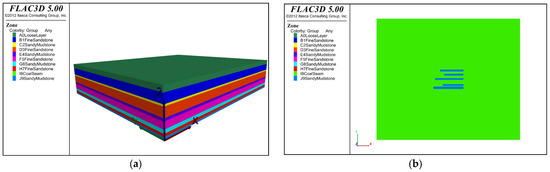
Figure 3.
The FLAC3D numerical model. (a) Numerical model diagram; (b) mining face.
4.2. Determination of Boundary Conditions
According to practical experience, the boundary conditions of the numerical model were determined as follows [43,44]:
- (1)
- Horizontal constraints were imposed on the front, back, and left and right boundaries of the model, and the initial horizontal displacement of the boundary was set to 0.
- (2)
- The gravitational acceleration was set to 9.8 N/cm2, and equilibrium was initially reached when the maximum unbalanced force reached 10–5.
- (3)
- The horizontal and vertical initial displacements of the bottom boundary of the model were all set to 0. The top of the model was set to a free boundary.
5. Analysis of Numerical Simulation Results
5.1. Coal Seam Mining and Surface Deformation
We took the mining depth as an example to study its impact on surface subsidence. Data extraction and processing were performed on the monitoring lines laid out in the FLAC3D numerical model. The surface subsidence and horizontal movement curves at different mining depths were obtained, as shown in Figure 4a,b, respectively. When the mining depth changed from 884 m to 1284 m, the maximum surface subsidence value decreased from 0.734 m to 0.697 m, and the maximum horizontal movement value of ground surface decreased from 0.276 m to 0.256 m. As the mining depth increases, the thickness of the overlying mass gradually increases. When the damage caused by the mining of the coal seam spreads upward, the overlying rock mass first moves and deforms. When the overlying rock mass is thick, the damage is difficult to reach the surface, and the surface subsidence and deformation will become smaller.
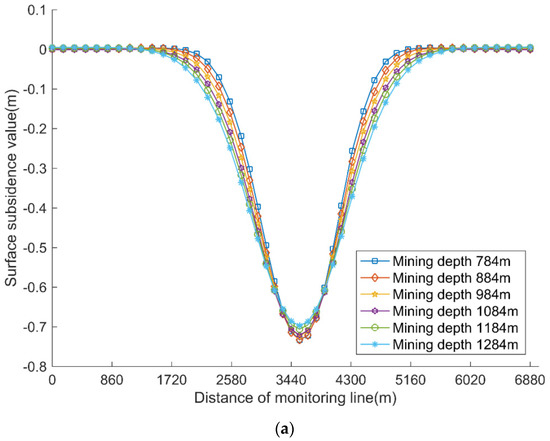
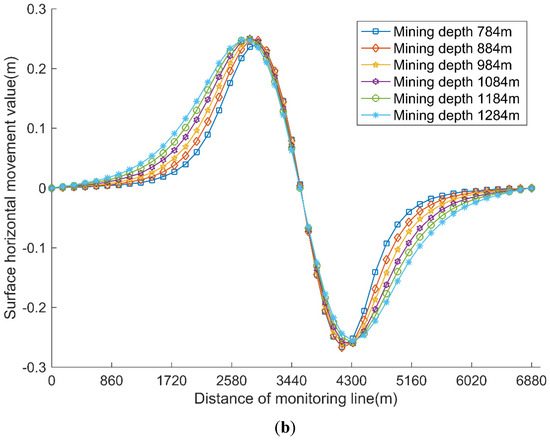
Figure 4.
Surface deformation curves of different mining depths. (a) Surface subsidence curves of different mining depths. (b) Horizontal movement curves of different mining depths.
According to the maximum subsidence value and the maximum horizontal movement value of the ground surface at different mining depths, the regression curves of the maximum subsidence value and the maximum horizontal movement value of the ground surface and the mining depth were drawn (curves 1 and 2, respectively), as shown in Figure 5a,b.
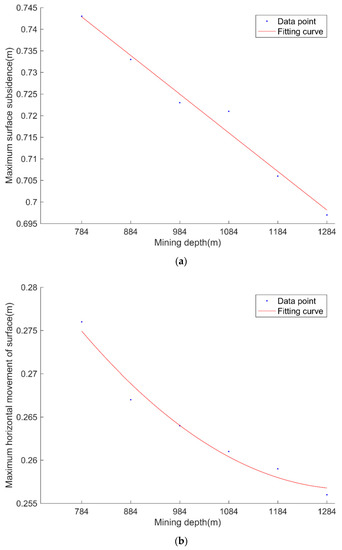
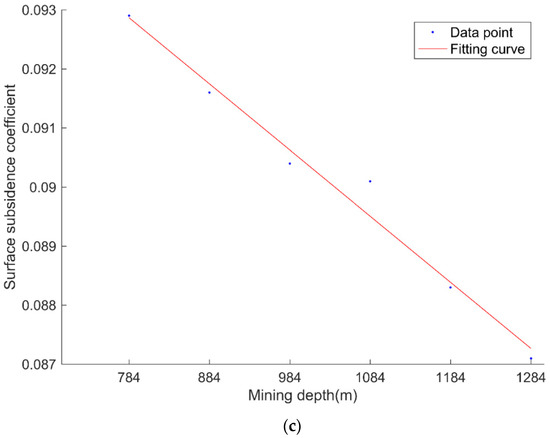
Figure 5.
Fitting curves of the mining depth and surface deformation. (a) Fitting curve of the mining depth and maximum surface subsidence. (b) Fitting curve of the mining depth and maximum horizontal movement value of the ground surface. (c) Fitting curve of the mining depth and surface subsidence coefficient.
In the following formulas, and are the maximum subsidence value and the maximum value of the horizontal movement of the surface, respectively, when they are fully mined. The calculation formulas are as follows:
where q represents the subsidence coefficient; m represents the thickness (mm); b represents the horizontal movement coefficient.
Based on the maximum surface subsidence value, the surface subsidence coefficient could be further calculated, and then a regression curve (curve 3) between the surface subsidence coefficient and the mining depth was drawn, as shown in Figure 5c. The fitting errors of the three regression curves are shown in Table 7.
Table 7.
Function fitting errors of the mining depth and surface deformation.
From the function fitting errors table, it can be seen that the sum of squares due to the error (SSE) and root mean squared error (RMSE) of the three regression curves were close to 0, and the coefficient of determination (R-Square) and degree-of-freedom adjusted coefficient of determination (Adjusted R-Square) of the three regressions were close to 1. This shows that the fitting degree of the three regression curves was better. It can be seen from the regression curve that as the mining depth increased, the maximum surface subsidence value, the maximum horizontal movement value of ground surface, and the surface subsidence coefficient gradually decreased, that is, the maximum surface subsidence value, the maximum horizontal movement value of ground surface, and the surface subsidence coefficient all decreased as the mining depth increased. The relationship between the surface movement and mining depth is shown below.
Fitting function of the mining depth (x) and maximum surface subsidence (y) value:
Fitting function of the mining depth (x) and maximum horizontal movement (y) value of the ground surface:
Fitting function of the mining depth (x) and surface subsidence coefficient (y):
5.2. Internal Deformation Law of Rock Formation in Coal Seam 3 Mining
- (1)
- Fitting function of the maximum subsidence value of rock formation
The maximum subsidence value of each rock formation along the strike center line was extracted, based on the computation results of the numerical simulation following coal seam mining, as shown in Table 8. Sections of each rock formation were made parallel to the x, y plane. The fitting function of the maximum subsidence value of each rock formation was analyzed. After regression analysis of the various function models, the four function equations with the best regression degree were selected to draw the fitting curve successively, as shown in Figure 6.
Table 8.
Maximum subsidence of the rock formations.
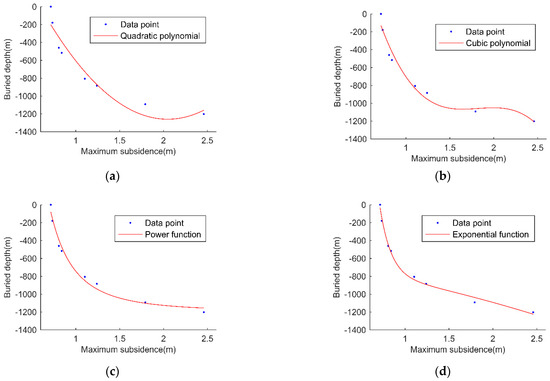
Figure 6.
Fitting curve of the maximum subsidence value of the rock formation. (a) Quadratic polynomial fitting curve. (b) Cubic polynomial fitting curve. (c) Power function fitting curve. (d) Exponential function fitting curve.
According to the analysis of the function fitting error as shown in Table 9, the best fit function model is the exponential function, which is consistent with the results of Yue Jiang and Shen-Shen Chi et al. [45,46]. The equation obtained in this paper is as follows.
Table 9.
Function fitting errors of the maximum subsidence value of the rock formation.
Figure 7 shows the analysis of the exponential function equation. The data points were all within the 95% confidence interval. The first derivative of the function equation was less than 0, so the function curve monotonically decreased and was continuous. The second derivative was greater than 0, and the concavity and convexity of the function was concave. The integral curve decreased monotonically, and the function equation curve was on one side of the X axis.
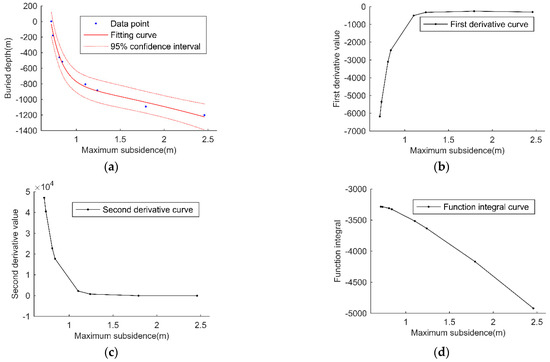
Figure 7.
Analysis of the exponential function equation. (a) The 95% confidence interval of the fitting curve. (b) First derivative of the exponential function equation. (c) Second derivative of the exponential function equation. (d) Integral curve of the exponential function equation.
- (2)
- Fitting function of the subsidence basin boundary within the rock formation
Based on the calculation results of the numerical simulation of coal seam mining, the sections of each rock formation parallel to the x, y plane were made, and the location of the 10 mm subsidence was used as the boundary of the mining influence range. The influence ranges of rock formation mining are shown in Table 10. After analyzing the fitting function of the subsidence basin boundary of each rock formation, through regression analysis of the various function models, four function equations with the best fitting degree were selected to draw the fitting curve in turn, as shown in Figure 8.
Table 10.
Influence range of rock formation mining.
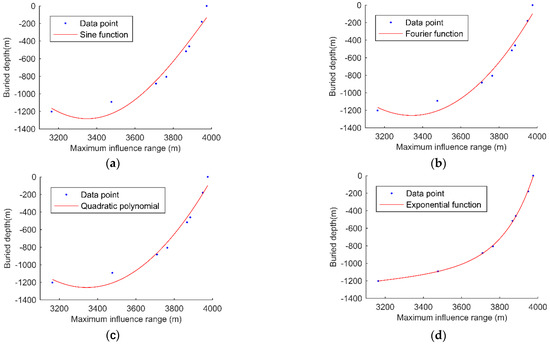
Figure 8.
Fitting curve of the maximum influence range of the rock formation. (a) Sine function fitting curve. (b) Fourier function fitting curve. (c) Quadratic polynomial fitting curve. (d) Exponential function fitting curve.
The fitting errors of each function equation are shown in Table 11.
Table 11.
Function fitting errors of the maximum influence range of the rock formation.
According to the analysis of the function fitting error, the best fitting function model is an exponential function, which is consistent with the results of Jian Cao et al. [47]. The equations obtained in this paper are as follows.
The analysis of the equation for the exponential function is shown in Figure 9. The 95% confidence interval encompassed all of the data points. Since the function equation’s first derivative was larger than 0, the function curve was continuous and monotonically growing. Both the concavity and convexity of the function were convex, and the second derivative was smaller than 0. The function curve lay on one side of the X axis, and the integral curve declined monotonically.
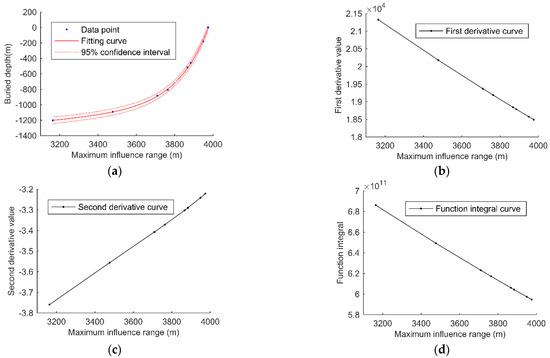
Figure 9.
Analysis of the fitting function. (a) The 95% confidence interval of fitting curve. (b) First derivative of the exponential function equation. (c) Second derivative of the exponential function equation. (d) Integral curve of the exponential function equation.
6. Conclusions
This study revealed the relationship between the surface damage and deep earth rock mass damage and deformation. Meanwhile, the maximum surface subsidence value, the maximum horizontal movement value of ground surface, and the subsidence coefficient decreased with the increase in mining depth. It established the optimal mathematical model between mining depth and the maximum subsidence value, the maximum horizontal movement value of ground surface, and the surface subsidence value, which provides the theoretical basis for safe production in a mining area. Using the FLAC3D numerical simulation calculation, this paper deduced the mechanism of action of the rock mass and kinetic process in deep earth mining. It revealed the deformation and damage rule of the overlying formation under the deep coal seam mining disturbance. The subsidence value and influence boundary value of each rock formation under different mining depths were calculated. Finally, the function model of the mining depth and the maximum subsidence value of each rock formation was obtained, and the formula is as follows: . The mathematical model of the mining depth and the impact boundary angle of each rock formation is as follows: . Therefore, quantitative analysis of the rock movement law under the influence of a deep, large cutting height coal seam was realized.
Author Contributions
Conceptualization, Y.D. and Y.L.; Methodology, Z.J. and H.L.; Software, Y.D. and Z.J.; Validation, Y.D. and Z.J.; Formal analysis, H.L.; Investigation, Y.D. and Z.J.; Resources, Y.L.; Data curation, H.L.; Writing—original draft preparation, Y.D. and Z.J.; Writing—review and editing, Y.L. and H.L.; Visualization, H.L.; Supervision, H.L.; Project administration, Y.L.; Funding acquisition, Y.L. and H.L. All authors have read and agreed to the published version of the manuscript.
Funding
This research was funded by the Natural Science Foundation of Shandong Province, grant numbers ZR2020MD024 and ZR2021QE085. This work was also supported by the China Postdoctoral Science Foundation, grant number 2021M693546.
Data Availability Statement
The data used to support the findings of this study are available from the corresponding author upon request.
Conflicts of Interest
The authors declare no conflict of interest.
References
- Xie, H.; Ju, Y.; Gao, F.; Gao, M.; Zhang, R. Groundbreaking theoretical and technical conceptualization of fluidized mining of deep underground solid mineral resources. Tunn. Undergr. Space Technol. 2017, 67, 67–80. [Google Scholar] [CrossRef]
- Cai, M.; Brown, E.T. Challenges in the Mining and Utilization of Deep Mineral Resources. Engineering 2017, 3, 432–433. [Google Scholar] [CrossRef]
- Liu, Z.; Song, Z.; Ji, H.; Liu, S.; Tan, J.; Cheng, S.; Ning, F. Construction mode and key technology of mining shaft engineering for deep mineral resources. Meitan Xuebao 2021, 46, 826–845. [Google Scholar] [CrossRef]
- Cai, M.; Li, P.; Tan, W.; Ren, F. Key Engineering Technologies to Achieve Green, Intelligent, and Sustainable Development of Deep Metal Mines in China. Engineering 2021, 7, 1513–1517. [Google Scholar] [CrossRef]
- Xia, K.; Chen, C.; Yang, K.; Zhang, H.; Pang, H. A case study on the characteristics of footwall ground deformation and movement and their mechanisms. Nat. Hazards 2020, 104, 1039–1077. [Google Scholar] [CrossRef]
- Antonielli, B.; Sciortino, A.; Scancella, S.; Bozzano, F.; Mazzanti, P. Tracking deformation processes at the legnica glogow copper district (Poland) by satellite insar—I: Room and pillar mine district. Land 2021, 10, 653. [Google Scholar] [CrossRef]
- Zheng, M.; Zhang, H.; Deng, K.; Du, S.; Wang, L. Analysis of pre- And post-mine closure surface deformations in western xuzhou coalfield from 2006 to 2018. IEEE Access. 2019, 7, 124158–124172. [Google Scholar] [CrossRef]
- Zhao, J.; Chen, J.; Zhang, X.; Ning, J.; Zhang, Y. Distribution characteristics of floor pore water pressure based on similarity simulation experiments. Bull. Eng. Geol. Environ. 2020, 79, 4805–4816. [Google Scholar] [CrossRef]
- Xie, H.; Li, C.; Gao, M.; Zhang, R.; Gao, F.; Zhu, J. Conceptualization and preliminary research on deep in situ rock mechanics. Chin. J. Rock Mech. Eng. 2021, 40, 217–232. [Google Scholar] [CrossRef]
- Xie, H.; Gao, M.; Zhang, R.; Chen, L.; Liu, T.; Li, C.; Li, C.; He, Z. Study on concept and progress of in situ fidelity coring of deep rocks. Chin. J. Rock Mech. Eng. 2020, 39, 865–876. [Google Scholar] [CrossRef]
- Wang, Q.; Xu, M.; Zhang, Y.; Cen, X.; Chang, X. Mechanical Parameters of Deep-Buried Coal Goaf Rock Mass Based on Optimized GSI Quantitative Analysis. Adv. Civ. Eng. 2021, 2021, 9935860. [Google Scholar] [CrossRef]
- Yuan, P.; Xu, Y. Zonal Disintegration Mechanism of Deep Rock Masses under Coupled High Axial Geostress and Blasting Load. Shock. Vib. 2018, 2018, 4957917. [Google Scholar] [CrossRef]
- Zhu, Z.; Tian, H.; Mei, G.; Jiang, G.; Dou, B.; Xiao, P. Experimental investigation on mechanical behaviors of Nanan granite after thermal treatment under conventional triaxial compression. Environ. Earth Sci. 2021, 80, 46. [Google Scholar] [CrossRef]
- Xie, H.; Gao, M.; Zhang, R.; Peng, G.; Wang, W.; Li, A. Study on the Mechanical Properties and Mechanical Response of Coal Mining at 1000 m or Deeper. Rock Mech. Rock Eng. 2019, 52, 1475–1490. [Google Scholar] [CrossRef]
- Jinhai, Z.; Xinguo, Z.; Haiyang, P.; Juntao, C. Progressive failure and friction motion characteristics of contact surface of composite rock mass. E3S Web Conf. 2021, 303, 1037. [Google Scholar] [CrossRef]
- Yan, H.; Zhang, J.; Zhang, S.; Zhou, N. Physical modeling of the controlled shaft deformation law during the solid backfill mining of ultra-close coal seams. Bull. Eng. Geol. Environ. 2019, 78, 3741–3754. [Google Scholar] [CrossRef]
- Zhao, J.; Juntao, C.; Huilin, X.; Zhao, Z.; Xinguo, Z. Dynamic Mechanical Response and Movement Evolution Characteristics of Fault Systems in the Coal Mining Process. Pure Appl. Geophys. 2021, 179, 233–246. [Google Scholar] [CrossRef]
- Wang, Q.; Gao, H.; Jiang, B.; Yu, H.; Lv, Y. Real-time method of obtaining rock mechanics parameters based on the core drilling test. Geotech. Test. J. 2020, 43, 480–494. [Google Scholar] [CrossRef]
- Ruan, Y.F.; Gao, C.Q.; Liu, K.W.; Jia, R.G.; Ding, H.T. Inversion of rock and soil mechanics parameters based on particle swarm optimization wavelet support vector machine. Rock Soil Mech. 2019, 40, 3362–3669. [Google Scholar] [CrossRef]
- Vásárhelyi, B.; Kovács, D. Empirical methods of calculating the mechanical parameters of the rock mass. Period. Polytech. Civ. Eng. 2017, 61, 38–50. [Google Scholar] [CrossRef]
- Kang, K.S.; Hu, N.L.; Sin, C.S.; Rim, S.H.; Han, E.C.; Kim, C.N. Determination of the mechanical parameters of rock mass based on a GSI system and displacement back analysis. J. Geophys. Eng. 2017, 14, 939–948. [Google Scholar] [CrossRef]
- Rupar, V.; Čebašek, V.; Milisavljević, V.; Stevanović, D.; Živanović, N. Determination of mechanical properties of altered dacite by laboratory methods. Minerals 2021, 11, 813. [Google Scholar] [CrossRef]
- Zhuang, D.Y.; Ma, K.; Tang, C.A.; Liang, Z.Z.; Wang, K.K.; Wang, Z.W. Mechanical parameter inversion in tunnel engineering using support vector regression optimized by multi-strategy artificial fish swarm algorithm. Tunn. Undergr. Space Technol. 2019, 83, 425–436. [Google Scholar] [CrossRef]
- Zhang, Z.; Yang, Y.; Zhao, X.; Sheng, Q.; Zhu, Z. Empirical methods to determine the rock masses parameters. Chin. J. Rock Mech. Eng. 2016, 35, 3195–3202. [Google Scholar] [CrossRef]
- Cui, Z.; Sheng, Q.; Luo, Q.; Zhang, G. Investigating the anisotropy of mechanical parameters of schist rock with practical numerical methods. Sustainability 2021, 13, 725. [Google Scholar] [CrossRef]
- Zhu, Y.; Li, P. Research Progress of Hoek-Brown Strength Criterion and Determination of Mechanical Parameters of Rock Mass. Mod. Tunn. Technol. 2020, 57, 8–17. [Google Scholar] [CrossRef]
- Zhang, Y.; Su, G.; Li, Y.; Wei, M.; Liu, B. Displacement Back-Analysis of Rock Mass Parameters for Underground Caverns Using a Novel Intelligent Optimization Method. Int. J. Geomech. 2020, 20, 04020035. [Google Scholar] [CrossRef]
- Liu, Q.; Liu, H.; Huang, X.; Pan, Y.; Luo, C.; Sang, H. Inverse Analysis Approach to Identify the Loads on the External TBM Shield Surface and Its Application. Rock Mech. Rock Eng. 2019, 52, 3241–3260. [Google Scholar] [CrossRef]
- Zhang, S.; Qiu, S.; Kou, P.; Li, S.; Li, P.; Yan, S. Investigation of damage evolution in heterogeneous rock based on the grain-based finite-discrete element model. Materials 2021, 14, 3969. [Google Scholar] [CrossRef]
- Ning, Y.; Tang, H.; Smith, J.V.; Zhang, B.; Shen, P.; Zhang, G. Study of the in situ stress field in a deep valley and its influence on rock slope stability in Southwest China. Bull. Eng. Geol. Environ. 2021, 80, 3331–3350. [Google Scholar] [CrossRef]
- Ge, Y.; Tang, H.; Ez Eldin, M.A.M.; Chen, H.; Zhong, P.; Zhang, L.; Fang, K. Deposit characteristics of the Jiweishan rapid long-runout landslide based on field investigation and numerical modeling. Bull. Eng. Geol. Environ. 2019, 78, 4383–4396. [Google Scholar] [CrossRef]
- Zhang, K.; Su, J.; Liu, Z.; Chen, H.; Zhang, Q.; Sun, S. Sensitivity Analysis and Experimental Verification of Bolt Support Parameters Based on Orthogonal Experiment. Shock. Vib. 2020, 2021, 8844282. [Google Scholar] [CrossRef]
- Williams, E.J. Experimental Designs Balanced for the Estimation of Residual Effects of Treatments. Aust. J. Chem. 1949, 2, 149–168. [Google Scholar] [CrossRef]
- Wang, M.; Song, Z.; Zheng, D.; Shen, W.; Gou, P.; Wei, S. Development and application of rock energy dissipation model in FLAC3D. Meitan Xuebao/J. China Coal Soc. 2021, 46, 2565–2573. [Google Scholar] [CrossRef]
- Rodriguez-Lloveras, X.; Puig-Polo, C.; Lantada, N.; Gili, J.A.; Marturià, J. Two decades of GPS/GNSS and DInSAR monitoring of Cardona salt mines (NE of Spain)—Natural and mining-induced mechanisms and processes. Proc. Int. Assoc. Hydrol. Sci. 2020, 382, 167–172. [Google Scholar] [CrossRef]
- Luan, Y.; Dong, Y.; Ma, Y.; Weng, L. Surface and New Building Deformation Analysis of Deep Well Strip Mining. Adv. Mater. Sci. Eng. 2020, 2020, 8727956. [Google Scholar] [CrossRef]
- Shi, M.; Yang, H.; Wang, B.; Peng, J.; Gao, Z.; Zhang, B. Improving boundary constraint of probability integral method in sbas-insar for deformation monitoring in mining areas. Remote Sens. 2021, 13, 1497. [Google Scholar] [CrossRef]
- Wang, L.; Jiang, K.; Wei, T.; Jiang, C.; Zha, J.; Chi, S. Estimation of parameters of probability integral method model based on improved fireworks algorithm. Surv. Rev. 2021, 53, 366–382. [Google Scholar] [CrossRef]
- Li, J.; Yu, X.; Liang, Y.; Chi, S. Parameter solving of probability integral method based on improved genetic algorithm. Teh. Vjesn. 2021, 28, 515–522. [Google Scholar] [CrossRef]
- Wang, L.; Shangjun, Z.; Chuang, J.; Jingyu, L.; Kegui, J.; Chaoqun, T.; Tao, W.; Qing-biao, G. Research on 3D Laser Scanning Monitoring Method for Mining Subsidence Based on the Auxiliary for Probability Integral Method. KSCE J. Civ. Eng. 2021, 25, 4403–4416. [Google Scholar] [CrossRef]
- Ghanem, F.K.; Al Amoush, H.; Al-Tarazi, E. Geotechnical engineering evaluation of superficial deposits utilizing seismic methods at Al al-bayt university, Jordan. Iraqi Geol. J. 2021, 54, 11–28. [Google Scholar] [CrossRef]
- Wie, Y.M.; Lee, K.G.; Lee, K.H.; Ko, T.; Lee, K.H. The experimental process design of artificial lightweight aggregates using an orthogonal array table and analysis by machine learning. Materials 2020, 13, 5570. [Google Scholar] [CrossRef] [PubMed]
- Wang, L.; He, C.; Cui, S.; Wang, F. Numerical Simulation of Surface Movement and Deformation Caused by Underground Mining with Complex Stratigraphic Boundary. Adv. Civ. Eng. 2021, 2021, 9967071. [Google Scholar] [CrossRef]
- Hongze, Z.; Dongyu, W.; Ming, M.; Kaihui, Z. Parameter inversion and location determination of evolutionary weak layer for open-pit mine slope. Int. J. Coal Sci. Technol. 2020, 7, 714–724. [Google Scholar] [CrossRef]
- Yue, J.; Rafał, M.; Krzysztof, T.; Anton, S.; Yan, J. A new prediction model of surface subsidence with Cauchy distribution in the coal mine of thick topsoil condition. Arch. Min. Sci. 2020, 65, 147–158. [Google Scholar] [CrossRef]
- Shenshen, C.; Lei, W.; Xuexiang, Y.; Xinjian, F.; Chuang, J. Research on Prediction Model of Mining Subsidence in Thick Unconsolidated Layer Mining Area. IEEE Access 2021, 9, 23996–24010. [Google Scholar] [CrossRef]
- Jian, C.; Qingxiang, H.; Lingfei, G. Subsidence prediction of overburden strata and ground surface in shallow coal seam mining. Sci. Rep. 2021, 11, 18972. [Google Scholar] [CrossRef]
Disclaimer/Publisher’s Note: The statements, opinions and data contained in all publications are solely those of the individual author(s) and contributor(s) and not of MDPI and/or the editor(s). MDPI and/or the editor(s) disclaim responsibility for any injury to people or property resulting from any ideas, methods, instructions or products referred to in the content. |
© 2022 by the authors. Licensee MDPI, Basel, Switzerland. This article is an open access article distributed under the terms and conditions of the Creative Commons Attribution (CC BY) license (https://creativecommons.org/licenses/by/4.0/).