
Study on the Influence of Groundwater Variation on the Bearing Capacity of Sandy Shallow Foundation

Abstract
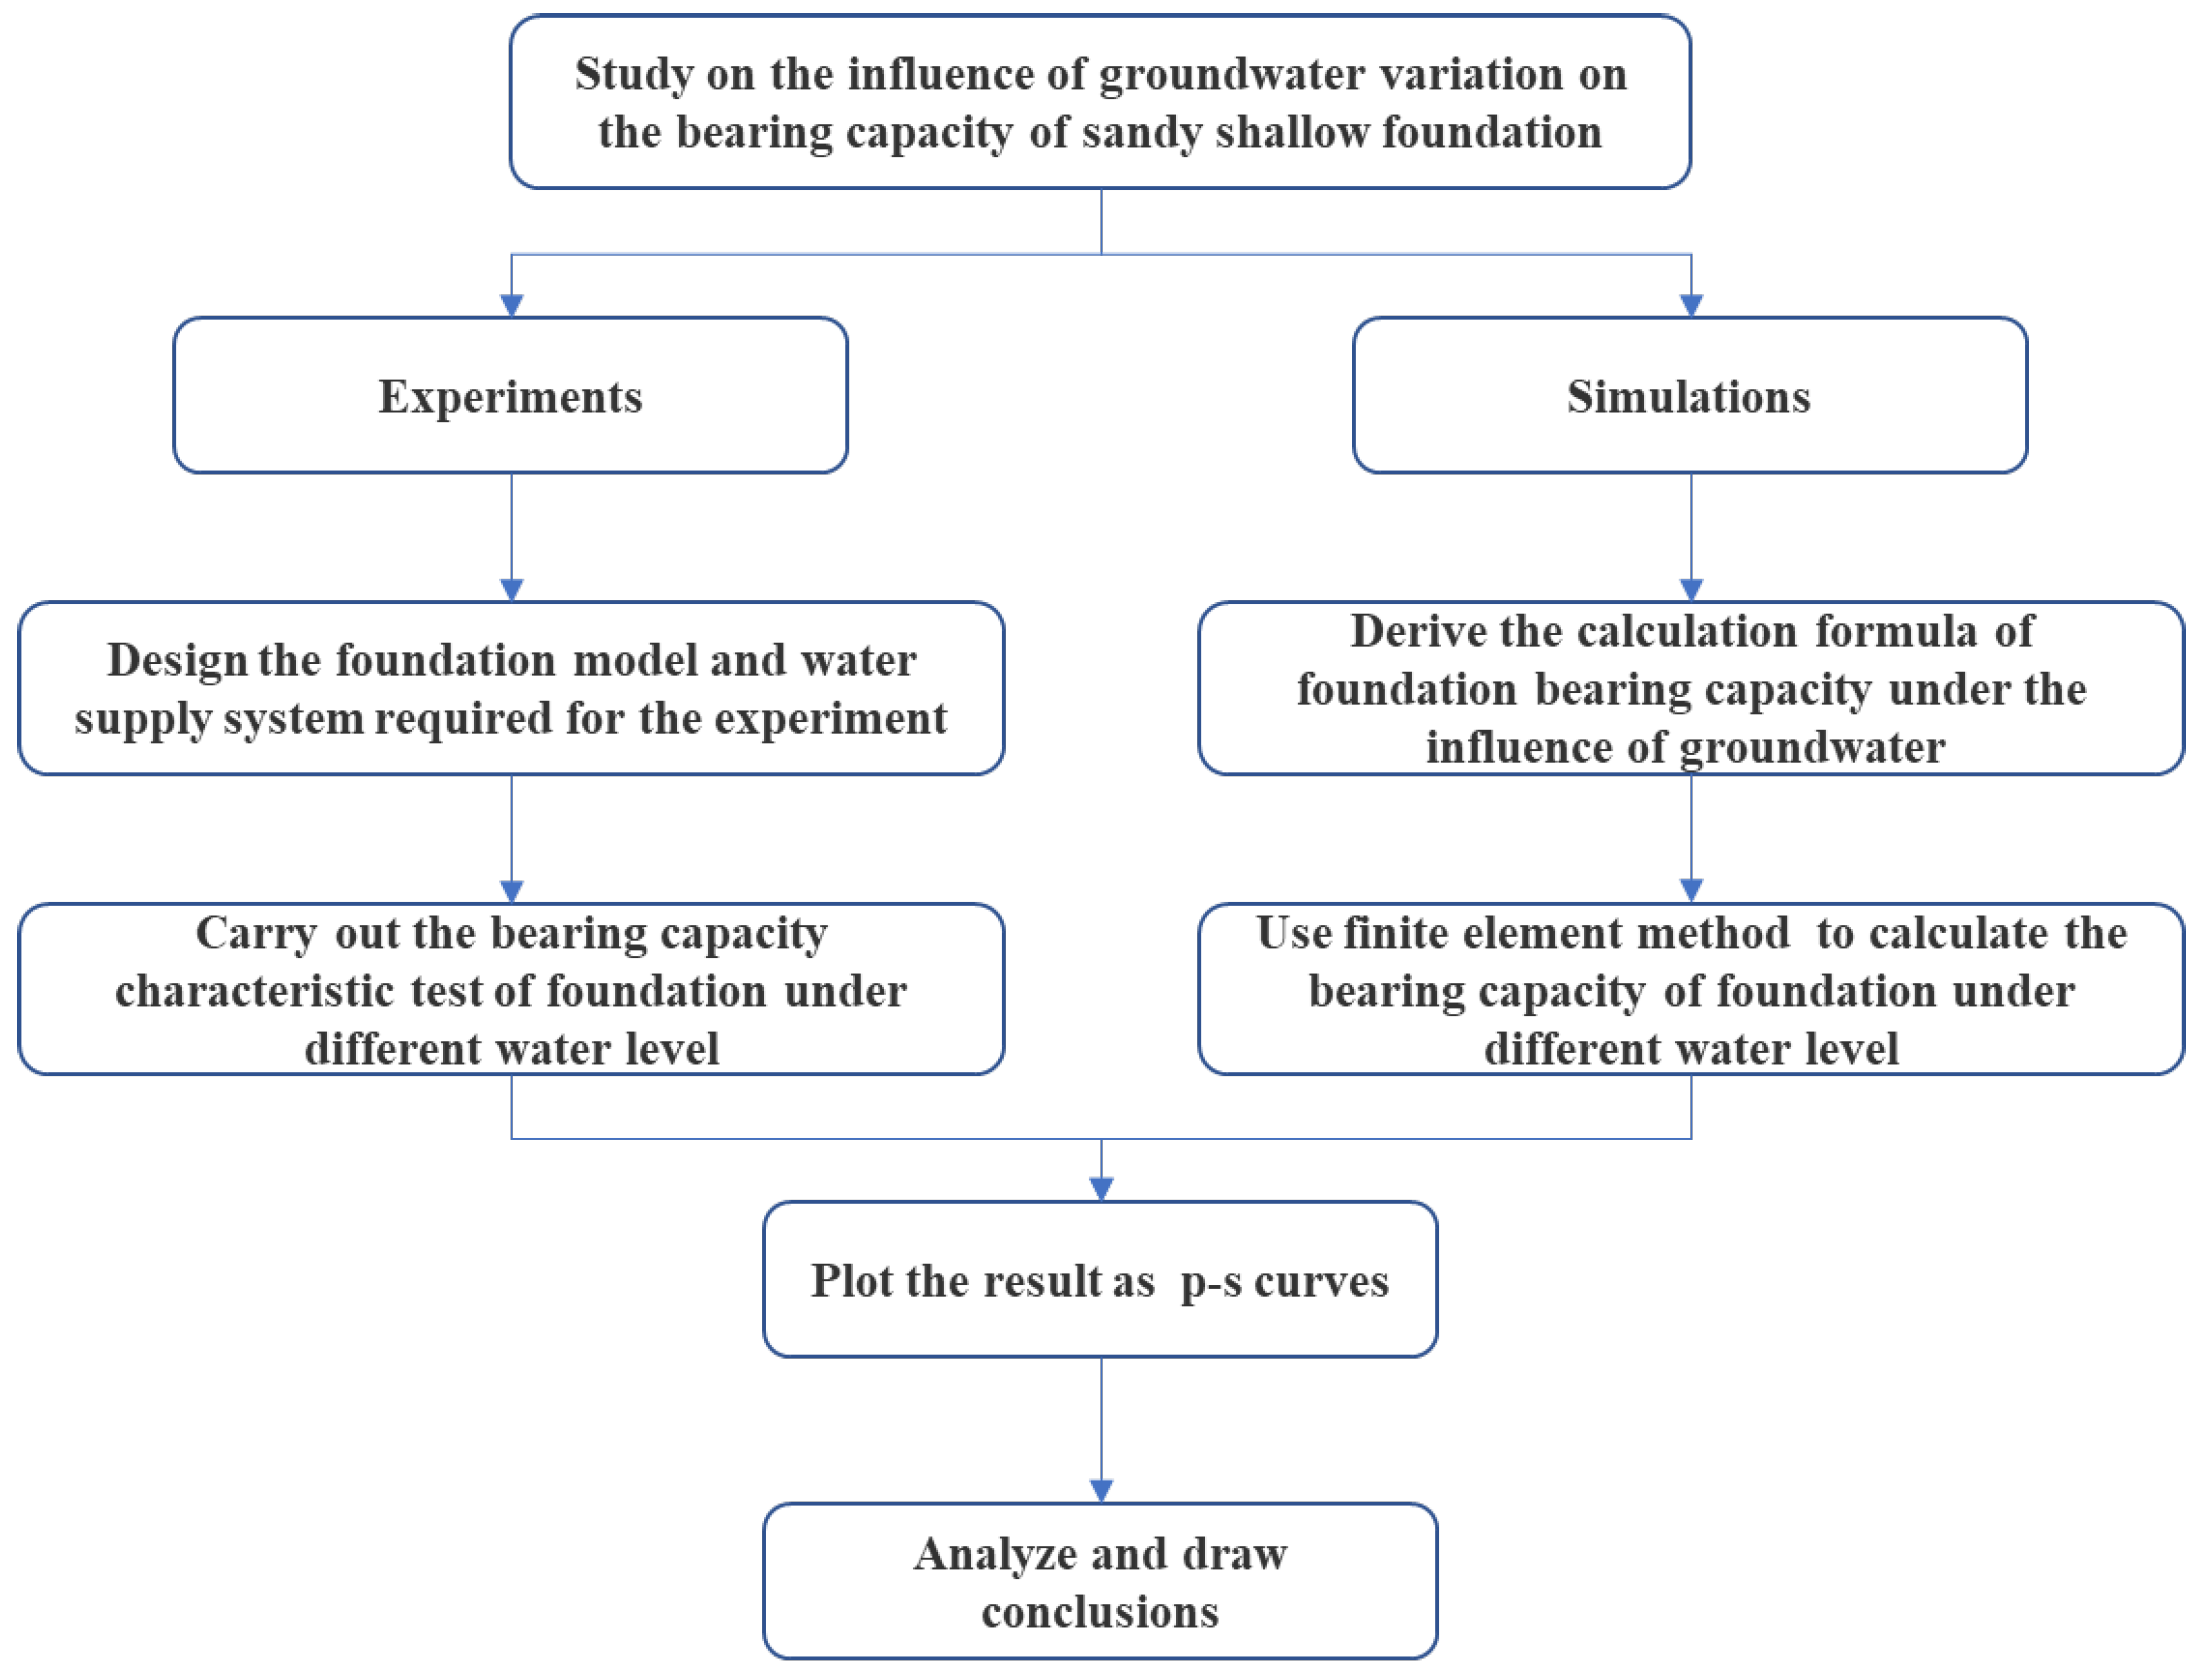
1. Introduction
2. Experimental Tests
2.1. Materials
2.2. Experimental Setup
- (a)
- The model box with transparent glass: Its purpose is to hold the foundation soil. It has an inlet at the bottom to let water in and out. The size of the model box is 1.2 m × 0.6 m × 0.6 m. The bottom of the model is covered with 0.1 m gravel, and the layer above is 0.35 m thick. The water level in the soil can be seen through clear glass because saturated soil is darker than unsaturated soil. The glass is marked with a scale to measure the height from the bottom of the model box to the water level.
- (b)
- Air-pressure control system: It controls the air pressure in the pump to move water in and out of the model box
- (c)
- Water pump: Its purpose is to simulate groundwater.
- (d)
- Loading system. It can apply vertical load to the foundation soil through the loading plate. The loads can be controlled by the loading system.
- (e)
- PIV filming system: It can capture the displacements of foundation soil by using PIV technology.
- (f)
- Data-acquisition system: It shows the displacement change captured by PIV through the color change of the image, so that the final displacement can be calculated.
2.3. Experiment Program
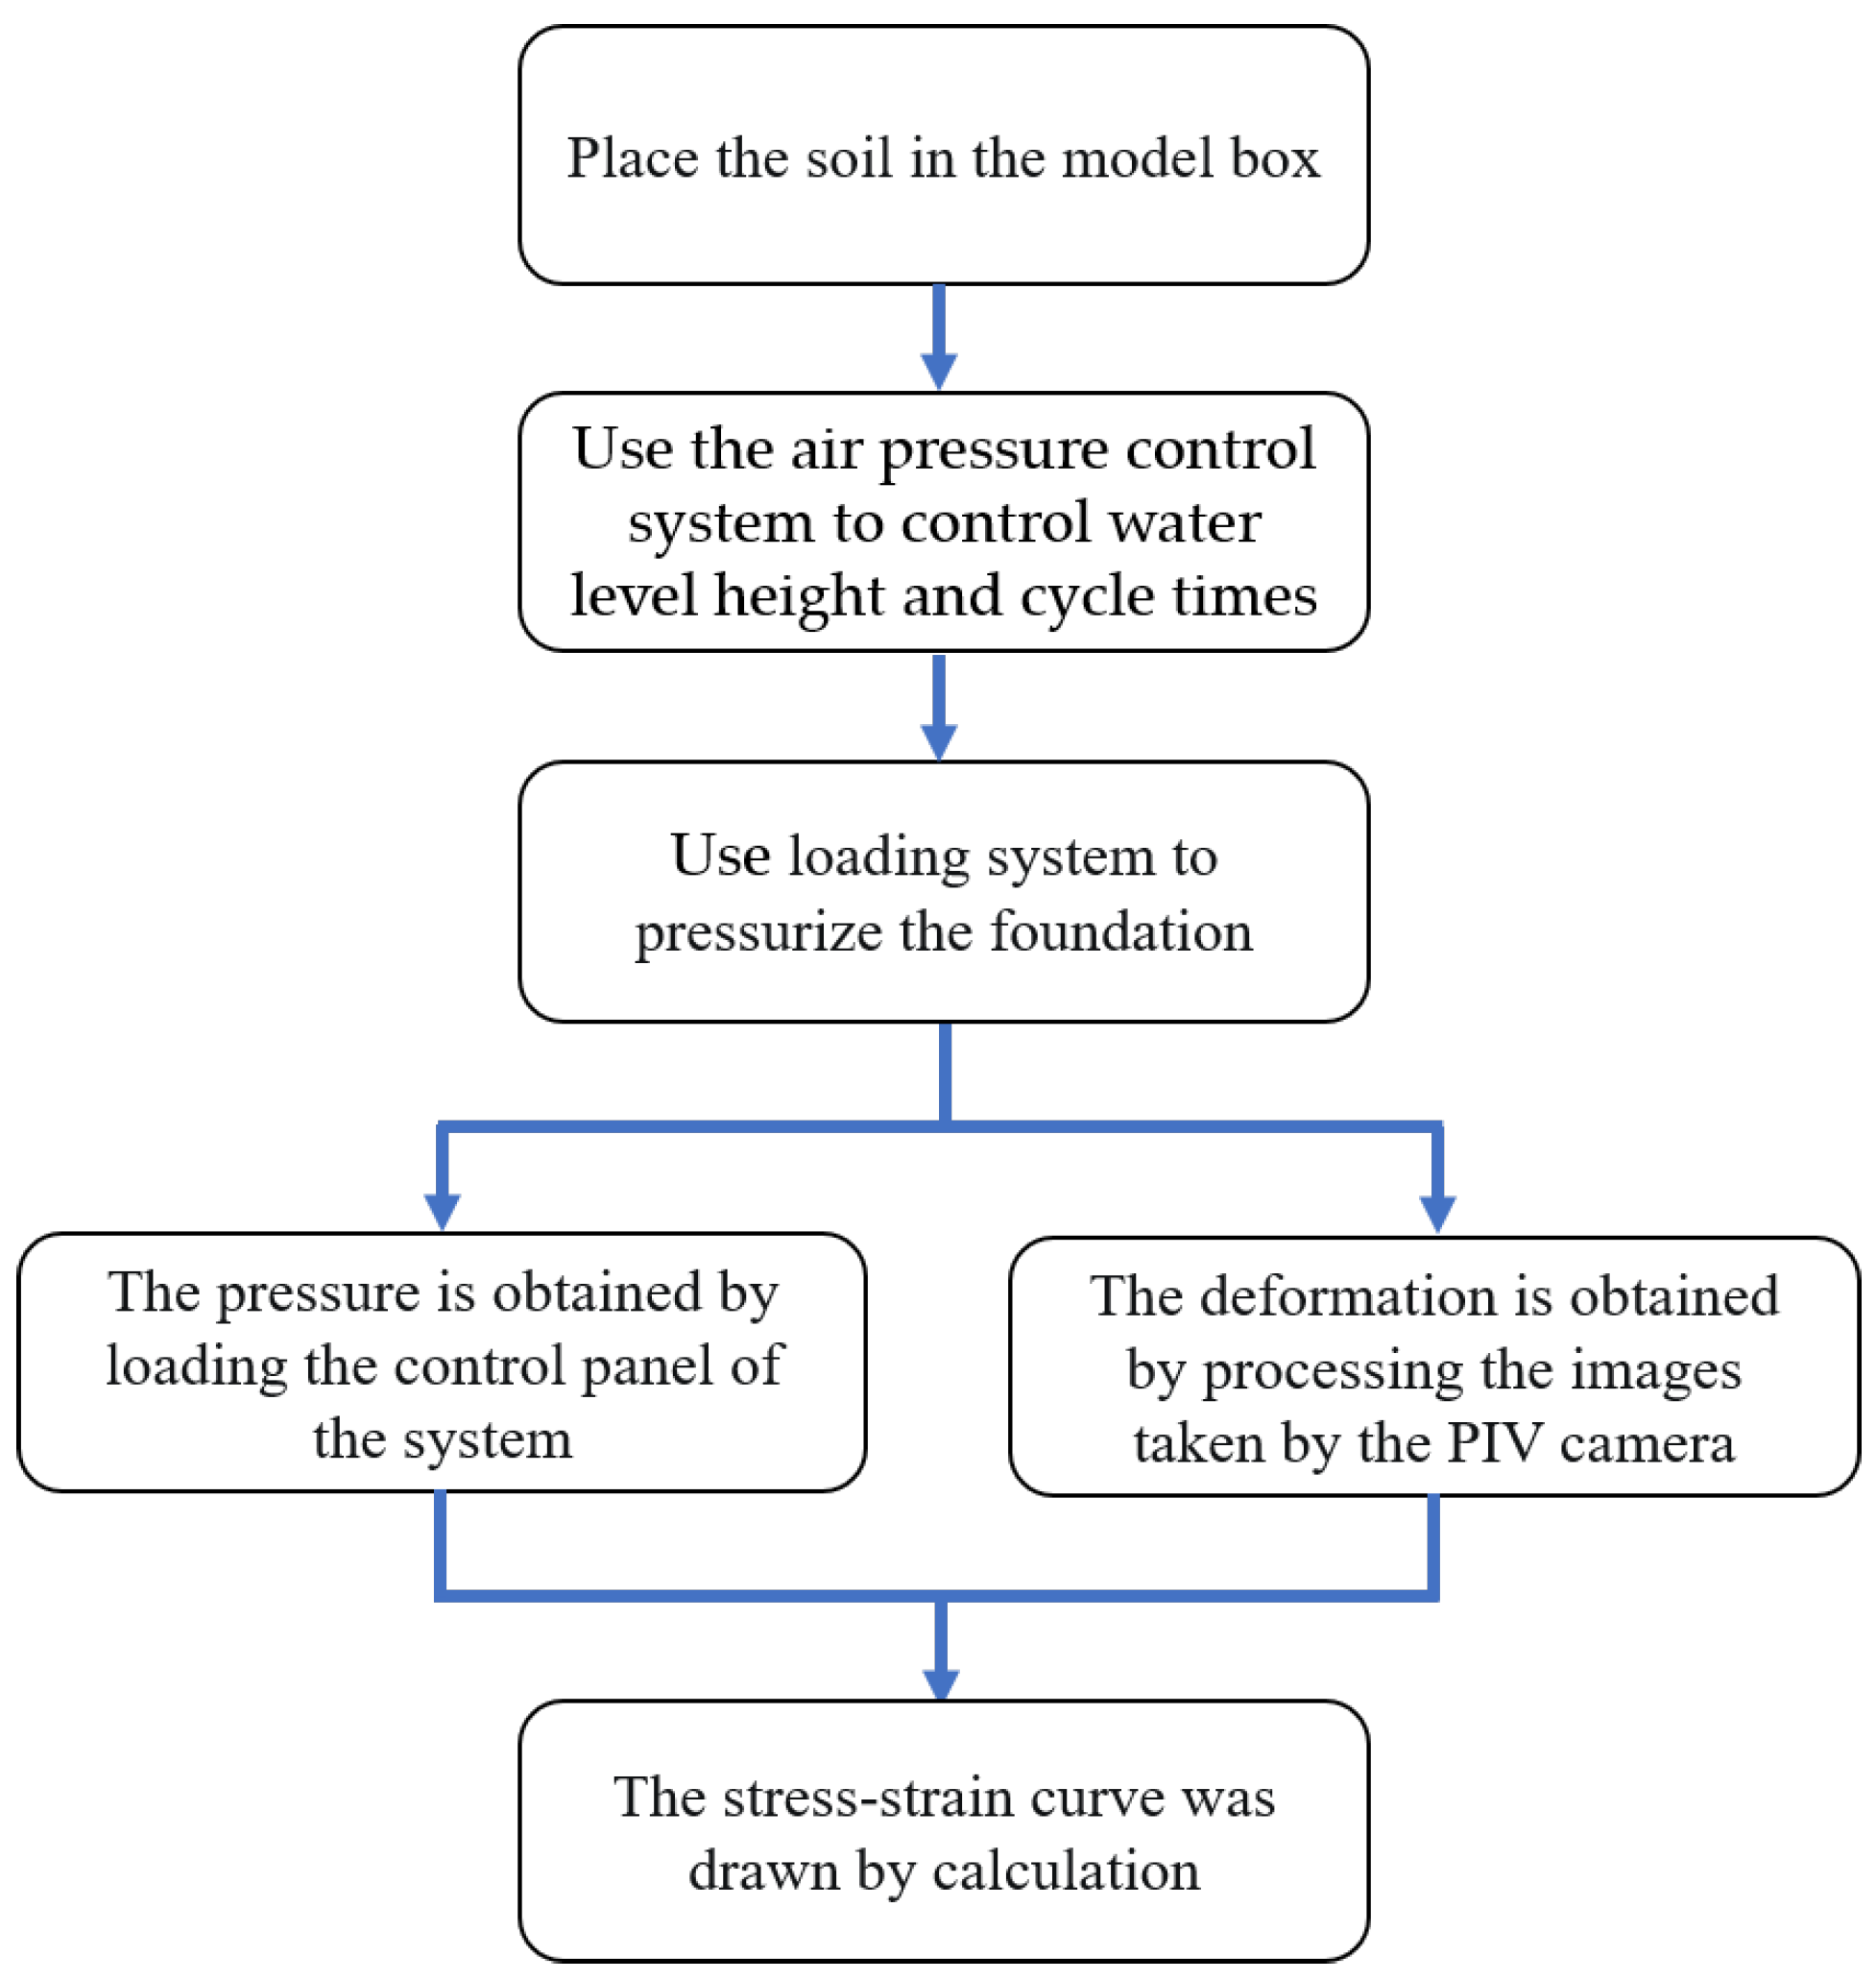
2.4. Test Procedures
- First, lay the gravel blocks into the model box and spread a layer of permeable cloth on the gravel blocks to prevent the upper sand from falling into the gravel blocks. Adjust the water level to soak the gravel blocks [29]. Next, put sandy soil into the model box and compact it.
- Turn on the air-pressure control system and increase the air pressure to raise the water level to the specified height. Then control the air pressure to lower the water level to the initial level and repeat for the specified number of times.
- When the foundation is damaged, stop loading. Record the pressure and save the photos of the PIV shooting system.
- Finally, remove and dry the foundation soil for the next set of tests.
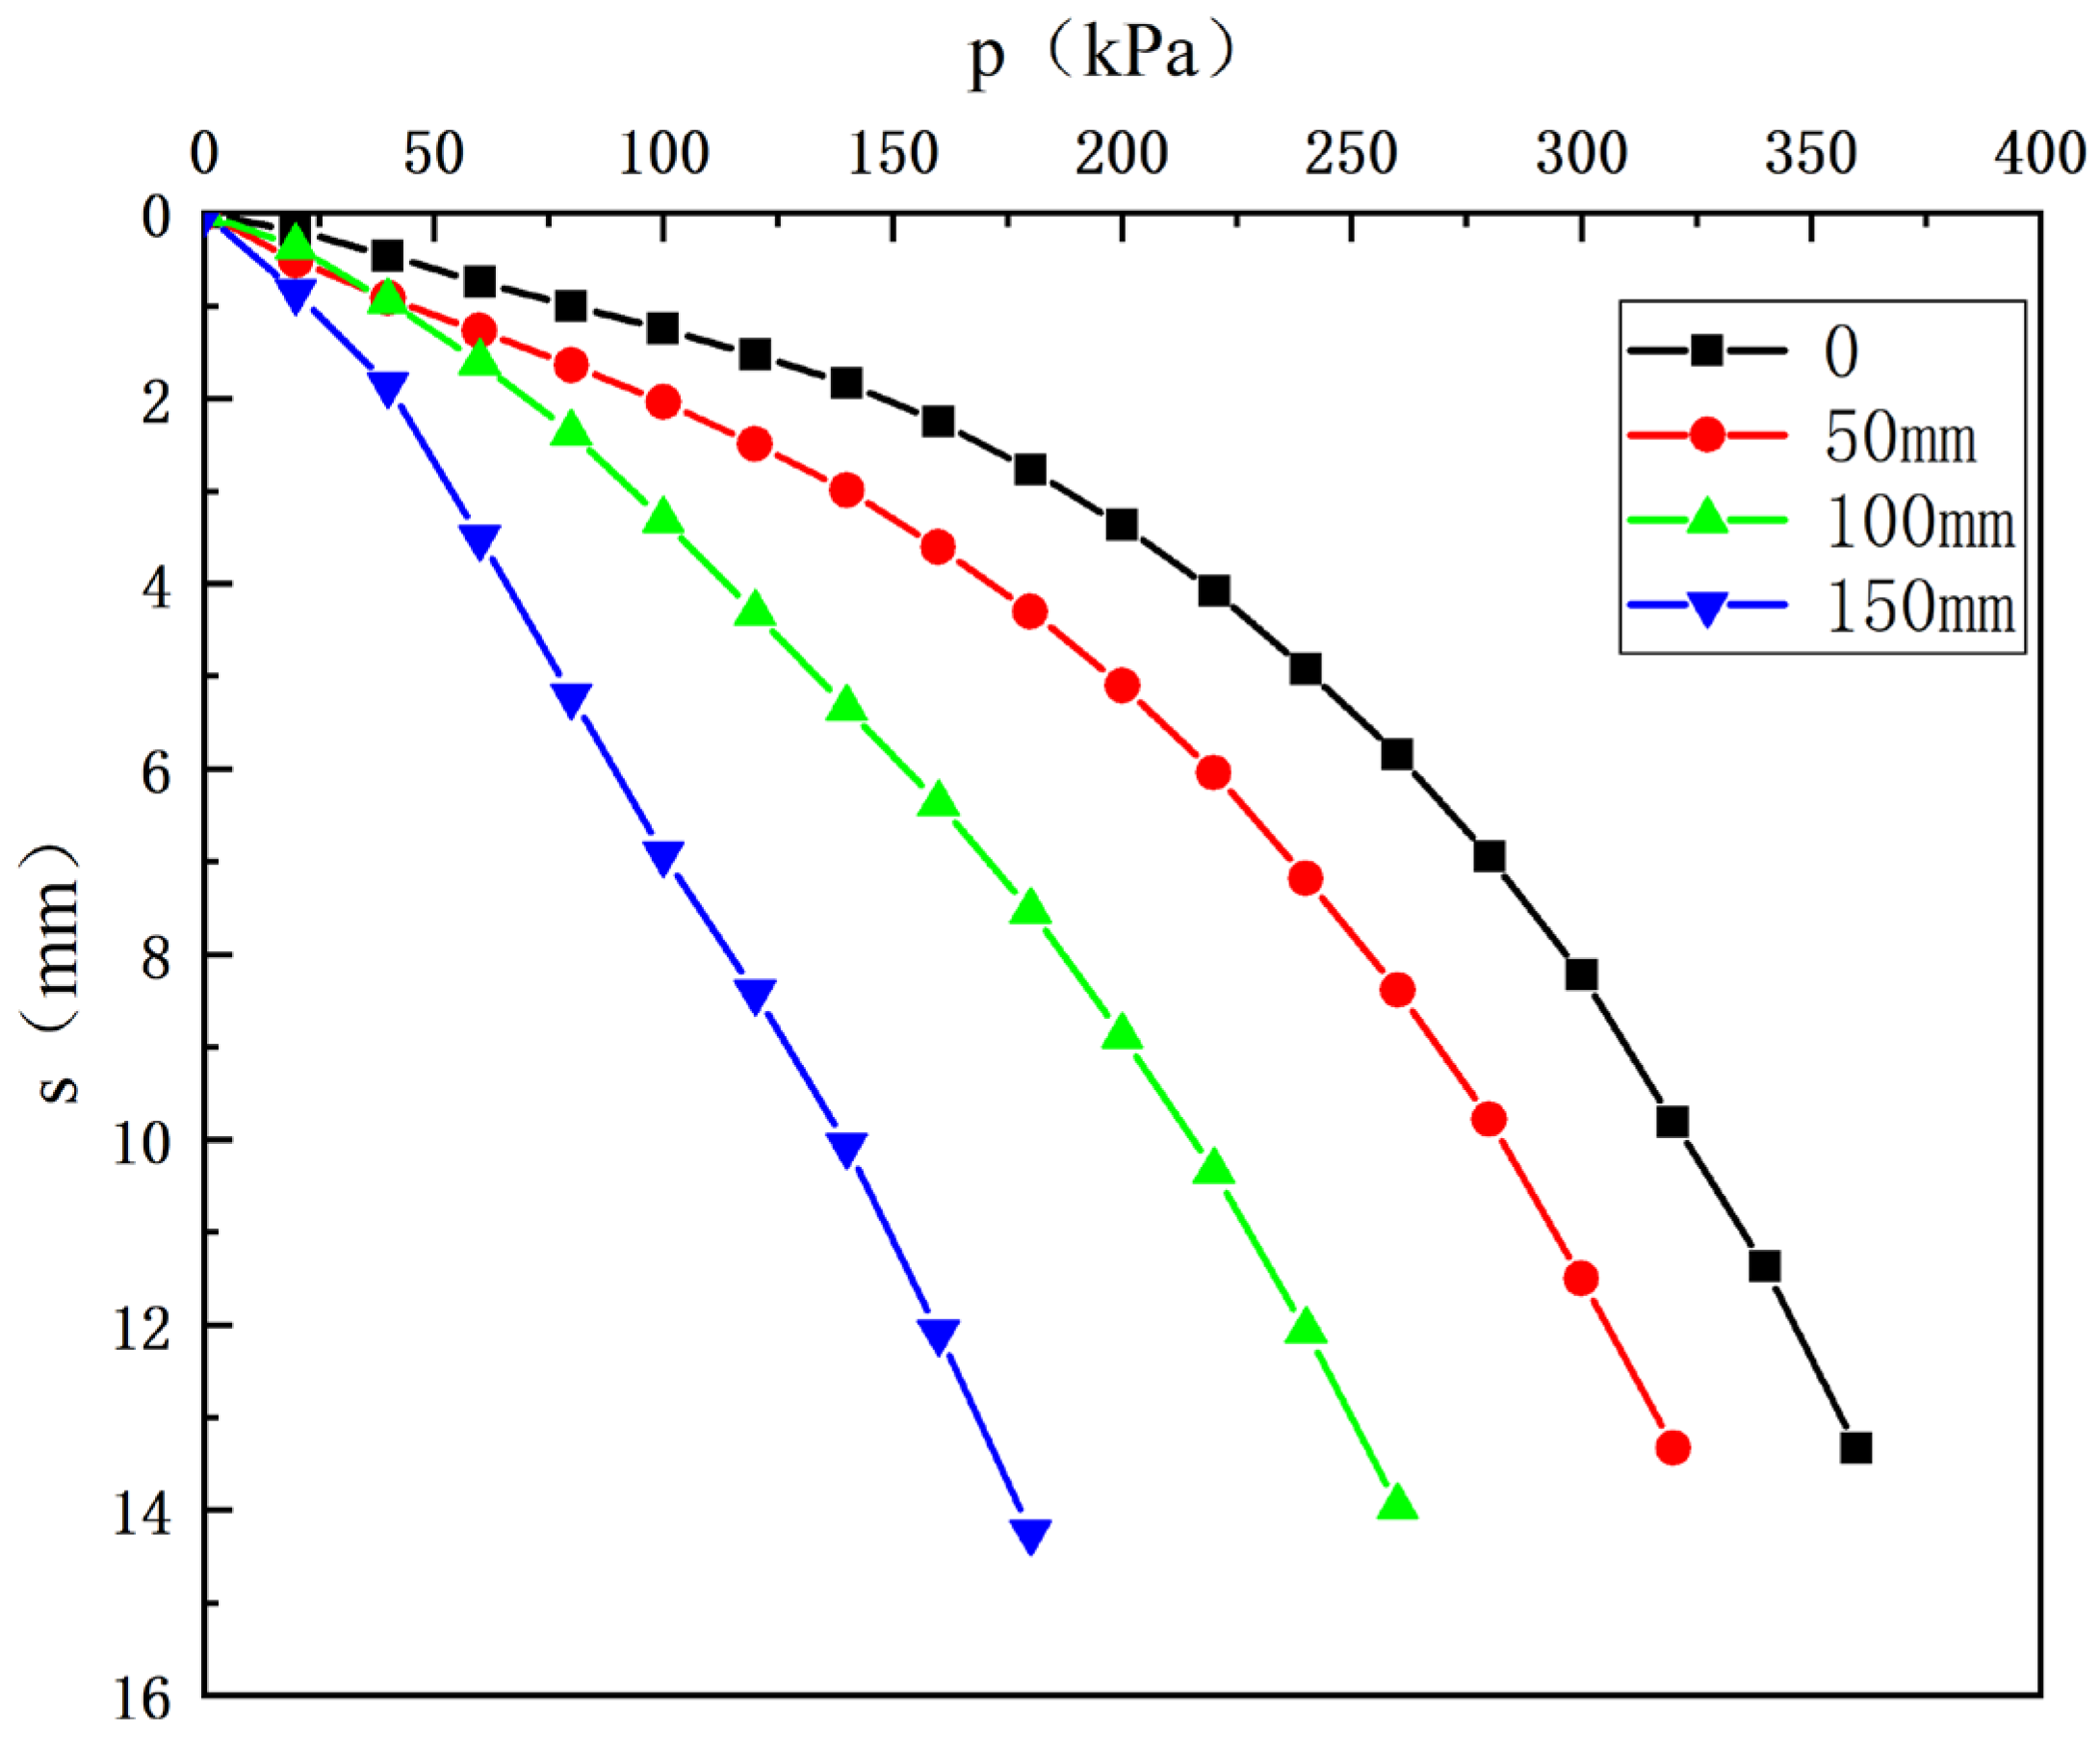
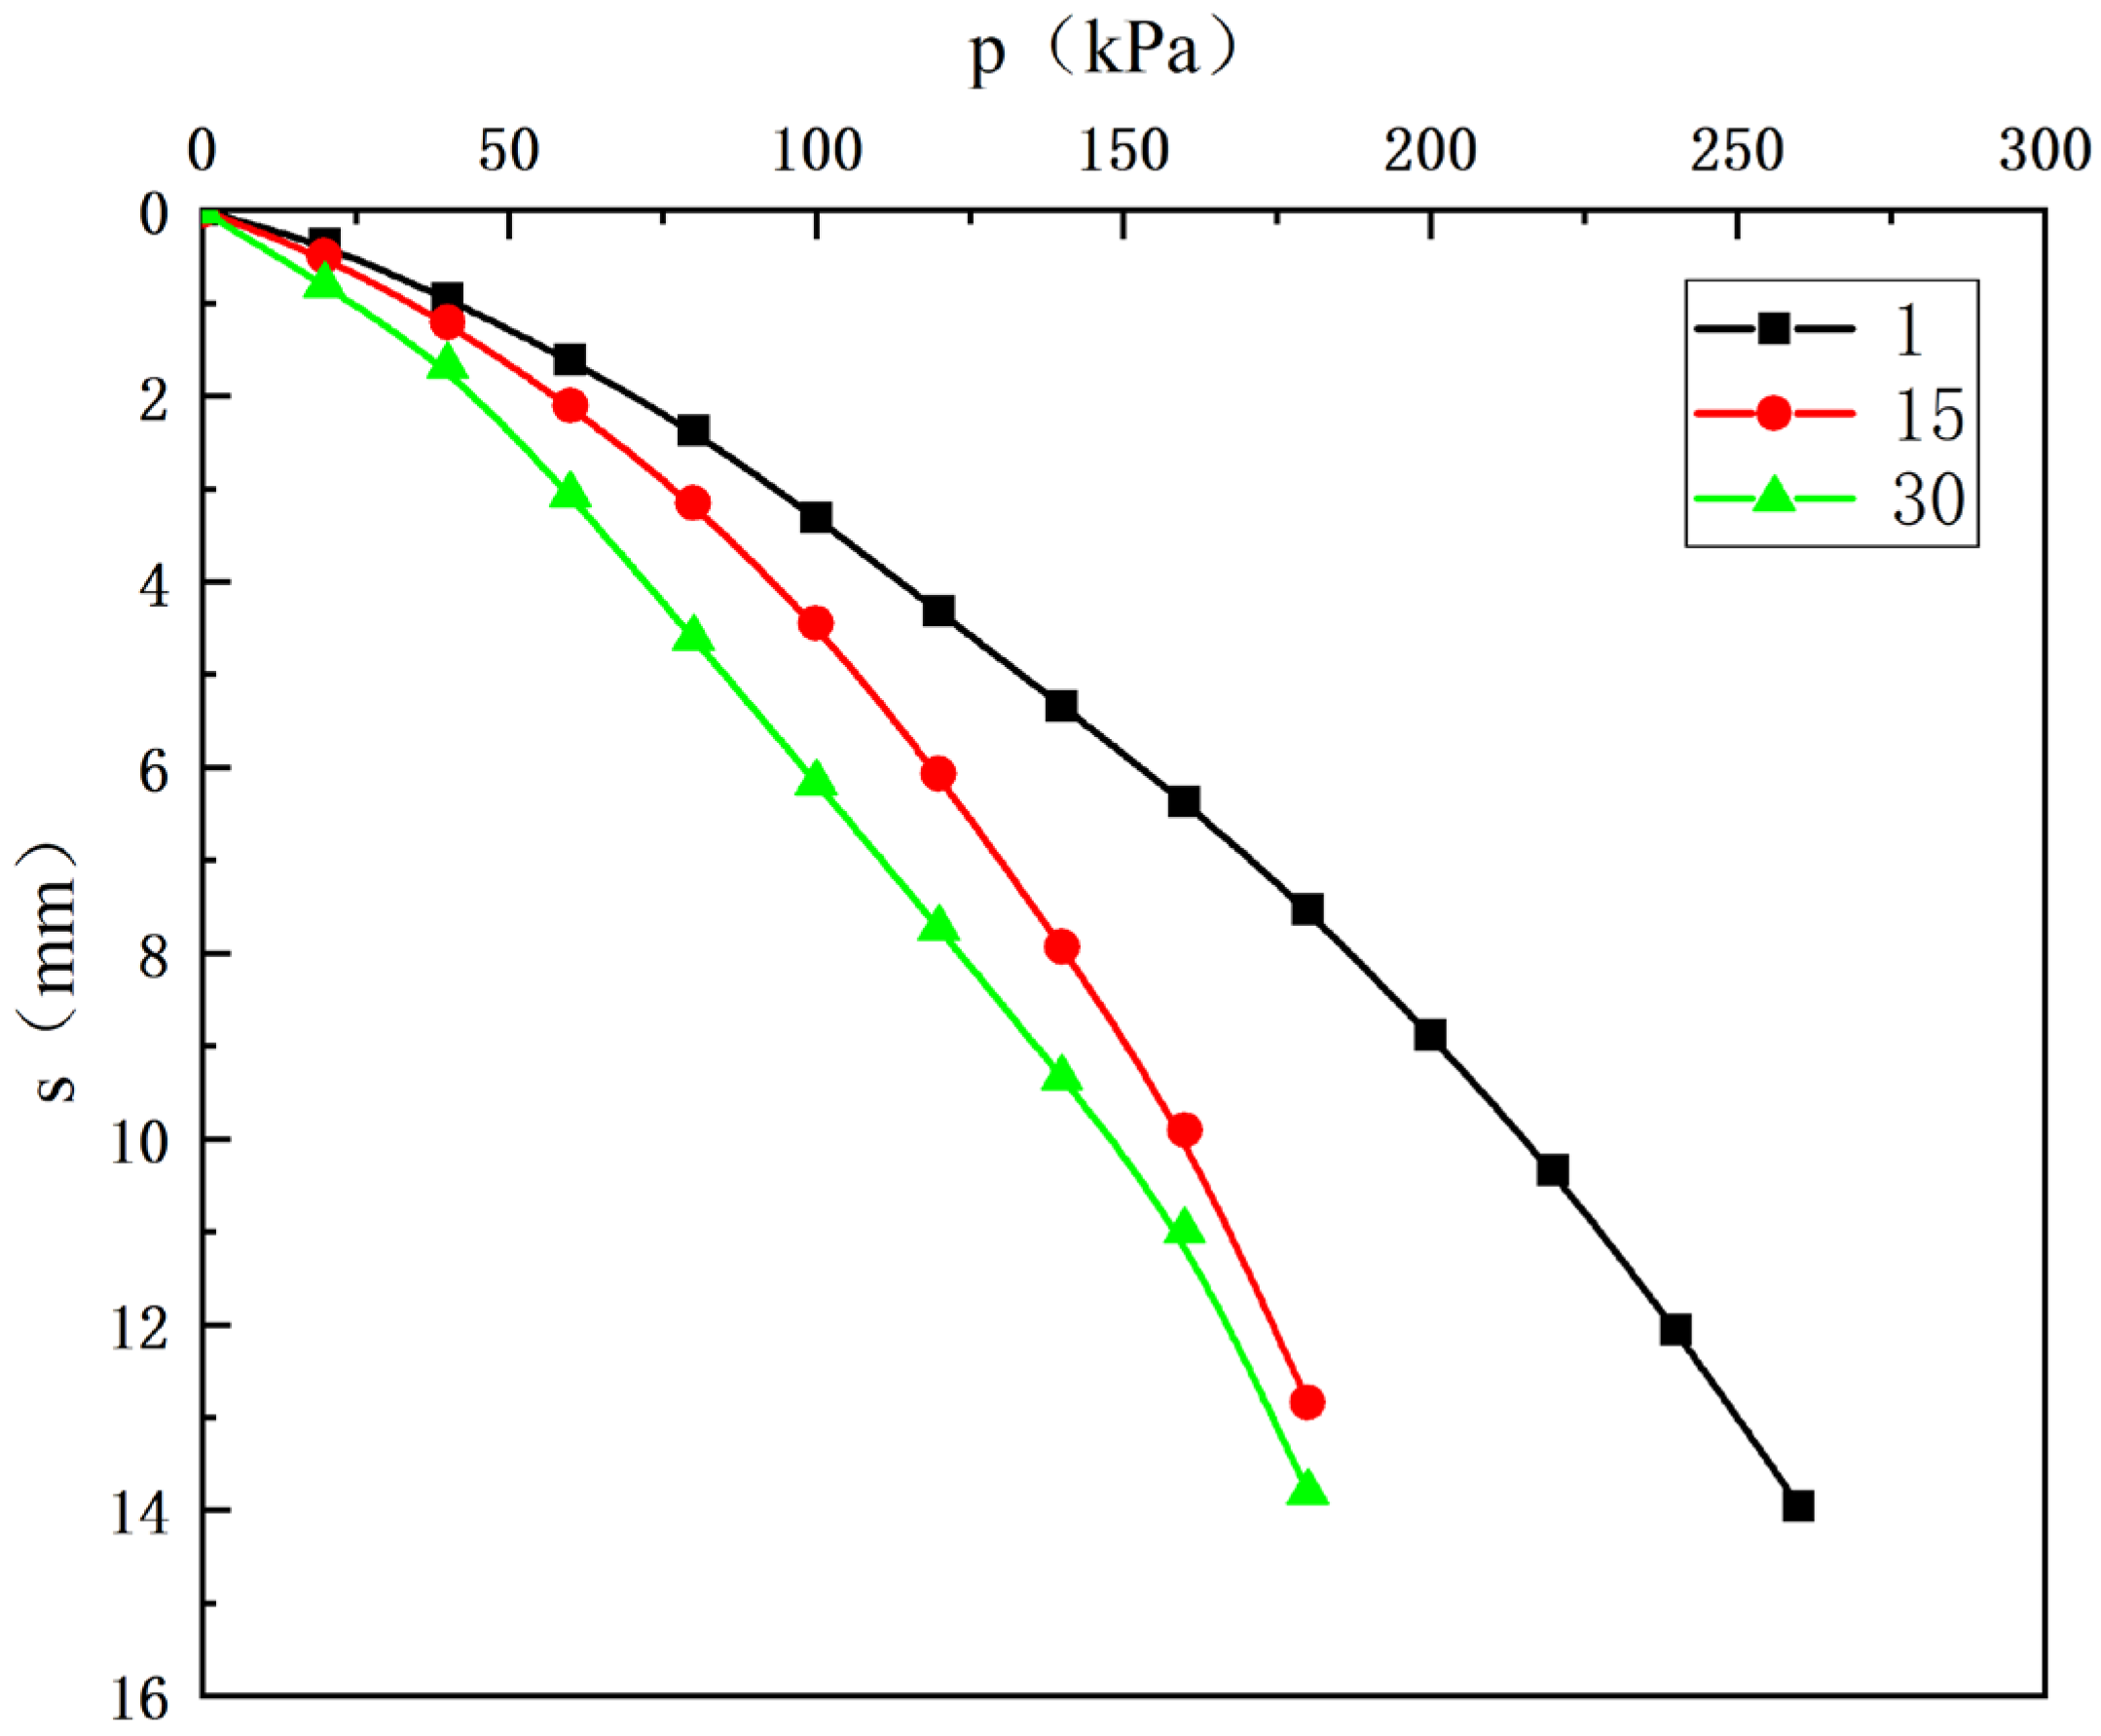
2.5. Analysis of Results
3. Numerical Analysis
3.1. Numerical Model
3.2. Numerical Analysis Procedures
- Establish a two-dimensional model. In order to improve the convergence of calculation, a symmetric structure was adopted with a length of 0.6 m and a width of 0.45 m. The soil was divided into two layers: gravel in the lower layer and sandy soil in the upper layer.
- Input the material parameters of the soil which are shown in Table 1.
- Set the boundary conditions of the model. The left side of the model is sliding support. The right side is a symmetric boundary. The lower side is a fixed constraint, and the right end of the upper side is the applied boundary load.
- Add soil weight and pore water pressure. Set soil plasticity and enable Mohr–Coulomb strength criteria.
- Add the global control equation. Use the parameter solver to control the gradual increase in load and define the integral function to record the vertical displacement of the loading midpoint.
- Divide the finite element mesh. Use relatively dense mesh in the contact surface of two layers of soil and the fluctuation surface of the water level.
- Calculate and output the stress and deformation and plastic development of the model and the p–s curves at the midpoint of loading.
3.3. Simulation Plan
- During the test, the water content of the soil layer above the water table increased due to the capillary phenomenon of the soil, which led to a decrease in the parameters of internal friction angle and cohesion and a decrease in the bearing capacity. The numerical simulation assumes that the water content of the soil above the water table is the initial water content. Therefore, the bearing capacity of the test result is smaller than that of the simulation result.
- The termination condition of loading during the test is according to the Geotechnical Test Procedure: the deformation of the foundation reaches 1/12 of the width of the loading plate. Then the foundation was considered to be damaged, and the loading was stopped. In contrast, the numerical simulation is loaded until the damage. Therefore, the test may not reach the ultimate bearing capacity of the foundation when the loading is stopped and the p–s curve has not reached the inflection point.
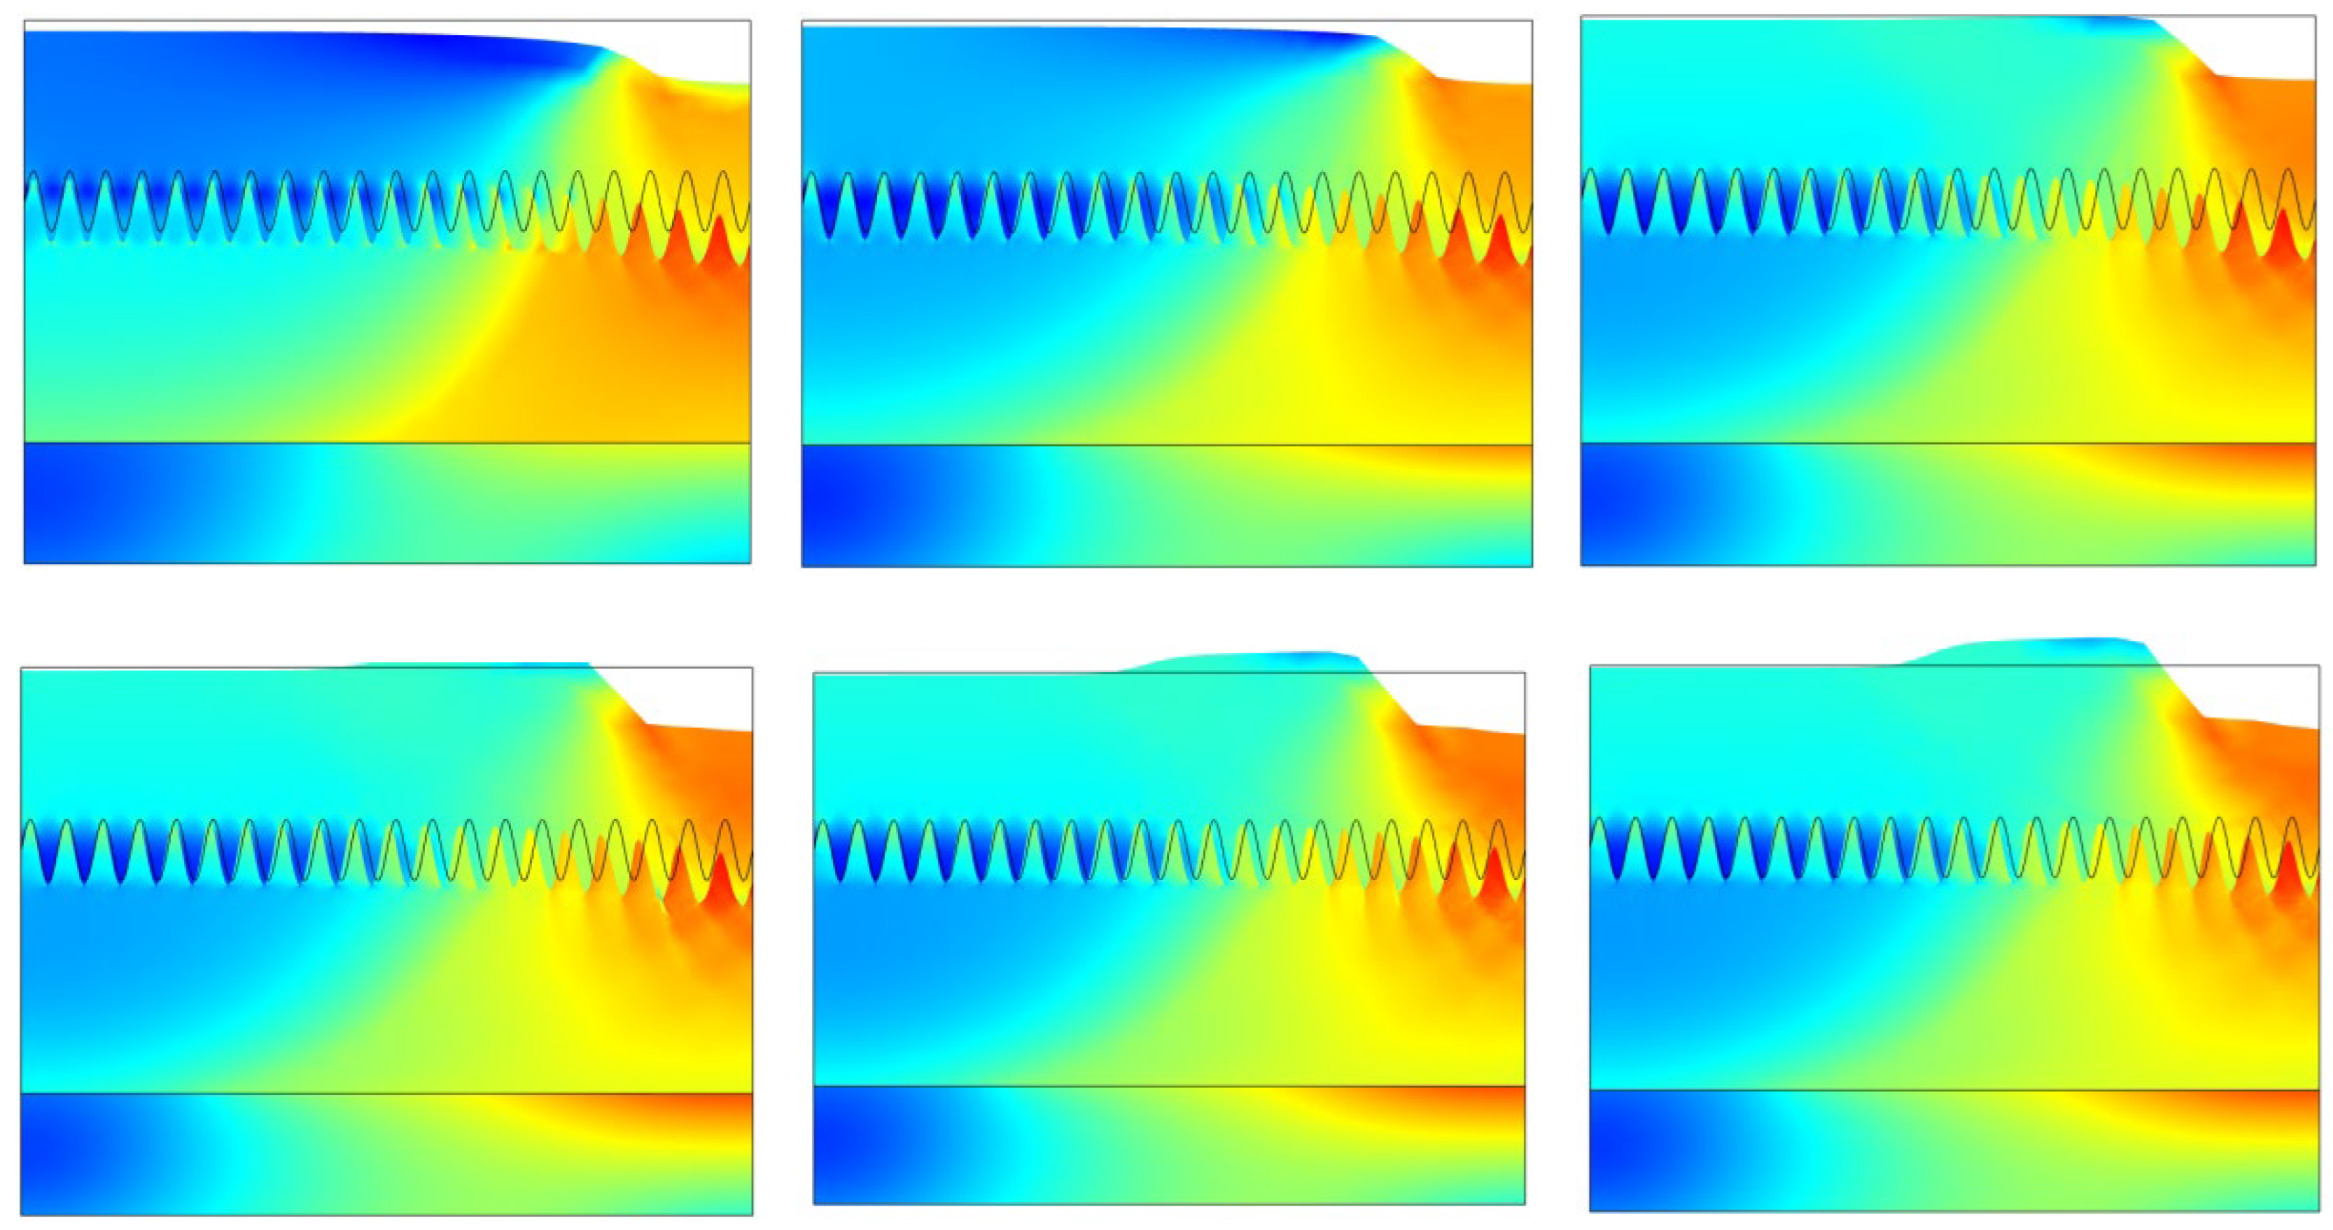
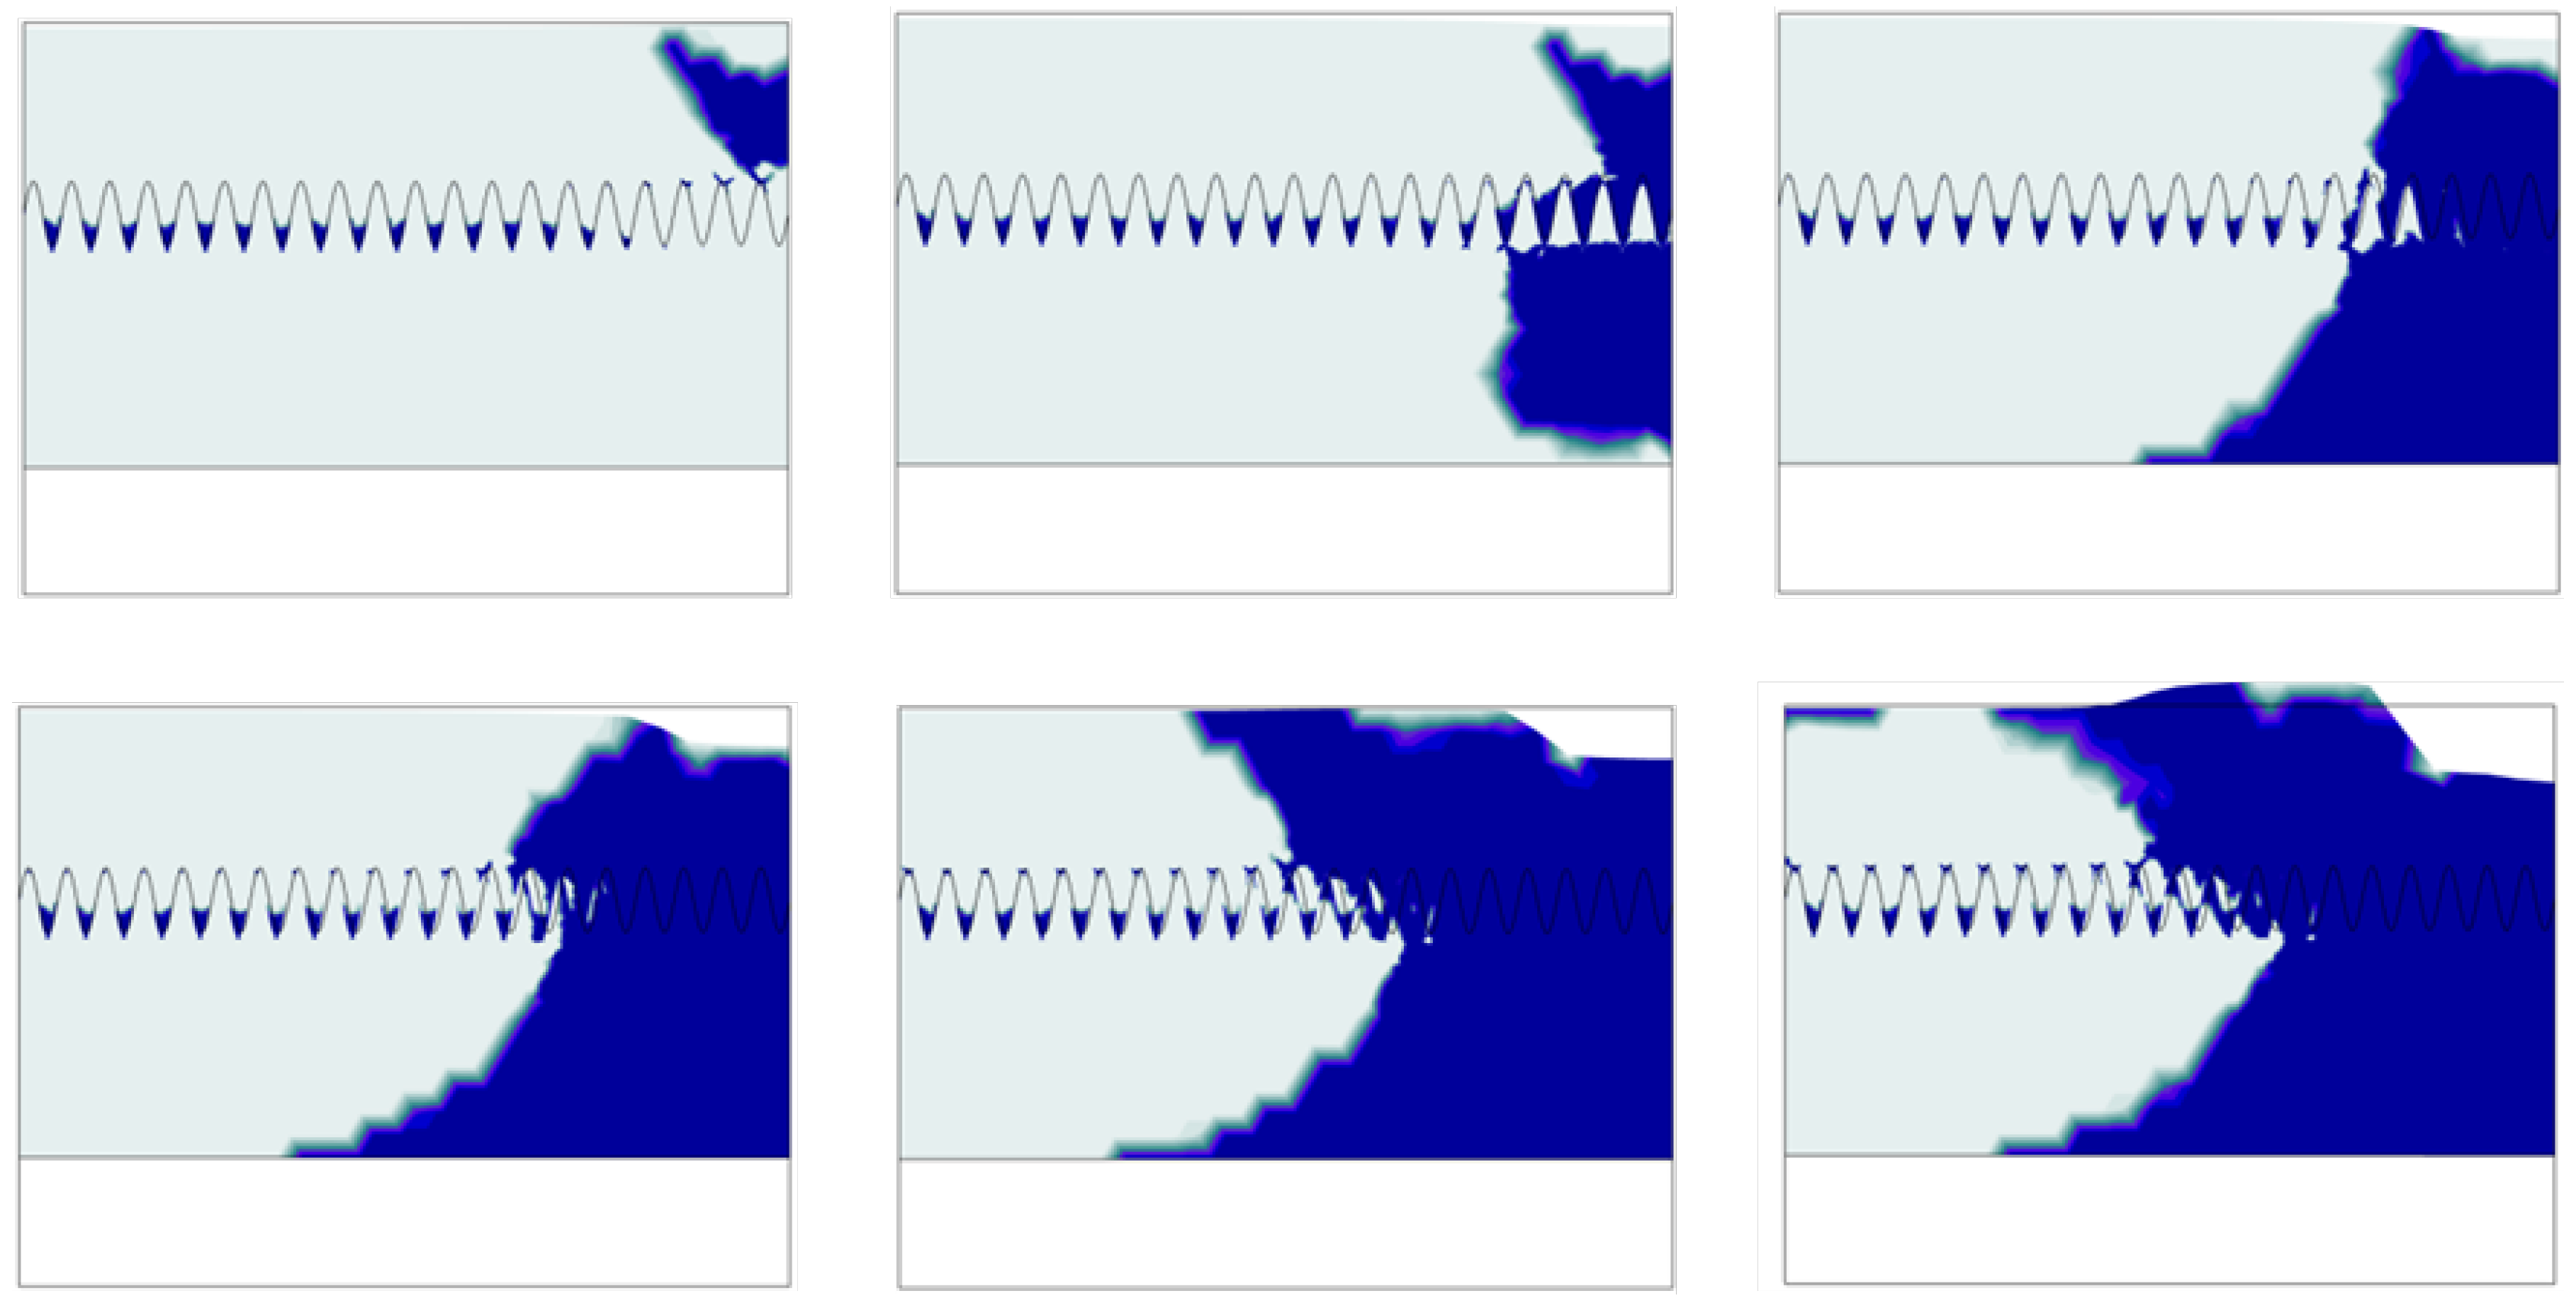
3.4. Analysis of Simulation Results
3.5. Discussion
4. Conclusions
- The height of water level and the frequency of water-level fluctuation are negatively correlated with the bearing capacity of the foundation, and the relationship of change is nonlinear. The water-level fluctuation can strengthen the capillary effect and expand the range of saturated soil in the foundation.
- In this study, the influence of the water-level fluctuation was added to the traditional calculation of the foundation bearing capacity. A new expression form of pore water pressure was derived for sinusoidal fluctuation. The average error between the calculated bearing capacity and the test results is less than 8%. It shows that this theory can be used to calculate the bearing capacity of a foundation under water-level fluctuation.
- This model can well predict the change in the foundation bearing capacity due to the water-level change. It has a good early warning function for an engineered foundation that has been under a high groundwater level for a long time.
- This model also has some limitations. It is currently only applicable to sandy shallow foundations. In the future, the model will be expanded to apply to more types of foundations.
Author Contributions
Funding
Institutional Review Board Statement
Informed Consent Statement
Conflicts of Interest
References
- Ge, S.P.; Yao, X.J. Response characteristics of pore pressure in soils nearby metro tunnel due to train vibration loading. J. Eng. Geol. 2015, 23, 1093–1099. [Google Scholar] [CrossRef]
- Yan, C.B.; Zhang, Y.C.; Chen, Y.G. Slip analysis of silted interbedded slope considering cumulative damage effect of blasting. Hydr. Sci. Eng. 2020, 1, 104–113. [Google Scholar] [CrossRef]
- Xu, D.S.; Huang, M.; Zhou, Y. One-dimensional compression behavior of calcareous sand and marine clay mixtures. Int. J. Geom. 2020, 20, 04020137. [Google Scholar] [CrossRef]
- Shi, Y.J.; Yan, X.X.; Chen, D.P. Engineering geological structure establishment and conditions assessment integrating land and sea in Shanghai coastal area. Hydrogeol. Eng. Geol. 2017, 44, 96–101. [Google Scholar] [CrossRef]
- Wang, W.D.; Wei, J.B.; Wu, J.B.; Zhou, R.F. Field test and analysis on effects of pile driving with high-frequency and resonance-free technology on surrounding soil. J. Build. Struct. 2020, 42, 132–138. [Google Scholar] [CrossRef]
- Wang, J.N.; Zhuang, H.Y. Shaking table test on liquefaction characteristics of foundation around a complicated subway station with diaphragm walls. Chin. J. Geotech. Eng. 2020, 42, 1859–1866. [Google Scholar] [CrossRef]
- Xu, D.S.; Liu, H.B.; Rui, R.; Gao, Y. Cyclic and postcyclic simple shear behavior of binary sand-gravel mixtures with various gravel contents. Soil Dyn. Earth Eng. 2019, 123, 230–241. [Google Scholar] [CrossRef]
- Xu, D.S.; Liu, Q.C.; Qin, Y.; Chen, B. Analytical approach for crack identification of glass fiber reinforced polymer–sea sand concrete composite structures based on strain dissipations. Struct. Health Monit. 2021, 20, 2778–2790. [Google Scholar] [CrossRef]
- Hu, Y.Q.; Hong, C.Y.; Zhang, Y.F.; Ling, G.W. A monitoring and warning system for expressway slopes using FBG sensing technology. Int. J. Distr. Sens. Netw. 2018, 14, 1–12. [Google Scholar] [CrossRef]
- Terzaghi, K. Arching in Ideal Soils. In Theoretical Soil Mechanics; Wiley: New York, NY, USA, 1943. [Google Scholar]
- Hansen, J.B. A General Formula for Bearing Capacity; Danish Geotechnical Institute: Copenhagen, Denmark, 1961. [Google Scholar]
- Khalid, M.; Sardar, A.; Jaffar, S. Influence of Footing Shapes and GWT on Bearing Capacity and Settlement of Cohesive Soil Beneath Shallow Foundations. Nucleus 2020, 57, 39–48. [Google Scholar]
- Boushehrian, J.H.; Hataf, N. Experimental and numerical investigation of the bearing capacity of model circular and ring footings on reinforced sand. Geo. Geom. 2003, 21, 241–256. [Google Scholar] [CrossRef]
- Dixit, M.; Patil, K. Effect of Depth of Footing and Water Table on Bearing Capacity of Soil. In Proceedings of the Indian Geotechnical Conference, Mumbai, India, 16–18 December 2010. [Google Scholar]
- Shu, B.; Chen, S.; Lu, J.F. Analysis of fluid–solid coupling mechanical behaviour of non-linear for soft clay foundation. Mater. Res. Innov. 2015, 19, 727–732. [Google Scholar] [CrossRef]
- Yao, P.F.; Qi, S.W.; Zhang, M. Simplified method for determining shear strength of unsaturated soils based on different paths. Rock Soil Mech. 2009, 9, 2605–2608. [Google Scholar] [CrossRef]
- Pei, H.F.; Zhang, S.Q.; Borana, L.; Zhao, Y.; Yin, J.H. Slope stability analysis based on real-time displacement measurements. Measurement 2019, 131, 686–693. [Google Scholar] [CrossRef]
- Kassem, M.; Soliman, A.; Naggar, H. Sustainable approach for recycling treated oil sand waste in concrete: Engineering properties and potential applications. J. Clean. Prod. 2018, 204, 50–59. [Google Scholar] [CrossRef]
- Xu, D.S.; Yin, J.H.; Liu, H.B. A new measurement approach for deflection monitoring of large-scale bored piles using distributed fiber sensing technology. Measurement 2018, 117, 444–454. [Google Scholar] [CrossRef]
- Yao, P.F. Discussion on shear strength of unsaturated soils. Rock Soil Mech. 2009, 30, 2315–2318. [Google Scholar] [CrossRef]
- Cai, G.Q.; Zhang, C.; Li, J. Study on prediction method of swcc considering initial dry density. Chin. J. Geotech. Eng. 2018, 40, 27–31. [Google Scholar] [CrossRef]
- Xu, D.S.; Zhu, F.B.; Lalit, B.; Fan, X.C.; Liu, Q.B. Construction solid waste landfills: Risk assessment and monitoring by fibre optic sensing technique. Geomat. Nat. Hazard Risk 2021, 12, 63–83. [Google Scholar] [CrossRef]
- Wen, B.P.; Hu, Y.Q. Effece of particle size distribution on the metric suction of unsaturated clayey soils. Hydrogeol. Eng. Geol. 2008, 6, 50–55. [Google Scholar] [CrossRef]
- You, R.Z.; Ren, L.; Song, G.B. A novel fiber Bragg grating (FBG) soil strain sensor. Measurement 2019, 139, 85–91. [Google Scholar] [CrossRef]
- Qin, Y.; Wang, Q.K.; Xu, D.S.; Yan, J.M.; Zhang, S.S. A FBG based earth and water pressure transducer with 3D fused deposition modeling approach for soil mass. J. Rock Mech. Geotech. 2022, 14, 663–669. [Google Scholar] [CrossRef]
- Xu, D.S.; Chen, W.; Fan, X.C. Experimental investigation of particle size effect on the self-healing performance of microcapsule for cemented coral sand. Constr. Build. Mater. 2020, 256, 119343. [Google Scholar] [CrossRef]
- Zhu, H.H.; Shi, B.; Yan, J.F.; Zhang, J.; Wang, J. Investigation of the evolutionary process of a reinforced model slope using a fiber-optic monitoring network. Eng. Geol. 2015, 186, 34–43. [Google Scholar] [CrossRef]
- Huang, K.; Wan, J.W.; Chen, G.; Zeng, Y. Testing study of relationship between water content and shear strength of unsaturated soils. Rock. Soil Mech. 2012, 33, 2600–2604. [Google Scholar] [CrossRef]
- Su, L.J.; Zhang, Y.J.; Wang, T.X. Investigation on permeability of sands with different particle sizes. Rock Soil Mech. 2014, 35, 1289–1294. [Google Scholar] [CrossRef]
- Wang, D.L.; Luan, M.T.; Yang, Q. Experimental study of soil-water characteristic curve of remolded unsaturated clay. Rock Soil Mech. 2009, 30, 751–756. [Google Scholar] [CrossRef]
- Ma, S.K.; Huang, M.S.; Fan, Q.Y. Unsaturated soil strength theory based on total stress strength indexes of saturated soil and its application. Chin. J. Geotech. Eng. 2009, 28, 635–640. [Google Scholar] [CrossRef]
- Tang, L.S. New suggestion on shear strength in unsaturated soil based on suction between grains. Chin. J. Geotech. Eng. 2001, 23, 412–417. [Google Scholar] [CrossRef]
- Huang, M.S.; Qu, X.; Lu, X.L. Regularized finite element modeling of progressive failure in soils within nonlocal softening plasticity. Comput. Mech. 2017, 62, 347–358. [Google Scholar] [CrossRef]
- Forest, S. Micromorphic approach for gradient elasticity, viscoplasticity and damage. J. Eng. Mech. 2009, 135, 117–131. [Google Scholar] [CrossRef]
- Lu, X.L.; Xue, D.W.; Huang, M.S. A shear hardening plasticity model with nonlinear shear strength criterion for municipal solid waste. Comput. Geotech. 2018, 104, 204–215. [Google Scholar] [CrossRef]
- Lin, H.Z.; Li, G.X.; Yu, Y.Z. Influence of matric suction on shear strength behavior of unsaturated soils. Rock Soil Mech. 2007, 28, 1931–1936. [Google Scholar] [CrossRef]
- Lee, J.K.; Jeong, S. Undrained bearing capacity factors for ring footings in heterogeneous soil. Comput. Geotech. 2016, 75, 103–111. [Google Scholar] [CrossRef]
- Shen, J.H.; Xu, D.S.; Liu, Z.W.; Wei, H.Z. Effect of particle characteristics stress on the mechanical properties of cement mortar with coral sand. Constr. Build. Mater. 2020, 260, 119836. [Google Scholar] [CrossRef]


| Parameter | Density, ρ (g/cm3) | Cohesive Force, c (kPa) | Angle of Internal Friction, φ (°) | Young’s Modulus, E (MPa) | Poisson’s Ratio, Μ | |
|---|---|---|---|---|---|---|
| Soil Sample | ||||||
| Silty sand (natural) | 1.92 | 12.7 | 20.1 | 15.0 | 0.25 | |
| Silty sand (saturated) | 2.05 | 8.4 | 18.3 | 9.4 | 0.25 | |
| Gravel | 2.20 | 3.2 | 38.7 | 150 | 0.3 | |
| Factors | Hight of Water Level (mm) | Times of Water-Level Cycle | |
|---|---|---|---|
| Number | |||
| 1 | 0 | 0 | |
| 2 | 50 | 1 | |
| 3 | 50 | 15 | |
| 4 | 50 | 30 | |
| 5 | 100 | 1 | |
| 6 | 100 | 15 | |
| 7 | 100 | 30 | |
| 8 | 150 | 1 | |
| 9 | 150 | 15 | |
| 10 | 150 | 30 | |
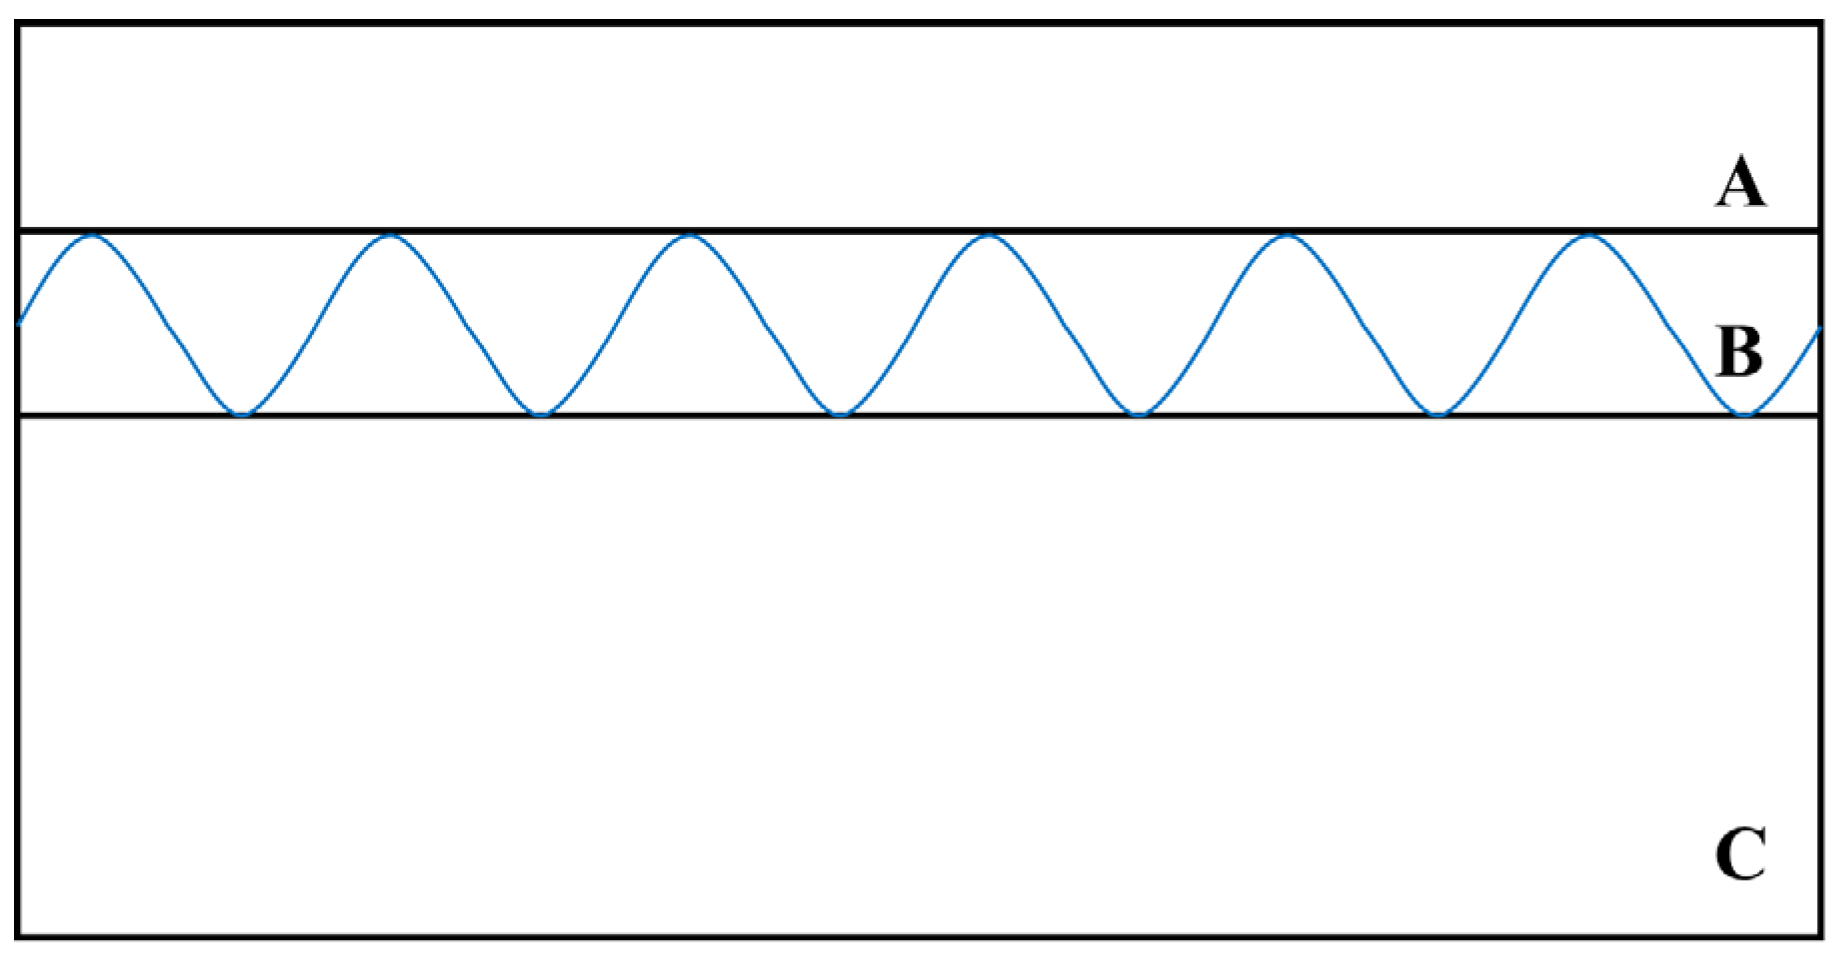
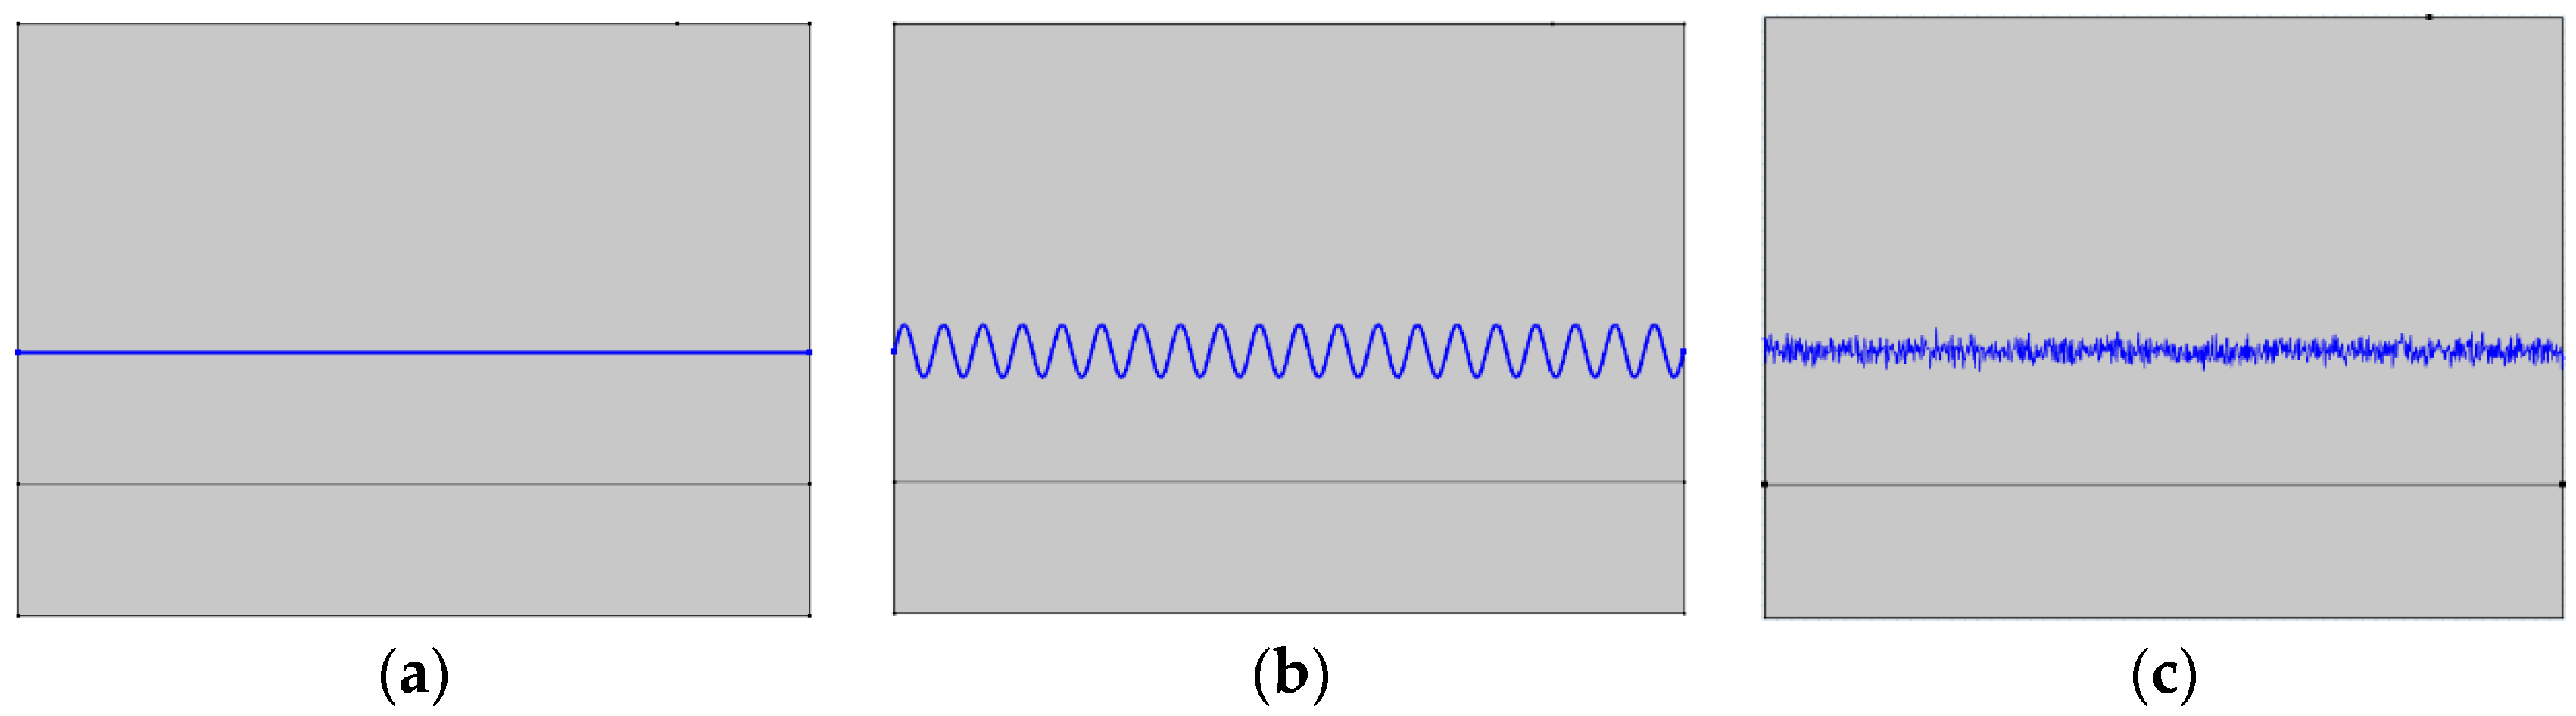
| Factors | Elevation of Water Level (mm) | Water-Level Fluctuation Range (mm) | Water-Level Fluctuation Form | |
|---|---|---|---|---|
| Number | ||||
| 1 | 50 | 10 | sine wave | |
| 2 | 50 | 20 | sine wave | |
| 3 | 50 | 30 | sine wave | |
| 4 | 50 | 40 | sine wave | |
| 5 | 100 | 10 | sine wave | |
| 6 | 100 | 20 | sine wave | |
| 7 | 100 | 30 | sine wave | |
| 8 | 100 | 40 | sine wave | |
| 9 | 150 | 10 | sine wave | |
| 10 | 150 | 20 | sine wave | |
| 11 | 150 | 30 | sine wave | |
| 12 | 150 | 40 | sine wave | |
| 13 | 50 | 30 | straight line | |
| 14 | 100 | 30 | straight line | |
| 15 | 150 | 30 | straight line | |
| 16 | 50 | 30 | random function | |
| 17 | 100 | 30 | random function | |
| 18 | 150 | 30 | random function | |
Disclaimer/Publisher’s Note: The statements, opinions and data contained in all publications are solely those of the individual author(s) and contributor(s) and not of MDPI and/or the editor(s). MDPI and/or the editor(s) disclaim responsibility for any injury to people or property resulting from any ideas, methods, instructions or products referred to in the content. |
© 2022 by the authors. Licensee MDPI, Basel, Switzerland. This article is an open access article distributed under the terms and conditions of the Creative Commons Attribution (CC BY) license (https://creativecommons.org/licenses/by/4.0/).
Share and Cite
Chen, W.; Xia, W.; Zhang, S.; Wang, E. Study on the Influence of Groundwater Variation on the Bearing Capacity of Sandy Shallow Foundation. Appl. Sci. 2023, 13, 473. https://doi.org/10.3390/app13010473
Chen W, Xia W, Zhang S, Wang E. Study on the Influence of Groundwater Variation on the Bearing Capacity of Sandy Shallow Foundation. Applied Sciences. 2023; 13(1):473. https://doi.org/10.3390/app13010473
Chicago/Turabian StyleChen, Wenfeng, Weishu Xia, Shanshan Zhang, and Erlei Wang. 2023. "Study on the Influence of Groundwater Variation on the Bearing Capacity of Sandy Shallow Foundation" Applied Sciences 13, no. 1: 473. https://doi.org/10.3390/app13010473
APA StyleChen, W., Xia, W., Zhang, S., & Wang, E. (2023). Study on the Influence of Groundwater Variation on the Bearing Capacity of Sandy Shallow Foundation. Applied Sciences, 13(1), 473. https://doi.org/10.3390/app13010473