Abstract
The discrete element method can be used to analyze the interaction between tools and soil. It can be used to guide the optimal design of tools, but the appropriate simulation and test method selected is important to achieve the goal. This paper mainly introduces the disturbance of soil by tillage tools. The disturbance of the soil by tools include soil loosening, soil movement, and soil mixing. The disturbance contour is used to visually display the disturbance results, and the cross-sectional area, lateral soil throwing amount, ditch ridge height, ditch width, and ditch backfill are used to characterize the cross-sectional shape. Tracers are usually used to track soil particles to visually display the particle movement path during disturbance; this can be used to study the soil disturbance trend by the tools. When parameters and models are appropriate, the movement and contact of microscopic soil particles can be accurately simulated. By comparing the particle behavior of simulation and experiment, the contact model and contact parameters can be verified. The method introduced provides a reference for the optimal design of the tools and the research of disturbance by the tools.
1. Introduction
Tillage tools usually cut, turn, pulverize and disturb the soil [1]. The simulation methods to study the interaction between soil and tools mainly include FEM and DEM. The discrete element method overcomes the shortcomings of continuous numerical methods and can intuitively display microscopic particles. Discrete element simulation software includes YADA, PFC3D, EDEM, etc. They are widely used in particle parameter calibration and soil disturbance analysis by tools [2]. The effect of tools on soil can be predicted by analyzing the disturbance between tillage tools and soil with the discrete element method. Based on it, the structure and parameters of tillage tools can be optimized.
Soil disturbance can be defined as soil loosening (decrease in bulk density), movement (change of position in three dimensions) and mixing (relative exchange of positions, especially in the vertical direction) caused by tools. The quantitative parameters of the profile shape after disturbance are shown in Figure 1, namely, the cross-sectional area of the loose ditch (A1, A2), the maximum lateral soil throwing amount, the ridge height of the ditch, the inclined area of the ditch (A2), the width of the ditch and the backfill of the ditch. Lateral soil throwing was assessed in DEM simulations using the distance from the center of the ditch to the farthest throwing particle and soil coverage [3,4]. After the soil is thrown, the surrounding of the ditch will form soil accumulation, which are lateral accumulation and forward accumulation, respectively. The resistance of soil will increase with high soil accumulation.
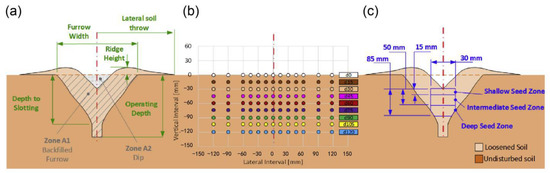
Figure 1.
Measurement of furrow profiles and soil layer mixing in the soil bin test. (a) Groove profile parameters; (b) Grid pattern before PVC tracer tillage; (c) Area definition relative to dip nadir [3].
The connection between soil particles is simulated by the forces bonds. When the tools enter the soil, the forces bonds between the particles will be destroyed. The forces bonds failure state and particle velocity field characterize the soil failure state. The optimization goal of the tools is often to reduce energy consumption and improve the tillage effect. During the simulation, DEM software is used to supervise the change of kinetic energy of soil particles, which can effectively simulate the energy conversion of the tools in the soil. It can be used as a design index for low energy consumption. Soil loosening efficiency is the ratio of soil disturbance area to traction force [5]. The soil disturbance characteristics can be evaluated by the soil expansion rate and the soil disturbance coefficient. The soil disturbance coefficient is equal to the ratio of the disturbed soil area to the soil area before tillage [6]. The animal paw has strong adaptability to the environment and has good digging performance. Selecting suitable animals for the development of bionic tools can reduce viscosity, drag and soil disturbance [7]. Some animals/animal parts good at digging soils, such as bear claws, dung beetles, earthworms and pangolins, shark scales, mole cricket claws and boar bow nose structures, etc., can move freely in cohesive soils due to their special non-smooth surface structure. This structure does not adhere to the soil, and is often used for bionic tools.
The structure of the article is mainly divided into three parts: theory, simulation method and experimental method. In each chapter, the parameters involved in the soil disturbance, such as disturbance area, are classified. After classification, the respective parameter simulation and experimental methods are described in detail. This paper analyzes and summarizes the current research status of soil disturbance caused by tools. The theory includes contact model, the forces bonds and energy consumption mechanism, energy dissipation analysis, disturbance shape, soil layer mixing, etc. The test involves soil pile disturbance shape, mixing of different soil layers, soil and residue mixing, tillage resistance, etc. This study provides readers with disturbance research forms, research methods, etc., and provides references for further research on soil disturbance and tool optimization [8,9].
2. Theoretical Analysis
2.1. Contact Model of Soil Particles
The type of contact models directly affect the interaction force and displacement relationship between particles and tools, which affects the accuracy of the simulation. Hertz-Mindlin with bonding and Hertz-Mindlin with JKR can better simulate soils with certain cohesive properties [10,11]. It is suitable for the soils with different water contents with forces bonds [12,13]. Hertz-Mindlin no-slip contact model, HSCM (hysteretic spring contact model), Hertz Mindlin (HM) with parallel bond, linear contact model are suitable as contact models for soil-cultivation tools. The forces bonds work only when the contact distance is less than zero. The specific parameters of contact models need to be determined by calibration and verified by experiments [14,15,16,17,18].
In order to simulate the purple soil type in the hills and mountains of Chongqing, the Hertz-Mindlin with bonding model in EDEM was used to create a contact model between soil particles [19]. Zhao, S. established a discrete element model of subsoiling shovel–soil–straw–stubble. The contact model between soil–stubble particles is the Hertz-Mindlin with bonding. It can reflect the adhesion and elastic-plasticity between particles. The contact model of stubble–soil particles is Hertz-Mindlin with JKR, it can better reflect the surface energy of the object and can better simulate the bonds between the root surface and the soil [20]. Zeng, R. uses the JKR model to simulate the soil–soil and soil–lotus root contact patterns to analyze the variation of resistance with time and depth when the lotus root is pulled out from the soil [21].
2.2. Research on the Bonds between Soil Particles
When analyzing the disturbance range, disturbance profile, and loosening of the soil by the tools, the view can be switched to the force chain mode. By observing the forces bonds, the damage range and fracture profile can be analyzed to analyze the disturbance of soil. By establishing the relationship between the design parameters and soil disturbance, the structure and design parameters of the soil-contacting parts can be optimized. The soil disturbance profile can be obtained by defining the contours of particle velocities in the soil cross-section and taking the area measurement of the area contained by the contours. The disturbance area can also be measured by meshing the disturbance area and calculating the number of grids contained in the disturbance area. Switch to the force chain view mode during simulation, and predict the disturbance area of the soil and the impact of the tools on the soil by observing the damage of the forces bonds. The looseness, disturbance profile and force bonds failure are shown in Figure 2 [22].The density of broken bonds in unit volume of virtual soil shows the disturbance of soil. The forces bonds fracture can predict the disturbance range and area of soil. Based on this, the tools can be optimized (see Figure 3) [23,24,25].
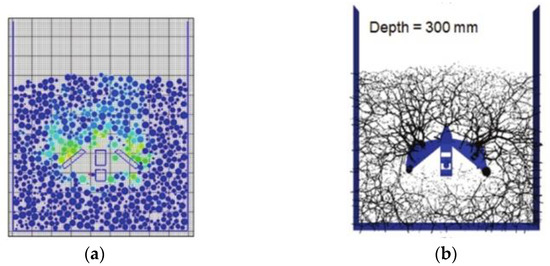
Figure 2.
Grid particle counting method and contact force chain in the model box. (a) Cut planes overlapped on grid to estimate soil disturbance area; (b) Contact force chain [22].
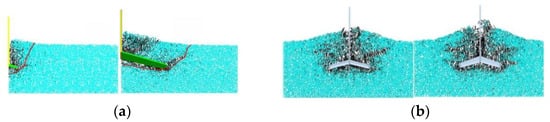
Figure 3.
Effects of tillage width and implement rake angle on soil disturbance area (broken bond area) simulated by DEM. (a) The cutting widths are 5.9 cm and 22.2 cm, respectively; (b) The rake angles are 15° and 25°, respectively [24].
2.3. Energy Dissipation Analysis
PFC, EDEM and other software can used to simulate the particle flow, and analyze the microscopic and dynamic characteristics of the particle flow. The energy dissipation of the particle can also be monitored. The energy dissipation is related to the particle radius and simulation time. Dissipative analysis enables the analysis of power losses in mechanical systems [26]. The main source of energy dissipation is the “velocity-dependent” viscous damping coefficient, and the study of the particle’s forces bonds damping enables the analysis of the particle’s suction effect [27]. By analyzing the kinetic energy of the particles, the energy consumption of the soil can be indirectly analyzed, and the combined analysis with the resistance field can be used as a design index for low consumption of farming machinery.
3. Simulation Analysis
3.1. Movement Trajectories of Soil Particles
Discrete element simulation can effectively predict the interaction effect between tillage tools and soil particles [28]. To mark particles at different depths, a tracking agent is required to track the particles. The software’s own marking function can be used to mark the particles, and track the same particle position at different time nodes to obtain motion trajectory of the particles in the vertical plane [29]. By plotting the velocity contours of the soil, the soil movement area and other soil particles can be distinguished.
The straw tracer was used to monitor the forward and lateral displacement of the straw. For qualitative evaluation, the straw movement in the farming process was simulated in three stages, namely forced displacement, projectile displacement and flipping displacement. The straw tracer and its motion path are shown in Figure 4 [30]. Zhao, S. designed a curve-fitting subsoiling shovel and proved that it can effectively reduce soil disturbance and tillage resistance through simulation and experiments [31,32]. To evaluate the effect of straight blade edge curve geometry on soil disturbance, three-dimensional monitoring of the displacement of nine soil particles under the blade was carried out. The average soil particle displacement in the vertical direction was calculated to understand the soil movement process. A soil particle (the one located in the center) was selected to show its path during the simulation (see Figure 5) [18].
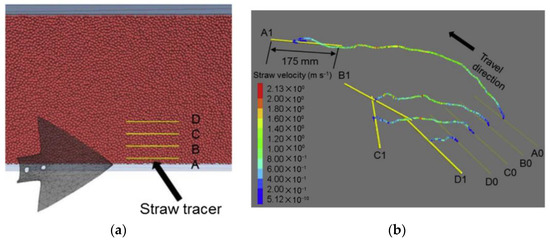
Figure 4.
Isometric straw tracer placement, trajectory and speed. (a) Tracer placement. (b) Movement track [30].
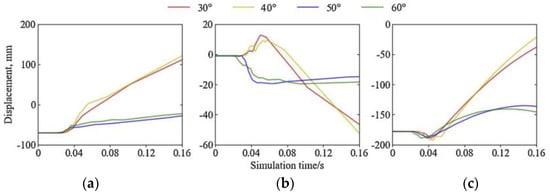
Figure 5.
Soil particle movement path under different slip angles of Archimedes screw blade. (a) Forward displacement; (b) Lateral displacement; (c) Vertical displacement [18].
3.2. Analysis of Velocity Field
In the simulation analysis of the soil by the tillage tools, the slice observation of the velocity field can analyze the disturbance range of the particles [33,34]. The disturbance contour is defined by the boundary of the velocity field [35]. Based on the discrete element velocity field analysis, the disturbance of the rigid body to the soil and soil residues, the disturbance area of the tools to the soil, and the throwing of particles under the action of the tools (velocity vector diagram) can be studied (see Figure 6) [36].
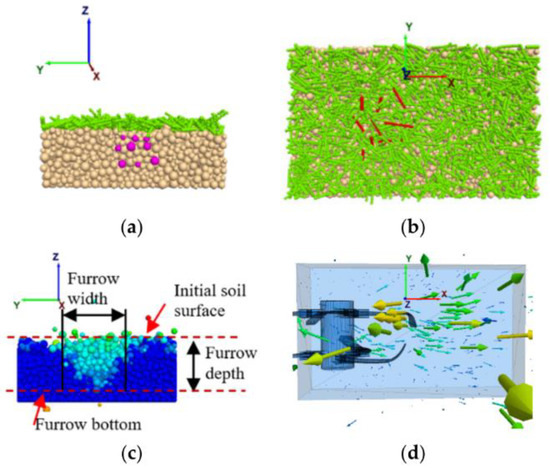
Figure 6.
Monitoring soil and straw disturbance during rotary tillage. (a) Soil tracer placement; (b) Rice straw tracer placement; (c) Disturbance profile; (d) Throwing vector diagram [36].
Based on the velocity field, by analyzing the sinking performance and resistance of the tools in the sand, the structure and parameters of the tool can be optimized [37,38,39]. The contact models such as elastic HMCM and plastic HSCM are usually used to analyze the velocity field of soil particles under the action of tools [40]. Tian, L. designed an orthogonal experiment to analyze soil disturbance and weeding torque based on the three influencing factors of hoe depth, weeding wheel rotation speed and equipment forward speed [41]. The accuracy of the contact model and parameters can be verified by comparing the disturbance profile and disturbance area of the machine tool to the soil in the simulation and experiment. When the tools work on soil, the disturbance and displacement can be reflected as velocity field of the soil particles [42,43]. Han, D. developed ostrich bionic feet based on ostrich feet, and analyzed the resistance and velocity fields with ordinary feet in three different shapes of sand piles. The speed change of the bionic foot is better than that of the ordinary foot when it penetrates into the sand [44]. The bionic deep loosening tool was designed based on the bear claw structure. By analyzing the kinetic energy of the disturbed particles, the power required for soil cutting can be obtained indirectly, which can be used to evaluate the digging performance of the bear claw bionic shovel (see Figure 7) [45].
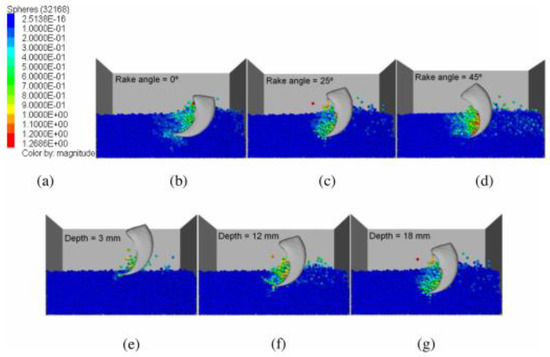
Figure 7.
Screenshot of velocity field. (a) Speed scale (xx); (b–d) at different rake angles and constant depth (18 mm); (e–g) at different depths and constant rake angle (45°) [45].
3.3. Soil Throwing and Accumulation
Forward soil accumulation, lateral throwing and vertical throwing can be caused by the tools (see Figure 8) [46]. The lateral soil throwing distance refers to the distance from the center of the profile to the most edge of the loose soil, and the vertical throwing distance refers to the vertical distance between the thrown soil particles and the soil plane in the vertical direction (see Figure 9) [47]. Throwing and moving soil will eventually cause forward accumulation, side accumulation, and backfill. During simulation, the particle size will affect the shape and size of the forward stacking [48]. If the particle radius is set too large, some unloose particles will roll into the groove, resulting in an increase in the amount of backfill [49]. When the soil was thrown, the throwing distance was longer when the top soil layer used smaller particles, and the throwing profile was closer to the measured profile. The influence of particle size on the simulation accuracy should be fully considered when studying the throwing distance [50].
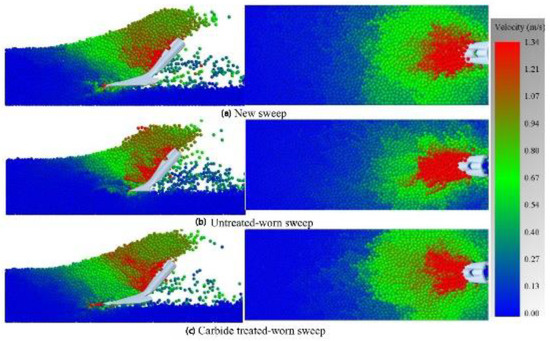
Figure 8.
DEM from side and top view. (a–c) Predicted forward soil failure and depth in front of the cutting tool [46].
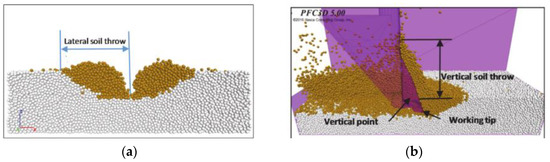
Figure 9.
Soil throwing distance map (a) Throwing sideways; (b) Stacking forward [47].
When the surface of the tillage tools is not smooth, it can make the soil vibrate to a certain extent, thus effectively reducing the soil accumulation during the tillage process. Figure 10 clearly depicts the throwing of soil during tillage [51]. Combined with the discrete element simulation, the effective use of particle throwing can separate different materials and reduce the blockage of the tools [52]. The particles placed in the center of the tool are thrown far away, and the particles placed farther away from the center have a smaller lateral throwing distance [53].
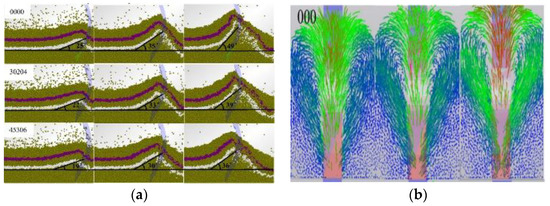
Figure 10.
Diagram of soil forward accumulation and lateral throwing. (a) Forward stacking; (b) Side toss vector illustration [51].
3.4. Disturbance Profile of Soil
The main parameters used to measure soil disturbance include trench cross-sectional area, trench width, displacement of loose soil particles (forward, lateral, and vertical), overflow distance, trench backfill, and ridge height (see Figure 11) [54]. During simulation, the measurement tool that comes with the EDEM post-processing module can be used for monitoring soil disturbance. The soil velocity and force can be monitored along the slice direction along the length of the soil tank, and the number of disturbed soil particles located in the slice can be calculated by calculating loosen soil (see Figure 12) [55]. The disturbance area above the soil is called the positive disturbance area, and the area below the surface is called the negative disturbance area. The destruction of the forces bonds of the soil particles by the tools will cause the force fluctuation, which reflects the soil disturbance due to the action of the tools. The line screenshot is used to capture the disturbance area. During simulation, it was found that changing the damping coefficient between particles will affect the resistance of the soil to the implement [56]. By analyzing the relationship between the traction force and the size of the disturbance profile, it can be used as one of the evaluation criteria for the efficiency of mechanical operations.
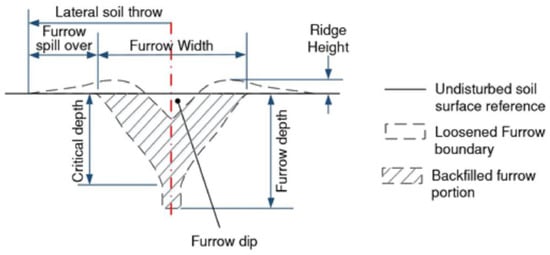
Figure 11.
Soil surface cross section and furrow profile cutting tool for typical narrow tooth soil disturbance parameters [54].
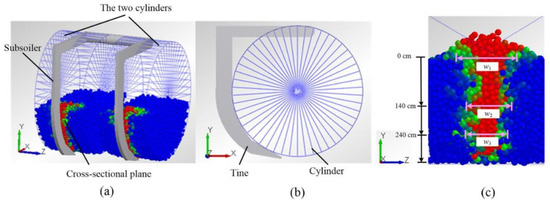
Figure 12.
The perturbation width of the model (a) Schematic diagram of cutting; (b) relative position of cutting cylinder and tines; (c) measurement of soil disturbance width [55].
Based on the physical properties of the red loam soil of Hainan banana floor tiles, Zhang, X. designed an oblique handle folding-wing subsoiling shovel that can effectively reduce operating resistance. The performance of the subsoiling shovel was evaluated by contour and so on, and it was concluded that the designed subsoiling shovel had the characteristics of low resistance and little disturbance to the soil. The disturbance contour is shown in Figure 13 [57].
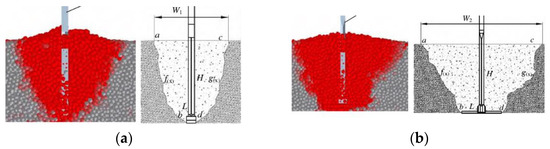
Figure 13.
Comparison of soil loosening effects of subsoiling shovel (a) Chisel type subsoiling shovel; (b) Oblique handle folding wing subsoiling shovel [57].
3.5. Mixing of Soil Layers
The soil compactness of different soil layers is inconsistent, but it is still impossible to directly reflect the distribution of soil compaction in the subsoiling profile in the form of particles at present. Statistics on the number of particles per unit area of different soil layers and drawing contour lines can express compaction. The soil compaction degree will change to a certain extent before and after tillage. The contour map of soil compaction degree is shown in Figure 14 [58]. Before the disturbance, the soil particles in different soil layers were color-coded. After the disturbance, the mixing ratio of the tilled soil particles was quantified to show the mixing situation of the particles in different soil layers. The soil layers were divided and a certain part of the disturbance area was selected as the detection area. The percentage statistics of the previously marked particle composition are carried out to calculate the mixing ratio, and the disturbance trend of the particle mixture by the tools can be analyzed through the mixing ratio. The soil layer mixing is shown as Figure 15 [4]. Du, J. compared and optimized the tillage depth, forward speed and rotation speed according to soil burial and mixing performance, so as to enhance the mixing and disturbance performance of the rotary tiller for different soil layers [59]. In order to reduce the horizontal resistance and soil disturbance of the multi-purpose mechanical loosening shovel in the improvement of perennial alfalfa fields, a new bionic loosening shovel was designed based on the anteater’s claw toe. Therefore, the bionic shovel has better low disturbance characteristics, which is conducive to water and moisture retention. The mixing of each soil layer is shown as Figure 16 [60].
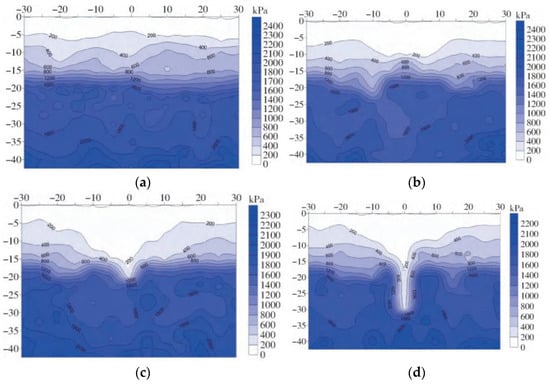
Figure 14.
The contour map of the compactness of the deep loosening disturbance profile (a) Before the test; (b) ploughing depth 10 cm; (c) ploughing depth 20 cm; (d) ploughing depth 30 cm [58].
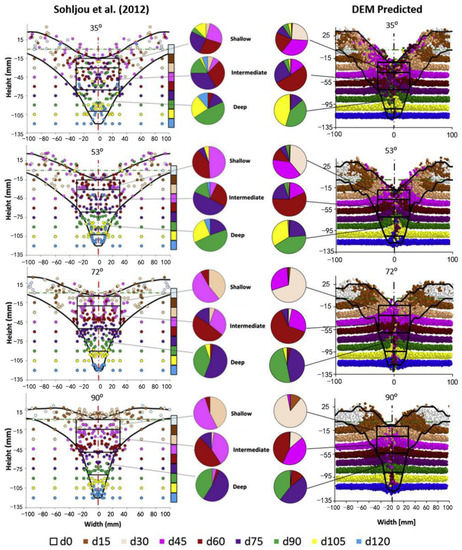
Figure 15.
The soil layer mixing results and pie charts predicted by soil box and DEM under the action of 16 mm wide openers with different rake angles [3].
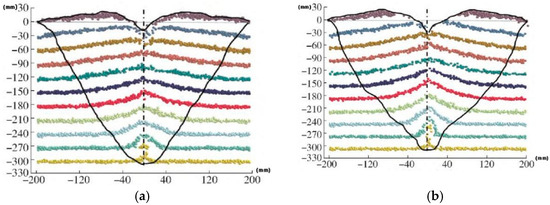
Figure 16.
Distribution of soil particles after different types of ripper. (a) Bionic shovel; (b) standard shovel [60].
3.6. Resistance Analysis
When the tillage tool works on the soil, the soil will have a certain resistance to the tool, and the resistance is often used as one of the evaluation criteria for the design of the tools. The best parameters can be determined by comparing the resistance of tool tillage under different parameters. Wang, Y. used implement–soil interaction force to evaluate tillage resistance, total energy consumption and soil disturbance, and optimized the groove height, groove spacing ratio, groove height and internal friction angle of the bionic shark subsoiler [61]. The design of tillage machines and tools through bionic means can effectively reduce the resistance of soil to tillage machines and tools [62,63]. Fan, Yu. studied the dynamic rupture characteristics of soil–tuber–root aggregates during potato harvesting and their coupling with the excavation shovel, designed a bionic excavating shovel based on the structural characteristics of wild boar arches, and verified the results through simulation and field experiments. It has a good drag reduction effect [64]. The torque of tillage tools can also be monitored by using discrete element software (see Figure 17) [65].
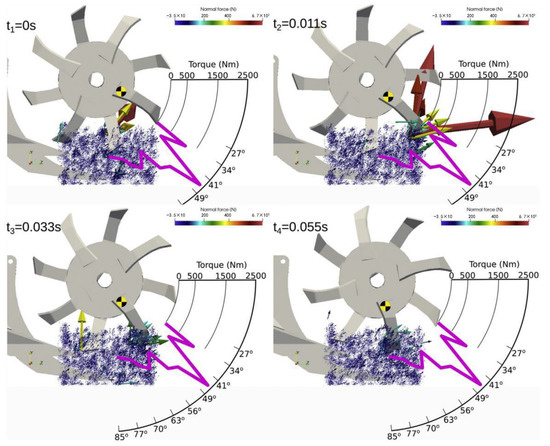
Figure 17.
Cyclic pattern of torque required for rotating knife. (t1) reference blade (fiducial marker) touching soil; (t2) position at maximum torque; (t3) intermediate position; (t4) moment when the next blade touches soil [65].
4. Test Analysis
4.1. Research on Disturbance Profile and Size of Soil
The soil disturbance test and cutting force test can effectively detect the effect of the tools on the soil. The disturbance profile is measured by a profiler and its shape is drawn into a graph. Generally, the cross-sectional area, width, and soil surface profile are used to describe the soil profile. where the disturbance width is the width of the trench at the soil surface level, and the soil surface profile can be measured by the area above and below the soil surface [66]. The soil dumped will be backfilled, which is called trench backfill. This refers to the part of soil where the loose soil falls back to the static state in the trench after the trencher passes through the trench. When measuring the disturbed profile, it is necessary to consider the soil cleaning of the falling part [67]. During the test, a profiler composed of wooden pegs was used to measure the shape of soil disturbance. After the measurement, the measured shape was transformed into an intuitive contour figure for intuitive analysis [68]. The disturbance profile of the tools to the soil is an important index to evaluate the effect of the machine tool on the soil, which reflects the disturbance range of the tools to the soil. Generally, the dynamic soil uplift height is defined as the maximum height of the loose soil during tillage [69]. During experiment, the specific resistance (traction force/soil disturbance) can be used as an index to quantify the tillage efficiency [70]. By analyzing the influencing factors such as power consumption, particle disturbance and soil coverage, the parameters of the machine can be optimized [71]. The accuracy of the established model can be analyzed by analyzing the shape error of the disturbance between simulation and experiment [72].
Aikins, K.A. developed a method to measure soil surface and trench profiles using a portable and affordable 3D scanner and verified the accuracy by comparing the measured profiles with a pin profiler [73]. To study the influence of the shovel distance of multiple subsoiling shovels on soil resistance and disturbance based on discrete elements, Hang, C. used a soil disturbance profiler and tracer block displacement measuring instrument to obtain soil pit profile and shallow soil displacement to verify simulation accuracy [74]. Huang, Y. analyzed the law of subsoiling shovel–soil interaction, compared the disturbance law of different soil layers, and found that the soil disturbance ranging from large to small is shallow, middle, and deep, and the boundary is drawn with the critical curve of the movement speed of soil particles [75]. The installation height of the wing shovel is one of the key structural parameters of a deep loosening shovel with wing, which has an important influence on the disturbance behavior of deep loosening soil. It mainly includes the disturbed profile of soil and the vertical stacking angle of soil. The disturbed profile of soil can be measured and drawn with a profile instrument, as shown in Figure 18 [76,77]. Soil particle size has an influence on soil disturbance characteristics (soil rupture distance ratio, cumulative soil height, soil disturbed area, soil density and rupture index) and computer solution time. The ratio of broken bonds to total bonds is the breaking rate. The higher the breaking index, the better the sowing and crop growth. Disturbance profile and disturbance situation are shown in Figure 19 [78]. Dong, Q. analyzed the soil disturbance process of the tillage layer during the vibratory subsoiling process. The simulation results show that the disturbance range depends on the maximum cross-sectional area of the omnidirectional subsoiling shovel. The soil trough test has verified that the cross-sectional profile of soil disturbance is consistent with the simulation results (see Figure 20) [79]. The subsoiling area is usually used as one of the evaluation indicators to evaluate the subsoiling effect. Through soil trough test measurement and three-dimensional reconstruction, the disturbance profile along the tillage direction during the test period was obtained, which can be used to analyze and predict the tillage effect more intuitively (see Figure 21) [80].
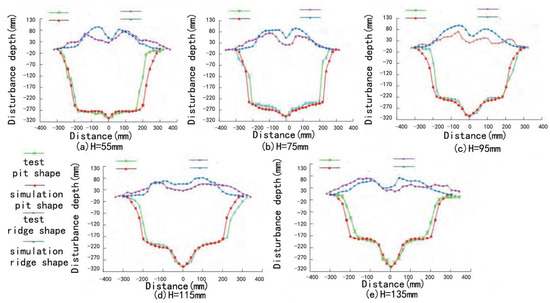
Figure 18.
Effect of wing shovel installation height on subsoiling disturbance profile [77].
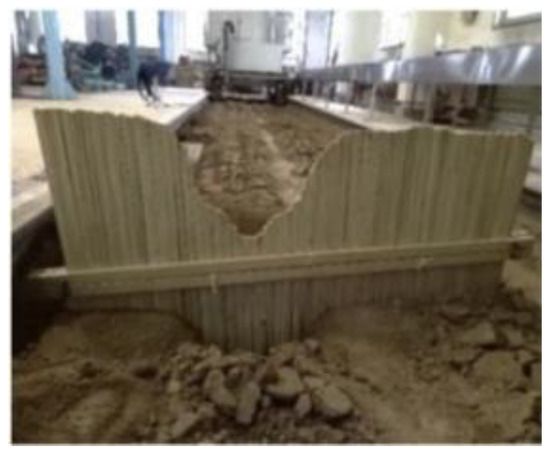
Figure 19.
Profiler and profile parameter measurements [78].
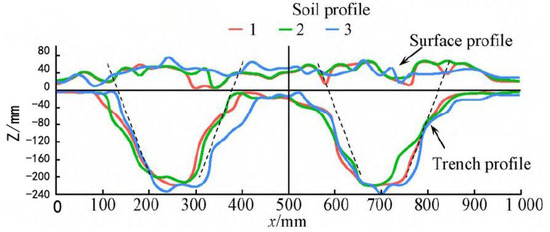
Figure 20.
Soil profile comparison [79].
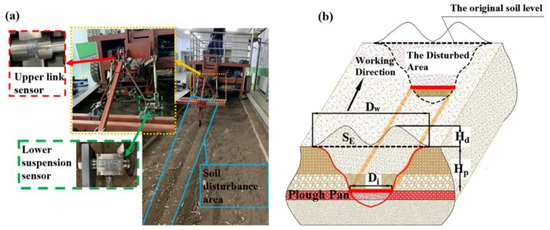
Figure 21.
(a) Test equipment and traction force measurement device in soil bin test; (b) Coulter disc breakage and soil disturbance cross-sectional model in soil bin test [80].
4.2. Analysis of the Influence of Implements on Soil and Residue Mixing
The tracer method can measure the soil displacement after disturbance. In the test, a marker different from the soil particle is used as the tracer. During simulation, the particles can be marked by the software’s own marking function as the tracer. The particle displacement and particle path described by the method can better describe the particle motion state after the action of the tools [81]. In the test, small particles different from the soil can be used as the tracking agent. The tracked particles are arranged according to certain rules. When the tools disturb the soil, the trajectory of the marker particles can be drawn to carry out proportional analysis on the mixing of particles, and obtain the effect of tools on soil.
Tools will change the soil and interfere with residues, which will ultimately determine the degree of mixing or separation of residues. In simulation and experiments, tracers are used to numerically evaluate the effect of tools [82,83]. Soil layer mixing is an important indicator of soil disturbance [54]. During the test and simulation time, the soil can be dyed to measure the mixing of particles after mixing, and spectral identification programs such as K-means clustering algorithm can be used to identify the mixing of different particles [84]. The kinetic energy analysis of the residue is also an analysis method of the influence of the tool on the residue. The kinetic energy of the residue is the sum of the kinetic energy of the translation and rotation of the residue in the model system. The blending effect is shown in Figure 22 [17]. The horizontal and lateral displacement and distribution of the straw are used to evaluate the distribution uniformity of the straw, and use this as the target parameter to find the optimal working parameters so that the straw can be uniformly dispersed in three directions. The difference between the initial and final positions, and the burial rate of straw under the action of the rotary tiller were studied, that is, the disturbance behavior between soil and straw was analyzed [85].
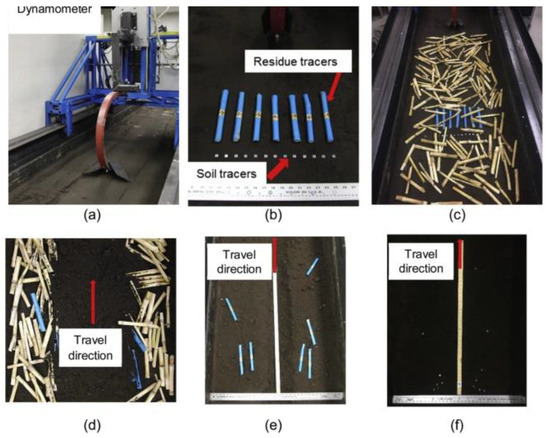
Figure 22.
Soil Bin Test Setup and Measurements [17]. (a) Tools, handles and hooks mounted on soil bin brackets by means of a plate dynamometer; (b) Arrangement of soil and residual tracer; (c) Corn stover randomly spread on the soil surface prior to tillage; (d) residue cover after tillage; (e,f) typical distribution of residues and soil tracers after tillage operations and a ruler for measuring the position of the tracer.
4.3. Soil Accumulation and Throwing
During the test, the throwing of soil was quantified by the throwing distance, the lateral and forward accumulation of soil was measured by the stacking height and stacking angle (Figure 23 [86]. Saunders C. conducted experiments on the openers under the conditions of different forward speeds and rake angles. The soil trench area and the maximum soil throwing distance were also measured in the soil groove test. After the openers were in operation, the soil was measured with a needle-type soil profiler [15]. The experimental results show that the resistance of soil to tools increases with the increase of soil accumulation [87,88].
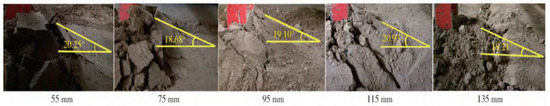
Figure 23.
Soil Longitudinal Stacking Angle [77].
4.4. Analysis of Soil Disturbance Proportion
The disturbance of the soil by the tools also includes the disturbance range of the soil. For example, the disturbance range of the straw ridge and the disturbance coefficient are used as indicators to optimize the parameters of the straw pulverizer [89]. Lysych, M.N. took the tooth profile of the biomimetic disc from an image of a mole’s paw and modeled it by reverse engineering as a disc with six identical soil-engaging teeth. The farming area was divided into 40 squares by grid division, small plastic cylinders was used as tracers, and the number of disturbed squares was used as the disturbance rate. The ratio comparison shows that the bionic disc has a small contact area with the soil and has a small disturbance and displacement rate. The grid division is shown as Figure 24 [90].
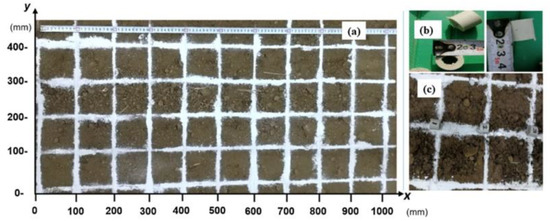
Figure 24.
Tracer placement and test soil meshing. (a) Grid of 40 small squares (100 mm2 each) used to determine soil disturbance; (b) Plastic tracer used to measure particle displacement; (c) Tracer aligned on a reference line [90].
4.5. Traction Resistance
Changes in soil failure modes can be attributed to changes in soil mechanical behavior, which include collapse, fracture (brittleness), debris formation, and flow [91]. In the test, the force sensor was used to measure the resistance and traction force of the tools when it acts on the soil, and the tillage force was used as an important criterion for evaluating the quality of tillage tools [92]. Zhao, H. installed a force sensor at the ground-contacting part and collected the force information through an information collection device, and sent it to the mobile terminal through a bluetooth device (see Figure 25) [80]. Zheng, K. compared the impact of soil particles, soil layer disturbance and traction resistance on the arc-shaped subsoiling shovel and the broken-line subsoiling shovel. For the arc-shaped subsoiling shovel, the field test results show that the broken line subsoiling shovel effectively reduces the bulk density and compactness of the plow bottom [93]. The type of contact model will affect the packing compactness of soil particles during simulation, and then affect the consistency of simulation results and experimental results [94,95].
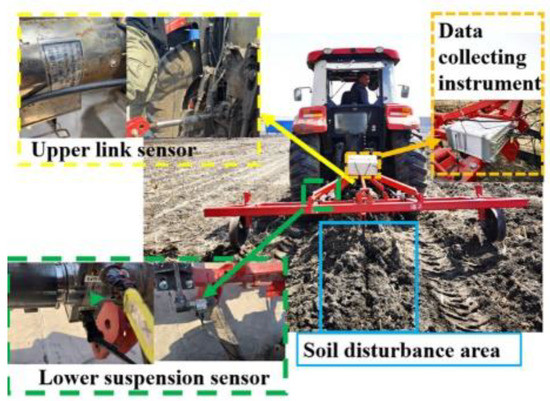
Figure 25.
Application of tractor and traction force measurement device in soil field experiment [80].
5. Discussion
Using the discrete element method to study the disturbance of tillage machine to soil can make a microscopic analysis of the interaction between the machine and soil, which is one of the indicators of tools optimization. However, the discrete element method simulation needs accurate parameter measurement and calibration, and needs to choose the appropriate particle contact model for more accurate simulation results [96]. During simulation, particle size also has a great impact on the accuracy of simulation results. If the particle size is too small, the simulation time will be too long, and if the particle size is too large, the accuracy will be affected. Therefore, the particle size needs to be reasonably analyzed and selected during simulation [97]. Therefore, if we want to analyze the interaction between the tools and the particles accurately and effectively by the discrete element method, we need to obtain the virtual parameters before the simulation.
5.1. Advantages of Current Research in This Field
The effect of tillage tools on soil can be predicted effectively by using discrete element method to analyze the disturbance of tillage machine and soil particles. The forces bonds can be used to analyze the failure and instability of the soil [98]. The profile shape and area can effectively predict the range and form of soil disturbance after the action of tools [99,100]. The forward soil accumulation and lateral soil accumulation are important factors affecting the resistance of the tools. The forward soil accumulation and lateral soil accumulation after the action of the tools can be reduced through parameter optimization [101]. The mixing trend after the action of the tools can effectively analyze the action trend of the tools on the soil, and can be used to analyze the movement direction of soil after the action of the tools, and can effectively predict the movement behavior of particles in combination with the movement path. The resistance of the tillage tools can also be predicted through simulation, and the resistance of the tillage tools during simulation can be reduced through parameter optimization [102]. High operation can improve the farming efficiency, but at the same time, it needs to make the soil disturbance less, so the disturbance analysis method can be used to reasonably value the farming speed and other parameters [103]. The effect of some bionic tillage components can also be analyzed by disturbance analysis method in advance [104]. The above simulation results can be verified by corresponding experiments after the optimization of the tools.
5.2. Limitations of This Study
During simulation, some particle parameters are difficult to measure, and most can be obtained through virtual parameter calibration, but some particle parameters with special properties are difficult to calibrate. The accuracy of simulation depends on the accuracy of simulation parameters. The smaller particle size makes the simulation calculations take a lot of time. Some experimental tools, such as portable profiler (with automatic drawing function), have not yet been popularized.
5.3. Prospects
- (1)
- The soil compaction degree before and after disturbance cannot be displayed and compared intuitively through simulation. Currently, the number of particles in the fixed area is used to represent the degree of compaction. The degree of compaction can reflect the compaction or loosening of the soil after the action of the tools. Condition is an important indicator to characterize the effect of tools. In the future, if a function that can intuitively represent particle compaction contours can be developed, soil disturbance analysis will be more intuitive and convenient.
- (2)
- The current measurement of the disturbance profile is based on a self-made profiler and requires hand-painting or image processing to obtain the soil profile after the measurement. The procedure is relatively complicated. It is good if it can be directly drawn into a map and stored in the field, which will make the field disturbance profile measurement more convenient and accurate.
- (3)
- At present, the soil mixing is mainly based on simulation analysis. In the test, the tracer is used as the tracking marker, but this is mainly to study the movement law of a small number of particles. Soil dyeing and other operations on the operation area in the flume test can more intuitively analyze the mixing of soil particles in different soil layers. This is convenient for comparative analysis of errors between simulation and experiment, so as to better verify the accuracy of simulation and soil movement trend.
6. Conclusions
This paper focuses on the study of the interaction between machinery and soil particles by using the discrete element method. In order to provide help for the optimization of farming machinery. The research mainly discussed in this paper is shown in Table 1.

Table 1.
Main contents of conclusions.
In the future, we hope to develop a convenient and cheap automatic soil profile measuring instrument. Common material discrete element parameters are expected to be summarized to facilitate simulation. It is hoped that the discrete element calculation can be accelerated to improve the calculation efficiency of simulation.
Author Contributions
Conceptualization: W.F., X.W. and D.H. reviewed the literature and wrote the initial draft of the paper with assistance from D.H. with X.W.; X.W. and X.C. contributed to revising the manuscript. All authors have read and agreed to the published version of the manuscript.
Funding
This work was supported by The National Key Research and Development Project (No.2022YFD2002403), Jiangsu Province Modern Agricultural Machinery Equipment and Technology Demonstration and Promotion Project (No. NJ2020-14), Project of the Agricultural Equipment Faculty of Jiangsu University (No. NZXB20200104), and the Priority Academic Program Development of Jiangsu Higher Education Institutions (PAPD-2018-87).
Institutional Review Board Statement
Not applicable.
Data Availability Statement
Not applicable.
Conflicts of Interest
The authors declare no conflict of interest.
References
- Ucgul, M.; Saunders, C.; Fielke, J.M. Comparison of the discrete element and finite element methods to model the interaction of soil and tool cutting edge. Biosyst. Eng. 2018, 169, 199–208. [Google Scholar] [CrossRef]
- Lysych, M.N.; IOP. Review of numerical methods for modeling the interaction of soil environments with the tools of soil tillage machines. In Proceedings of the International Scientific Conference on Applied Physics, Information Technologies and Engineering (APITECH)/2nd International Scientific and Practical Conference on Borisov’s Readings, Krasnoyarsk, Russia, 25–27 September 2019. [Google Scholar]
- Barr, J.B.; Ucgul, M.; Desbiolles, J.M.; Fielke, J.M. Simulating the effect of rake angle on narrow opener performance with the discrete element method. Biosyst. Eng. 2018, 171, 1–15. [Google Scholar] [CrossRef]
- Barr, J.B.; Desbiolles, J.M.A.; Fielke, J.M. Minimising soil disturbance and reaction forces for highspeed sowing using bentleg furrow openers. Biosyst. Eng. 2016, 151, 53–64. [Google Scholar] [CrossRef]
- Zeng, Z.; Chen, Y.; Zhang, X. Modelling the interaction of a deep tillage tool with heterogeneous soil. Comput. Electron. Agric. 2017, 143, 130–138. [Google Scholar] [CrossRef]
- Wang, Y.; Xue, W.; Ma, Y.; Tong, J.; Liu, X.; Sun, J. DEM and soil bin study on a biomimetic disc furrow opener. Comput. Electron. Agric. 2019, 156, 209–216. [Google Scholar] [CrossRef]
- Sun, J.Y.; Wang, Y.M.; Ma, Y.H.; Tong, J.; Zhang, Z.J. DEM simulation of bionic subsoilers (tillage depth >40 cm) with drag reduction and lower soil disturbance characteristics. Adv. Eng. Softw. 2018, 119, 30–37. [Google Scholar] [CrossRef]
- Li, J.; Jiang, X.; Ma, Y.; Tong, J.; Hu, B. Bionic Design of a Potato Digging Shovel with Drag Reduction Based on the Discrete Element Method (DEM) in Clay Soil. Appl. Sci. 2020, 10, 7096. [Google Scholar] [CrossRef]
- Sun, J.; Chen, H.; Wang, Z. Study on plowing performance of EDEM low-resistance animal bionic device based on red soil. Soil Tillage Res. 2020, 196, 104336. [Google Scholar] [CrossRef]
- Wu, Z.; Wang, X.; Liu, D. Calibration of discrete element parameters and experimental verification for modelling subsurface soils. Biosyst. Eng. 2021, 212, 215–227. [Google Scholar] [CrossRef]
- Yang, Y.; Wen, B.; Ding, L.; Li, L.; Chen, X.; Li, J. Soil Particle Modeling and Parameter Calibration for Use with Discrete Element Method. Trans. Asabe 2021, 64, 2011–2023. [Google Scholar] [CrossRef]
- Shaikh, S.A.; Li, Y.; Ma, Z. Discrete element method (DEM) simulation of single grouser shoe-soil interaction at varied moisture contents. Comput. Electron. Agric. 2021, 191, 106538. [Google Scholar] [CrossRef]
- Lopez, B.E.; Tijskens, E.; Herrera, S.M.; Gonzalez, C.O.; Ramon, H. Prediction model for non-inversion soil tillage implemented on discrete element method. Comput. Electron. Agric. 2014, 106, 120–127. [Google Scholar]
- Ahmad, F.; Qiu, B.; Ding, Q. Discrete element method simulation of disc type furrow openers in paddy soil. Int. J. Agric. Biol. Eng. 2020, 13, 103–110. [Google Scholar] [CrossRef]
- Saunders, C.; Ucgul, M.; Godwin, R.J. Discrete element method (DEM) simulation to improve performance of a mouldboard skimmer. Soil Tillage Res. 2021, 205, 104764. [Google Scholar] [CrossRef]
- Ajmal, M.; Roessler, T.; Richter, C.; Katterfeld, A. Calibration of cohesive DEM parameters under rapid flow conditions and low consolidation stresses. Powder Technol. 2020, 374, 22–32. [Google Scholar] [CrossRef]
- Zeng, Z.; Ma, X.; Chen, Y.; Qi, L. Modelling residue incorporation of selected chisel ploughing tools using the discrete element method (DEM). Soil Tillage Res. 2020, 197, 104505. [Google Scholar] [CrossRef]
- Zhao, H.; Li, H.; Ma, S. The effect of various edge-curve types of plain-straight blades for strip tillage seeding on torque and soil disturbance using DEM. Soil Tillage Res. 2020, 202, 104674. [Google Scholar] [CrossRef]
- Shi, Z.; Yu, Z.; Yang, L.; Yang, M. On Simulation and experiment of Soil Disturbance Cause by Airfoil Subsoil Shovel Spacing. J. Southwest Norm. Univ. 2021, 46, 38–44. [Google Scholar]
- Zhao, S.; Gao, L.; Yuan, Y.; Hou, L.; Zhang, X.; Yang, Y. Maize straw motion law in subsoiling operation using discrete element method. Trans. Chin. Soc. Agric. Eng. 2021, 37, 53–62. [Google Scholar]
- Zeng, R.; Lin, Y.; Wan, Z.; Tu, M.; Jiao, J.; Zhang, G. An Investigation of Pull-Out Force of Semi-Buried Lotus Roots after Hydraulic Scouring. Agriculture 2021, 11, 706. [Google Scholar] [CrossRef]
- Li, B.; Chen, Y.; Chen, J. Comparison of Two Subsoiler Designs Using the Discrete Element Method (DEM). Trans. Asabe 2018, 61, 1529–1537. [Google Scholar] [CrossRef]
- Zhao, S.; Liu, H.; Yang, C.; Yang, L.; Gao, L.; Yang, Y. Design and Discrete Element Simulation of Interactive Layered Subsoiler with Maize Straw Returned to Filed. Trans. Chin. Soc. Agric. Mach. 2021, 52, 75–87. [Google Scholar]
- Hoseinian, S.H.; Hemmat, A.; Esehaghbeygi, A.; Shahgoli, G.; Baghbanan, A. Development of a dual sideway-share subsurface tillage implement: Part 2. Effect of tool geometry on tillage forces and soil disturbance characteristics. Soil Tillage Res. 2022, 215, 105200. [Google Scholar] [CrossRef]
- Zhang, R.; Ji, Q.; Zhang, S.; Liu, F.; Li, J. Effect of Wheel Surface Curvature Radius on Sinkage Performance of Sand Rigid Wheel. Trans. Chin. Soc. Agric. Mach. 2016, 47, 341–349. [Google Scholar]
- Qi, L.; Chen, Y.; Sadek, M. Simulations of soil flow properties using the discrete element method (DEM). Comput. Electron. Agric. 2019, 157, 254–260. [Google Scholar] [CrossRef]
- Tamas, K. The role of bond and damping in the discrete element model of soil-sweep interaction. Biosyst. Eng. 2018, 169, 57–70. [Google Scholar] [CrossRef]
- Zhang, R.; Li, J.; Zhou, C.; Xu, S. Simulation of dynamic behavior of soil ahead of the bulldozing plates with different surface configurations by discrete element method. Trans. Chin. Soc. Agric. Eng. 2007, 23, 13–19. [Google Scholar]
- Li, Y.; Wu, T.; Lin, J.; Xu, Y. Influence of penetrating cone on motion characteristics of sandy soil particle using discrete element method. Trans. Chin. Soc. Agric. Eng. 2012, 28, 55–61. [Google Scholar]
- Zeng, Z.; Chen, Y. Simulation of straw movement by discrete element modelling of straw-sweep-soil interaction. Biosyst. Eng. 2019, 180, 25–35. [Google Scholar] [CrossRef]
- Zhao, S.; Wang, J.; Chen, J.; Yang, Y.; Tan, H. Design and Experiment of Fitting Curve Subsoiler of Conservation Tillage. Trans. Chin. Soc. Agric. Mach. 2018, 49, 82–92. [Google Scholar]
- Zhao, S.; Liu, H.; Hou, L.; Zhang, X.; Yuan, Y.; Yang, Y. Development of deep fertilizing no-tillage segmented maize sowing opener using discrete element method. Trans. Chin. Soc. Agric. Eng. 2021, 37, 1–10. [Google Scholar]
- Bo, L.; Rui, X.; Liu, F.; Jun, C.; Han, W.; Bing, H. Determination of the draft force for different subsoiler points using discrete element method. Int. J. Agric. Biol. Eng. 2016, 9, 81–87. [Google Scholar]
- Gu, X.; Chen, Y.; Huang, M. Critical state shear behavior of the soil-structure interface determined by discrete element modeling. Particuology 2017, 35, 68–77. [Google Scholar] [CrossRef]
- Tamas, K.; Jori, I.J.; Mouazen, A.M. Modelling soil-sweep interaction with discrete element method. Soil Tillage Res. 2013, 134, 223–231. [Google Scholar] [CrossRef]
- Zhao, H.; Huang, Y.; Liu, Z.; Liu, W.; Zheng, Z. Applications of Discrete Element Method in the Research of Agricultural Machinery: A Review. Agriculture 2021, 11, 425. [Google Scholar] [CrossRef]
- Zeng, H.; Xu, W.; Zang, M.; Yang, P.; Guo, X. Calibration and validation of DEM-FEM model parameters using upscaled particles based on physical experiments and simulations. Adv. Powder Technol. 2020, 31, 3947–3959. [Google Scholar] [CrossRef]
- Ibrahim, A.N.; Sabarudin, S.S.; Fukuoka, Y. Effects of Wheel Grouser Angle of Attack on Simulated Robot Wheel Performance on Soft Sand with High Slip Condition. In Proceedings of the 4th IEEE International Conference on Advanced Robotics and Mechatronics (ICARM), Osaka, Japan, 3–5 July 2019. [Google Scholar]
- Han, D.; Zhang, R.; Zhang, H.; Hu, Z.; Li, J. Mechanical Performances of Typical Robot Feet Intruding into Sands. Energies 2020, 13, 1867. [Google Scholar] [CrossRef]
- Zeng, Z.W.; Chen, Y.; Qi, L. Simulation of cotyledon-soil dynamics using the discrete element method (DEM). Comput. Electron. Agric. 2020, 174, 105505. [Google Scholar] [CrossRef]
- Tian, L.; Cao, C.; Qin, K.; Fang, L.; Ge, J. Design and test of post-seat weeding machine for paddy. Int. J. Agric. Biol. Eng. 2021, 14, 112–122. [Google Scholar] [CrossRef]
- Aikins, K.A.; Barr, J.B.; Antille, D.L.; Ucgul, M.; Jensen, T.A.; Desbiolles, J.M.A. Analysis of effect of bentleg opener geometry on performance in cohesive soil using the discrete element method. Biosyst. Eng. 2021, 209, 106–124. [Google Scholar] [CrossRef]
- Zhao, H.; Jin, H.E.; Li, H.; Liu, C.; Zheng, K.; Zhang, Z. Design and Experiment of Strip Rotary-cut-throw Anti-blocking Implement. Trans. Chin. Soc. Agric. Mach. 2018, 49, 65–75. [Google Scholar]
- Han, D.; Zhang, R.; Cao, Q.; Jiang, L.; Li, J. Research in mechanical model of bionic foot intruding into sands with different physical characteristics. J. Terramechanics 2021, 98, 25–33. [Google Scholar] [CrossRef]
- Li, B.; Chen, Y.; Chen, J. Modeling of soil-claw interaction using the discrete element method (DEM). Soil Tillage Res. 2016, 158, 177–185. [Google Scholar] [CrossRef]
- Tekeste, M.Z.; Balvanz, L.R.; Hatfield, J.L.; Ghorbani, S. Discrete element modeling of cultivator sweep-to-soil interaction: Worn and hardened edges effects on soil-tool forces and soil flow. J. Terramechanics 2019, 82, 1–11. [Google Scholar] [CrossRef]
- Murray, S.E.; Chen, Y. Discrete Element Modeling of Soil Displacement Resulting from Hoe Openers. Trans. Asabe 2019, 62, 253–262. [Google Scholar] [CrossRef]
- Tsuji, T.; Matsui, Y.; Nakagawa, Y.; Kadono, Y.; Tanaka, T. DEM Study on the Interaction between Wet Cohesive Granular Materials and Tools. In Proceedings of the 7th International Conference on Micromechanics of Granular Media (Powders and Grains), Sydney, Australia, 8–12 July 2013. [Google Scholar]
- Ucgul, M.; Saunders, C.; Fielke, J.M. Discrete element modelling of top soil burial using a full scale mouldboard plough under field conditions. Biosyst. Eng. 2017, 160, 140–153. [Google Scholar] [CrossRef]
- Ucgul, M.; Fielke, J.M.; Saunders, C. 3D DEM tillage simulation: Validation of a hysteretic spring (plastic) contact model for a sweep tool operating in a cohesionless soil. Soil Tillage Res. 2014, 144, 220–227. [Google Scholar] [CrossRef]
- Xu, L.; Feng, T.; Song, Y.; Li, F.; Song, Z. Research on Drag Reduction Mechanism of Bionic Rib Subsoiling Shovel Based on Discrete Element Method. In Proceedings of the 3rd International Workshop on Renewable Energy and Development (IWRED), Guangzhou, China, 8–10 March 2019. [Google Scholar]
- Huang, Y.; Gao, P.; Zhang, Q.; Shen, H.; Zhu, R.; Shi, J. Design and Experiment of Grass-Soil Separation Device with Combination of Stubble Cutting and Grass Guiding Used for No-till Planter. Trans. Chin. Soc. Agric. Mach. 2020, 51, 67–78. [Google Scholar]
- Solhjou, A.; Desbiolles, J.M.A.; Fielke, J.M. Soil translocation by narrow openers with various blade face geometries. Biosyst. Eng. 2013, 114, 259–266. [Google Scholar] [CrossRef]
- Hoseinian, S.H.; Hemmat, A.; Esehaghbeygi, A.; Shahgoli, G.; Baghbanan, A. Development of a dual sideway-share subsurface tillage implement: Part 1. Modeling tool interaction with soil using DEM. Soil Tillage Res. 2022, 215, 105201. [Google Scholar] [CrossRef]
- Wang, Y.; Zhang, D.; Yang, L.; Cui, T.; Jing, H.; Zhong, X. Modeling the interaction of soil and a vibrating subsoiler using the discrete element method. Comput. Electron. Agric. 2020, 174, 105518. [Google Scholar] [CrossRef]
- Chen, Y.; Munkholm, L.J.; Nyord, T. A discrete element model for soil-sweep interaction in three different soils. Soil Tillage Res. 2013, 126, 34–41. [Google Scholar] [CrossRef]
- Zhang, X.; Zeng, W.; Liu, J.; Wu, P.; Dong, X.; Hu, H. Design and Experiment of Iateritic Soil Inclined Handle Folding Wing Subsoiling Shovel Based on Discrete Element Method. Trans. Chin. Soc. Agric. Mach. 2022, 53, 40–49. [Google Scholar]
- Ding, Q.; Li, Y.; Belal, E.A.; Liang, L.; He, R.; Wang, X. Subsoiler-induced Paddy Soil Disturbance and Effects Based on Video-assisted Multi-index Quantification. Trans. Chin. Soc. Agric. Mach. 2019, 50, 44–55. [Google Scholar]
- Du, J.; Heng, Y.; Zheng, K. Investigation of the burial and mixing performance of a rotary tiller using discrete element method. Soil Tillage Res. 2022, 220, 105349. [Google Scholar] [CrossRef]
- Ma, W.; You, Y.; Wang, D.; Hu, J.; Huan, X.; Zhu, L. Design and Experiment of Low-resistance Soil Loosening Shovel for Cutting Roots and Reseeding in Perennial Alfalfa Field. Trans. Chin. Soc. Agric. Mach. 2021, 52, 86–95, 144. [Google Scholar]
- Wang, Y.; Li, N.; Ma, Y.; Tong, J.; Pfleging, W.; Sun, J. Field experiments evaluating a biomimetic shark-inspired (BioS) subsoiler for tillage resistance reduction. Soil Tillage Res. 2020, 196, 104432. [Google Scholar] [CrossRef]
- Yang, Y.; Li, M.; Tong, J.; Ma, Y. Study on the Interaction between Soil and the Five-Claw Combination of a Mole Using the Discrete Element Method. Appl. Bionics Biomech. 2018, 2018, 7854052. [Google Scholar] [CrossRef]
- Zhang, Z.; Gan, S.; Zuo, G.; Tong, J. Bionic Design and Performance Experiment of Sandfish Head Inspired Subsoiler Tine. Trans. Chin. Soc. Agric. Mach. 2021, 52, 33–42. [Google Scholar]
- Fan, Y. Research on potato digging mechanism based on discrete element method and design of bionic shove. Shenyang Agric. Univ. 2020. [Google Scholar] [CrossRef]
- Barbosa, L.A.P. Modelling the aggregate structure of a bulk soil to quantify fragmentation properties and energy demand of soil tillage tools in the formation of seedbeds. Biosyst. Eng. 2020, 197, 203–215. [Google Scholar] [CrossRef]
- Hasimu, A.; Chen, Y. Soil disturbance and draft force of selected seed openers. Soil Tillage Res. 2014, 140, 48–54. [Google Scholar] [CrossRef]
- Aikins, K.A.; Barr, J.B.; Ucgul, M.; Jensen, T.A.; Antille, D.L.; Desbiolles, J.M.A. No-tillage furrow opener performance: A review of tool geometry, settings and interactions with soil and crop residue. Soil Res. 2020, 58, 603–621. [Google Scholar] [CrossRef]
- Milkevych, V.; Munkholm, L.J.; Chen, Y.; Nyord, T. Modelling approach for soil displacement in tillage using discrete element method. Soil Tillage Res. 2018, 183, 60–71. [Google Scholar] [CrossRef]
- Barr, J.; Desbiolles, J.; Ucgul, M.; Fielke, J.M. Bentleg furrow opener performance analysis using the discrete element method. Biosyst. Eng. 2020, 189, 99–115. [Google Scholar] [CrossRef]
- Keppler, I.; Hudoba, Z.; Oldal, I.; Csatar, A.; Fenyvesi, L. Discrete element modeling of vibrating tillage tools. Eng. Comput. 2015, 32, 308–328. [Google Scholar] [CrossRef]
- Wang, Z.; Zhang, X.; Yi, J.; Kong, D.; Yuan, Y.; Ma, M.; Ma, J.; Zhang, J. Design and research of an integrated operation machine for straw reactor. In Proceedings of the 2020 ASABE Annual International Virtual Meeting, St. Joseph, MI, USA, 13–15 July 2020. [Google Scholar]
- Ucgul, M.; Saunders, C. Simulation of tillage forces and furrow profile during soil-mouldboard plough interaction using discrete element modelling. Biosyst. Eng. 2020, 190, 58–70. [Google Scholar] [CrossRef]
- Aikins, K.A.; Jensen, T.A.; Antille, D.L. Three-dimensional scanning of soil surface and furrow profiles using a portable and affordable unit. Biosyst. Eng. 2020, 193, 279–289. [Google Scholar] [CrossRef]
- Hang, C.; Huang, Y.; Zhu, R. Analysis of the movement behaviour of soil between subsoilers based on the discrete element method. J. Terramechanics 2017, 74, 35–43. [Google Scholar] [CrossRef]
- Huang, Y.; Hang, C.; Yuan, M.; Wang, B.; Zhu, R. Discrete Element Simulation and Experiment on Disturbance Behavior of Subsoiling. Trans. Chin. Soc. Agric. Mach. 2016, 47, 80–88. [Google Scholar]
- Matin, M.A.; Fielke, J.M.; Desbiolles, J.M.A. Furrow parameters in rotary strip-tillage: Effect of blade geometry and rotary speed. Biosyst. Eng. 2014, 118, 7–15. [Google Scholar] [CrossRef]
- Wang, X.; Yue, B.; Gao, X.; Zheng, Z.; Zhu, R.; Huang, Y. Discrete Element Simulations and Experiments of Disturbance Behavior as Affected by Mounting Height of Subsoiler’s Wing. Trans. Chin. Soc. Agric. Mach. 2018, 49, 124–136. [Google Scholar]
- Wang, X.; Zhang, S.; Pan, H.; Zheng, Z.; Huang, Y.; Zhu, R. Effect of soil particle size on soil-subsoiler interactions using the discrete element method simulations. Biosyst. Eng. 2019, 182, 138–150. [Google Scholar] [CrossRef]
- Dong, X.; Su, C.; Zheng, H.; Han, R.; Li, Y.; Wan, L.; Song, J.; Wang, J. Analysis of soil disturbance process by vibrating subsoiling based on DEM-MBD coupling algorithm. Trans. Chin. Soc. Agric. Eng. 2022, 38, 34–43. [Google Scholar]
- Song, W.; Jiang, X.; Li, L.; Ren, L.; Tong, J. Increasing the width of disturbance of plough pan with bionic inspired subsoilers. Soil Tillage Res. 2022, 220, 105356. [Google Scholar] [CrossRef]
- Gursoy, S.; Chen, Y.; Li, B. Measurement and modelling of soil displacement from sweeps with different cutting widths. Biosyst. Eng. 2017, 161, 1–13. [Google Scholar] [CrossRef]
- Zhang, J.H.; Jia, L.Z.; Zhang, Z.H.; Wei, Y.H.; Wang, Y.; Su, Z.A. Effect of the soil-implement contact area on soil translocation under hoeing tillage. Soil Tillage Res. 2018, 183, 42–50. [Google Scholar] [CrossRef]
- Fang, H.M.; Ji, C.Y.; Zhang, Q.Y.; Guo, J. Force analysis of rotary blade based on distinct element method. Trans. CSAE 2016, 32, 54–59. [Google Scholar]
- Li, P.; Ucgul, M.; Lee, S.H.; Saunders, C. A new method to analyse the soil movement during tillage operations using a novel digital image processing algorithm. Comput. Electron. Agric. 2019, 156, 43–50. [Google Scholar] [CrossRef]
- Fang, H.; Ji, C.; Ahmed, A.T.; Zhang, Q.; Guo, J. Simulation Analysis of Straw Movement in Straw-Soil-Rotary Blade System. Trans. Chin. Soc. Agric. Mach. 2016, 47, 60–67. [Google Scholar]
- Wu, J.; Shen, Y.; Yang, S.; Feng, Z. Simulation of Track-Soft Soil Interactions Using a Discrete Element Method. Appl. Sci. 2022, 12, 2524. [Google Scholar] [CrossRef]
- Abdeldayem, M.A.A.; Mabrouk, M.H.; Abo-Elnor, M. Analytical and Numerical Modeling of Soil Cutting and Transportation During Auger Drilling Operation. In Proceedings of the ASME 2019 International Mechanical Engineering Congress and Exposition, Salt Lake City, UT, USA, 11–14 November 2019; Volume 7. [Google Scholar]
- Wang, W.; Zhu, C.; Chen, L.; Li, Z.; Huang, X.; Li, J. Design and experiment of active straw-removing anti-blocking device for maize no-tillage planter. Trans. Chin. Soc. Agric. Eng. 2017, 33, 10–17. [Google Scholar]
- Shi, Y.; Xin, S.; Wang, X.; Hu, Z.; Newman, D.; Ding, W. Numerical simulation and field tests of minimum-tillage planter with straw smashing and strip laying based on EDEM software. Comput. Electron. Agric. 2019, 166, 105021. [Google Scholar] [CrossRef]
- Lysych, M.N. Computer simulation of the process soil treatment by tillage tools of soil processing machines. Comput. Res. Modeling 2020, 12, 607–627. [Google Scholar] [CrossRef]
- Ani, O.A.; Uzoejinwa, B.B.; Ezeama, A.O.; Onwualu, A.P.; Ugwu, S.N.; Ohagwu, C.J. Overview of soil-machine interaction studies in soil bins. Soil Tillage Res. 2018, 175, 13–27. [Google Scholar] [CrossRef]
- Makange, N.R.; Ji, C.; Nyalala, I.; Sunusi, I.I.; Opiyo, S. Prediction of precise subsoiling based on analytical method, discrete element simulation and experimental data from soil bin. Sci. Rep. 2021, 11, 11082. [Google Scholar] [CrossRef]
- Zheng, K.; He, J.; Li, H.; Diao, P.; Wang, Q.; Zhao, H. Research on Polyline Soil breaking Blade Subsoiler Based on Subsoiling Soil Model Using Discrete Element Method. Trans. Chin. Soc. Agric. Mach. 2016, 47, 62–72. [Google Scholar]
- Makange, N.R.; Ji, C.; Torotwa, I. Prediction of cutting forces and soil behavior with discrete element simulation. Comput. Electron. Agric. 2020, 179, 105848. [Google Scholar] [CrossRef]
- Wang, X.; Gao, P.; Yue, B. Optimisation of installation parameters of subsoiler wing using the discrete element method. Comput. Electron. Agric. 2019, 12, 523–530. [Google Scholar] [CrossRef]
- Fang, W.; Wang, X.; Han, D.; Chen, X. Review of Material Parameter Calibration Method. Agriculture 2022, 12, 706. [Google Scholar] [CrossRef]
- Wang, X.; Wei, W.; He, J.; Huang, Y. Effect of soil particle-size distribution (PSD) on soil-subsoiler interactions in the discrete element model. Span. J. Agric. Res. 2021, 19, 205. [Google Scholar] [CrossRef]
- Liu, C.; Pan, L.; Wang, F.; Zhang, Z.; Cui, J.; Liu, H.; Duan, Z.; Ji, X. Three-Dimensional Discrete Element Analysis on Tunnel Face Instability in Cobbles Using Ellipsoidal Particles. Materials 2019, 12, 3347. [Google Scholar] [CrossRef] [PubMed]
- Gao, X.; Tang, D.; Yue, H.; Jiang, S.; Deng, Z. Influence of friction on sampling disturbance of lunar surface in direct push sampling method based on DEM. Adv. Space Res. 2017, 59, 3036–3044. [Google Scholar] [CrossRef]
- Hang, C.; Gao, X.; Yuan, M.; Huang, Y.; Zhu, R. Discrete element simulations and experiments of soil disturbance as affected by the tine spacing of subsoiler. Biosyst. Eng. 2018, 168, 73–82. [Google Scholar] [CrossRef]
- Wang, X.; Zhou, H.; Ji, J. Effect of Mounting Angle on Bending Subsoiling Tool-Soil Interactions Using DEM Simulations. Agriculture 2022, 12, 1830. [Google Scholar] [CrossRef]
- Tong, J.; Jiang, X.; Wang, Y.; Ma, Y.; Li, J.; Sun, J. Tillage force and disturbance characteristics of different geometric-shaped subsoilers via DEM. Adv. Manuf. 2020, 8, 392–404. [Google Scholar] [CrossRef]
- Aikins, K.A.; Antille, D.L.; Ucgul, M.; Barr, J.B.; Jensen, T.A.; Desbiolles, J.M.A. Analysis of effects of operating speed and depth on bentleg opener performance in cohesive soil using the discrete element method. Comput. Electron. Agric. 2021, 187, 106236. [Google Scholar] [CrossRef]
- Zhang, L.; Zhai, Y.; Chen, J.; Zhang, Z.; Huang, S. Optimization design and performance study of a subsoiler underlying the tea garden subsoiling mechanism based on bionics and EDEM. Soil Tillage Res. 2022, 220, 105375. [Google Scholar] [CrossRef]


Disclaimer/Publisher’s Note: The statements, opinions and data contained in all publications are solely those of the individual author(s) and contributor(s) and not of MDPI and/or the editor(s). MDPI and/or the editor(s) disclaim responsibility for any injury to people or property resulting from any ideas, methods, instructions or products referred to in the content. |
© 2022 by the authors. Licensee MDPI, Basel, Switzerland. This article is an open access article distributed under the terms and conditions of the Creative Commons Attribution (CC BY) license (https://creativecommons.org/licenses/by/4.0/).