Abstract
Damage to soil structure caused by strong earthquakes is one of the main reasons for post-earthquake geohazard development. To investigate the nonlinear dynamic behaviors of the post-earthquake loess, a pre-shock reconsolidation test was designed to simulate the process of the loess undergoing earthquake and post-earthquake reconsolidation in a natural state. Furthermore, dynamic triaxial tests of the specimens before and after pre-shock action and consolidation stabilization with different over-consolidation ratios (OCR) were conducted to investigate the variety of the dynamic modulus and damping ratio of the saturated loess. The influence of pre-shock and reconsolidation on the dynamic behaviors was determined. Moreover, the mechanism of the changes after pre-shock and consolidation was discussed by combining the microstructure test results of soil samples before and after pre-shock and reconsolidation. The results suggest that the kinetic stiffness of the pre-shock saturated loess decreases significantly under the same consolidation conditions. The growth of the damping ratio-dynamic strain curve increases, and the deformation potential of the loess has a remarkable growth. With an increase in OCR, the dynamic elastic modulus after pre-shock increases continuously; however, the damping ratio decreases significantly. The dynamic stiffness increases and the deformation potential weakens significantly. The strong earthquake leads to the weakening of interparticle cementation, pore penetration, and structural reorganization in the local area, causes connecting of the macropores, and produces microfractures in the soil, which makes a significant decrease in the dynamic shear modulus ratio and an increase in the damping ratio of the loess, leading to the enhancement of soil dynamic nonlinearity and the attenuation of the dynamic strength. Moreover, the compaction effect of reconsolidation on the soil increases the interparticle friction and heals some microfractures, which leads to an increase in soil stiffness. This makes the maximum dynamic shear modulus and the maximum dynamic shear stress amplitude of the post-cyclic saturated loess perform at the same level compared with the natural loess without shock when the OCR equals three. However, the dynamic shear modulus and the damping ratio of the post-cyclic saturated loess are close to the natural loess when the OCR equals two.
1. Introduction
As a problematic soil, loess is extensively distributed in Central and Eastern Asia, especially in Northern China. The Loess Plateau mainly includes the provinces such as Gansu, Shaanxi, Henan, Qinghai, and Shanxi, as well as the Autonomous Region of Ningxia and Inner Mongolia. The thickness of the loess layer has obvious regional differences, which vary from several meters to more than 500 m, including loess plateau, loess beam, loess mount, loess terraces, and a variety of geomorphic units [1,2]. The particle composition of the loess is mainly silt content, which is commonly 50–80% [1]. The clay content and sand content have obvious regional differences [3]. The loess region in China is mostly an arid area. The loess is distributed with a large number of pores due to its formation; that is, from the eolian sediment and erosional-depositional by rain-wash [4,5]. A significant portion of these pores are visible to the eyes and consist of multiple particles lapped together, while the cement between the particles is only a small amount of soluble salt and mucilage, which makes these pores exist naturally in a sub-stable state [6,7]. This state causes the loess to have engineering properties such as high compressibility, strong water sensitivity, and high seismic sensitivity.
In Northern China, there are large-scale seismic belt zones including the Haiyuan seismic belt zone, the Fenhe-Weihe fault zone, and the Western Qinling fault zone [8]. The neotectonic movements were strong and the seismic activities were frequent [9]. More than 570 strong earthquakes from 78 B. C., including many huge earthquakes, such as the Huaxian earthquake in 1556, the Haiyuan earthquake in 1920, the Hongtong earthquake in 1303, and the Tianshui earthquake in 1654. More than 1.4 million deaths are blamed, most of which are caused by seismic geohazards including landslides and mud flows caused by loess liquefaction (Figure 1 and Figure 2) [1,10,11,12,13].
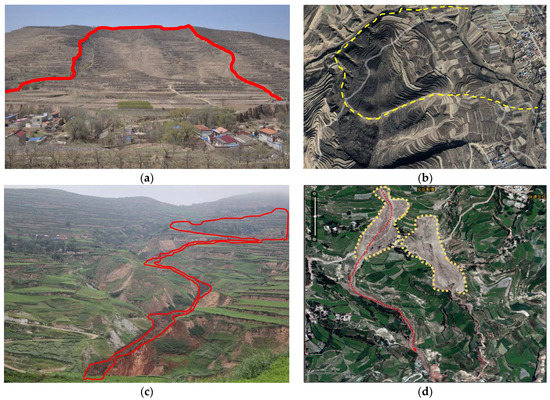
Figure 1.
Earthquake-induced geological disasters in the Loess Plateau: (a) the Sunjiagou landslide triggered by the Haiyuan earthquake in 1920, (b) satellite imagery of the Sunjiagou landslide and the surrounding areas from Google Earth, (c) the Yongguang landslide and mudflow triggered by the Minxian-Zhangxian earthquake in 2013, and (d) satellite imagery of the Yongguang landslide and slide path of the mudflow. Note the red line in (a,c), and the yellow line in (b,d) are the boundary of the landslides, the red dotted line in (d) is the slide path of the mudflow.
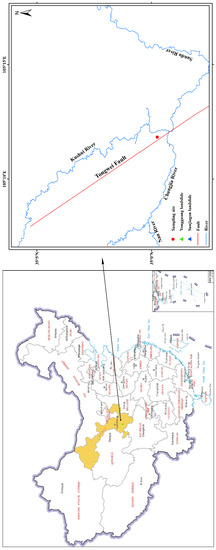
Figure 2.
Location of the sampling site.
The natural loess has a sub-stable structure with trellis pores, which are easy to damage under heavy rainfall, seismic action, and human activities such as agricultural irrigation and slope excavation [6,14,15], leading to serious geological hazards in the loess region. However, the co-seismic effect and post-seismic effect of strong earthquakes are one of the key causes of structural variations, as well as the geological hazards of the loess. After the earthquake, the damaged structure of the loess will be re-consolidated and become relatively stable [16]. Due to the structural changes caused by the destruction-consolidation process, the mechanical behaviors of reconsolidated loess aftershocks are significantly different from the behaviors of the original loess in the natural state. Therefore, the loess is loosened and cracked under seismic action, and the structural changes occur by the earthquake and post-earthquake reconsolidation [15,16,17]. It contributes to the development of geological hazards in the meizoseismal areas, underlying a huge hidden danger to engineering construction [18,19].
The relationship between the post-seismic effects of strong earthquakes and landslides has played an important role in earthquake-induced landslide hazards and prevention. Following the Sichuan M 8.0 earthquake that occurred in 2008, the behaviors of the mechanical property of rocks and soils after strong earthquakes and their effects on slope stability have received more extensive attention from scholars [20,21,22,23,24]. Due to the significant seismic sensitivity of loess, its sub-stable structure can be damaged under seismic action with lower intensity [1,25]. In addition, the damage characteristics of the soil are significantly contrasted when the seismic intensity is different, which mainly occurs in the deformation section of the ground caused by the rearrangement of the particles during an earthquake. Furthermore, in the case of reconsolidation under external forces and complex environmental conditions, the reconsolidation conditions also have an appreciable influence on the physical and mechanical qualities of the soil [17,26,27,28]. However, these studies mainly focus on the characteristics of static parameters and liquefaction of the post-seismic loess [17,26,27,28,29,30,31,32]. Considering the background of strong seismic activity in the loess distribution areas in China, studies on the kinetic behaviors of post-earthquake loess are both necessary and significant in analyzing the slope stability under earthquake effects.
The nonlinear dynamic parameters including the dynamic elastic (shear) modulus (Ed and Gd) and the damping ratio (D) are the key factors for analyzing the seismic hazard of the site, which is also an important parameter evaluation of dynamic stability of the slope. The recent studies on nonlinear dynamic properties of the loess mainly include the distribution characteristics and influencing factors of regional nonlinear dynamic properties [1,3,33,34,35,36,37,38,39]. However, the studies on nonlinear dynamic properties of reconsolidated loess are lacking. In this paper, the physical process of pre-shock and reconsolidation is simulated in the laboratory. The nonlinear dynamic behaviors of the loess under the effect of pre-shock and reconsolidation are drawn. The impact of the OCR on the dynamic parameters of the loess aftershock is analyzed. The results will greatly aid in interpretation of the post-seismic effects on loess and the stability of loess slopes.
2. Methodology
2.1. Test Materials
The loess for the laboratory experiments is taken from a loess slope in Lijiadian Town, Tongwei County. The sampling site is in the gully region in Central−South Gansu Province. It is also a concentrated distribution area of loess landslide in the affected areas of the Tianshui Earthquake with a magnitude of 8.0 in 1644, the Tongwei earthquake with a magnitude of 7.5 in 1718, and the Haiyuan earthquake with a magnitude of 8.5 in 1920 [1]. The sampling site is located on a platform of the slope, which is the trailing edge of an earthquake-induced landslide. Figure 2 shows the location of the sampling site. The Tongwei fault, which is not only a buried deep-rooted fault but also the seismogenic fault of the M 7.5 earthquake that occurred in 1718, is close to the sampling site [40,41].
An exploration well is first dug manually in a flat area on the platform during the process of sampling. Then, the undisturbed soil samples are manually cut with a small shovel and knife from the shaft wall in the exploration well at a depth of 5.0–5.2 m. The samples are carefully taken out of the exploratory well and then processed into cylindrical samples with a diameter of approximately 100 mm and height of 140 to 160 mm by manual cutting. To protect against moisture loss, the cylindrical samples are wrapped with plastic film and taped tightly. Finally, the samples are placed in a box in order, and soft material was placed between the samples to prevent breakage during transportation.
The undisturbed loess samples are processed with the cutting plate in the laboratory. The samples are carefully cut artificially until it being machined into a cylinder of 50 mm in diameter. Then, the cylindrical specimens are carefully removed and placed in a metal mold with a height of 100 mm, and the excess soil at the end is trimmed off. Note the specimens are weighed and measured for diameter and height until it is prepared for use. Figure 3 shows the collection and preparation process of the loess specimen.
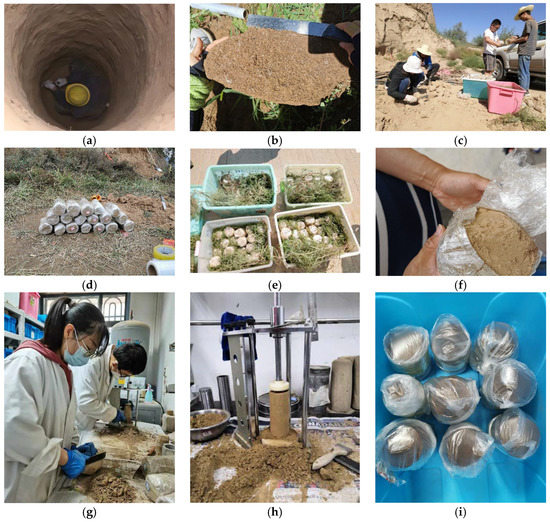
Figure 3.
Process of sample collection and specimen preparation: (a) sampling in the exploration well, (b) the clod sample, (c) cutting the samples in the field, (d) cylinder samples wrapped with plastic cling film and taped, (e) samples placed in boxes, (f) removed plastic film, (g) preparing process of the specimens, (h) cylinder specimen after cutting in radial, and (i) the specimens with plastic bags in a box.
The loose soil cut from the cutting plate was taken and a series of tests including particle fraction, specific gravity, water content, and liquid−plastic limit are conducted, respectively. The test methods followed the Chinese Code GB50123-2019, as well as the ASTM Code including ASTM D4318-05, ASTM D854-06, and ASTM D422-07 [42,43,44,45]. The results are represented in Figure 4 and Table 1. According to the Casagrande plasticity chart, the soil used in this study is CL.
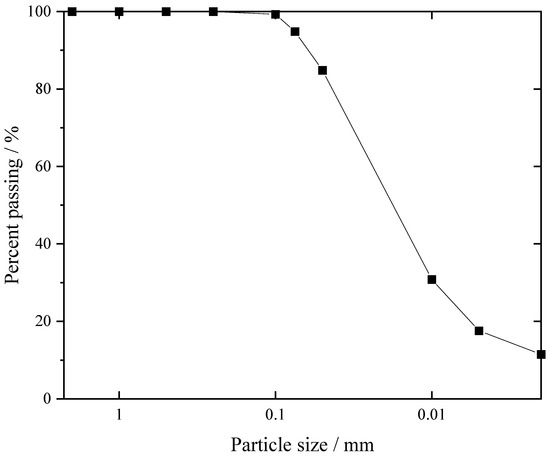
Figure 4.
Particle size distribution curve of the loess.

Table 1.
Physical properties of the tested loess.
2.2. Testing Instruments
The test instruments used in this study mainly include the WF-12440 hollow cylinder apparatus (WF-HCA, Figure 5a) and the scanning electron microscope typed KYKY-2800B (KYKY-SEM, Figure 5b).
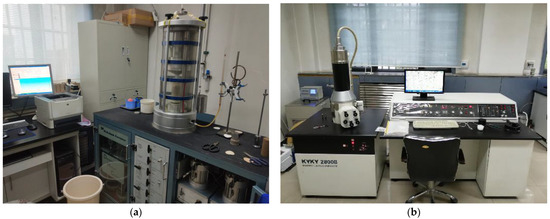
Figure 5.
Test instruments: (a) the WF-12440 dynamic triaxial torsional shear test system, and (b) the KYKY-2800B scanning electron microscope.
The WF-HCA was used to conduct pre-shock tests and dynamic triaxial tests. The instrument, manufactured by Wykeham Farrance Ltd. in the UK, uses an air-to-water converter to apply peripheral pressure and a pneumatic actuator to apply axial tensile and torsional forces, allowing for precise static and dynamic control to carry out vibration triaxial tests and cyclic torsional shear tests under complex conditions. The main modules of the equipment include a pressure chamber module, air–water conversion module, measurement module, control module, and data collection module. A 48-channel data acquisition instrument connected to a computer can realize the implementation of multi-channel data acquisition. The maximum longitudinal displacement is ±25 mm; the maximum longitudinal force is ±10 kN. The measurement limits of the pore water pressure and back pressure are both 1000 kPa. The sample platform is detachable, which can meet the requirements of the triaxial test of cylinder samples with different diameters. The measurement accuracy of the sensors is shown as follows: the force sensor is 0.1 N, the pressure (stress) sensor is 0.1 kPa, and the strain sensor is 0.001% [3,25,30].
The KYKY-SEM is used to determine the micrograph of the structure of the loess samples. The instrument is manufactured by KYKY Technology Co., Ltd., Beijing, China. The ion sputtering instrument accompanying the equipment can realize the gold plating treatment of the non-conductive sample surface. The main technical parameters of the equipment include: resolution of 4.5 nm, magnification between 5 and 250,000, acceleration voltage from 0.1 kV to 30 kV, and maximum specimen size of 60 mm in diameter. The sample stage of this instrument can realize displacement in three directions, the XZ plane deflection (T), and the XY plane rotation (R) where, the limit in the X direction, the Y direction, the Z direction, the deflection of T, and rotation in R are 50 mm, 50 mm, 25 mm, ±45°, and 360°, respectively [12,30].
2.3. Test Methods
The test methods of the dynamic triaxial tests (including pre-shock tests) follow the Chinese Code GB50123-2019 and the ASTM Code ASTM D3999-2003 [42,46]. The process of pre-shock is simulated using the WF-HCA. Firstly, latex film is wrapped around the sample with a film-bearing cylinder. Then, a permeable stone and a filter are put successively on the sample platform of the WF-HCA. The specimen coated with latex film is carefully placed on the filter paper, and another filter and permeable stone are put on top of the specimen. Make sure the second permeable stone just touches the top seat by adjusting the height of the sample platform. The two ends of the latex film are respectively set on the sample platform and the top seat and tied tightly with rubber rings to prevent water leakage. The chamber is filled with water and the surrounding pressure is simulated by the air–water conversion system. All sensors need to be zeroed out. Before pre-shock tests, the specimen should be pre-consolidated to simulate the original stress state. The axial pressure is determined based on the natural density and sampling depth of the samples. A noninotropic consolidation mode was adopted for the specimens, and the coefficient of cell pressure was 0.59 [1]. The standard for sample consolidation stability is determined when the axial strain within 1 h is no more than 0.01%. After the sample is stabilized, a sinusoidal load with a frequency of 1Hz is conducted on the sample in axial for cyclic shearing. The amplitude of the load is calculated based on Equations (1) and (2) [25,30,47] where σd is the dynamic stress; τd is the dynamic shear stress; amax/g is the seismic coefficient, indicating the ratio between the peak ground acceleration (PGA) and the gravitational acceleration. kd is the reduction coefficient of depth, which can be calculated according to Equation (3); γ is the unit weight of the soil; ds is the depth of the soil sample.
To make sure the damage of the pre-shock action on the soil was more obvious and to increase the comparability of the test results, the seismic coefficient amax/g = 0.4 was taken in this study by considering the historical strong earthquakes and the seismic ground motion parameter zonation results in the study area [48,49]; it is indicated that there exists strong earthquake action with a simulated earthquake intensity of IX degree. Therefore, the maximum cyclic number for the pre-shock test is 30 [50].
The pre-shock specimens are removed from the platform carefully. Plastic bags are placed on the specimens with the wrapped latex film, and then the bags are tied tightly and placed in a dry dish for 24 h before the dynamic triaxial tests. After that, the specimens are placed again in the chamber of the WF-HCA in the same way as the pre-shock tests. Then, the specimens are saturated on the WF-HCA using a backpressure saturation method. A small cell pressure (approximately 20 kPa) is loaded on the specimen, and then the degassed water is drained into the specimen from bottom to top to fully discharge the air inside it. After the air in the specimen is fully discharged, a series of confining pressure and back pressure is alternately uploaded to the specimen step by step, and the degassed water is drained after each level of the back pressure. Furthermore, the B value is measured after the next cell pressure upload to determine the saturation degree of the specimens. The specimens are determined to have fully saturated when the B value reaches 0.95. An isotropic consolidation method is used to consolidate the specimens, and the axial pressure is calculated based on the saturation density and sampling depth of the specimens [3]. The cell pressure coefficient is 1. For the purpose of studying the impact of OCR on the nonlinear dynamic parameters of the post-seismic saturated loess, the OCR is set as 1, 2, 3, and 4. Note that the consolidation conditions of specimens with each OCR are simulated based on the determined axial pressure. The criteria for consolidation stability of the specimens are the same as those for the pre-shock tests. Considering the non-uniformity of the original loess specimens, and to ensure the data do not have the problem of comparability, multiple continuous sinusoidal loads with more than 10 different amplitudes and a frequency of 1 Hz are exerted on the same specimen. In addition, the number of vibrations under each level of loading was 10 to guarantee the stability of the cyclic load. Moreover, the variation of the σd and the dynamic strain, εd, are collected in real-time. A schematic diagram of the load path of the pre-shock reconsolidation cyclic shear process is shown in Figure 6.
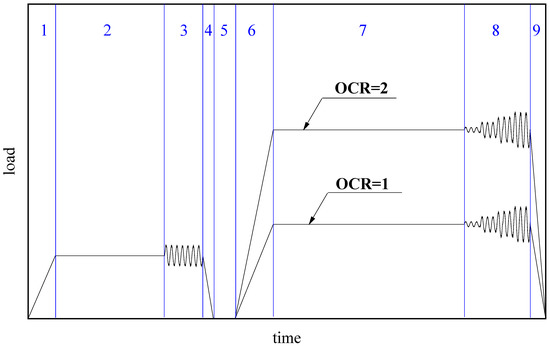
Figure 6.
Schematic diagram of the load path of the pre-shock reconsolidation cyclic shear process: stage 1: load for pre-shock, stage 2: consolidation for pre-shock, stage 3: pre-shock, stage 4: unload after pre-shock, stage 5: stabilization and saturation of the specimens, stage 6: load for cyclic shear, stage 7: consolidation for cyclic shear, stage 8: cyclic shear, and stage 9: unload after cyclic shear.
The micro-structure photos of loess before and after pre-shock and reconsolidation are obtained using the KYKY-SEM. Before the test, the loess specimens are dried naturally. Small pieces of soil samples are taken manually. Sandpaper is used to polish the samples into thin sheets of approximately 1mm thickness. A knife is used to carefully trim the sheet into a circular shape with a diameter of 10mm. The floating soil on the surface of the specimens is blown away using an aurilave, and the specimens are bonded onto the sample holder using conductive tape. Then, the surface of the specimens is coated with gold using the ion sputtering instrument. To ensure the gold is uniformly sprayed on the surface, the duration time is no less than 90 s. Finally, the specimen is taken out with the sample holder and placed in the specimen table of the KYKY-SEM. During the tests, the acceleration voltage is 21 kV and the magnification is 500X.
3. Results
3.1. Dynamic Elastic and Shear Modulus Characteristics of the Saturated Loess before and after Pre-Seismic Reconsolidation (PSR)
Based on the dynamic triaxial tests, the σd − εd curves of the saturated loess before and after the PSR process are drawn in Figure 7. As shown in Figure 7, the εd of the saturated loess before and after the PSR process shows a nonlinear growth with the increase in σd. The pre-shock action has a significant effect on the σd − εd curves of saturated loess. Compared with the saturated loess without pre-shock, the σd of the saturated loess grows slowly with the increase in εd after pre-shock, indicating that the pre-shock caused a nonlinear enhancement of the loess. Furthermore, the σd − εd curves after pre-shock are significantly influenced by the effect of reconsolidation. The σd at the same level of εd grows monotonically with the increase in the OCR, indicating that the increase in the OCR attenuates the kinetic nonlinearity of the loess. When the OCR reaches three, the kinetic nonlinearity of the pre-shock saturated loess is weakened compared with that of the original loess before the pre-shock.
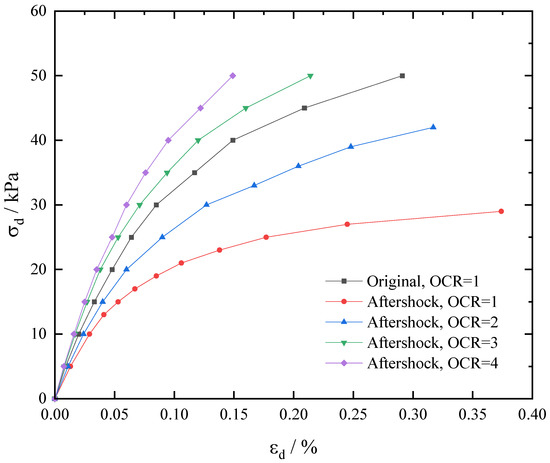
Figure 7.
Dynamic stress: dynamic strain curves of the saturated loess before and after pre-shock and reconsolidation.
The Ed is defined as the ratio of σd and εd:
Figure 8 shows the Ed versus εd of the saturated loess under different PSR processes. The Ed of the saturated loess under different conditions reduces with an increase in the εd, nonlinearly. After pre-shock, the Ed of the saturated loess decreases significantly at the same level as the εd. However, with an increase in the OCR, the Ed of the saturated loess increases at the same level as the εd in an upward trend. When the OCR reaches three, the Ed of the loess after the PSR process is larger.
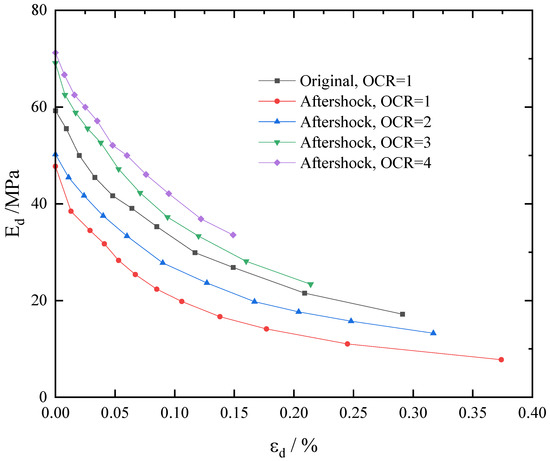
Figure 8.
Dynamic elastic modulus: dynamic strain curves of the saturated loess under different reconsolidation conditions.
The relationship between Ed and εd of the loess in different moisture contents are consistent with the Hardin–Drnevich (HD) model [1,3,35,51]. The test results in Figure 7 are normalized and fitted nonlinearly using the HD model in the dynamic shear strain (γd) range of 10−6 to 10−2. The Gd and the γd are obtained using Equation (5) and Equation (6), respectively.
where μ is the Poisson’s ratio of the loess. On the basis of Figure 7, the Gd, γd, and the inverse of the Gd (1/Gd) are calculated. Note that the relationship between the 1/Gd and the γd could be gained based on the test results, as follows in Equation (7), which is used to obtain the Hardin–Drnevich model parameters a and b for the saturated loess under different test conditions.
In accordance with the Equation (7), the reference shear strain γdr = a/b, so the dynamic shear modulus ratio Gd/Gdmax follows as [3,52]:
The normalized curves of the Gd/Gdmax versus the γd of the saturated loess before and after the PSR process are calculated using Equation (8) and shown in Figure 9. According to Figure 9, the Gd/Gdmax of the saturated loess reduces nonlinearly with the growth of γd. Under the same consolidation conditions, the Gd/Gdmax − γd curves of the saturated loess before and after pre-shock show obvious differences. Before the pre-shock, the Gd/Gdmax of the saturated loess decreased from 1 to 0.94 in the small shear strain stage (10−6 < γd < 10−4). However, in the large shear strain stage (10−4 < γd < 10−2), the Gd/Gdmax are 0.76, 0.61, 0.24, and 0.13 at the characteristic shear strains of 0.0005, 0.001, 0.005, and 0.01, respectively. After the pre-shock, the Gd/Gdmax of the saturated loess reduced to 0.9 with increasing the γd in the small shear strain stage. With the large shear strain stage, the Gd/Gdmax are 0.76, 0.61, 0.24, and 0.13 at the characteristic shear strains of 0.0005, 0.001, 0.005, and 0.01, respectively. The Gd/Gdmax of the saturated loess decays to 0.90 at the small shear strain stage and changes to 0.66, 0.49, 0.14, and 0.09 at the large shear strain stage with characteristic strains of 0.0005, 0.001, 0.005 and 0.01, respectively. The Gd/Gdmax of the saturated loess decreased obviously with the increase in the γd after the pre-seismic action, indicating that the impact of pre-shock on the kinetic stiffness of the saturated loess is more significant. Note that the difference between the Gd/Gdmax of the saturated loess before and after pre-seismic action is more obvious when the γd range is 0.0001–0.005; however, the difference presents a decreasing tendency when the γd range is 0.005–0.01.
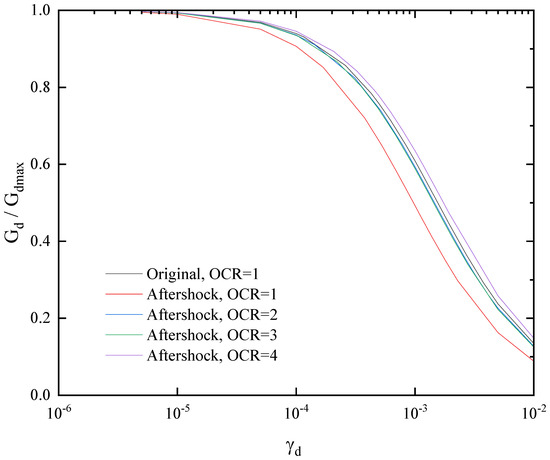
Figure 9.
Curves of the dynamic shear modulus ratio versus dynamic shear strain of the saturated loess under different test conditions.
The relationship of the Gd/Gdmax versus the γd of the after or pre-shock saturated loess under different reconsolidation conditions is shown in Figure 9. As seen in Figure 9, after the OCR reaches two, the Gd/Gdmax of the saturated loess reduces to 0.94 at the small shear strain stage, and the Gd/Gdmax is 0.74, 0.59, 0.23, and 0.13 at the large shear strain stage with the characteristic strains of 0.0005, 0.001, 0.005, and 0.01, respectively. This result is similar to the Gd/Gdmax of the original saturated loess at the same γd. Furthermore, the decay of the Gd/Gdmax is obviously slower than that of the saturated loess with an OCR of one. When the OCR is three or four, the decay trend of Gd/Gdmax of the saturated loess is the same as that of the OCR of two. When the OCR is four, the decay trend of the curves in the small-strain stage is similar to that of the original saturated loess. However, in the large shear strain stage, the Gd/Gdmax corresponds to the four characteristic shear strains of 0.78, 0.64, 0.26, and 0.15, respectively, which are slightly stiffer than other groups.
3.2. Damping Ratio of Saturated Loess before and after the PSR Process
The D of the soil is reflected as the hysteresis of the σd − εd or τd − γd relationship hysteresis circle performance under the periodic dynamic load. It is caused by the energy consumed by frictional action during soil deformation, reflecting the energy loss resulting in the inner resistance of the soil under cyclic load. Thus, the D is one of the essential dynamic properties of soil and an essential parameter for the analysis of ground motion. The D can be obtained by the σd − εd or τd − γd hysteresis curve method, as seen in Figure 10. The D of soil is obtained by calculating the area ΔW and area W of ΔAOB of the area enclosed by the hysteresis curve, and then calculated in accordance with the Equation (9).
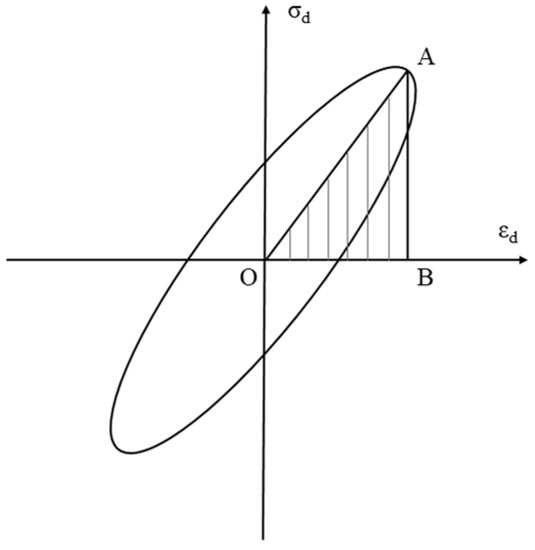
Figure 10.
Calculation method of the damping ratio.
Based on Figure 10 and Equation (9), the D of the saturated loess is determined. The curves of the D versus the dynamic strain are drawn, as shown in Figure 11. According to the figure, the D of the saturated loess under different test conditions has a tendency to grow with an increase in the εd, and the D − εd curve is steep when the εd is small; the curves gradually tend to flatten after a certain dynamic strain. The D of the saturated loess after pre-shock tends to increase more obviously with an increase in the εd. The inflection point of the curve corresponds to a larger dynamic strain. Combined with the definition of the D, the energy loss caused by frictional action during the soil deformation after the pre-shock is enhanced. The deformation hysteresis effect is more obvious, and its deformation stability tends to be weakened under the dynamic load. In addition, Figure 11 also shows the D − εd curves of the post-seismic saturated loess with a different OCR. The impact of the OCR on the trend of the D − εd curves is more obvious. The εd corresponding to the inflection point of the D − εd curves decreases continuously with an increase in the OCR. When the OCR reaches two, the D of the post-seismic saturated loess at the same level of εd is lower than that of the original saturated loess, indicating that the deformation capability of the loess under cyclic load tends to be weakened after the over-consolidation effect.
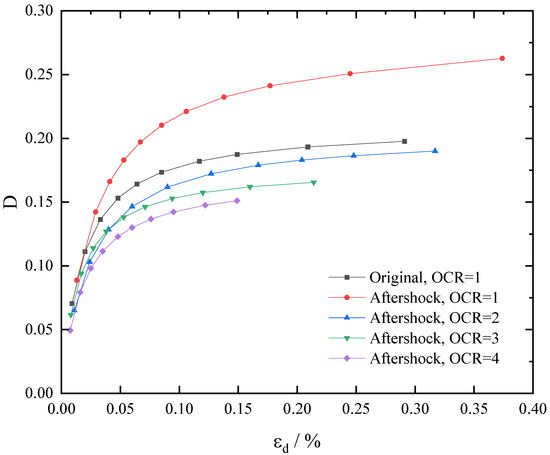
Figure 11.
Curves of the damping ratio versus the dynamic strain of the saturated loess under different test conditions.
The ratio of the D to the γd, γd/D, and the γd, has a linear relationship as shown in Equation (10):
where A and B are the fitting parameters. Equation (9) could be adapted as:
Based on Figure 11, the normalized curves of the D versus the γd of the saturated loess before and after the PSR process are calculated, as shown in Figure 12. According to Figure 12, the D − γd curves of the saturated loess under different test conditions show a characteristic of moderate growth—sharp growth—moderate growth: the shape of the curve is like a capital “S”. Under the same consolidation conditions, the growth trends of the D − γd curves before and after pre-shock are different. However, the difference is mainly manifested in the large shear strain stage (γd > 2 × 10⁻⁴). When the γd is 0.0005, 0.001, 0.005, and 0.01, the D of the pre-seismic saturated loess increases by 15.76%, 20.24%, 29.89%, and 31.48%, respectively, compared with that of the original saturated loess. This indicates that the pre-seismic action has a more obvious influence on the D as the γd continues to increase in the large shear strain stage. According to Figure 12, there is some influence of the over-consolidation effect on the various characteristics of the D − γd curves of the saturated loess after pre-shock. In general, with an increase in the OCR, the growth tendency of the curve flattens out. However, the effect of reconsolidation is manifested throughout the shear strain range, and this effect tends to increase in the large shear strain stage compared to the small shear strain stage. When the γd < 5 × 10⁻⁴, the D of the post-seismic saturated loess with an OCR of three is larger than that of the post-earthquake saturated loess with an OCR of two in the same level of the γd. When the characteristic γd is at 0.0005, 0.0001, 0.0005, 0.001, 0.005, and 0.01, the D of the saturated loess with an OCR of four is reduced by 14.58%, 19.98%, 40.67%, 49.45%, 60.76%, and 62.62%, respectively, compared with that of post-seismic saturated loess with an OCR of one, which is 26.62% less than that of the saturated loess before the PSR process. The D decreased by 26.62%, 26.16%, 24.76%, 24.29%, 23.77%, and 23.69% than those of the original saturated loess, indicating that the D of the saturated loess decreased significantly and the deformation stability increased obviously after the OCR reached to four.
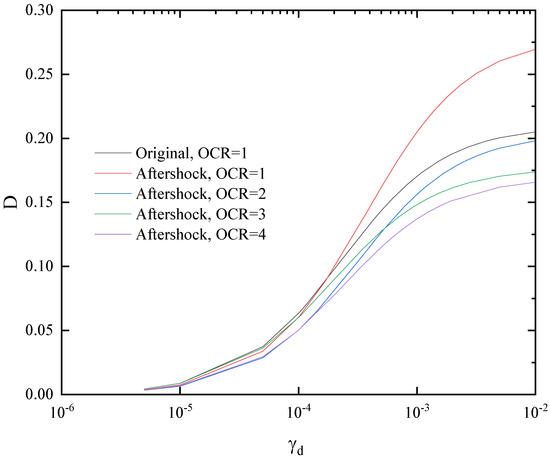
Figure 12.
Normalized curves of the damping ratio versus the dynamic shear strain of the saturated loess under different test conditions.
4. Discussion
The experimental results of dynamic characteristics of post-earthquake saturated loess under different reconsolidation conditions show that the pre-seismic action will lead to the kinetic stiffness of the saturated loess having an obvious attenuation and the D of the loess increasing significantly. The dynamic stiffness of the saturated loess after the PSR process increases and the D decreases with an increase in over-consolidation ratio, and there is a nonlinear relationship between Gd/Gdmax, D, and the OCR. Considering the demand for parameter selection in dynamic response analysis of slope sites, there is a tremendous need to study the effect of pre-seismic and reconsolidation on nonlinear kinetic characteristic parameters of saturated loess. Furthermore, the structural change of soil is the essential reason for the difference in soil mechanics. The layout of soil particles and the content and distribution of pores in soil have a decisive effect on the mechanical behaviors of soil. Therefore, it is helpful to understand the influence mechanism of strong earthquakes and post-earthquake reconsolidation on the nonlinear dynamic characteristics of saturated loess by analyzing the microstructure characteristics of saturated loess under different PSR conditions.
4.1. Influence Law of Strong Earthquake and Post-Earthquake Reconsolidation on Nonlinear Dynamic Characteristics of the Saturated Loess
According to Figure 9 and Figure 12, the relationships of Gd/Gdmax versus OCR and D versus OCR of the saturated loess at different levels of γd are drawn, respectively. To accurately describe the variation laws of nonlinear kinetic characteristic parameters with OCR at different levels of the γd, the ratio of Gd/Gdmax of saturated loess after pre-seismic to that of the original saturated loess at the same level of the γd is defined as Gu, and the ratio of D of saturated loess after pre-seismic to that of the original saturated loess at the same level of the γd is defined as Du. Figure 13a shows the relationship between Gu versus OCR, and Figure 13b shows the relationship between Du versus OCR. According to Figure 13a, with the increase in the OCR, Gu shows an increasing trend generally. In the small shear strain stage, with the increase in the OCR, the variation of Gu is not immediately apparent. In the large shear strain stage, when the OCR increases from one to two, Gu increases sharply; when it is between two and three, the change rate of Gu is small; when it increases from three to four, the growth trend of Gu tends to be obvious, but the growth rate is slower than that of it at one to two. According to Figure 13b, there are significant differences in the changes of Du−OCR curves at different strain stages. In the small shear strain stage, Du shows a decreasing–increasing–increasing tendency with the increase in OCR; however, the change in degree is small in general. The influence of the PSR on D is insignificant at this stage. At the large shear strain stage, Du decreases monotonously with an increase in the OCR, and its decrease in degrees gradually slows down, indicating that the PSR process has a significant effect on D. When the OCR reaches two, the Du of saturated loess after pre-seismic is close to one, which shows its D reaches the level before pre-seismic.
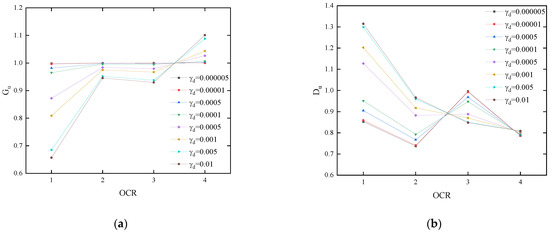
Figure 13.
Influence of the OCR on the dynamic shear modulus ratio and damping ratio: (a) the relationship between Gu and OCR and (b) the relationship between Du and OCR.
To further illustrate the influence of the PSR process on the nonlinear kinetic properties of the saturated loess, the variation laws of the maximum dynamic shear modulus Gdmax, the maximum dynamic shear stress amplitude τdult and the maximum damping ratio Dmax with pre-seismic and reconsolidation ratio is analyzed. According to Equation (7), the Gdmax is as follows:
Based on the definition of Gd, there are:
According to Equations (7) and (13), there are:
According to Equation (10):
When γd→∞,
The Gdmax, τdult, and Dmax are calculated according to Equation (12), Equation (14), and Equation (16), respectively, and their relationship curves with the OCR were drawn, as shown in Figure 14. In Figure 14, the changes of Gdmax, τdult, and Dmax before and after pre-seismic are given when OCR = 1. After pre-seismic, Gdmax decreases significantly and Dmax increases significantly, which is consistent with the results in Figure 8 and Figure 11. Furthermore, τdult decreases significantly after pre-seismic, and it is only half of that before pre-seismic. Considering that τdult represents the possible extreme value of dynamic shear stress in the τd − γd curve, it can reflect the dynamic strength of the soil. Therefore, the pre-seismic effect also leads to a significant attenuation of the strength of saturated loess, which is the same as those studies on the seismic subsidence of unsaturated loess in the literature [35].
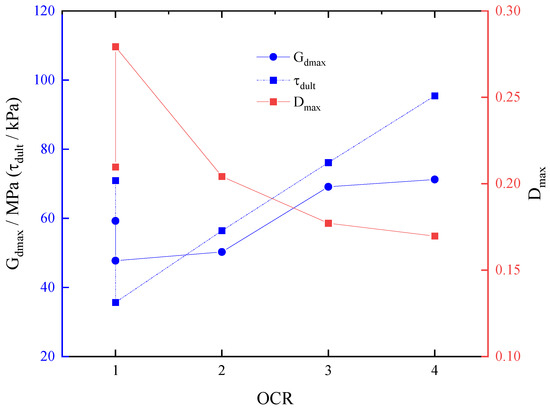
Figure 14.
Influence of OCR on Gdmax, τdult, and Dmax.
Figure 14 also shows the effect of reconsolidation on Gdmax, τdult, and Dmax of post-earthquake saturated loess. From the graph, it can be seen that Gdmax has a trend of moderate growth–sharp growth–moderate growth with an increase in the OCR; when 2 ≤ OCR ≤ 3, the growth is faster. In addition, there is a positive linear correlation between τdult and OCR. Dmax decreases nonlinearly and its increasing trend decreases with an increase in the OCR. Combined with Figure 13a, it should be noted that the Gdmax increases rapidly at 2 ≤ OCR ≤ 3, while Gu hardly increases at this stage, and even decreases slightly at the large shear strain stage. Considering the definition of Gd/Gdmax, the variation tendency of Gu is mainly affected by the rapid growth of Gdmax. In other words, when 2 ≤ OCR ≤ 3, reconsolidation still has a significant influence on the dynamic stiffness of saturated loess after an earthquake.
4.2. Influence Mechanism of Strong Earthquake and Post-Earthquake Reconsolidation on Nonlinear Dynamic Characteristics of Saturated Loess
The variation of microstructure of soil under different conditions is the fundamental cause of the change in its mechanical behaviors [6,18,53]. To illustrate the influencing mechanism of a strong earthquake and post-earthquake reconsolidation on the nonlinear kinetic characteristics of saturated loess, the microstructure photos of each group of samples before cyclic shear were obtained based on the SEM test, as shown in Figure 15. Among them, Figure 15a shows the original saturated loess under the OCR of 1, Figure 15b shows the aftershock loess with OCR = 1, Figure 15c shows the aftershock loess with OCR = 2, Figure 15d shows the aftershock loess with OCR = 3, and Figure 15e shows the aftershock loess with OCR = 4. As seen in Figure 15a, before pre-seismic, the boundaries of particles are clear and the particles are arranged in a mosaic, whereas the contact among grains is surface contact. There are many more trellis pores, a relatively uniform distribution, and an obvious overhead pore structure. However, the structure of the soil changed significantly after pre-seismic and over-consolidation. According to Figure 15b, when the soil is normally consolidated after the pre-seismic, the particle boundary is still obvious; however, the contact among grains occurs more as point contact and boundary contact. The connection between the particles is not as tight as before. There are still plenty of pores; however, the trellis pore is no longer obvious due to the deformation of pre-shock. Furthermore, the uniformity of the pore distribution becomes better. Note that the most conspicuous change between Figure 15a,b is a large number of pores connected in tiny cracks in Figure 15b, resulting from the loosening and rearrangement of the gains during vibration. According to Figure 15c,d, after OCR reached two, the particle boundary became blurred, resulting in the consolidation and compaction of soil, and the number of medium and large pores reduced significantly. Moreover, the small gaps formed by pore connection after the cyclic shear were also healed locally under the action of over-consolidated pressure. After the OCR reaches three, only a small number of medium and large pores is distributed in the loess. The compaction effect of soil particles is more obvious. According to Figure 15e, when the OCR reaches four, the boundary of soil particles is blurred and the particles of different sizes are gathered together. The particles are not easy to distinguish and the porosity content is significantly reduced.
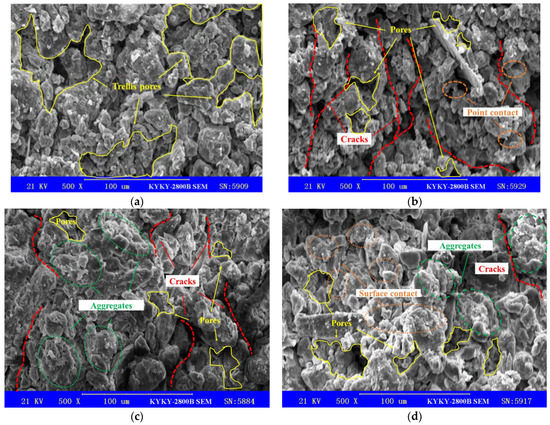

Figure 15.
Microstructure characteristics of the saturated loess under different test conditions: (a) the original saturated loess with OCR = 1, (b) the aftershock loess with OCR = 1, (c) the aftershock loess with OCR = 2, (d) the aftershock loess with OCR = 3, and (e) the aftershock loess with OCR = 4.
Based on the analysis and discussion shown above, combined with the results shown in Figure 8, Figure 9, Figure 11, Figure 12, Figure 13 and Figure 14, it is illustrated that the stiffness of the loess has an obvious loss, resulting in the changes of particle arrangement and the loosening of connection among particles after pre-seismic load. Meanwhile, the penetration of medium and large pores caused by cyclic load makes the accumulation and transmission of pore water pressure much easier, which can lead to an obvious reduction in the effective stress as well as a significant enhancement of the viscosity of the soil. The reconsolidation effect on the soil after pre-seismic makes the loose soil gradually compact. With an increase in the OCR, the consolidation pressure continues to increase, and the compaction effect on the loess is gradually increased. Since the pores of the soil are obviously reduced and the connected pores result in pre-shock being gradually blocked under the compaction effect, the factual contacting area between the particles increases and the connection becomes much closer. Thus, the stiffness of the loess is significantly increased, the viscosity tends to decrease, and the deformation potential of the loess gradually tends to decrease [54].
This study investigates the characteristics of nonlinear dynamic properties of the post-cyclic saturated loess and analyzes the influence of pre-shock and reconsolidation on the dynamic properties of the saturated loess. Based on the test results and analysis, suggestions to aid subsequent research are as follows: (1) Seismic liquefaction is not only a kind of seismic geological hazard in the loess region but also a significant trigger.
For loess landslide and mudflow. Thus, studies on liquefaction behaviors of the post-cyclic saturated loess will be helpful in understanding post-earthquake landslides. (2) In recent years, geological hazards, including landslides and debris, flow frequently occur in strong earthquake-affected areas in the Loess Plateau. The variation of the moisture of the loess resulting from heavy rainfall and irrigation, and its coupling effect with strong earthquakes is the main cause of the disasters. Hence, the dynamic properties of the post-cyclic saturated loess under the coupling effect of aftershock and rainfall also deserve our consideration. (3) Based on the mercury injection experiment, CT scanning, and 3D modeling technology, a 3D model of the structural characteristics of the post-cyclic saturated loess may help us discover new findings and develop a better understanding of the mechanisms of variation of dynamic properties under strong earthquakes.
5. Conclusions
This study proposes the effect of pre-cyclic and reconsolidation on the nonlinear dynamic characteristics of the saturated loess and illustrates the possible mechanism for the variation of the nonlinear dynamic characteristics during the strong earthquake and post-earthquake reconsolidation via microstructure analysis of the loess in different scenarios. Through simulating the physical processes of saturated loess under the strong earthquake and reconsolidation in the laboratory and conducting a series of dynamic triaxial tests, the impaction of pre-shock and reconsolidation action on the nonlinear dynamic parameters of the saturated loess was investigated. The following conclusions are drawn:
- (1)
- Strong earthquakes may lead to a significant attenuation of the kinetic stiffness of the saturated loess. The variation of the Gd/Gdmax − γd curves before and after pre-seismic is more obvious in the large shear strain stage. With an increase in the OCR, the Ed of the saturated loess after pre-shock increased continuously. When the OCR reached two, the trend of Gd/Gdmax − γd curves of the pre-shock saturated loess was similar to that of the original saturated loess.
- (2)
- The D of the saturated loess tended to grow more obviously with the increase in εd after the action of a strong earthquake. The stability under the dynamic load tended to weaken. The influence of pre-shock on the D − γd curves was mainly manifested in the large shear strain stage. The action of reconsolidation can lead to a significant decrease of D at the same strain level, and the growth of the curve tends to flatten with an increase in the OCR. This effect is expressed in the whole shear strain range.
- (3)
- Compared with the original saturated loess, the Gd of the post-earthquake loess was significantly reduced and the D was obviously increased. The loess was more likely to be damaged when strong aftershocks occurred. Furthermore, the impaction of the reconsolidation on the nonlinear dynamic parameters of the post-earthquake loess is remarkable. The kinetic stiffness of the saturated loess is significantly enhanced after experiencing the over-consolidation, and its damage will be obviously weakened under strong aftershocks.
- (4)
- Strong earthquake caused the weakening of the connection between particles of the soil. In addition, the trellis pores were consecutive and the structure was rearranged. The changes in structure led to the enhancement of dynamic nonlinear of the saturated loess. However, the compaction effect of reconsolidation increased the interparticle friction and healed some microfractures, which led to the increased stiffness of the saturated loess.
Author Contributions
Conceptualization, Q.W. and W.M.; methodology, Q.W.; tests, Y.W. and W.M.; analysis, Q.W. and D.T.; investigation, Q.W. and D.T.; data processing, Q.W. and Y.W.; writing—original draft preparation, Q.W.; writing—revised draft preparation, Q.W. and W.M.; project administration, Q.W.; funding acquisition, Q.W. All authors have read and agreed to the published version of the manuscript.
Funding
This research was conducted with the support of the Scientific Research Fund of Institute of Engineering Mechanics, China Earthquake Administration (Grant Nos. 2020D17, 2020EEEVL0409), the Open Fund of State Key Laboratory of Frozen Soil Engineering (Grant No. SKLFSE202005), the National Natural Science Foundation of China (Grant No. 51778590), and the Fund of Creative and Innovative Talents of Gansu Province (Grant No. 2022LQGR46).
Institutional Review Board Statement
Not applicable.
Informed Consent Statement
Not applicable.
Data Availability Statement
Not applicable.
Acknowledgments
The authors appreciate the support of the Gansu Earthquake Agency, and acknowledge Xiumei Zhong, Zhongnan Gao, Jun Wang, Jiemin Wang, Jinlian Ma, Master student Yi Wang, Xiaowei Xu, Qinyao Sun, and Yuxin Liang for help in field investigation, sampling, tests, and preparation of the revised manuscript, as well as to Mohamed Elmujtaba for his helpful comments in language editing during the revision process of this work. The authors also appreciate the editors and reviewers for their detailed and valuable comments and suggestions.
Conflicts of Interest
The authors declare no conflict of interest.
References
- Wang, L.M. Loess Dynamics; Seismological Press: Beijing, China, 2003. (In Chinese) [Google Scholar]
- Derbyshire, E.; Meng, X.M.; Dijkstra, T.A. Landslides in the Thick Loess Terrain of North–West China; Wiley: London, UK, 2000. [Google Scholar]
- Wang, Q.; Ma, J.L.; Ma, H.P.; Wang, J.; Wang, L.M.; Gao, Z.N. Dynamic shear modulus and damping ratio of saturated loess. Chin. J. Rock Mech. Eng. 2019, 38, 1919–1927. (In Chinese) [Google Scholar] [CrossRef]
- Jeferson, I.F.; Evstatiev, D.; Karastanev, D.; Mavlyanova, N.G.; Smalley, I.J. Engineering geology of loess and loess−like deposits: A commentary on the Russian literature. Eng. Geol. 2003, 68, 333–351. [Google Scholar] [CrossRef]
- Salih, N.; Préat, A.; Gerdes, A.; Konhauser, K.; Proust, J.-N. Tracking the Origin and Evolution of Diagenetic Fluids of Upper Jurassic Carbonate Rocks in the Zagros Thrust Fold Belt, NE-Iraq. Water 2021, 13, 3284. [Google Scholar] [CrossRef]
- Gao, G.R. Loess microstructure classifcation and loess collapsible. Sci. China 1980, 12, 203–204. [Google Scholar]
- Ma, F.; Yang, J.; Bai, X. Water sensitivity and microstructure of compacted loess. Transp. Geotech. 2017, 11, 41–56. [Google Scholar] [CrossRef]
- Feng, J.G.; Zhang, H.; Yang, P. Analysis on b−value Abnormality of the Minxian−Zhangxian, Gansu M MS 6.6 Earthquake. Earthq. Res. China 2016, 30, 186–192. [Google Scholar]
- Ma, H.P.; Zhang, H.; Li, M.J.; Wu, S.Y.; Wang, P.T.; Wang, Q.; Zhao, J. Characteristics of the present crustal deformation in Tibetan Plateau and its relationship with strong earthquakes. Open Geosci. 2022; In press. [Google Scholar] [CrossRef]
- Zhang, D.X.; Wang, G.H. Study of the 1920 Haiyuan Earthquake−Induced Landslides in Loess (China). Eng. Geol. 2007, 94, 76–88. [Google Scholar] [CrossRef]
- Wang, G.H.; Zhang, D.X.; Furuya, G.; Yang, J. Pore−pressure generation and fuidization in a loess landslide triggered by the 1920 Haiyuan earthquake, China: A case study. Eng. Geol. 2014, 174, 36–45. [Google Scholar] [CrossRef]
- Zhong, X.; Xu, X.; Chen, W.; Liang, Y.; Sun, Q. Characteristics of loess landslides triggered by the 1927 Mw8.0 earthquake that occurred in Gulang County, Gansu Province, China. Front. Environ. Sci. 2022, 10, 973262. Available online: https://www.frontiersin.org/articles/10.3389/fenvs.2022.973262 (accessed on 9 September 2022). [CrossRef]
- Tang, R.; Wu, J.; Ye, M.; Liu, W. Impact of Economic Development Levels and Disaster Types on the Short-Term Macroeconomic Consequences of Natural Hazard-Induced Disasters in China. Int. J. Disaster Risk Sci. 2019, 10, 371–385. [Google Scholar] [CrossRef]
- Wei, Y.-N.; Fan, W.; Yu, B.; Deng, L.-S.; Wei, T. Characterization and evolution of three-dimensional microstructure of Malan loess. Catena 2020, 192, 104585. [Google Scholar] [CrossRef]
- Wang, G.; Wei, J. Microstructure evolution of granular soils in cyclic mobility and post−liquefaction process. Granul. Matter 2016, 18, 51–64. [Google Scholar] [CrossRef]
- Wang, J.D.; Li, P.; Ma, Y.; Vanapalli, S.K. Evolution of pore−size distribution of intact loess and remolded loess due to consolidation. J. Soils Sediments 2019, 19, 1226–1238. [Google Scholar] [CrossRef]
- Wang, S.Y.; Luna, R.; Onyejekwe, S. Effect of initial consolidation condition on post−liquefaction undrained monotonic shear behavior of Mississippi river valley silt. J. Geotech. Geoenviron. Eng. 2016, 142, 04015075. [Google Scholar] [CrossRef]
- Wen, B.-P.; Yan, Y.-J. Influence of structure on shear characteristics of the unsaturated loess in Lanzhou, China. Eng. Geol. 2014, 168, 46–58. [Google Scholar] [CrossRef]
- Ma, J.L.; Zhong, X.M.; Wang, Q. Experimental Study on Shear Characteristics of Compacted Loess based on Micro−structure. J. Disaster Prev. Mitig. Eng. 2021, 41, 350–356. (In Chinese) [Google Scholar] [CrossRef]
- Peng, J.; Wang, S.; Wang, Q.; Zhuang, J.; Huang, W.; Zhu, X.; Leng, Y.; Ma, P. Distribution and genetic types of loess landslides in China. J. Asian Earth Sci. 2018, 170, 329–350. [Google Scholar] [CrossRef]
- Zhang, M.S.; Liu, J. Controlling factors of loess landslides in western China. Environ. Earth Sci. 2009, 59, 1671–1680. [Google Scholar] [CrossRef]
- Pei, X.; Zhang, X.; Guo, B.; Wang, G.; Zhang, F. Experimental case study of seismically induced loess liquefaction and landslide. Eng. Geol. 2017, 223, 23–30. [Google Scholar] [CrossRef]
- Xu, L.; Coop, M.R.; Zhang, M.; Wang, G. The mechanics of a saturated silty loess and implications for landslides. Eng. Geol. 2018, 236, 29–42. [Google Scholar] [CrossRef]
- Rasouli, H.; Fatahi, B.; Nimbalkar, S. Re−liquefaction resistance of lightly cemented sands. Can. Geotech. J. 2021, 59, 2085–2101. [Google Scholar] [CrossRef]
- Liu, W.; Wang, Q.; Lin, G.; Chen, W. Effect of pre-dynamic loading on dynamic liquefaction of undisturbed loess. Bull. Earthq. Eng. 2020, 18, 5779–5806. [Google Scholar] [CrossRef]
- Wang, S.; Luna, R.; Onyejekwe, S. Postliquefaction behavior of low-plasticity silt at various degrees of reconsolidation. Soil Dyn. Earthq. Eng. 2015, 75, 259–264. [Google Scholar] [CrossRef]
- Wang, S.; Luna, R.; Zhao, H. Cyclic and post-cyclic shear behavior of low-plasticity silt with varying clay content. Soil Dyn. Earthq. Eng. 2015, 75, 112–120. [Google Scholar] [CrossRef]
- Wang, S.Y.; Luna, R. Compressibility characteristics of low−plasticity silt before and after liquefaction. J. Mater. Civ. Eng. 2014, 26, 040140141−1−6. [Google Scholar] [CrossRef]
- Karakan, E.; Tanrinian, N.; Sezer, A. Cyclic undrained behavior and post liquefaction settlement of a nonplastic silt. Soil Dyn. Earthq. Eng. 2019, 120, 214–227. [Google Scholar] [CrossRef]
- Liu, W.; Chen, W.; Wang, Q.; Wang, J.; Lin, G. Effect of pre-dynamic loading on static liquefaction of undisturbed loess. Soil Dyn. Earthq. Eng. 2019, 130, 105915. [Google Scholar] [CrossRef]
- Ishihara, K.; Harada, K.; Lee, W.; Chan, C.; Safiullah, A. Post-liquefaction settlement analyses based on the volume change characteristics of undisturbed and reconstituted samples. Soils Found. 2016, 56, 533–546. [Google Scholar] [CrossRef]
- Lade, P.; Yamamuro, J. Effects of nonplastic fines on static liquefaction of sands. Canadian Geotech. J. 1997, 34, 918–928. [Google Scholar] [CrossRef]
- Song, B.; Tsinaris, A.; Anastasiadis, A.; Pitilakis, K.; Chen, W. Small-strain stiffness and damping of Lanzhou loess. Soil Dyn. Earthq. Eng. 2017, 95, 96–105. [Google Scholar] [CrossRef]
- Sheander, N.; Raj, S.; John, A. Characteristics of nonlinear response of deep saturated soil deposits. Bull. Seismol. Soc. Am. 1997, 87, 342–355. [Google Scholar]
- Wang, J.; Wang, Q.; Wang, J.M. Experimental study on the dynamic characteristics of post−earthquake loess. Hydrogeol. Eng. Geol. 2010, 37, 63–67. (In Chinese) [Google Scholar]
- Wang, H.J.; Sun, P.; Liu, E.L.; Li, R.J. Dynamic properties of Tianshui saturated remolded loess: A laboratory study. Eng. Geol. 2020, 272, 105570. [Google Scholar] [CrossRef]
- Suits, L.D.; Sheahan, T.C.; Elkady, T.Y.; Houston, S.L.; Houston, W.N. Static and Dynamic Behavior of Hydro-Collapsible Soils. Geotech. Test. J. 2011, 34, 103576. [Google Scholar] [CrossRef]
- Zhang, Z.L.; Wang, T.; Wu, S.R.; Tang, H.M.; Xin, P.; Liang, C.Y. Dynamics stress–strain behavior of Tianshui soils. Landslides 2017, 14, 323–335. [Google Scholar] [CrossRef]
- Araei, A.; Ghodrati, A. Predictive models for normalized shear modulus and damping ratio of modeled rockfill materials. Acta Geodyn. Et Geomater. 2017, 14, 27–40. [Google Scholar] [CrossRef][Green Version]
- Xu, Y.R.; Du, P.; Li, W.Q.; Zhang, W.H.; Tian, Q.J.; Xiong, R.W.; Wang, L. A case study on AD 1718 Tongwei M7. 5 earthquake triggered landslides application of landslide database triggered by historical strong earthquakes on the Loess Plateau. Chin. J. Geophys. Chin. Ed. 2020, 63, 1235–1248. (In Chinese) [Google Scholar] [CrossRef]
- Duan, Y.M. Basic features of buried deep fault structure from Tongwei to Wudu. ACTA Geol. Gausu 2002, 11, 23–28. (In Chinese) [Google Scholar]
- GB 50123-2019; Standard for Geotechnical Testing Method. China Metrology Publishing House: Beijing, China, 2019. (In Chinese)
- D4318−05; Standard Test Methods for Liquid Limit, Plastic Limit, and Plasticity Index of Soils. ASTM: West Conshohocken, PA, USA, 2005.
- D854−06; Standard Test Methods for Specific Gravity of Soil Solids by Water Pycnometer. ASTM: West Conshohocken, PA, USA, 2006.
- D422−63 (Reapproved 2007); Standard Test Method for Particle−Size Analysis of Soils. ASTM: West Conshohocken, PA, USA, 2007.
- D3999−2011; Standard Test Methods for the Determination of the Modulus and Damping Properties of Soils Using the Cyclic Triaxial Apparatus. ASTM: West Conshohocken, PA, USA, 2011.
- Seed, H.B.; Idriss, I.M. Simplifed procedure for evaluating soil liquefaction potential. J. Soil Mech. Found. Div. 1971, 97, 1249–1273. [Google Scholar] [CrossRef]
- GB 18306−2015; Seismic Ground Motion Parameters Zonation Map of China. China Standard Press: Beijing, China, 2015. (In Chinese)
- GB 50011−2010; Code for Seismic Design of Buildings. China Building Industry Press: Beijing, China, 2010. (In Chinese)
- Cheng, G.Y. Study on Correlation between Shear−Wave Velocity and Liquefaction Resistance of Saturated Sand. Ph.D. Thesis, Tianjin University, Tianjin, China, 2003. (In Chinese). [Google Scholar]
- Li, W.; Lang, L.; Wang, D.; Wu, Y.; Li, F. Investigation on the dynamic shear modulus and damping ratio of steel slag sand mixtures. Constr. Build. Mater. 2018, 162, 170–180. [Google Scholar] [CrossRef]
- Hardin, B.O.; Drnevich, V.P. Shear Modulus and Damping in Soils: Design Equations and Curves. J. Soil Mech. Found. Div. 1972, 98, 667–692. [Google Scholar] [CrossRef]
- Jiang, M.; Zhang, F.; Hu, H.; Cui, Y.; Peng, J. Structural characterization of natural loess and remolded loess under triaxial tests. Eng. Geol. 2014, 181, 249–260. [Google Scholar] [CrossRef]
- Huie, C.; Yaling, J.; Cencen, N.; Leng, G.J.; Tian, G.L. Dynamic characteristics of saturated loess under diferent confning pressures: A microscopic analysis. Bull. Eng. Geol. Environ. 2019, 78, 931–944. [Google Scholar] [CrossRef]
Disclaimer/Publisher’s Note: The statements, opinions and data contained in all publications are solely those of the individual author(s) and contributor(s) and not of MDPI and/or the editor(s). MDPI and/or the editor(s) disclaim responsibility for any injury to people or property resulting from any ideas, methods, instructions or products referred to in the content. |
© 2022 by the authors. Licensee MDPI, Basel, Switzerland. This article is an open access article distributed under the terms and conditions of the Creative Commons Attribution (CC BY) license (https://creativecommons.org/licenses/by/4.0/).