Abstract
A software-based procedure consisting of colour measurement of mushrooms was developed for assessing the effectiveness of a new antioxidant active packaging. As active agents, sodium metabisulphite combined with citric acid, green tea extract combined with α-tocopherol and purple carrot extract were evaluated. After obtaining the image of mushrooms with a conventional flatbed scanner, a MATLAB code was specially designed to obtain and compare histograms. Then, data were processed using principal component analysis (66% of the accumulated variance explained) and a successful classification of samples according to their age and antioxidant system was obtained. The developed procedure greatly exceeded the discrimination capabilities of other commonly used methods such as CIE L*a*b* (which was unable to find any significant difference between blank and antioxidant-treated mushrooms; L*blank = 70 ± 3; L*metabisulphite = 75 ± 5; L*green tea = 75 ± 5; L*carrot = 69 ± 5) and visual panel (where only sodium metabisulphite sample was perceived to be significantly different from the rest of the samples, with 27 positive votes out of 50). The developed method classified correctly up to 90% of blank samples according to their age. Besides, 100% and 70% of the mushrooms treated with sodium metabisulphite and green tea, respectively, were found to be fresher than their corresponding blanks. Among samples with sodium metabisulphite, 33% behaved as one-day blank samples, and 67% acted as 4-day blank samples, while among samples with green tea, 10% were found in the 1-day group, and 60% were found in the 4-day group. In contrast, purple carrot proved to be inefficient as an antioxidant. Thus, the difference between blank mushroom samples and those treated with antioxidants was objectively measured.
1. Introduction
Active packaging is a well-known approach for extending the shelf life of foodstuffs. This modern methodology can fulfil consumers’ demand for freshness and flavour of food, without compromising its quality [1]. Latest research trends are focused on the activity and influence of new antioxidants in stored food by preventing uncontrolled oxidation reactions [2]. These reactions are one of the main causes of adverse changes in mushrooms during their manufacture and storage, significantly deteriorating their quality and safety [3]. The potential applicability of various antioxidants incorporated in packaging material has been widely studied [4,5,6,7]. In a previous study [8], green tea combined with α-tocopherol, blueberry extract, and sodium metabisulphite combined with citric acid were evaluated as antioxidant agents for extending the shelf life of mushrooms. However, the biggest challenge during our last study was the determination of colour changes of the mushrooms analysed. Certainly, surface colour (e.g., oxidative browning) is a significant attribute that influences the consumer acceptance and purchase decisions. Therefore, the impact of antioxidants on the shelf life of food products could be evaluated by determination of food colour [9,10].
Over the last decades, the Commission Internationale de l’Eclairage (CIE) L*a*b* [11,12,13] and sensory analysis regulated by International Organization for Standardization (ISO) norms [14,15] have been the most popular approaches for the determination of colour changes in food. The more sophisticated methods described in the literature, such as imaging spectrographs, acousto-optical tunable filters (AOTF), 3CCD cameras or liquid crystal tunable filters (LCTF), can provide excellent results, but they require expensive and complex apparatus [16,17,18,19]. On the other hand, cheaper and simpler approaches, such as the use of digital cameras, have been considered [20], but in the case of mushrooms, limited capabilities for determining subtle changes of colour have been reported. Concerning CIE L*a*b*, another disadvantage can be emphasized: a large number of measurements must be carried out to obtain representative results because of the non-uniform nature of mushroom samples, as well as the heterogeneous distribution of colours due to the oxidation process [21]. In the case of visual professional panels and trained testers, the evaluation is based on the subjective assessment of panellists, which may be unable to distinguish slight differences.
The main objective of this work was to develop a digital software-based procedure for the determination of the surface colour of mushrooms in order to evaluate the effectiveness of the active packaging in which the mushrooms were stored. The procedure can capture and distinguish slight differences in the real colour of several samples, allowing for unambiguous discrimination of diverse treatments of mushrooms. As a result, a quantitative evaluation of the colour surface of fresh mushrooms packaged with an antioxidant material was proposed.
The colour surface of blank samples, i.e., those without any antioxidant, was evaluated at different storage times using a MATLAB code developed specifically for this project. MATLAB was selected because it is a powerful tool that is easier to operate than other software packages. Histograms were processed by means of principal component analysis (PCA), and an oxidation pattern was created. The same procedure was applied to the mushrooms stored in the antioxidant packaging. The correlation between the colours of the samples was obtained, and the influence of antioxidant packaging on extending the shelf life of food was evaluated. The proposed method was compared with CIE L*a*b* and visual panel to emphasize the problems encountered during the colour analysis of food.
This paper deals with the problem of colour evaluation of perishable food and the influence of active packaging on its shelf life. Therefore, the main objective of this research was to develop and optimize a colour-based software method for evaluating the surface colour of food, especially mushrooms. Moreover, simultaneous prediction of the extended shelf life of food stored in active packaging in comparison to conventional packaging was proposed. The method developed can be applied to estimate the efficiency of any new active packaging.
To the best of our knowledge, the change in the surface colour of mushrooms during the oxidation process over a period of storage time has not been described in the literature until now. The present paper fills this gap by demonstrating that it is possible to develop an alternative method for colour evaluation that is objective, unequivocal and precise.
2. Materials and Methods
2.1. Samples
Samples of mushrooms (Agaricus bisporus) were purchased from a local supermarket (Zaragoza, Spain). The mushrooms were already sliced and stored at 4 °C in polystyrene trays wrapped in polyvinyl chloride plastic film. The expiry date of mushrooms declared on the label by the producer was 7 days.
2.2. Reagents
Sodium metabisulphite (98–100.5%, CAS 7681-57-4), citric acid (99%, 77-92-9) and (±) α-tocopherol (≥96%, CAS 10191-41-0) were purchased from Sigma-Aldrich Química S.A. (Madrid, Spain). The green tea extract Sunphenon 90M-T (Camellia sinensis, catechins content >75% w/w) was supplied by Taiyo (Filderstadt, Germany). Purple carrot extract (Daucus carota) was supplied by Azelis España, S.A. (Barcelona, Spain).
2.3. Active Packaging Preparation
The structure of active packaging is shown in Figure 1. Given that the permeability of gases is an important factor to be considered, the external bag (11 × 11 cm2) was made from microperforated (100 μm ± 10%, 15 mm spacing) polypropylene film provided by Food Innovation and Technology Centre (La Rioja, Spain).
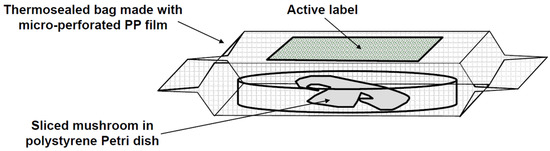
Figure 1.
Structure of the active packaging used in this study.
The different antioxidant agents were incorporated into labels that were adhered to the inner surface of the bags. As shown in Table 1, two kinds of base materials and four different compositions were used to prepare active labels. All the active labels based on polyethylene terephthalate (PET) film were supplied by Artibal S.A. (Sabiñánigo, Spain). The antioxidant agents were incorporated by means of a varnish coating, whose formulation is protected by patent EP1477519 A1.

Table 1.
Composition of the active labels used in study.
One central slice of mushroom with average mass 3.1 ± 0.2 g was placed in a polystyrene Petri dish with an 8.5 cm diameter and 1.3 cm height. An active label (6 × 6 cm2) was affixed on the inner upper part of the bag, and the Petri dish was placed inside. Special care was taken to avoid direct contact between the mushroom and the active film. Finally, the bag was thermosealed and stored at 4 °C in a refrigerator.
2.4. Equipment
The colorimeter Chroma Meter CR-400 from Konika Minolta (Tokyo, Japan) was used for CIE L*a*b* measurements. It was calibrated daily with the white Chroma Meter standard (RGB HEX CFCFCD). In particular, only the lightness value, L*, was considered, since it has been reported as the most relevant colour coordinate [22] when assessing mushroom browning.
The flatbed scanner of a multi-function device, Epson Stylus DX3800 from Epson Ibérica, S.A.U. (Barcelona, Spain), calibrated with colour standards (ICC profile) provided by the supplier, was used to take an image of mushrooms. Colour space was checked daily using white Chroma Meter standard. It was confirmed that both systems worked using the same colour space. The scanner was connected to a MacBook Air 2010 from Apple Inc. (Cupertino, CA, USA).
2.5. Measurements
2.5.1. CIE L*a*b*
As mentioned previously, although all the colour coordinates were measured, only the lightness value (L*) of the surface of mushrooms, excluding the area of gills, was considered for each sample. Ten replicates of each type of sample (B, A1, A2 and A3) were prepared. Five measurements of each replicate were carried out after the eighth day of the experiment, and average values were considered for calculations. Day 8 was considered the most relevant one, since after this time, the effectiveness of antioxidants should be noticed.
2.5.2. Visual Panel
Eight trained panellists were requested to evaluate the samples of mushrooms. Paired comparison test (bilateral version) was carried out [23]. This means that the panellists did not have any knowledge about the samples. The main objective of this evaluation was to determine if the consumers would preferably choose one particular kind of packaged mushrooms. The samples were randomly sorted and paired (blank versus active packaging). Forty evaluations were performed in order to distinguish between sample B and samples A1, A2 and A3 after the eighth day of the experiment. The visual comparison test was performed in a tasting booth according to ISO 8589:2007 (Sensory analysis—General guidance for the design of test rooms). The lighting was provided by a 600 mm cool daylight (6500 K) Philips fluorescent lamp, MASTER TL-D Super 80 18W/865 1SL/25 (code 63177040), fitted with a polycarbonate diffuser. The height of the lamp with respect to the observation table was 600 mm.
2.5.3. Developed Procedure of Colour Measurement
The images of mushrooms for the procedure of colour measurement were captured according to the following procedure. The white reflective document mat located on the inner side of the scanner lid was covered by a matte black cardboard to avoid light reflections. The mushrooms were placed on the document table; the scanner lid was closed, and all the sides of the scanner were covered with black cardboard in order to avoid stray light. The software Epson Scan 1.2.0.1 was used to scan the samples. The following settings of the software were applied: professional mode, image colour 24-bit and resolution 300 pixels per inch. All mushroom samples were scanned, the real colour was measured and the images were saved as .jpg files. Samples of type B (blanks) were scanned after 1, 4 and 8 days, whereas samples A1, A2 and A3 (with antioxidants) were measured after 8 days.
2.5.4. MATLAB Treatment
The implementation of the MATLAB code is an extremely important step in the entire method, and its success is based on it. So, full description of MATLAB code with detailed comments is presented.
The acquired .jpg files of all samples were processed with Photoshop CS6 from Adobe Systems Inc. (San Jose, CA, USA). Then, each slice of mushroom was selected (excluding the area of gills) using the quick selection tool. It was copied and pasted on an image with a black background (a scan of black cardboard) of 512 × 512 pixels, 300 pixels per inch resolution and 8-bit RGB colour mode. The obtained images were then opened using MATLAB R2013a (8.1.0.604) from MathWorks, S.L. (Madrid, Spain). The code used is described in detail in Table 2.
Table 2.
Developed MATLAB code used for colour quantification.
The proposed code first segmented the sample part of the image from the background. It was based on a simple distance-based threshold, rejecting the background colour previously chosen (#424246 in the case of mushrooms). Then, the program checked the image of the segmented sample, where the colour white indicated the sample and the colour black indicated the background, which was rejected for further colour analysis.
Afterwards, the colour space coordinates (R, G, B) were divided into an appropriate number of ranges called bins. The discretization of the colours of mushrooms into several bins was carried out. The calculated bin equation partitioned the colours up into K bins per colour. Each colour was processed separately, and then the overall bin was represented as a sum of the previous ones. In this way, a fixed-length vector representation for each image was obtained. The colour histograms of the first and second images were then plotted on the same graph, from which the number of bins (x-values) and the number of pixels (y-values) were retrieved. Using this method, two to infinite images can be compared. In this paper, a code for the comparison of two samples is presented.
As a result of the MATLAB treatment, a colour histogram for each sample was obtained. The histograms were characterized by non-zero values that were fingerprints of each sample. The next step consisted of principal component analysis (PCA) of x- and y- values for all blank samples using a 2D scattered plot. The Unscrambler 9.1 from CAMO Software AS. (Oslo, Norway) was selected for this purpose. The oxidation patterns were obtained by picturing groups of one kind of sample (1, 4 and 8 days). Then, PCA of the values of all blank samples combined with the values of the samples treated with various active agents was performed.
2.5.5. Optimization
Resolution
The characterizing value resolution can be modified. Higher resolutions provide better information about the colours of an image. Still, they need more data to work correctly because two almost identical colours will fall into different bins, with a consequent increase in the dimension of the x-values. Higher-resolution values would be necessary in the case of food with many tones of colour, such as meat. The appropriate amount of y-values characterizing a particular product ensures the correct oxidation pattern. Otherwise, the grouping of similar samples will not be possible during PCA. In mushrooms, a resolution value of 4 was enough to generate an exact oxidation pattern.
Background
It is necessary to be aware of the changes in colour that characterize the analysed samples over time. In mushrooms, deteriorative oxidation causes browning of the fungi body, which significantly influences the applied background colour. The black colour of the background was chosen because it was not present among the analysed sample colours (from white to brown), and it would not be discarded as a part of a sample during segmentation.
y-values
The optimization of y-values was carried out using the Unscrambler software. It consisted of the rejection of all values that did not significantly affect the oxidation pattern. The values that differed from the others were also eliminated as interfering components of the oxidation pattern.
3. Results and Discussion
3.1. L* Measurements
The obtained results of L* are shown in Figure 2. After calculating the average value of L* for 8-day samples with different antioxidants, these were plotted using bar graphs. Error bars representing standard deviation (n = 10) were also added.
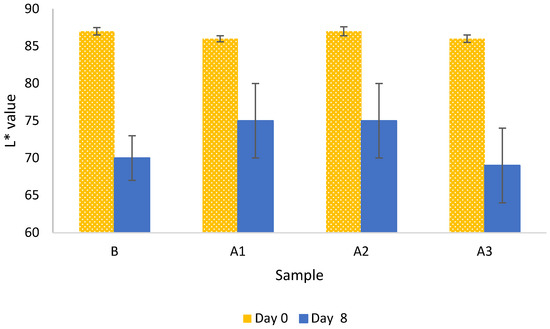
Figure 2.
Average values (n = 10) of L* of the samples studied the initial day (yellow dotted bars) and after 8 days (blue bars). Error bars represent the standard deviation.
A slight decrease in the L* values for blank samples can be observed, which is consistent with expectations. Considering the error size in the samples treated with antioxidants, especially those treated with sodium metabisulphite (A1) and anthocyanins present in carrot extract (A3), it was challenging to conclude whether a particular active agent protected against oxidation or not. It seemed that mushrooms protected with antioxidants A1 and A2 maintained the colour white, while A3 did not have a positive effect on extending the shelf life of the analysed samples.
3.2. Visual Panel
The developed method helped predict the time of shelf life prolongation of mushrooms stored in active packaging in comparison to conventional packaging (blank). The method estimates if the active packaging works properly and how efficient it is. To achieve this goal, both blank and active samples from different time frames need to be acquired and compared. Figure 3a,b show the comparison of the following samples: (a) is an eight-day mushroom sample protected with green tea combined with α-tocopherol, and (b) is an eight-day blank sample.
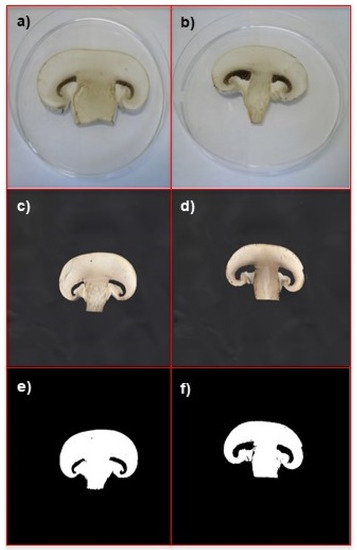
Figure 3.
Comparison of different mushroom samples, all of them collected after 8 days: (a) image of a sample protected with green tea + α-tocopherol; (b) image of a blank sample; (c) scan of a sample protected with green tea + α-tocopherol; (d) scan of a blank sample after 8 days; (e) segmentation of a sample protected with green tea + α-tocopherol; (f) segmentation of a blank sample. Images (a,b) were captured with a Nikon Coolpix 4300 digital camera positioned at a height of 15 cm and a 45° angle, upper lighting (6500 K diffuse fluorescent light), with the following settings: manual mode; no flash; macro close-up (focus mode); fine image quality; 1600 image size; ISO auto (sensitivity). Images (c–f) were captured with the Epson Stylus DX3800 scanner.
It is an example of a pair of samples shown to panellists for visual evaluation. These samples were not successfully distinguished by any of the panellists, as they were too similar to differentiate visually. This confirms that visual analysis is not sensitive enough to evaluate the influence of active packaging on mushrooms.
The results of the sensory analysis are shown in Table 3.
Table 3.
Results of the visual panel for samples with different antioxidant treatments.
According to the opinion of the panellists, samples A1 had a better visual aspect than the blank samples. The samples from packaging A2 almost met the requirements of signification limit (with α = 0.05, the limit is ≥27). However, it was impossible to distinguish between samples B and A2. In contrast, during the last evaluation, the testers chose samples B, so it can be concluded that antioxidant A3 did not positively influence mushrooms. In general, the results obtained left doubts, especially for samples A1 and A2, because the number of votes received was not significant enough to confirm whether active agents indeed extend the shelf life of mushrooms.
3.3. MATLAB Treatment
Figure 3c,d present the scans, after eight days, of a sample protected with green tea combined with α-tocopherol (A2) and a blank sample (B), respectively. The segmentation of these mushrooms is shown in Figure 3e,f.
The colour white indicates the analysed sample. The gill areas were discarded to avoid falsification of results. Non-zero values of y were obtained for the following x-values: 6, 22, 23, 27, 43, 44, 48 and 64. Values of y corresponding to x = 6 and x = 64 were rejected during optimization of the process, so they were not used in PCA. In loading plots, the most important influencing variables are located along the horizontal axis. In this case, a loading plot can be used as a screening tool for choosing relevant variables.
Figure 4 shows the oxidation pattern created using all blank samples. The samples were coded according to the format X_m_n, where “X” is the kind of sample (B, A1, A2, A3), “m” is the sample age in days and “n” is the replicate number. The model used described 66% of the accumulated variance. Grouping of samples of the same type can be observed with some exceptions. The samples marked with an asterisk should belong to other groups. Our method classified correctly up to 90% of blank samples according to their age. Mushrooms are not uniform samples (compared within themselves) in terms of surface colour. Moreover, each sample can undergo a distinct process of oxidation over time. When working with real natural foodstuffs, one must keep in mind that several differences in the obtained oxidation pattern are typical and expected.
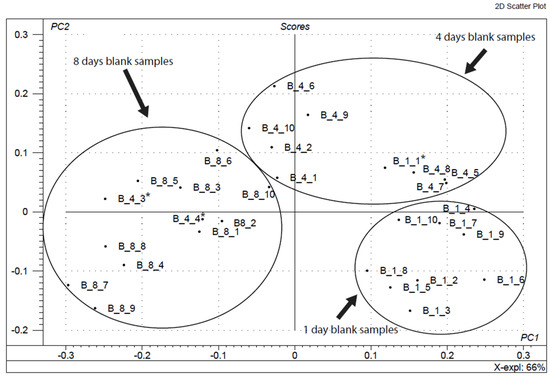
Figure 4.
Oxidation pattern corresponding to all blank samples by means of principal component analysis (PCA).
The influence of three different antioxidants on extending the shelf life of mushrooms was evaluated. According to the results obtained in our previous work [8], antioxidants A1 and A2 should influence the analysed samples positively. These “positive” antioxidants were chosen to confirm that the developed method was working correctly. Moreover, one “negative” antioxidant (A3) was used to check the data distribution in an active agent that was previously proven ineffective.
Figure 5 shows the distribution of samples A1, A2 and A3 on the background of the oxidation pattern. Sample A1_8_10 was rejected because it was found totally outside the oxidation pattern, preventing the correct distribution of the other samples. It can be seen that 8-day samples treated with antioxidant A1 are placed between 1 and 4 days of samples B without antioxidant protection, and 100% of the mushrooms treated with sodium metabisulphite were found to be fresher than their corresponding blanks. To specify, among them, 33% of the samples behaved as one-day blank samples, and 67% acted as 4-day blank samples. The distribution of samples A2 shows that they are mainly located in the 4-day group of blanks. This means that the tested antioxidants extended the shelf life of mushrooms by keeping their surface appearance fresher than the corresponding unprotected samples; 70% of the mushrooms treated with green tea were detected to be fresher than their corresponding blanks. Among them, 10% of the samples were found in the 1-day group, and 60% of the samples were found in the 4-day group.
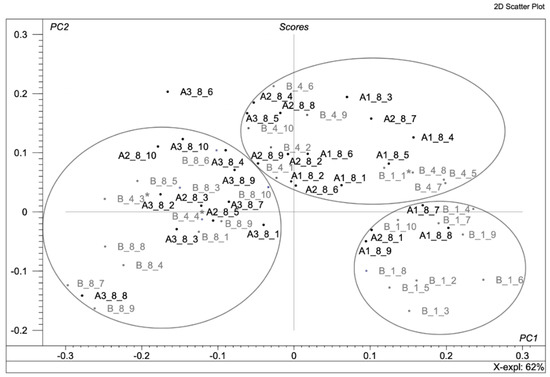
Figure 5.
Oxidation pattern corresponding to active samples A1, A2 and A3 by means of principal component analysis (PCA).
Moreover, the active agents used had different ways of action. The first one, A1, was volatile, and theoretically, it should have a strong influence on the samples. The second one, A2, was a free radical scavenger that should also have a strong effect. This theory has been successfully confirmed by the proposed method. Finally, the behaviour of antioxidant A3 was studied. Almost all A3 samples were similar to samples B after 8 days (10% of the samples were found in the 4-day group, and 10% of the samples were probably out of any group), which means that this antioxidant did not work. It can also be concluded that the active agent A3 did not have a negative effect on the samples in terms of accelerating the deterioration of mushrooms, since antioxidant A3 did not give worse results than the samples B.
The presented method can undoubtedly evaluate, in an objective manner, the colour distribution in the surface of both fresh white and brown oxidized mushrooms. Consequently, the investigation of antioxidants’ influence on food surface colour could be carried out.
The literature describes results of recent developments and applications of novel methods for the assessment of quality deterioration of fresh mushrooms. Nazir et al. [24] have demonstrated that hyperspectral imaging (HSI) can be used as storage-time quality assessment tool. Analysis was conducted on a macro-hyperspectral imaging platform. The data for HSI indicators needed to be fitted with rate-order equations. Lu et al. [25] developed an image measurement algorithm for common mushroom caps based on a convolutional neural network. The internet protocol cameras of the image measurement system for mushrooms were used. The proposed algorithm used YOLOv3 for image analysis, with an efficiency of 82.7%, and might facilitate future research in a large amount of data analysis. Finally, Internet of Things (IoT) was applied for classification of mushroom toxicity by Rahman et al. [26]. It is based on a system of interconnected computing devices that can transfer data over the Internet without interaction between human and machine. IoT is currently used on an industrial scale to connect farmers to their farms using sensors, allowing them to monitor farm conditions in real time from anywhere.
4. Conclusions
A procedure for the determination of the surface colour of fresh sliced mushrooms was developed. Objectively, the method allows for assessing the effect of a new active packaging containing different antioxidants on mushroom browning.
Results of the analysis of mushroom surfaces showed that CIE L*a*b* could not find any significant difference between blank and antioxidant samples. Moreover, a visual panel perceived that only one type of active packaging extends the shelf life of mushrooms. Therefore, the proposed method presents several advantages over standard and less sensitive techniques to detect subtle colour changes, such as CIE L*a*b* evaluation and a visual panel, clearly showing better discrimination capability without ambiguous results.
Only cheap and easy-to-find tools available in each laboratory (graphical software, scanner, MATLAB code and PCA analysis) were required. The advantage of the application of MATLAB from a method development point of view is that implementation and testing of new algorithms is easy, and another benefit is that it is easy to use for any researcher due to its command line interface and file-oriented structure. A calculated oxidation pattern allows the correlation of the “age” of the samples with different antioxidants vs. untreated mushrooms. PCA analysis showed that the efficiency of the method is very high, as it correctly classified up to 90% of blank samples. It should be highlighted that 100% and 70% of the mushrooms treated with sodium metabisulphite and green tea, respectively, were found to be fresher than their corresponding blank samples.
The proposed method can be useful during new antioxidant investigations and during any experiment in which the influence of certain conditions on food is evaluated using colour.
Author Contributions
Conceptualization, M.W., D.P., J.S., C.N. and A.I.; methodology, M.W. and D.P.; software, M.W., D.P. and A.I.; validation, M.W., D.P. and J.S.; formal analysis, D.P. and J.S.; investigation, M.W. and D.P.; resources, C.N. and A.I.; data curation, M.W., D.P. and J.S.; writing—original draft preparation, M.W., D.P., J.S. and A.I.; writing—review and editing, M.W., D.P., J.S. and C.N.; visualization, D.P., J.S., C.N. and A.I.; project administration, C.N and A.I.; funding acquisition, C.N. All authors have read and agreed to the published version of the manuscript.
Funding
This research received no external funding.
Institutional Review Board Statement
Not applicable.
Informed Consent Statement
Not applicable.
Data Availability Statement
Not applicable.
Acknowledgments
The authors thank Azelis España S.A. (Cornellà de Llobregat, Barcelona, Spain) and Iprona AG (Lana, Italy) for providing antioxidant extracts and the Food Innovation and Technology Centre from La Rioja (Spain) for providing thermosealable microperforated polypropylene film. The authors also thank Gobierno de Aragón and Fondo Social Europeo for their financial support to the GUIA group T53_20R.
Conflicts of Interest
The authors declare no conflict of interest.
References
- De Kruijf, N.; Van Beest, M.; Rijk, R.; Sipiläinen-Malm, T.; Losada, P.P.; De Meulenaer, B. Active and intelligent packaging: Applications and regulatory aspects. Food Addit. Contam. 2002, 19, 144–162. [Google Scholar] [CrossRef] [PubMed]
- Firouz, M.S.; Mohi-Alden, K.; Omid, M. A critical review on intelligent and active packaging in the food industry: Research and development. Food Res. Int. 2021, 141, 110113. [Google Scholar] [CrossRef] [PubMed]
- Nerín, C. 16-Antioxidant Active Food Packaging and Antioxidant Edible Films. In Woodhead Publishing Series in Food Science, Technology and Nutrition; Decker, E.A., Elias, R.J., Julian McClements, D.B.T.-O., Eds.; Woodhead Publishing: Sawston, UK, 2010; pp. 496–515. ISBN 978-1-84569-983-3. [Google Scholar]
- Colon, M.; Nerin, C. Role of Catechins in the Antioxidant Capacity of an Active Film Containing Green Tea, Green Coffee, and Grapefruit Extracts. J. Agric. Food Chem. 2012, 60, 9842–9849. [Google Scholar] [CrossRef] [PubMed]
- Rodriguez-Lafuente, A.; Nerin, C.; Batlle, R. Active Paraffin-Based Paper Packaging for Extending the Shelf Life of Cherry Tomatoes. J. Agric. Food Chem. 2010, 58, 6780–6786. [Google Scholar] [CrossRef] [PubMed]
- Ouahioune, L.A.; Wrona, M.; Nerín, C.; Djenane, D. Novel active biopackaging incorporated with macerate of carob (Ceratonia siliqua L.) to extend shelf-life of stored Atlantic salmon fillets (Salmo salar L.). LWT 2022, 156, 113015. [Google Scholar] [CrossRef]
- Wrona, M.; Silva, F.; Salafranca, J.; Nerín, C.; Alfonso, M.J.; Caballero, M. Design of new natural antioxidant active packaging: Screening flowsheet from pure essential oils and vegetable oils to ex vivo testing in meat samples. Food Control 2020, 120, 107536. [Google Scholar] [CrossRef]
- Wrona, M.; Bentayeb, K.; Nerín, C. A novel active packaging for extending the shelf-life of fresh mushrooms (Agaricus bisporus). Food Control 2015, 54, 200–207. [Google Scholar] [CrossRef]
- Quevedo, R.A.; Aguilera, J.M.; Pedreschi, F. Color of Salmon Fillets by Computer Vision and Sensory Panel. Food Bioprocess Technol. 2008, 3, 637–643. [Google Scholar] [CrossRef]
- Cheng, H.; Xu, H.; McClements, D.J.; Chen, L.; Jiao, A.; Tian, Y.; Miao, M.; Jin, Z. Recent advances in intelligent food packaging materials: Principles, preparation and applications. Food Chem. 2021, 375, 131738. [Google Scholar] [CrossRef]
- Liu, Z.; Wang, X. Changes in color, antioxidant, and free radical scavenging enzyme activity of mushrooms under high oxygen modified atmospheres. Postharvest Biol. Technol. 2012, 69, 1–6. [Google Scholar] [CrossRef]
- Moquet, F.; Guedes-Lafargue, M.R.; Vedie, R.; Mamoun, M.; Olivier, J. Optimum Measure of Cap Color in Agaricus bisporus Wild and Cultivated Strains. J. Food Sci. 1997, 62, 1054–1079. [Google Scholar] [CrossRef]
- Peiretti, P.G.; Gai, F.; Ortoffi, M.; Aigotti, R.; Medana, C. Effects of Rosemary Oil (Rosmarinus officinalis) on the Shelf-Life of Minced Rainbow Trout (Oncorhynchus mykiss) during Refrigerated Storage. Foods 2012, 1, 28–39. [Google Scholar] [CrossRef]
- Masino, F.; Foca, G.; Ulrici, A.; Arru, L.; Antonelli, A. A chemometric study of pesto sauce appearance and of its relation to pigment concentration. J. Sci. Food Agric. 2008, 88, 1335–1343. [Google Scholar] [CrossRef]
- ISO 5495_2005; Sensory Analysis-Methodology-Paired Comparison Test. I Ec. ISO: Geneva, Switzerland, 2005.
- Wu, D.; Sun, D.-W. Advanced applications of hyperspectral imaging technology for food quality and safety analysis and assessment: A review—Part I: Fundamentals. Innov. Food Sci. Emerg. Technol. 2013, 19, 1–14. [Google Scholar] [CrossRef]
- Cubero, S.; Aleixos, N.; Moltó, E.; Gómez-Sanchis, J.; Blasco, J. Advances in Machine Vision Applications for Automatic Inspection and Quality Evaluation of Fruits and Vegetables. Food Bioprocess Technol. 2010, 4, 487–504. [Google Scholar] [CrossRef]
- Gowen, A.A.; Taghizadeh, M.; O’Donnell, C.P. Identification of mushrooms subjected to freeze damage using hyperspectral imaging. J. Food Eng. 2009, 93, 7–12. [Google Scholar] [CrossRef]
- Saldaña, E.; Siche, R.; Huamán, R.; Luján, M.; Castro, W.; Quevedo, R. Computer vision system in real-time for color determination on flat surface food. Sci. Agropecu. 2013, 4, 55–63. [Google Scholar] [CrossRef][Green Version]
- Taghizadeh, M.; Gowen, A.A.; O’Donnell, C.P. Comparison of hyperspectral imaging with conventional RGB imaging for quality evaluation of Agaricus bisporus mushrooms. Biosyst. Eng. 2011, 108, 191–194. [Google Scholar] [CrossRef]
- Wu, D.; Sun, D.-W. Colour measurements by computer vision for food quality control—A review. Trends Food Sci. Technol. 2013, 29, 5–20. [Google Scholar] [CrossRef]
- Ding, Y.; Zhu, Z.; Zhao, J.; Nie, Y.; Zhang, Y.; Sheng, J.; Meng, D.; Mao, H.; Tang, X. Effects of Postharvest Brassinolide Treatment on the Metabolism of White Button Mushroom (Agaricus bisporus) in Relation to Development of Browning During Storage. Food Bioprocess Technol. 2016, 9, 1327–1334. [Google Scholar] [CrossRef]
- Wu, C.; Bull, B.; Szymanski, C.; Christensen, K.; McNeill, J. Multicolor Conjugated Polymer Dots for Biological Fluorescence Imaging. ACS Nano 2008, 2, 2415–2423. [Google Scholar] [CrossRef] [PubMed]
- Nazir, A.; AlDhaheri, M.; Mudgil, P.; Marpu, P.; Kamal-Eldin, A. Hyperspectral imaging based kinetic approach to assess quality deterioration in fresh mushrooms (Agaricus bisporus) during postharvest storage. Food Control 2021, 131, 108298. [Google Scholar] [CrossRef]
- Lu, C.-P.; Liaw, J.-J. A novel image measurement algorithm for common mushroom caps based on convolutional neural network. Comput. Electron. Agric. 2020, 171, 105336. [Google Scholar] [CrossRef]
- Rahman, H.; Faruq, O.; Hai, T.B.A.; Rahman, W.; Hossain, M.M.; Hasan, M.; Islam, S.; Moinuddin; Islam, T.; Azad, M.M. IoT enabled mushroom farm automation with Machine Learning to classify toxic mushrooms in Bangladesh. J. Agric. Food Res. 2022, 7, 100267. [Google Scholar] [CrossRef]
Disclaimer/Publisher’s Note: The statements, opinions and data contained in all publications are solely those of the individual author(s) and contributor(s) and not of MDPI and/or the editor(s). MDPI and/or the editor(s) disclaim responsibility for any injury to people or property resulting from any ideas, methods, instructions or products referred to in the content. |
© 2022 by the authors. Licensee MDPI, Basel, Switzerland. This article is an open access article distributed under the terms and conditions of the Creative Commons Attribution (CC BY) license (https://creativecommons.org/licenses/by/4.0/).