Article

Study on the Seismic Effect of the Pebble Soil Site in the Zhongwei Basin

1
Earthquake Agency of Ningxia Hui Autonomous Region, Yinchuan 750001, China
2
Earthquake Agency of Gansu Province, Lanzhou 730000, China
*
Author to whom correspondence should be addressed.
Appl. Sci. 2023, 13(1), 243; https://doi.org/10.3390/app13010243
Submission received: 9 November 2022 / Revised: 13 December 2022 / Accepted: 23 December 2022 / Published: 25 December 2022
(This article belongs to the Special Issue Geotechnical Engineering and Seismic Engineering)

Abstract

:
Based on a large amount of drilling and geophysical exploration work in the Zhongwei Basin, and combined with the collected borehole data of a seismic safety assessment, this paper summarizes and builds 16 typical pebble soil layer calculation models. The effects of the thickness of the pebble layer, the thickness of the overlying silty clay, the top interface of the pebble layer on the peak acceleration and the response spectrum of the site seismic response were analyzed using the equivalent linearization method of the one-dimensional soil layer seismic response. The analysis results showed that the variation in pebble layer thickness had no obvious effect on the peak acceleration of the ground surface under different inputs; the influence of the pebble layer thickness on the ground acceleration response spectrum was primarily concentrated in the middle/high-frequency band of 0.2–0.6 s. Within this range, the acceleration response spectrum of the site with a 30 m pebble layer thickness was small, and the response spectrum curve showed a “trough” shape with a certain “weak isolation” effect. Under the same pebble layer thickness, the upper ground surface peak acceleration with a silty clay layer thickness increased with the increase in the central basin pebble soil field, where a short cycle of the seismic wave amplification effect was more obvious. The response spectrum peak period points were within 0.1–0.2 s and were influenced by the action of rare earthquakes. Moreover, the response spectrum curve showed a more obvious phenomenon of “twin peaks”, and the second peak point appeared in the period of 0.5–0.7 s. With the increase in the input intensity, the PGA amplification ratio of the pebble-top interface was significantly smaller than that of the site surface; under different intensities of input, the acceleration response spectrum of the pebble-top interface showed a “trough” phenomenon that was lower than the bedrock input at approximately 0.1 s. Under the action of rare ground motion, the acceleration response spectrum curve of the pebble-top interface showed a “double peak” phenomenon, and within 0.24–0.4 s, the spectrum value was lower than the bedrock input, showing an obvious shock absorption and isolation effect. Under the action of an earthquake, the energy of the pebble-top interface was concentrated in the low-frequency range of 1.1–2.2 Hz, and the amplification effect was obvious. In the range of 8–10 Hz, the amplitude was lower than the bedrock input, and the seismic isolation effect was obvious.

1. Introduction

The Zhongwei Basin is located north of the Fragrant Mountains on the northeastern margin of the Tibetan Plateau and the southern margin of the Tengger Desert, where the Yellow River crosses from west to east. According to previous research results and on-site exploration, the pebble strata deposited in the basin have thicknesses ranging between 25 and 100 m, and the overlying silty clay layer ranges between 0 and 5 m. The stratigraphic structure is more unique than the general basin strata. There are several large-scale active faults around the basin. Historically, strong (large) earthquakes have occurred frequently, causing serious disasters, such as the 1709 Zhongwei 7½ Ms earthquake. With the proposal of policy to support Ningxia’s construction of the Yellow River Basin’s ecological protection and high-quality development pilot zone, a series of infrastructure, industrial parks, housing reinforcement, and renovation projects are being conducted in the Zhongwei Basin, and new requirements for the seismic fortification of the project also entails new challenges. Therefore, research on the seismic effect of the pebble soil site in the Zhongwei Basin can provide a reference for earthquake-prevention and disaster-reduction work and seismic engineering design in the Zhongwei Basin.
In 1928, Wood [1] realized the importance of site conditions in the site seismic response when analyzing the seismic damage to buildings during the 1906 San Francisco earthquake. This finding has been shown by the following earthquakes: the 1923 Kanto earthquake in Japan, the 1967 Venezuela earthquake, the 1968 and 1970 Manila earthquakes in the Philippines, the 1975 Haicheng earthquake in China, the 1976 Tangshan earthquake, the 1985 Mexico earthquake, and the 2008 Wenchuan earthquake. In general, site conditions refer to the local geological conditions, such as the overlying soil layer, landforms, and fracture zone near the site’s surface. With the development of strong earthquake observations and theoretical studies, numerous studies have shown that the seismic effect at the site is closely related to the soil properties, soil structures, overburden thickness, motion intensities, and other parameters. Essentially, the effect of site conditions on earthquake damage is the result of significant amplification or attenuation of the ground motion that originates in the bedrock. In recent years, the effect of near-surface soil conditions on ground motions has received increasing attention, and strong-motion observations demonstrate that the amplification effect of the surface ground motion is more evident in soft- to medium-hard clay and sandy soil grounds than in hard-soil conditions. In addition, the amplification effect has a large range of periods for soft- to medium-hard grounds, generally in the range of 0.3~1.1 s [1]. In contrast, the surface spectral acceleration for the hard soil site shows a significant amplification in the higher-frequency range. Using a one-dimensional equivalent linearization method, Bo [2] investigated the influence of local site conditions on the peak values and the spectral characteristics of ground motion. Bo [2] summarized some recent advances in seismic site effects and further analyzed the influence of different soil structures on the characteristic period of the surface-acceleration response spectrum based on several typical site profiles. Chen et al. [3] conducted a numerical analysis on the influence of the burial depth and thickness of a soft soil layer on the ground motion at a deep site. The analysis showed that, with a special sediment thickness or input ground motion, the amplification effect decreases as the softness of the surface soil layer increases, and the variations in the peak ground accelerations and amplification ratios are not evident when a limit thickness is reached. Interestingly, the deamplification effect of ground motions can be observed when a very thick soft soil layer is located at the ground, acting as a natural damper. Zhou et al. [4] demonstrated that the thickness of a hard interlayer also has an obvious influence on the peak ground acceleration and spectral acceleration, and the presence of a hard interlayer can reduce soil nonlinearity. Although some research on seismic site effects has been conducted on various aspects (e.g., [5,6,7,8,9,10,11,12,13,14,15,16,17,18,19,20]), there have been few research reports on the seismic effects of the pebble soil sites in the Zhongwei Basin. Therefore, research on the seismic effect of the pebble soil site in the Zhongwei Basin is a decision-making reference demand for engineering seismic fortification and urban disaster reduction.

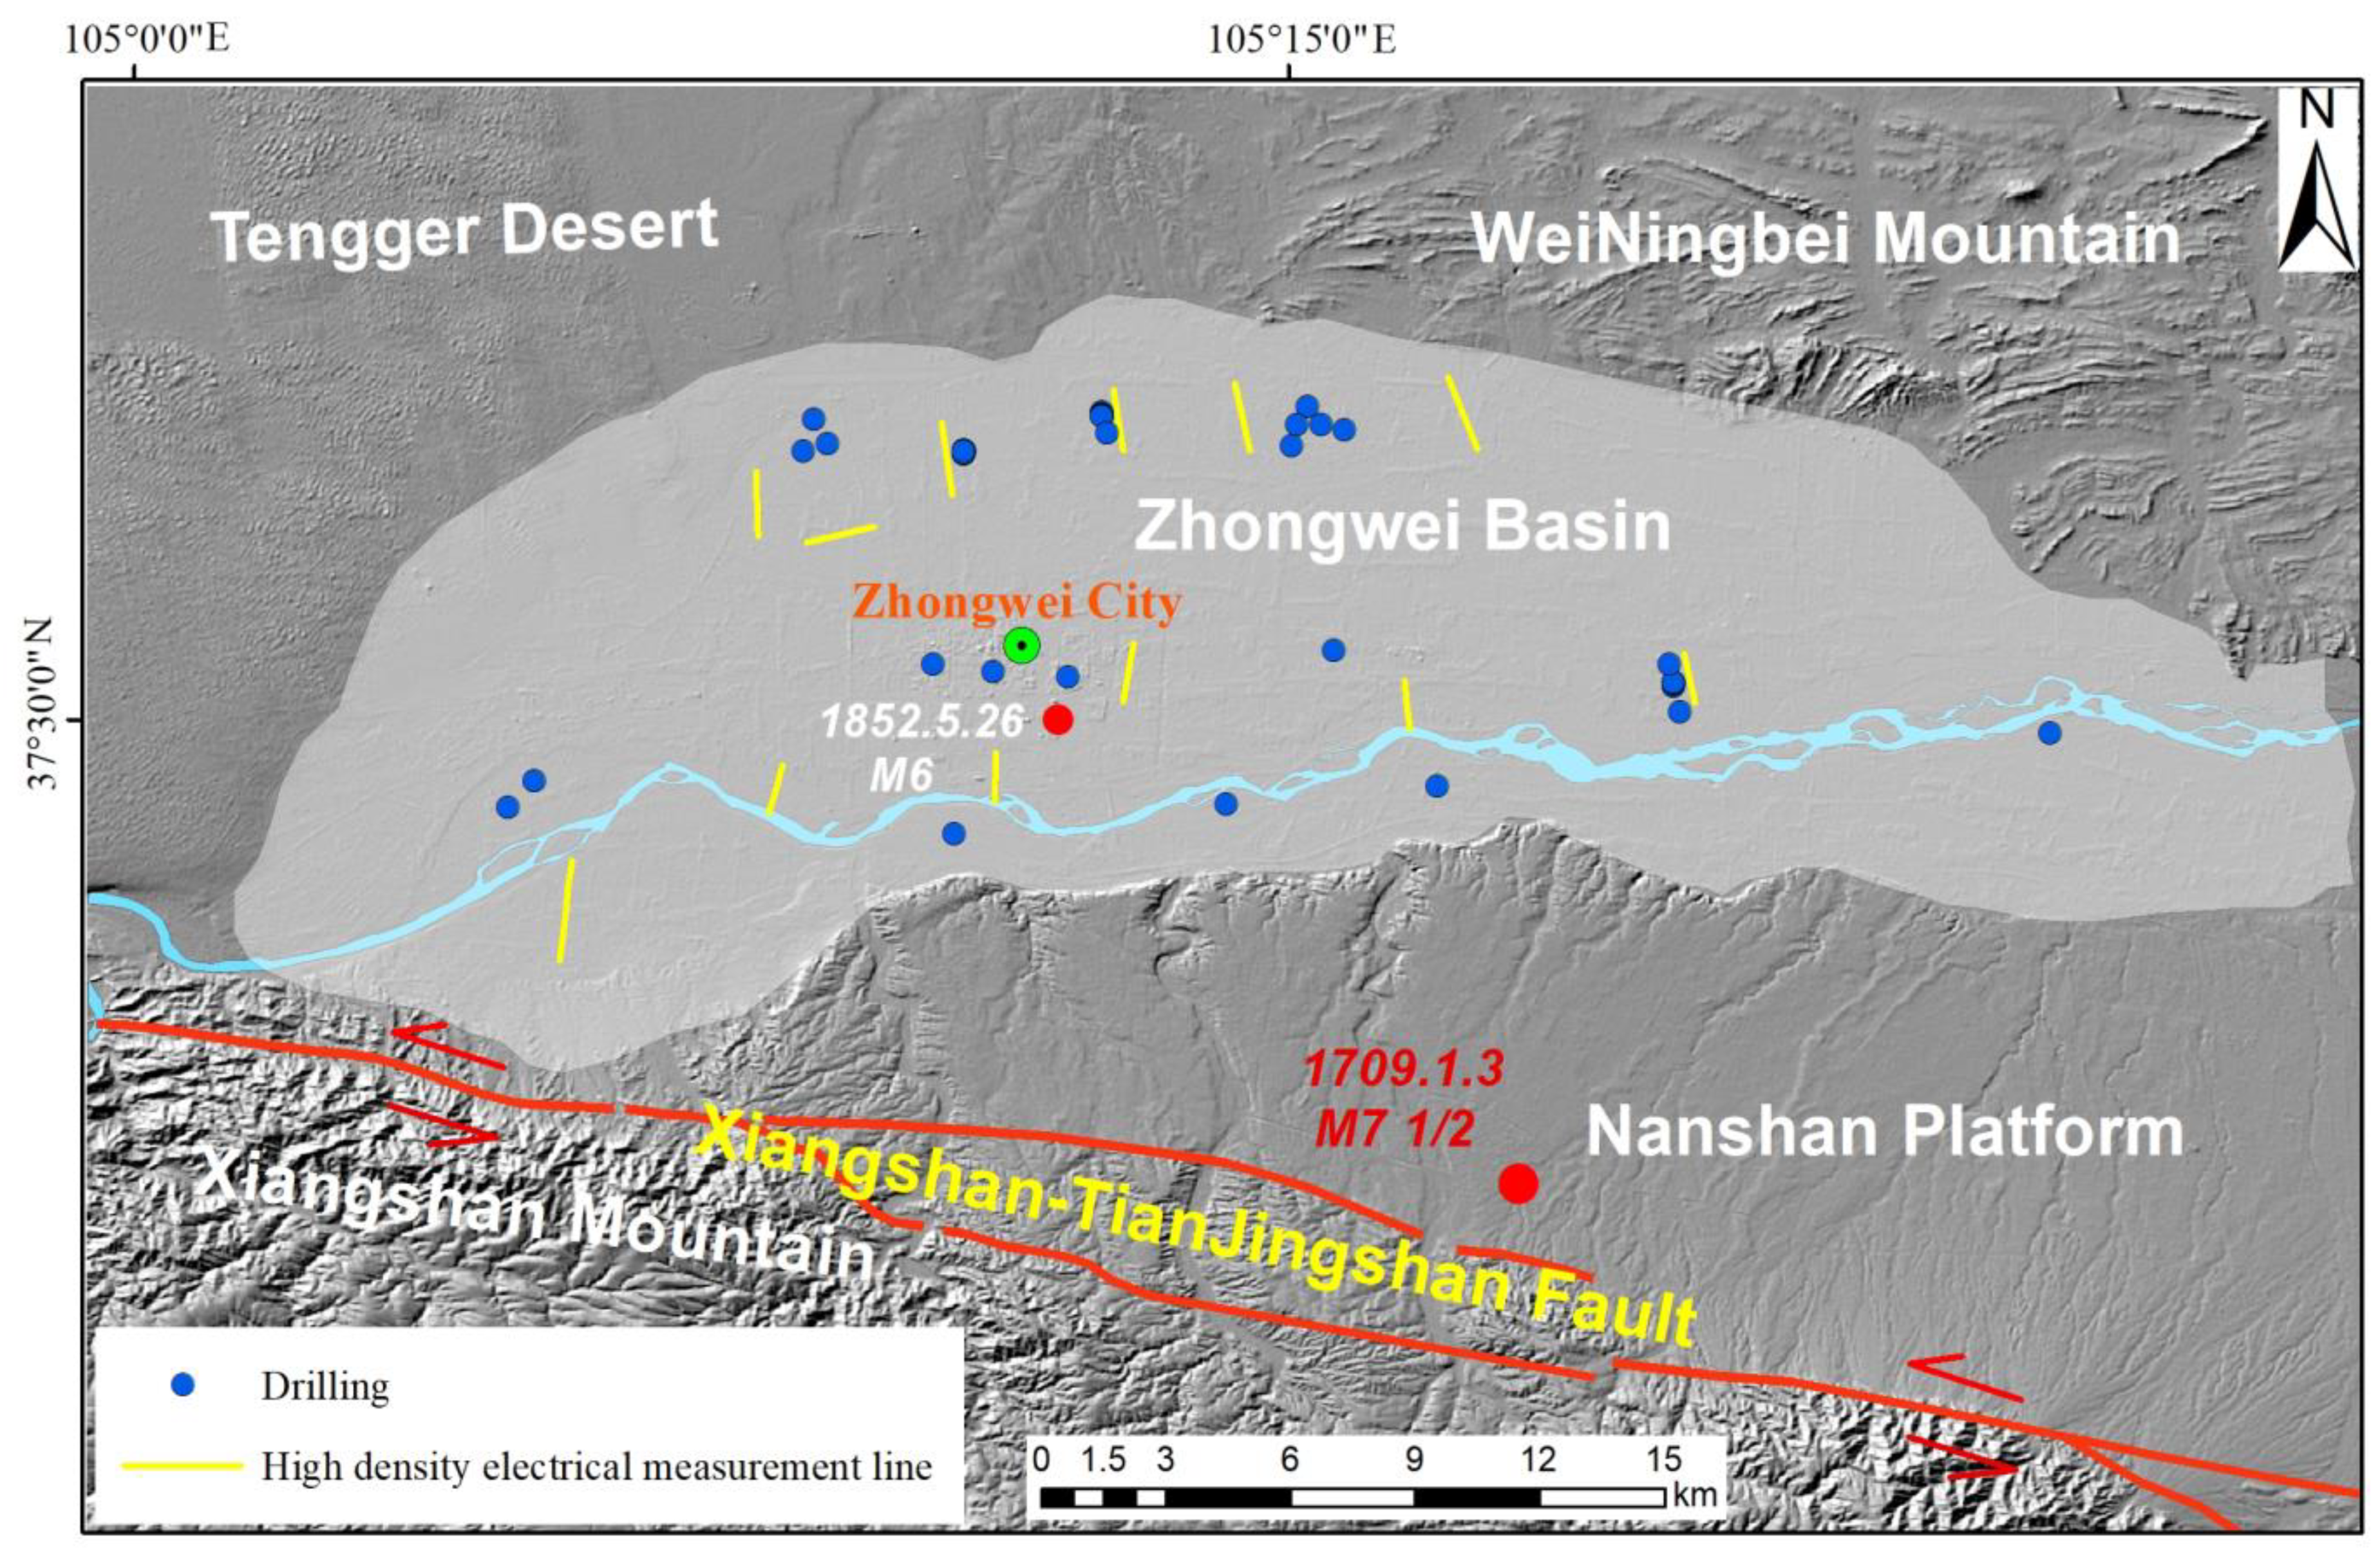
2. Seismology and Geology Conditions of the Zhongwei Basin

The Zhongwei Basin is located in the arc-shaped structural belt on the northeastern margin of the Tibetan Plateau, which is the product of strong tectonic movements and fluvial geology. As shown in Figure 1, The largest earthquake ever recorded was the 1709 Zhongwei 7½ Ms earthquake. According to historical records, this earthquake caused heavy disaster losses. The seismic structure of the 1709 Zhongwei 7½ Ms earthquake was the Xiangshan–Tianjingshan fault zone, which was less than 15 km away from the Zhongwei Basin. The Xiangshan–Tianjingshan fault is an active Holocene active fault that has a risk of earthquakes of 8.0 Ms in the future.
Relying on the “The Active Fault Detection Project in Zhongwei City” and the “First National Natural Disaster Risk Census Project”, the working group conducted many drilling and geophysical explorations in the Zhongwei Basin (Figure 2). At the same time, some borehole and high-density electrical data were also collected. Among them, 25 boreholes and four high-density electrical sections were drilled in the active-fault detection project [21], one borehole was drilled in the risk-survey project, and 20 holes and 8 high-density electrical sections were drilled in the seismic-safety evaluation and seismic-microzoning project. In this work, the basin strata deposition was determined. Multiple boreholes and high-density electrical profiles revealed that the thickness of the pebble layer in the basin was between 25 and 100 m, covered by a silty clay layer ranging between 0 and 5 m, and a sand layer of varying thickness below it. In response to the work requirements, field tests of the borehole shear wave velocity and dynamic parameter tests of some samples were conducted. By collecting the completed seismic safety evaluation reports in the basin and referring to the previous research results, the basic soil model parameters required for the calculation were comprehensively determined.

3. Research Method and Input Seismic Load

Soil is a highly nonlinear material, and the greater the ground motion is, the stronger the nonlinearity. The equivalent linearization method is one of the main methods to estimate the nonlinear characteristics of a site under seismic action. The basic idea is to treat the soil as a viscoelastic material; the overall dynamics have approximately the same effect, with an equivalent shear modulus and equivalent damping ratio under different strain amplitudes; the shear moduli and damping ratios are replaced and the nonlinear problem becomes a linear problem when analyzing the fluctuation in the frequency domain or when time domain iterations are complete. In essence, the equivalent linearization method is still a linear method that simulates the nonlinear constitutive history of soil with only the “equivalent linear” mechanism. However, the equivalent linearization method is still the mainstream current dynamic analysis. This method has many experimental results, its form is relatively intuitive and simple, and it has been used in many engineering projects [22]. The equivalent linearization method transforms the complex nonlinear problem into the approximate solution of the linear problem. Although this processing method simplifies the complex nonlinear problem, it also has some shortcomings, which have especially been shown in engineering applications in recent decades. In general, the equivalent linearization method has the following shortcomings:
  • The equivalent linearization method cannot reflect the real motion process in the soil layer.
  • The equivalent linearization method has some unreasonable phenomena when calculating the soft soil layer or soft soil site. When the base input amplitude is large, the equivalent linearized soil seismic response analysis method is used to calculate the weak soil layer, which increases the nonlinear calculation effect.
  • The equivalent linearization iteration method may also feature a dead circulation.
  • The calculation result of the equivalent linearization method has too great of a narrow-frequency amplification effect (i.e., resonance effect).
Considering the above reasons and its consistency with the existing codes and engineering applications, this method is still used to calculate the seismic response of the soil layer in this paper. This method is physically meaningful and requires fewer soil parameters. It requires only the soil density, shear wave velocity, and the curves of the shear stiffness degradation and damping build-up with increasing shear strains. These parameters were determined through laboratory tests and a field investigation, as listed in Table 1 and Table 2.
Due to the shortage of strong earthquake data in this area, the synthesis method was used in this calculation. This project adopted the probabilistic seismic hazard analysis method stipulated in the national standard “Evaluation of Seismic Safety for Engineering Sites” (GB 17741-2005). The specific steps were as follows:
  • Based on the regional and near-field regional seismicity, the regional and near-field regional seismotectonic backgrounds, and the seismic zones and the estimation of the seismic trend of each seismic zone over the next hundred years, the potential source areas of each seismic zone were delineated.
  • The seismicity parameters of the seismic zone and potential source area were determined.
  • Seismic hazard analysis for each site was conducted, one by one, using the selected attenuation relation of the ground motion and the probability analysis method of the seismic hazards.
  • The acceleration response spectra on the bedrock with different risk levels were evaluated for each site.
Based on each acceleration response spectrum on the bedrock, the corresponding ground motion input was synthesized according to the method stipulated in the “Evaluation of Seismic Safety for Engineering Sites” (GB 17741-2005). The specific steps were as follows:
  • The target response spectrum was converted to the corresponding power spectrum by Equation (1):
S ( ω ) = ε π ω S a 2 ( ω ) / { L n [ π ω T L n ( 1 r ) ] }
where S ( ω ) is the power spectrum; ε is the damping ratio; S a 2 ( ω ) is the target response spectrum; T is the duration; and r is the exceeding probability of the target reaction spectrum.
2.
Stable Gaussian processes with zero mean values were generated by the trigonometric series superposition method, using Equation (2):
X ( t ) = i = 0 n A i cos ( ω i t + ϕ i )
where A i = [ 4 S ( ω i ) Δ ω ] 0.5 , and the initial phase ϕ i is a uniformly distributed random variable during [ 0 2 π ] .
3.
The stationary time history was multiplied by the nonstationary strength envelope to obtain the nonstationary acceleration time history, using Equation (3):
a ( t ) = Ψ ( t ) X ( t )
The nonstationary envelope function was determined to be of the following form, using Equation (4):
Ψ ( t ) = { (   t t 1   ) 2 0 < t t 1 1 t 1 < t t 2 e c ( t t 2 ) t 2 < t T
where t1 is the rising part of the peak, t1t2 is the stationary segment of the peak, T is the duration, and c is the attenuation coefficient of the peak.
Eighty-five control points of the target response spectrum were selected within 0.04~6 s to ensure the precision of the target response spectrum fitting during the synthetic ground motion. During synthesis, the time history of the synthesized acceleration accurately met the peak acceleration of the target and approximated the response spectrum of the target acceleration by approximating the target spectrum step by step.
To maximize the reflection of the actual structure subjected to seismic action, site-specific ground motions are necessary. In this paper, artificial ground motions were generated by gradually approaching the target design spectrum in this area. Four ground motions with different amplitudes were generated based on the return period of this area, as shown in Figure 3. They corresponded to exceeding probabilities of 63% (frequently occurring earthquakes), 10% (normally occurring earthquakes), and 2% (rarely occurring earthquakes) in 50 years, and 1% in 100 years (extremely rarely occurring earthquakes).

4. Results

4.1. The Result of Variation in the Pebble Thickness

According to the geophysical exploration and drilling work conducted for this study, there are pebble beds with different thicknesses in the Zhongwei Basin. The overlying silty clay beds are approximately 5 m in most areas and are overlaid with sticky sand of varying thicknesses. To study the influence of the pebble layer thicknesses on the ground motion parameters, ten one-dimensional calculation models with pebble layers of different thicknesses were established in this paper, as shown in Table 1. Among them, the soil shear wave velocity was obtained by in situ testing. Figure 4 shows the wave velocity test results of typical drilling holes, and it can be seen from the shear waveform that the test results are true and reliable. The dynamic nonlinear parameters of each type of soil were given by a third-party laboratory, and the test results of similar soils in other local engineering projects were referred to (Table 2).
According to the soil layer models in Table 3, the Zhongwei Basin is a class Ⅱ site. This paper used SEC computing software for calculation analysis, which is a mature and advanced computing software in China [23]. Through calculation, the PGA amplification ratio of the different pebble layer thicknesses under different input intensities was obtained. As shown in Figure 5, under the same input, the variation in the pebble layer thickness had no obvious influence on the amplification ratio of site PGA. Under the same pebble layer thickness, the amplification ratio of PGA decreased with the increase in input. Moreover, the site PGA under different inputs was significantly higher than the corresponding zoning results of the Zhongzhongwei Basin in the “China Seismic Parameter Zoning Map (GB 18306-2015)”, and the amplification ratio was also significantly higher than the corresponding site PGA adjustment coefficient. The analysis showed that the main reason for the large PGA value of the site was the large input ground motion obtained by the probability hazard calculation, and the high amplification factor was caused by the overburden of the shallow silty clay.
As shown in Figure 6, the influence of the pebble layer thickness on the response spectrum of ground acceleration was primarily concentrated in the middle/high-frequency bands of 0.2–0.6 s, and with the increase in the input ground motion, the differences in the response spectrum curves in this range also increased. The acceleration response spectrum curves of sites with a pebble layer thickness greater than 65 m (Models 1–9, 1–10) were significantly larger than those with a pebble layer thickness less than 65 m. In the period range of 0.2–0.6 s, the acceleration response spectrum value of the site with a 30 m pebble layer thickness (Model 1–2) was significantly smaller than that of the other site models, and the response spectrum curve showed a “trough” shape. The site with a pebble layer thickness of 30 m was the site type with the widest distribution and largest area in the Zhongwei Basin. Therefore, such sites have a certain “weak isolation” function in the middle/high-frequency band of 0.2–0.6 s.

4.2. The Result of Variation in the Silty Clay Thickness

The above research results show that the overlying silty clay in the Zhongwei Basin has a direct impact on the site PGA amplification ratio. To study the influence of the silty clay layer’s thickness on the ground motion parameters, this paper set the thickness of the pebble layer to 30 m and established six one-dimensional calculation models by changing the thickness of the overlying silty clay layer from 0 to 5 m, as shown in Table 3.
As shown in Table 4, the peak acceleration of the surface response spectrum increases with the increase in the upper silty clay layer thickness. As shown in Figure 7, the maximum shear strain under different strength inputs is less than 3 × 10⁻⁵, and the site nonlinearity is small. Therefore, the equivalent linearization method is suitable for calculation and analysis. As shown in Figure 8, with the increase in the silty clay layer thickness, the PGA amplification ratio of the site increases. The amplification ratio of PGA decreases with the increase in the input ground motion. When the overlying soil layer is greater than 3 m, the amplification coefficient increases significantly under different inputs, and the smaller the input, the larger the amplitude. Under the extremely rare earthquake, the PGA amplification ratio of the site is significantly lower than that of the other seismic effects, which accurately reflects the influence characteristics of the site nonlinearity on the ground motion.
As shown in Figure 9, the pebble soil site in the Zhongwei Basin has an obvious amplification effect on the short-period seismic waves, and the periodic peak points of the response spectrum are all within 0.1–0.2 s. Under the action of frequent earthquakes, basic earthquakes, and rare earthquakes, the site significantly amplifies the short-period component of the earthquake but has little effect on the long-period component. Under the action of the extremely rare earthquake, the response spectrum curve shows an obvious “double peak phenomenon”, and the second peak point appears in the period of 0.5–0.7 s. The amplitude of the response spectrum increases with the thickness of the overlying silty clay layer under frequent earthquakes, basic earthquakes, and rare earthquakes. Under the extremely rare earthquake, the response spectrum curve shows strong dispersion before 0.3 s. This result is surprisingly similar to the findings of another recent study on the effects of deep soil sites atop deep geological sediments on surface ground motion, in which a spectral peak at 0.5 s was also found [24].

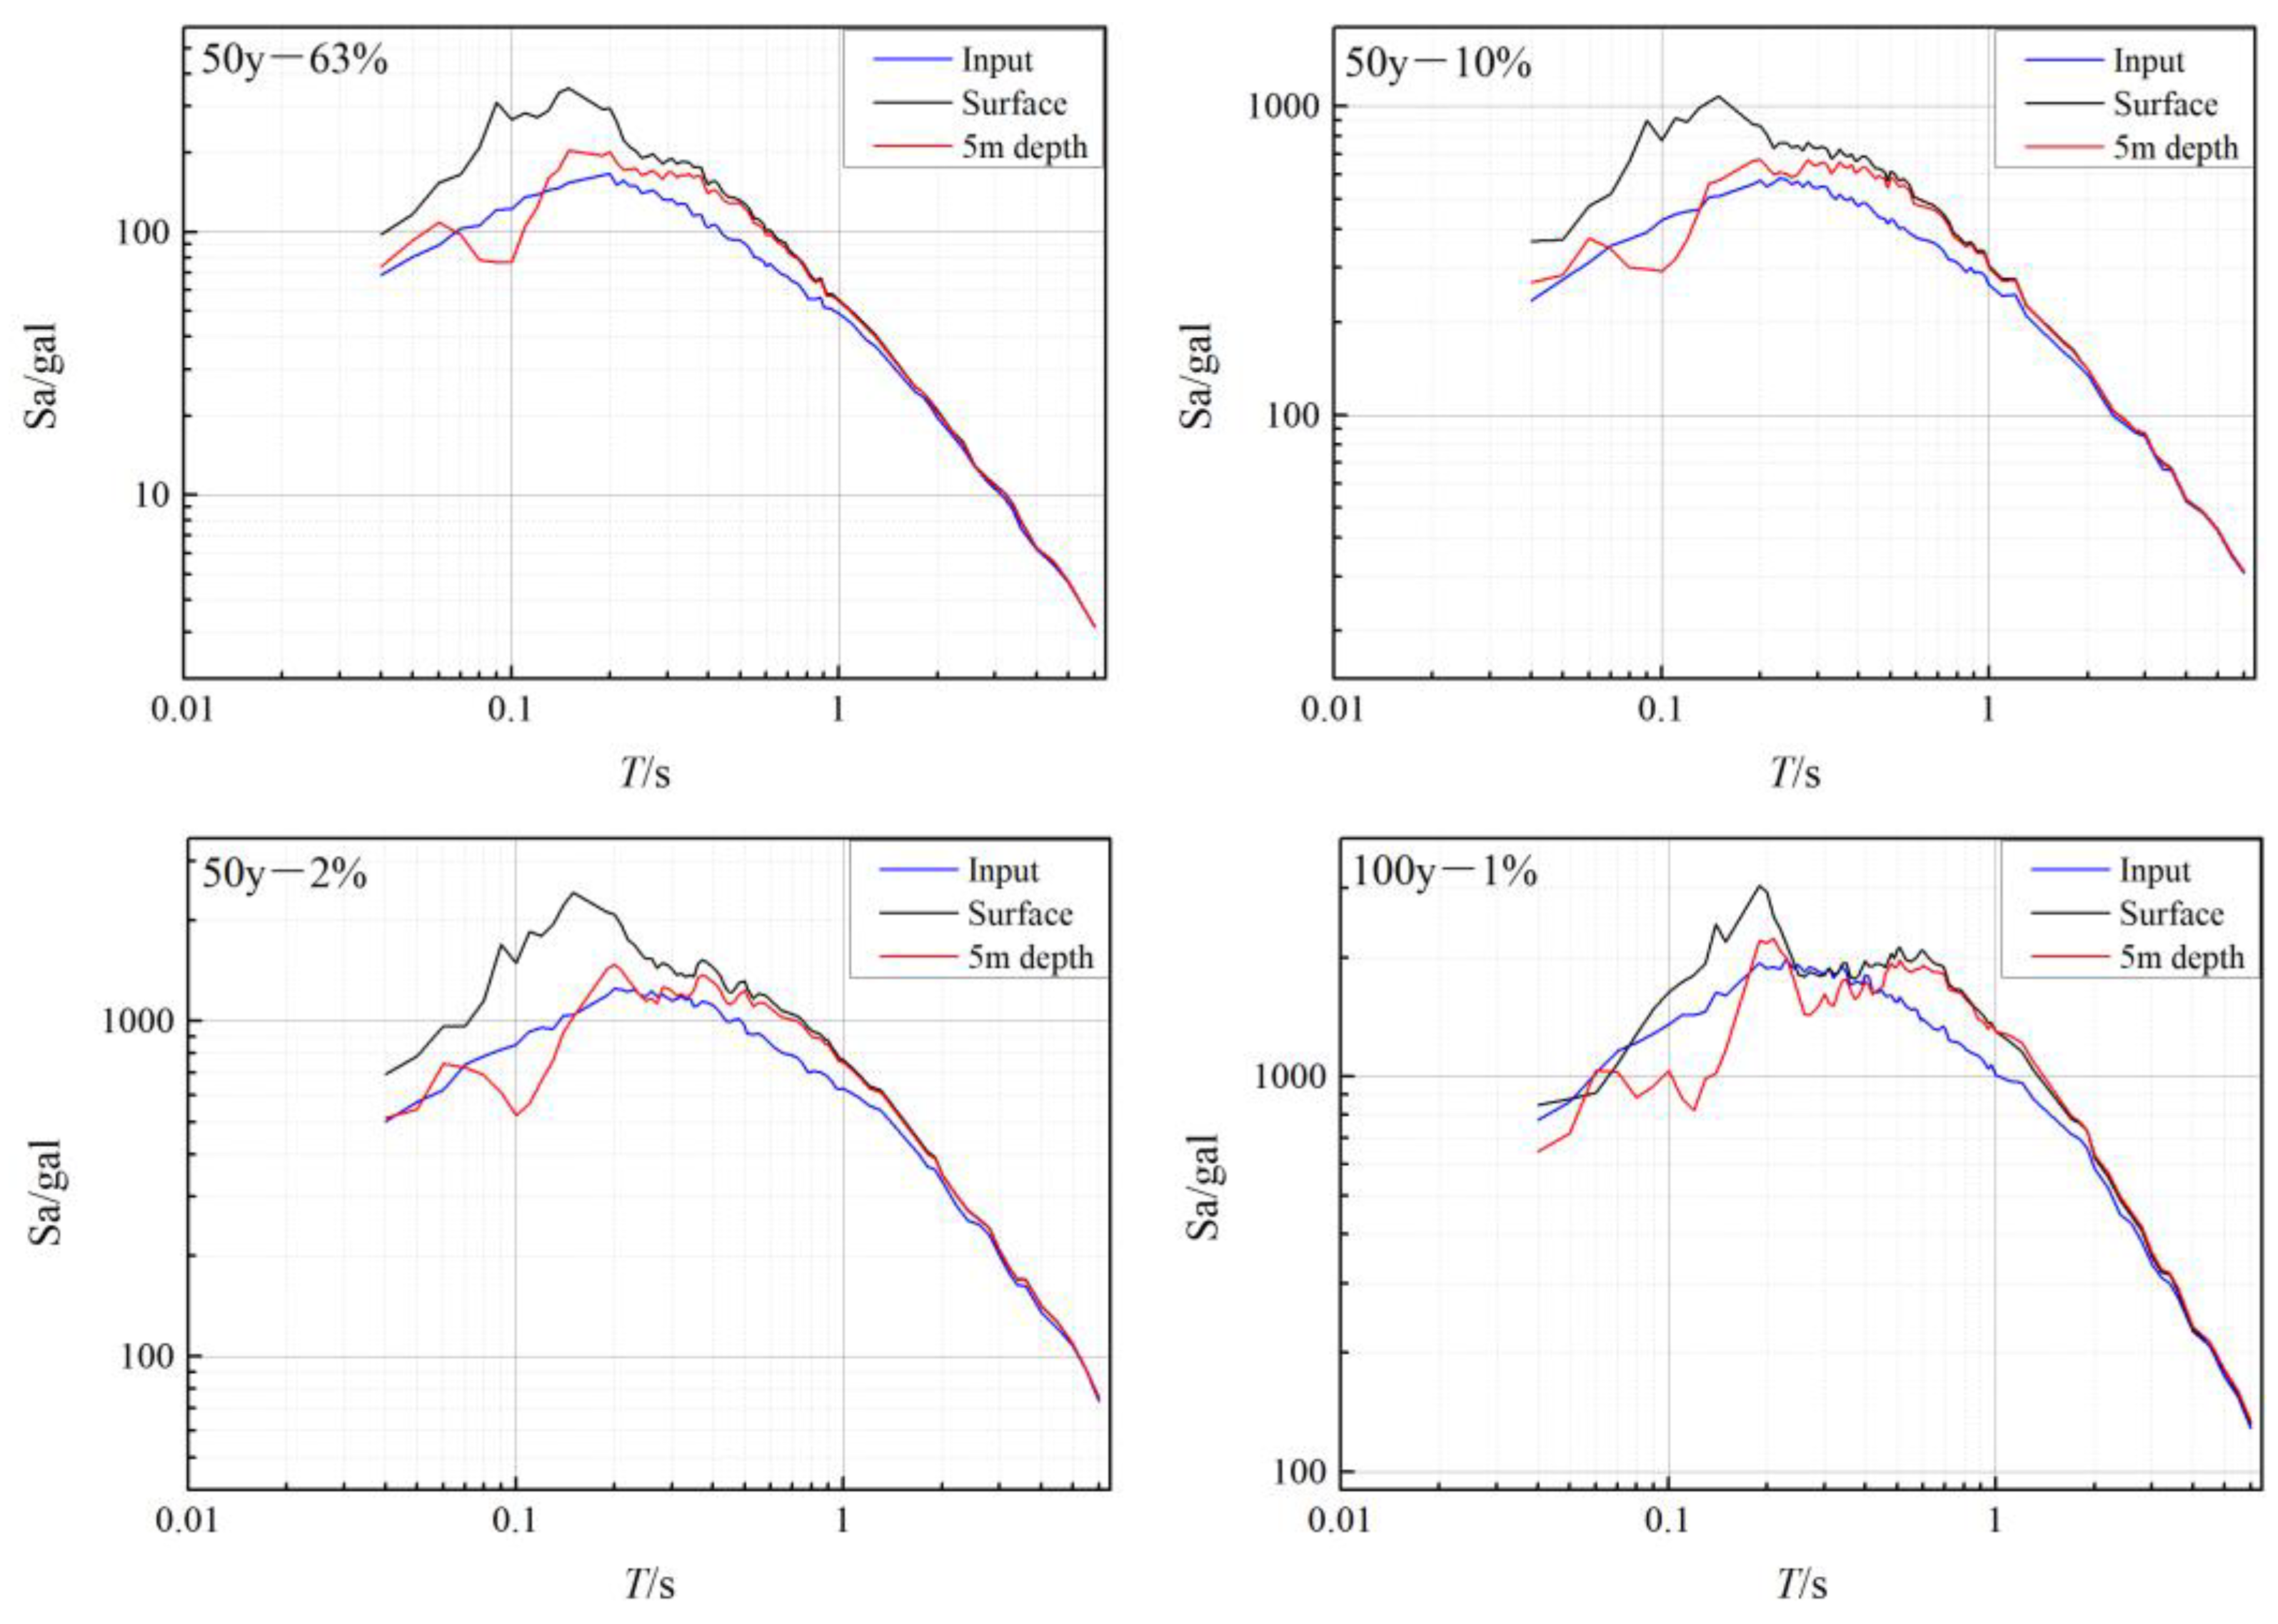
4.3. The Results of Comparison between the Pebble-Top Interface and Surface

According to the results of the two previous sections, the overlying silty clay in the Zhongwei Basin has a direct impact on the site PGA amplification coefficient. At the same time, to compare and study the seismic response characteristics between the pebble-top interface and the surface in the basin, this paper set the thickness of the pebble layer to 30 m and the thickness of the overlying silty clay layer to 5 m and established a one-dimensional calculation model of the typical soil layer in Zhongwei Basin, as shown in Table 5.
As shown in Table 6 and Figure 10, with the increase in the input intensity, the PGA amplification ratio of the pebble-top interface and the site surface showed a downward trend. The PGA amplification ratio of the pebble-top interface is significantly smaller than that of the site surface. Under different intensities of inputs, the PGA amplification ratio of the pebble-top interface was less than 1.1. Under the extremely rare earthquake, the PGA amplification ratio of the pebble-top interface was less than 1. With the increase in the input intensity, the characteristic periods of the pebble-top interface and the site surface show a significant upward trend. Under the same earthquake, the characteristic period of the pebble-top interface was larger than that of the site surface. When the input intensity was greater than the multi-event seismic action (50–63%), the characteristic period of the pebble-top interface was greater than GB 18306-2015. When the input intensity was less than the rare earthquake action (50–2%), the surface characteristic period of the site was less than GB 18306-2015.
According to GB 18306-2015, recommended by the response spectrum method for pebble-top calibration interface and the ground surface acceleration response spectrum, as shown in Figure 11, under different input intensities relative to the ground surface, the pebble-top interface of the calibration results showed the phenomenon of “low-rising value, wide platform”, showing obvious shock absorption and isolation.
As shown in Figure 12, under the same intensity of input, the amplitude of the acceleration response spectrum of the ground surface was generally higher than that of the pebble-top interface within 1 s, the amplitude difference was most obvious within 0.1–0.2 s, and the peak point of the acceleration response spectrum of the pebble-top interface lagged behind the surface of the site. Under different input intensities, the pebble bed top interface acceleration response spectrum showed a 0.1 s “trough” phenomenon, was significantly lower than the bedrock input response spectrum amplitude, and very rarely met the earthquake ground motion. The pebble bed top interface acceleration response spectrum curve showed a “bimodal phenomenon”; the second peak point was around 0.6 s; and within 0.24–0.4 s, the spectrum value was lower than the bedrock input. Based on the above summary, it can be concluded that the pebble-top interface has good damping and isolation effects.
By analyzing the Fourier spectrum curves of the site surface and the pebble-top interface, it can be seen (Figure 13) that there is an excellent frequency in the pebble-top interface, which decreases with the increase in the input intensity in the range of 1.1–2.2 Hz. Compared with the pebble-top interface, the site surface has two superior frequencies, and the second superior frequency occurs in the high-frequency range of 5–7 Hz, and the Fourier amplitude in the range of 5–7 Hz is significantly higher than that in the pebble-top interface. It can be concluded that, under the action of an earthquake, the energy of the pebble-top interface is concentrated in the low-frequency range of 1.1–2.2 Hz, and the amplification effect is obvious. In the range of 8–10 Hz, the amplitude is lower than that of the bedrock input, and the effect of reducing and isolating earthquakes is obvious. The site’s surface presents the phenomenon of double superior frequencies, the energy is concentrated in the high-frequency band, and the amplification effect is more significant.

5. Conclusions

This paper analyzes the seismic effect of pebble soil sites in the Zhongwei Basin. Based on the parametric analysis performed herein, the following conclusions can be drawn:
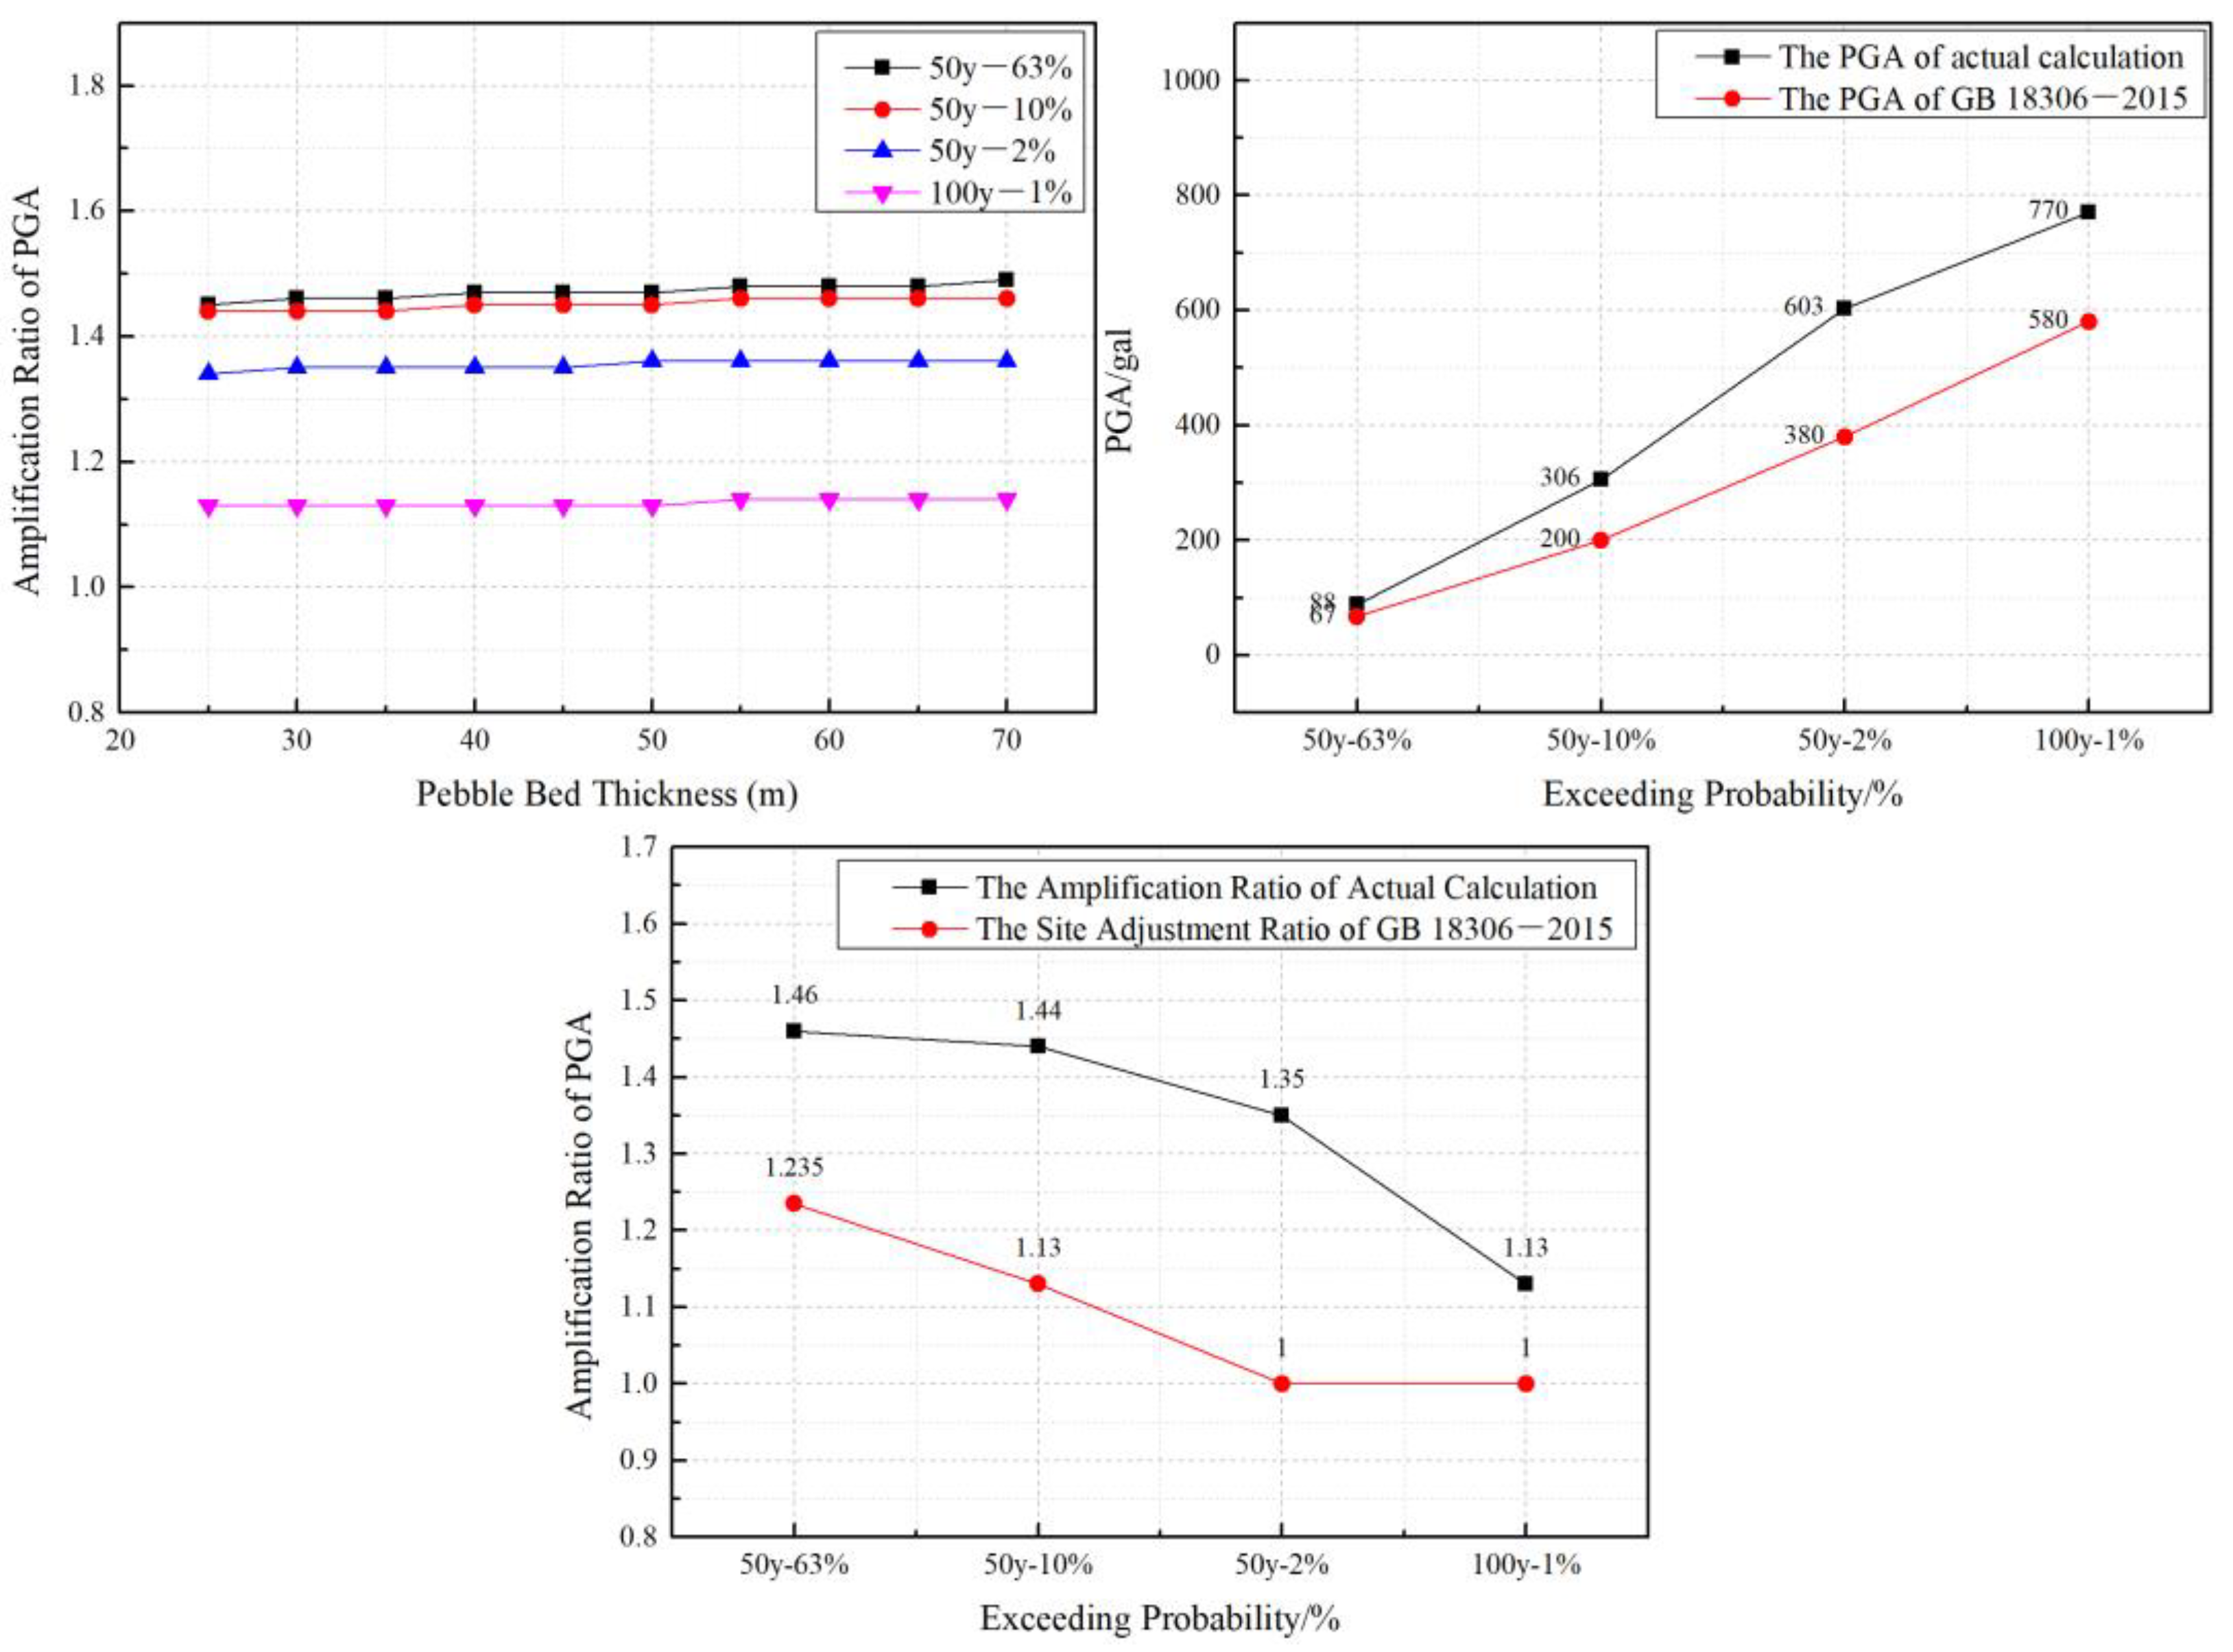
  • Under different inputs, the variation in the pebble layer thickness has no obvious influence on the site surface peak acceleration, and the site PGA amplification ratio under different inputs is also significantly higher than the site PGA adjustment ratio, corresponding to the specification (GB 18306-2015). The influence of the pebble layer thickness on the ground surface acceleration response spectrum is primarily shown at 0.2~0.6 s at high frequency, and with the increase in the input field vibration, the difference is within the scope of the response spectrum curve. In this range, the pebble layer thickness of 30 m in the ground acceleration response spectrum spectral values is significantly smaller, and the response spectrum curves show the “trough” form; therefore, this kind of site has a certain “weak isolation” function in the middle/high-frequency band of 0.2~0.6 s.
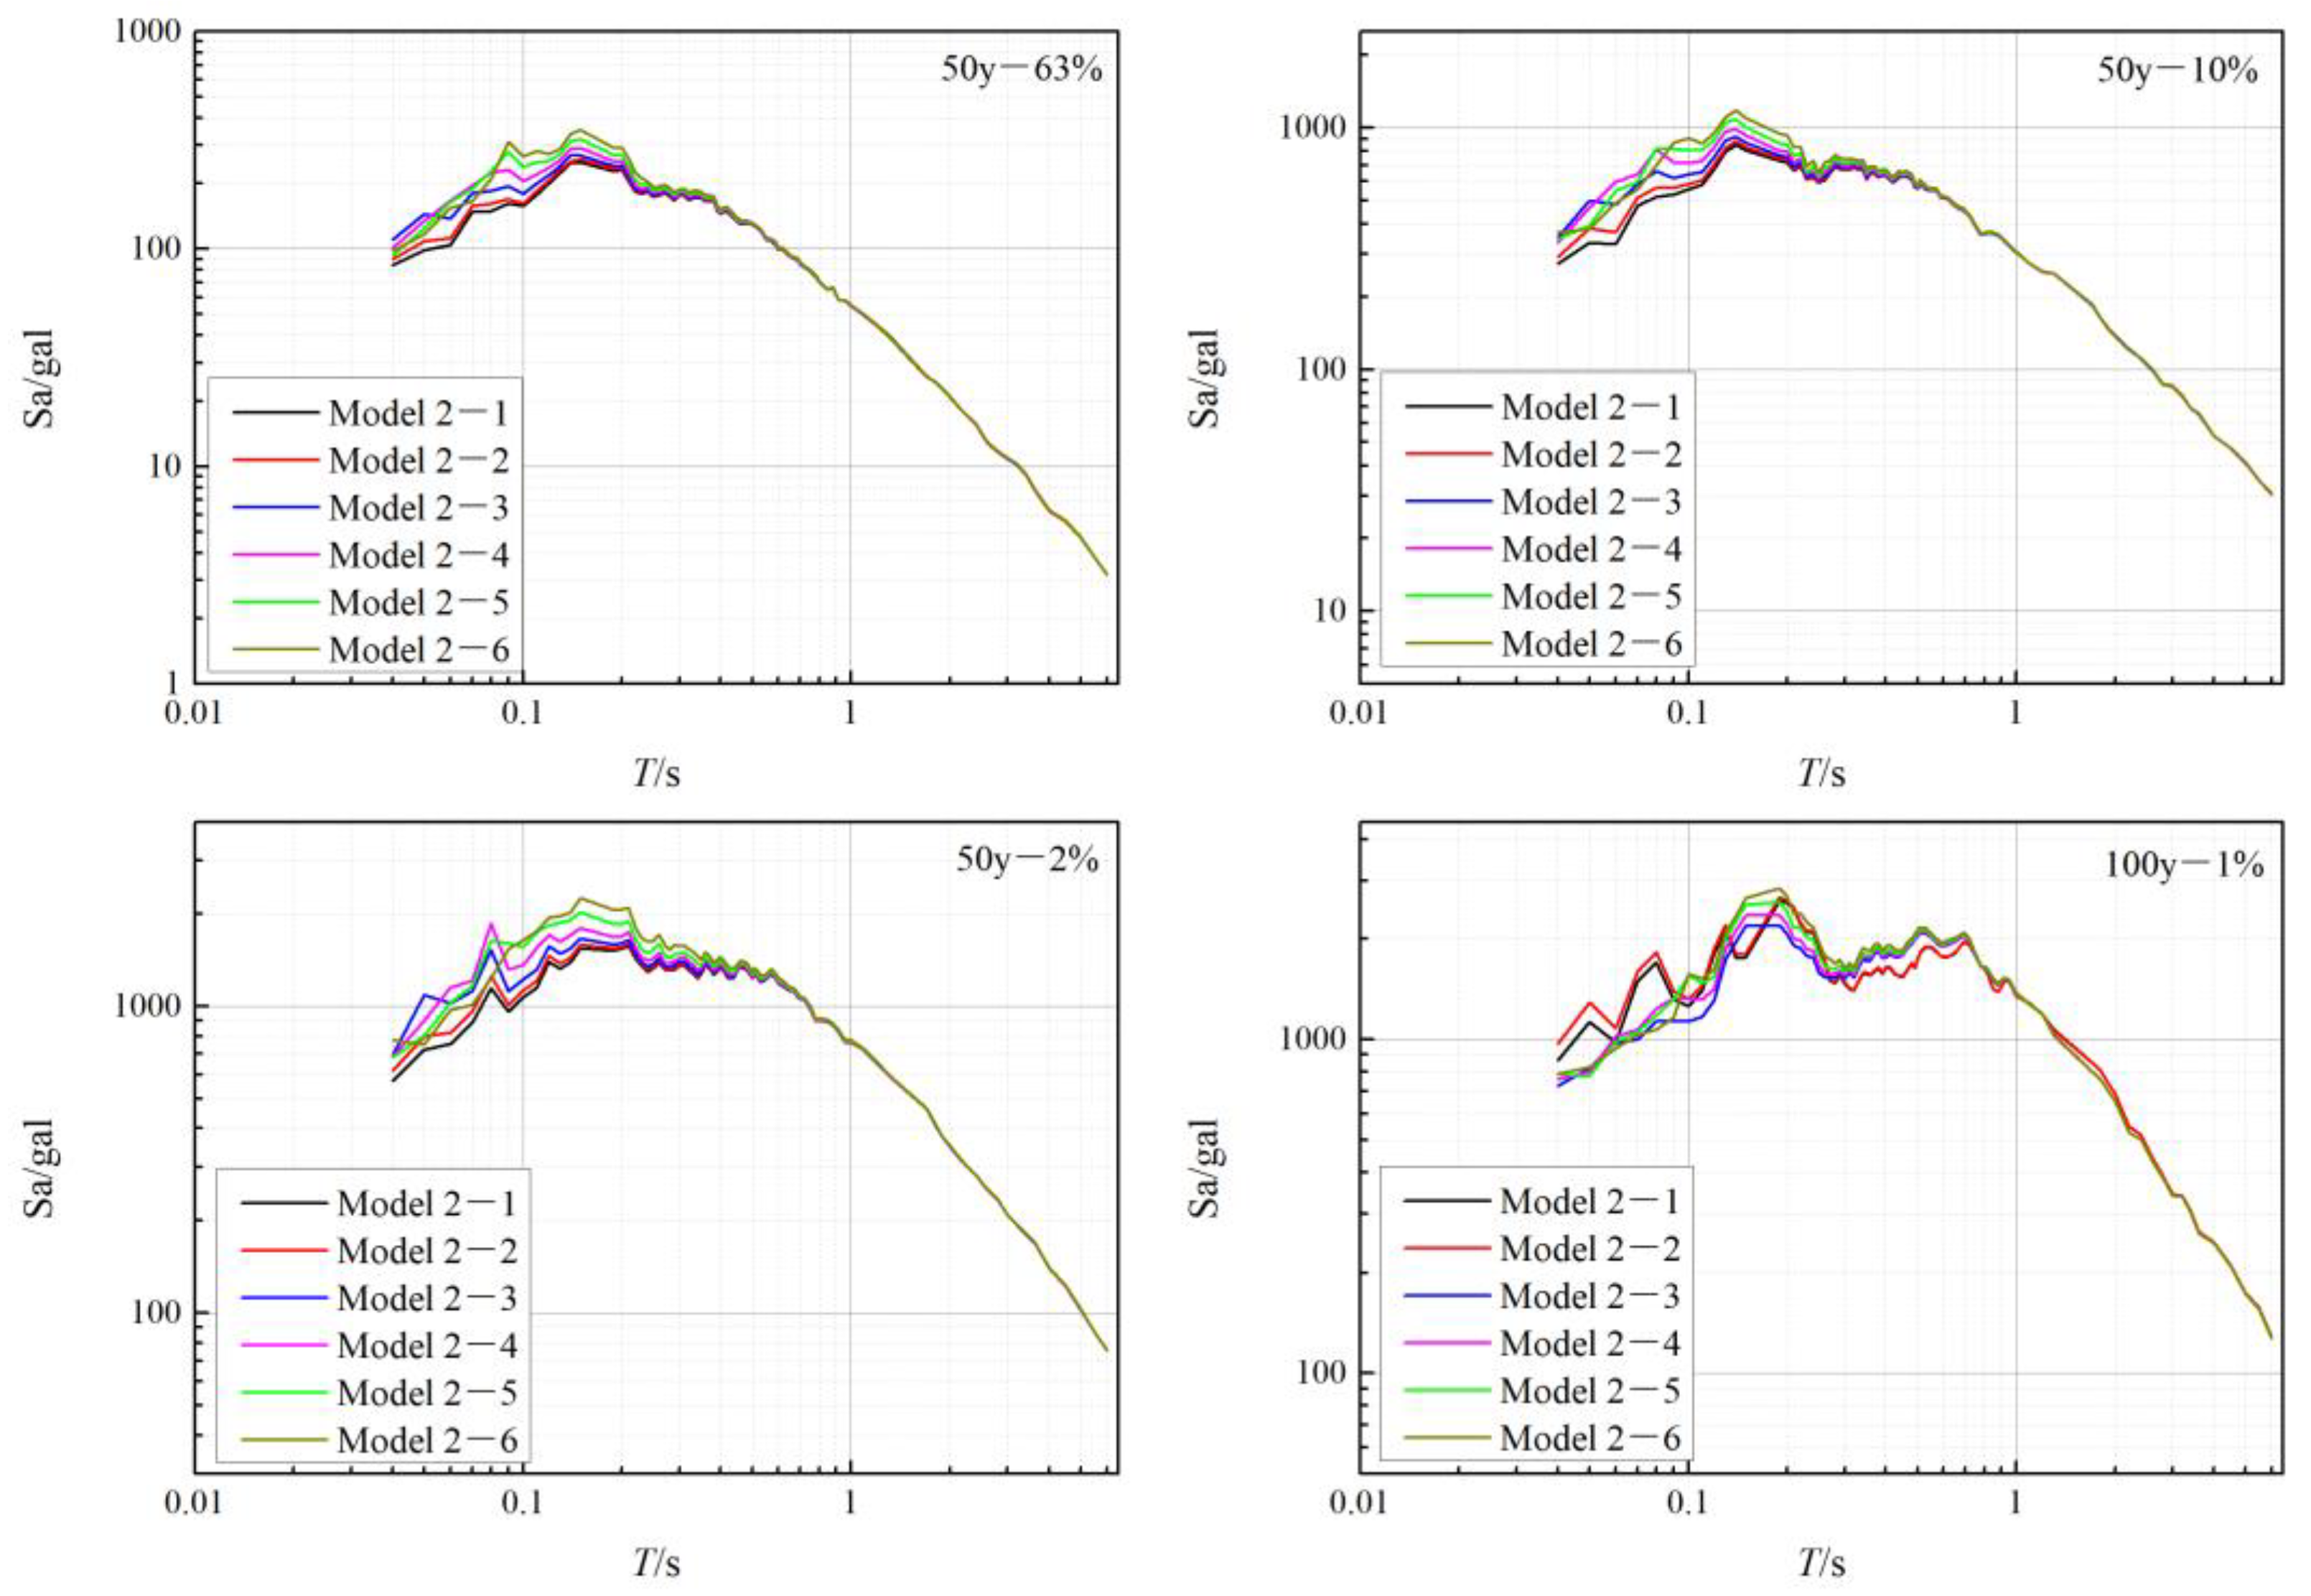
  • Under the same pebble layer thickness, the ground surface peak acceleration increases with the upper silty clay layer thickness, and the PGA amplification ratio decreases with the increase in the input ground motion. Under the extremely rare earthquake condition, the PGA amplification ratio of the site is significantly lower than that of the other seismic effects, which fully reflects the influence characteristics of the site nonlinearity on the ground motion. The pebble soil in the Zhongwei Basin has an obvious amplification effect on the short-period seismic waves, and the periodic peak points of the response spectrum are all within 0.1–0.2 s. Under extremely rare earthquakes, the response spectrum curve shows an obvious “double peak phenomenon”, and the second peak point appears within 0.5–0.7 s periodic points.
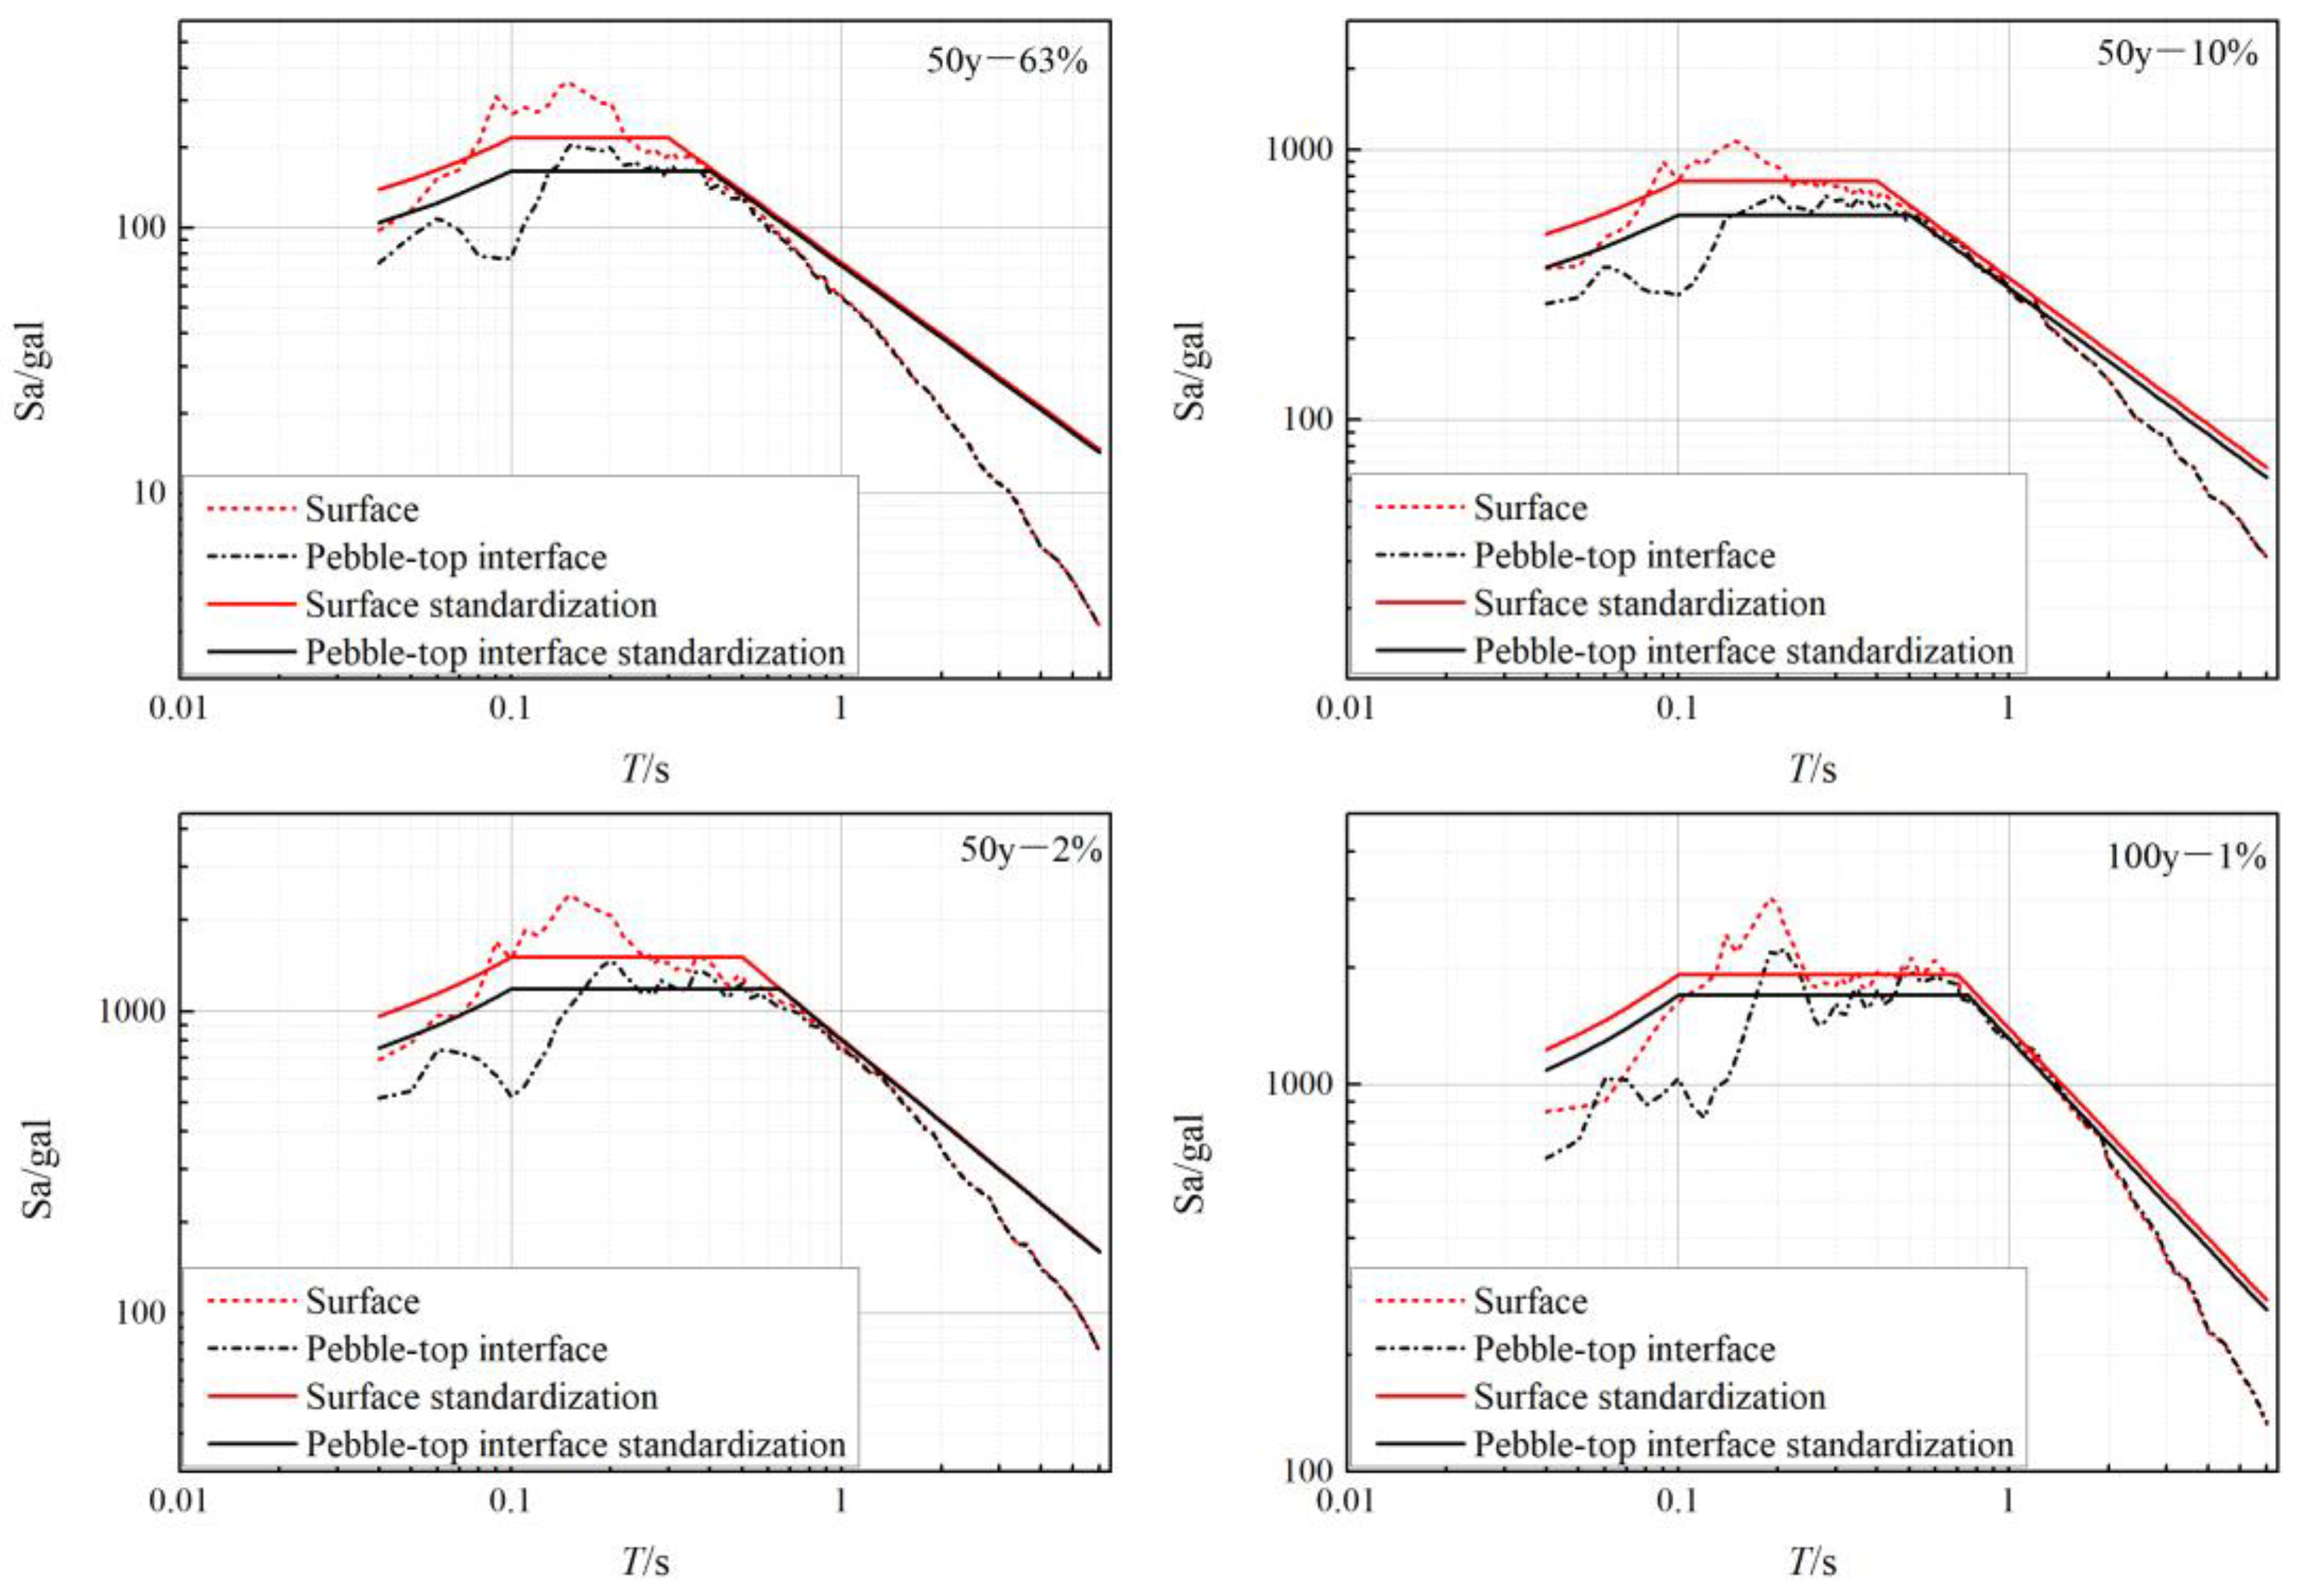
  • With the increase in the input intensity, the PGA amplification ratio of the pebble-top interface is significantly smaller than that of the site surface. Under the extremely rare earthquake, the PGA amplification ratio of the pebble-top interface is less than one. Under the same earthquake action, the characteristic period of the pebble-top interface is significantly larger than that of the site surface. When the input intensity is greater than the multiple earthquake action (50–63%), the characteristic period of the pebble-top interface is greater than GB 18306-2015. Under different intensity inputs, compared with the site surface, the calibration results of the pebble-top interface show the phenomenon of “low amplitude and wide platform”, showing obvious shock absorption and isolation. Under different intensities of input, the acceleration response spectrum of the pebble-top interface shows a “trough” phenomenon at approximately 0.1 s, and the amplitude of the response spectrum is significantly lower than that of the bedrock input. Under the action of extremely rare ground motion, the acceleration response spectrum curve of the pebble-top interface shows a “double peak phenomenon”, and within 0.24–0.4 s, the spectrum value is lower than the bedrock input. It can be concluded that the pebble-top interface has good damping and isolation effects.
  • Under the action of an earthquake, the energy of the pebble-top interface is concentrated in the low-frequency range of 1.1–2.2 Hz, and the amplification effect is obvious. In the range of 8–10 Hz, the amplitude is lower than that of the bedrock input, and the effect of reducing and isolating earthquakes is obvious. The site’s surface presents the phenomenon of double superior frequencies, the energy is more concentrated in the high-frequency band, and the amplification effect is more significant.
In future work, we believe that the following studies should be carried out for the seismic effects in the Zhongwei Basin. Firstly, the seismic effect of the Zhongwei Basin under the set earthquake should be studied. Secondly, it is necessary to carry out 2D or 3D numerical analysis to calculate the seismic effect of the Zhongwei Basin. Thirdly, it is in line with the current trend to carry out a seismic ground response prediction based on neural network and machine learning [25]. Moreover, another related study examined the effects of deep soil sites atop deep geological sediments but only focused on vertical motion, and the results showed a spectral peak at 0.3 s [26]. In the future, research should be conducted on pebble layers’ effects on vertical motion.

Author Contributions

Conceptualization, S.Y. and X.H.; methodology, S.Y.; software, S.Y.; validation, X.H., S.Y. and Q.L.; formal analysis, S.Y.; investigation, C.L.; resources, P.D.; data curation, Z.L.; writing—original draft preparation, S.Y.; writing—review and editing, S.Y.; visualization, S.Y.; supervision, P.D.; project administration, S.Y.; funding acquisition, Q.L. All authors have read and agreed to the published version of the manuscript.

Funding

This study was supported by the “Active fault detection and seismic risk assessment project in Shapotou District, Zhongwei City”; the Ningxia Natural Science Foundation Project, no. 2022AAC03688; and the Science and Technology Innovation Team of Ningxia Seismological Administration, no. CX2019-1. Ningxia Earthquake Research Foundation project, no. 2023.

Institutional Review Board Statement

Not applicable.

Informed Consent Statement

Not applicable.

Data Availability Statement

Not applicable.

Conflicts of Interest

The authors declare no conflict of interest.

References

  1. Bo, J.S.; Li, X.L.; Li, S.Y. Some progress of study on the effect of site conditions on ground motion. World Inf. Earthq. Eng. 2003, 19, 11–15. (In Chinese) [Google Scholar]
  2. Bo, J.S.; Lig, X.L.; Liu, D.D. Effect of soil layer construction on characteristic period of response spectrum. Earthq. Eng. Eng. Vib. 2003, 23, 42–45. (In Chinese) [Google Scholar]
  3. Chen, G.X.; Chen, J.H. The effect of depth and thickness of soft soil layer on earthquake response for deep soft site. World Inf. Earthq. Eng. 2004, 20, 66–73. (In Chinese) [Google Scholar]
  4. Zhou, Z.H.; Li, Y.P.; Zhou, Y.; Li, X.J.; Chen, L.; Su, J.; Dong, Q.; Wang, Y.F. The effect of hard interlayer thickness on the site seismic response. Seismol. Geol. 2019, 41, 1244–1265. (In Chinese) [Google Scholar]
  5. Gao, F.; Chen, X.C.; Yan, S.H. Influence of permafrost and seasonally frozen soil on seismic responses of sites. Chin. J. Rock Mech. Eng. 2006, 25, 1639–1644. (In Chinese) [Google Scholar]
  6. Gao, F.; Yan, S.H.; Chen, X.C. Analyses on seismic responses of ground. Chin. J. Rock Mech. Eng. 2003, 22, 2789–2793. (In Chinese) [Google Scholar]
  7. Hu, W.K.; Chen, Q.J. Response characteristic analysis of soil site with deep deposit under different bedrock seismic wave. Struct. Eng. 2010, 26, 85–90. (In Chinese) [Google Scholar]
  8. Jin, D.D.; Chen, G.X.; Dong, F.F. Effects of soft interlayer on ground surface seismic response of Fuzhou Basi. J. Wuhan Univ. Technol. 2012, 34, 83–88. (In Chinese) [Google Scholar]
  9. Li, H.; Zhang, J.B.; Wu, J.C. Effects of soft and hard interlayers on ground motion characteristic. J. Earthq. Eng. 2014, 36, 441–445. (In Chinese) [Google Scholar]
  10. Wang, G.X.; Huang, K.P. Effects of surface soil on ground motion characters. Earthq. Eng. Eng. Vib. 2013, 33, 33–40. (In Chinese) [Google Scholar] [CrossRef]
  11. Wang, H.W.; Feng, Z.J.; Liu, X.Q.; Chen, S.J. Quantitative Analysis of Ground Motion Peak Acceleration Field Effect in Shandong Province. Seismol. Geol. 2015, 37, 44–52. (In Chinese) [Google Scholar]
  12. Yan, K.M.; Liu, F.C.; Zhu, C.H.; Wang, Z.J.; Zhang, J.J. Study on dynamic response characteristics of slope field with inclined soft interlayer under seismic action. Chin. J. Rock Soil Mech. Eng. 2017, 36, 2686–2698. (In Chinese) [Google Scholar]
  13. Su, J.; Zhou, Z.; Zhou, Y.; Li, X.; Dong, Q.; Wang, Y.; Li, Y.; Chen, L. The Characteristics of Seismic Response on Hard Interlayer Sites. Adv. Civ. Eng. 2020, 2020, 1425969. [Google Scholar] [CrossRef]
  14. Jeong, S.; Asimaki, D.; Dafni, J.; Wartman, J. How topography-dependent are topographic effffects? complementary numerical modeling of centrifuge experiments. Soil Dyn. Earthq. Eng. 2019, 116, 654–667. [Google Scholar] [CrossRef]
  15. Akin, M.K.; Kramer, S.L.; Topal, T. Dynamic soil characterization and site response estimation for Erbaa, Tokat (Turkey). Nat. Hazards 2016, 82, 1833–1868. [Google Scholar] [CrossRef]
  16. Lessi-Cheimariou, A.; Tromans, I.J.; Rathje, E.; Robertson, C. Sensitivity of surface hazard to difffferent factors and site response analysis approaches: A case study for a soft rock site. Bull. Earthq. Eng. 2019, 17, 73–96. [Google Scholar] [CrossRef]
  17. Badaoui, M.; Berrah, M.K.; Mebarki, A. Soil height randomness inflfluence on seismic response: Case of an algiers site. Comput. Geotech. 2009, 36, 102–112. [Google Scholar] [CrossRef]
  18. Glinsky, N.; Bertrand, E.; Régnier, J. Numerical simulation of topographical and geological site effffects. Applications to canonical topographies and rognes hill, South East France. Soil Dyn. Earthq. Eng. 2019, 116, 620–636. [Google Scholar] [CrossRef]
  19. Idriss, I.M.; Seed, H.B. Seismic response of horizontal soil layers. J. Soil Mech. Found. Div. 1968, 94, 1003–1031. [Google Scholar] [CrossRef]
  20. Sanchez-Sesma, F.J. Site effffects on strong ground motion. Soil Dyn. Earthq. Eng. 1987, 6, 124–132. [Google Scholar] [CrossRef]
  21. Liu, C.; Lei, Q.; Du, P.; Wu, Z.; Li, Z.; Yu, S.; Yang, S.; Wang, Y. Activity Characteristic of the Two Buried Faults in Zhongwei Basin along the Northeastern Margins of Tibetan Plateau, China, by Means of Shallow Seismic and Composite Drilling Section Exploration. Appl. Sci. 2022, 12, 12074. [Google Scholar] [CrossRef]
  22. Chen, X.L.; Jin, X.; Tao, X.X.; Kang, L.C. Analysis and evaluation of one-dimensional nonlinear dynamic constitutive relationship of soil mass. Earthq. Eng. Eng. Vib. 2006, 6, 147–157. (In Chinese) [Google Scholar]
  23. Yan, J.; Zhang, J. One dimensional time-domain nonlinear site seismic response analysis program integrating two hysteresis models of soil. Front. Earth Sci. 2022, 10, 2454. [Google Scholar] [CrossRef]
  24. Bulajić, B.Đ.; Hadzima-Nyarko, M.; Pavić, G. Horizontal UHS amplitudes for regions with deep soil atop deep geological sediments—An example of Osijek, Croatia. Appl. Sci. 2021, 11, 6296. [Google Scholar] [CrossRef]
  25. Yoo, J.; Hong, S.; Ahn, J. Seismic Ground Response Prediction Based on Multilayer Perceptron. Appl. Sci. 2021, 11, 2088. [Google Scholar] [CrossRef]
  26. Bulajić, B.Đ.; Hadzima-Nyarko, M.; Pavić, G. Vertical to horizontal UHS ratios for low to medium seismicity regions with deep soil atop deep geological sediments—An example of the city of Osijek, Croatia. Appl. Sci. 2021, 11, 6782. [Google Scholar] [CrossRef]
Figure 1. Seismic and tectonic background map of Zhongwei Basin.
Applsci 13 00243 g001
Figure 2. Fieldwork in drilling and high-density electrical prospecting.
Applsci 13 00243 g002
Figure 3. Ground motions under different probabilities.
Applsci 13 00243 g003
Figure 4. The wave velocity test results of typical drilling holes.
Applsci 13 00243 g004
Figure 5. Amplification ratios of ground motion for the different thicknesses of pebble layer under four seismic inputs.
Applsci 13 00243 g005
Figure 6. Spectral accelerations for the different thicknesses of pebble layer under four seismic inputs.
Applsci 13 00243 g006
Figure 7. The shear strain under four seismic inputs.
Applsci 13 00243 g007
Figure 8. Amplification ratios of ground motion for the different thicknesses of silty clay layer under four seismic inputs.
Applsci 13 00243 g008
Figure 9. Spectral accelerations for the different thicknesses of silty clay layer under four seismic inputs.
Applsci 13 00243 g009
Figure 10. Amplification ratios of ground motion between pebble-top interface and ground surface under four seismic inputs.
Applsci 13 00243 g010
Figure 11. Accelerations spectra and standardization spectra of pebble-top interface and ground surface under four seismic inputs.
Applsci 13 00243 g011
Figure 12. Comparison map of acceleration spectrum of pebble-top interface, site surface, and acceleration response spectrum of bedrock.
Applsci 13 00243 g012
Figure 13. The Fourier spectrum between pebble-top interface and ground surface under four seismic inputs.
Applsci 13 00243 g013
Table 1. Models and soil mechanical parameters.
ModelSoil NameLayer Depth/mSoil Thickness/m V s ¯ / m s 1 ρ / t m 3 Soil Type Number
Model 1–1Silty clay551951.901
Pebble1052802.052
Pebble25103602.103
Pebble30104502.154
Sticky sand45154002.205
Sticky sand60156002.225
Sticky sand75157002.305
Model 1–2Silty clay551951.901
Pebble1052802.052
Pebble25103602.103
Pebble35154802.154
Sticky sand50154402.205
Sticky sand65156102.225
Sticky sand75107002.305
Model 1–3Silty clay551951.901
Pebble1052802.052
Pebble20103602.103
Pebble40205002.184
Sticky sand55154202.205
Sticky sand65106102.225
Sticky sand75107002.305
Model 1–4Silty clay551951.901
Pebble1052802.052
Pebble20103602.103
Pebble30104802.154
Pebble45155202.184
Sticky sand60154502.225
Sticky sand70106402.305
Sticky sand7557002.305
Model
1–5
Silty clay551951.901
Pebble1052802.052
Pebble20103602.103
Pebble35154802.154
Pebble50155602.204
Sticky sand60104802.205
Sticky sand70106602.225
Sticky sand7557002.305
Model 1–6Silty clay551951.901
Pebble1052802.052
Pebble20103602.103
Pebble35154802.154
Pebble50105602.184
Pebble55106002.204
Sticky sand65105602.305
Sticky sand75107002.305
Model 1–7Silty clay551951.901
Pebble1052802.052
Pebble20103602.103
Pebble35154802.154
Pebble50105602.184
Pebble60156302.204
Sticky sand75157002.305
Model 1–8Silty clay551951.901
Pebble1052802.052
Pebble20103602.103
Pebble35154802.154
Pebble50105602.184
Pebble60106302.204
Pebble65106302.224
Sticky sand75107002.305
Model 1–9Silty clay551951.901
Pebble1052802.052
Pebble20103602.103
Pebble35154802.154
Pebble50105602.184
Pebble60106302.204
Pebble70156802.224
Sticky sand7557002.305
Model 1–10Silty clay551951.901
Pebble1052802.052
Pebble20103602.103
Pebble35154802.154
Pebble50105602.184
Pebble60106302.204
Pebble70106802.244
Pebble75107002.304
Table 2. Dynamic nonlinear parameters for different soil types.
Soil Type NumberSoil NameParameterγd (10−4)
0.050.10.5151050100
1Silty clayGd/Gdmax0.99490.98990.95140.90720.66170.49440.16360.0891
λ0.00420.00680.02130.03390.08650.11560.16640.177
2Slightly
dense pebbled
Gd/Gdmax0.99310.98660.94590.90170.71010.56330.24050.1299
λ0.01180.01630.03390.04780.08610.1090.15520.1697
3Medium
dense pebbled
Gd/Gdmax0.99520.98890.96240.93260.81910.70410.39870.2456
λ0.02060.02520.04030.05040.08310.10060.13460.1478
4Tightly
dense pebbled
Gd/Gdmax0.99880.99240.97510.9510.86620.78710.51270.3461
λ0.01150.01420.02540.03360.06210.08050.1170.1328
5Sticky sandGd/Gdmax0.99190.98390.92460.85970.55080.380.10920.0578
λ0.00890.01260.02750.03760.06790.07990.0960.0987
Table 3. Models and soil mechanical parameters.
ModelSoil NameLayer Depth/mSoil Thickness/m V s ¯ / m s 1 ρ / t m 3 Soil Type Number
Model 2–1Silty clay0000
Pebble552502.052
Pebble15103602.103
Pebble30154502.154
Sticky sand50154002.205
Sticky sand65155802.225
Sticky sand75157002.305
Model 2–2Silty clay111851.901
Pebble652802.052
Pebble16103602.103
Pebble31154802.154
Sticky sand50154102.205
Sticky sand65155902.225
Sticky sand75147002.305
Model 2–3Silty clay221881.901
Pebble752802.052
Pebble17103602.103
Pebble32154802.154
Sticky sand50154202.205
Sticky sand65156002.225
Sticky sand75137002.305
Model 2–4Silty clay331901.901
Pebble852802.052
Pebble18103602.103
Pebble33154802.154
Sticky sand50154302.205
Sticky sand65156102.225
Sticky sand75127002.305
Model
2–5
Silty clay441931.901
Pebble952802.052
Pebble19103602.103
Pebble34154802.154
Sticky sand50154402.205
Sticky sand65156202.225
Sticky sand75117002.305
Model 2–6Silty clay551851.901
Pebble1052802.052
Pebble20103602.103
Pebble35154802.154
Sticky sand50154502.205
Sticky sand65156302.225
Sticky sand75107002.305
Table 4. The PGA of site surface under different silty clay layer thicknesses.
PGA of Site Surface (Gal)
50 y—63%50 y—10%50 y—2%100 y—1%
Model 2–173.2258.0534.4693.0
Model 2–274.8263.6551.0694.6
Model 2–377.0270.8568.2705.2
Model 2–480.0277.6571.0721.8
Model 2–583.0295.8582.4751.6
Model 2–687.6306.0603.2769.6
Table 5. Typical soil models and soil mechanical parameters.
ModelSoil NameLayer Depth/mSoil Thickness/m V s ¯ / m s 1 ρ / t m 3 Soil Type Number
Typical Soil
Model
Silty clay551851.901
Pebble1052802.052
Pebble20103602.103
Pebble35154802.154
Sticky sand50154502.205
Sticky sand65156302.225
Sticky sand75107002.305
Table 6. Comparison table of amplification ratio of PGA between pebble-top interface and ground surface.
Exceeding ProbabilityBedrock Input/GalPebble-Top InterfaceSurface
PGA/GalAmplification Ratio of PGAPGA/GalAmplification Ratio of PGA
50–63%6065.41.0987.61.46
50–10%2132301.083061.44
50–2%448473.21.06603.21.35
100–1%681602.20.88769.61.13
Disclaimer/Publisher’s Note: The statements, opinions and data contained in all publications are solely those of the individual author(s) and contributor(s) and not of MDPI and/or the editor(s). MDPI and/or the editor(s) disclaim responsibility for any injury to people or property resulting from any ideas, methods, instructions or products referred to in the content.

