1. Introduction
Decision makers of organizations will encounter various integration problems during decision-making and troubleshooting processes [
1] owing to the limitation in the development of a complex manufacturing system. Enterprises and firms should define relative frameworks to address the challenges of information imbalance and cognition bias posed by the evolution of internet of things (IoT) techniques and telecommunication technology. Several enterprise systems, such as product lifecycle management, manufacturing execution system (MES) and enterprise resource planning systems [
2,
3], assist firms in achieving Industry 4.0 criteria by tackling integration issues. However, customers prefer specific customized functions rather than generalized functions to tackle the integration issues [
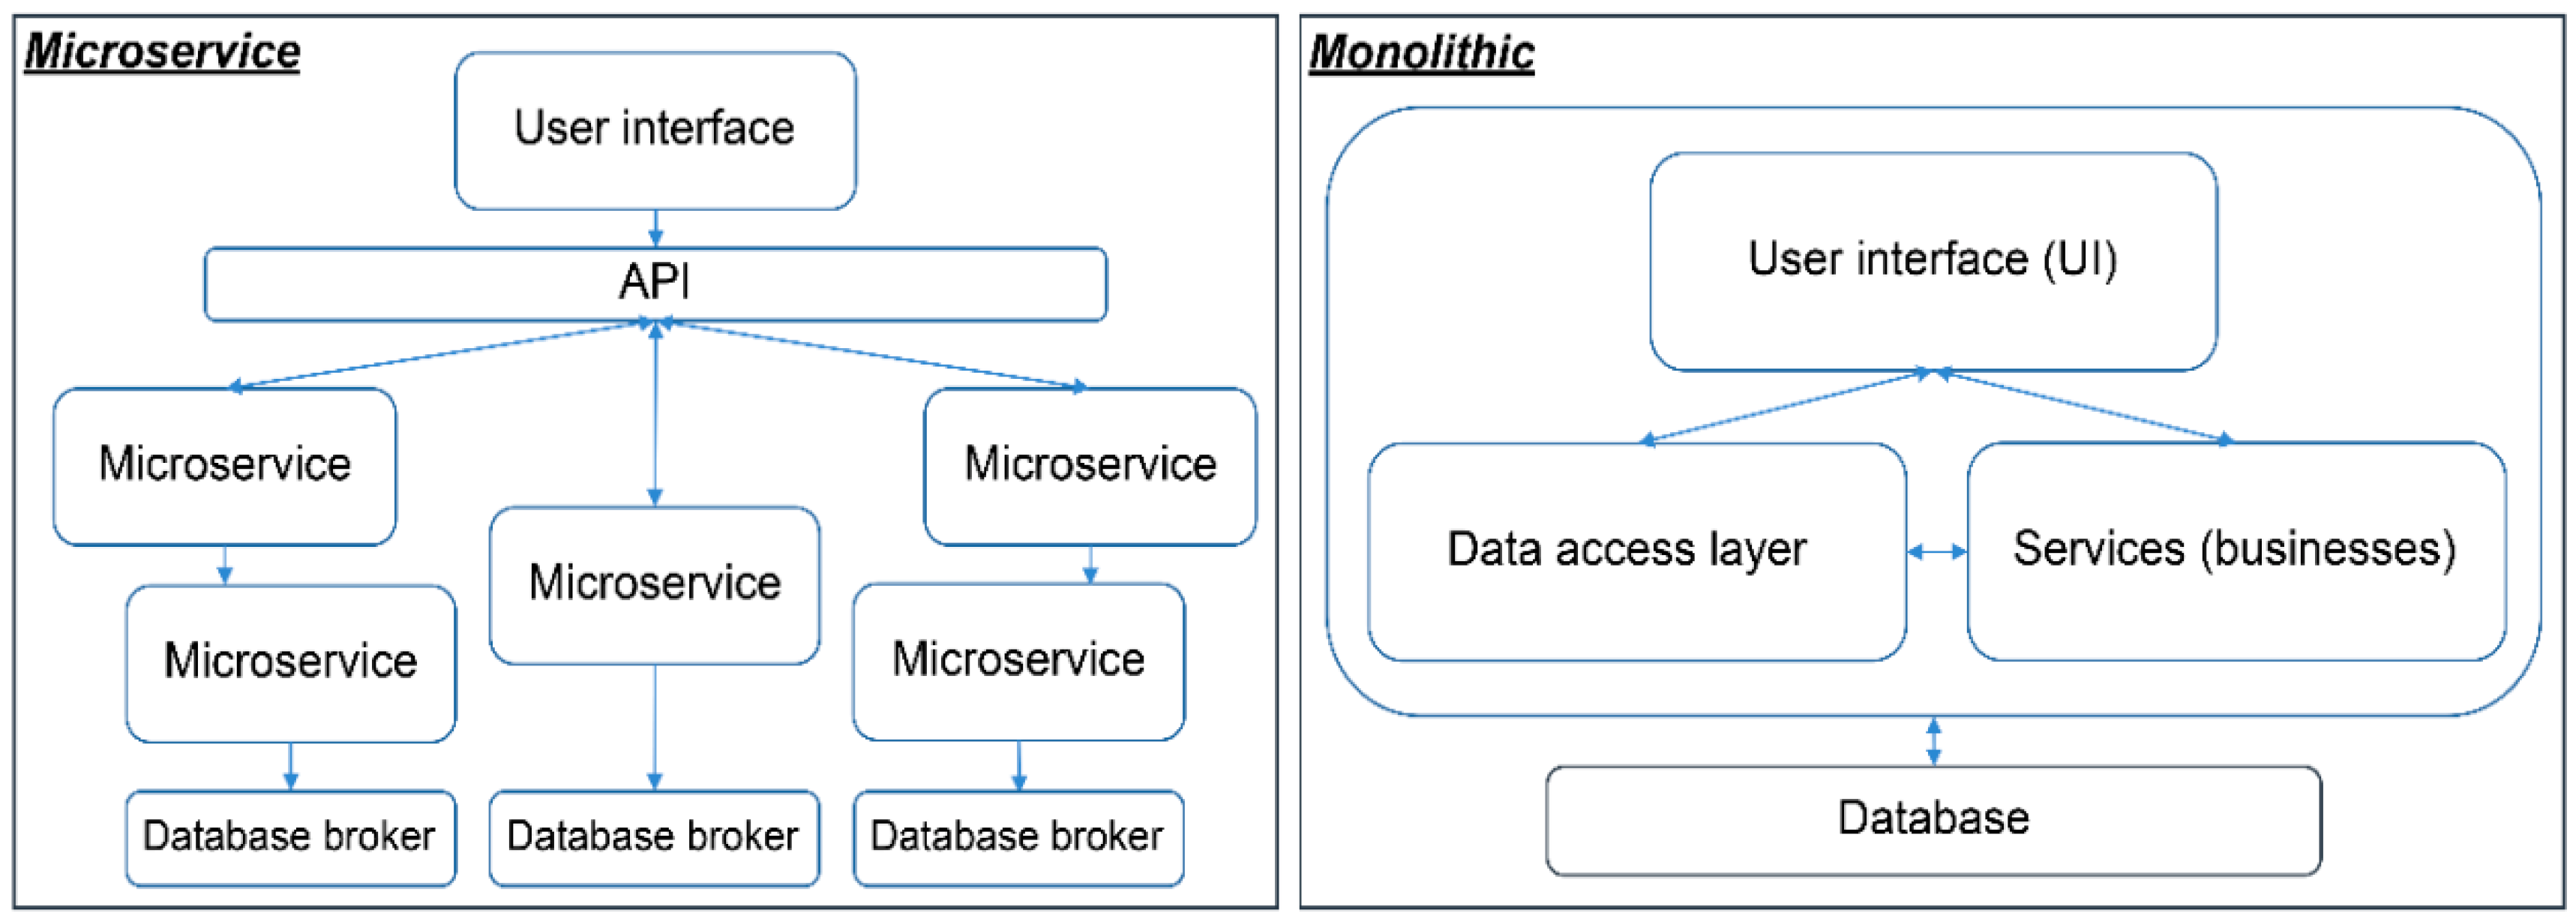
4]. Most of the firms collect research and development (R&D) information or relevant business development datasets to analyze the requirements of customers to reduce rework costs associated with transferring various systems to the final phase. In contrast to the monolithic system, an application-specific microservice architecture can assist firms in expanding their services and defining new value propositions [
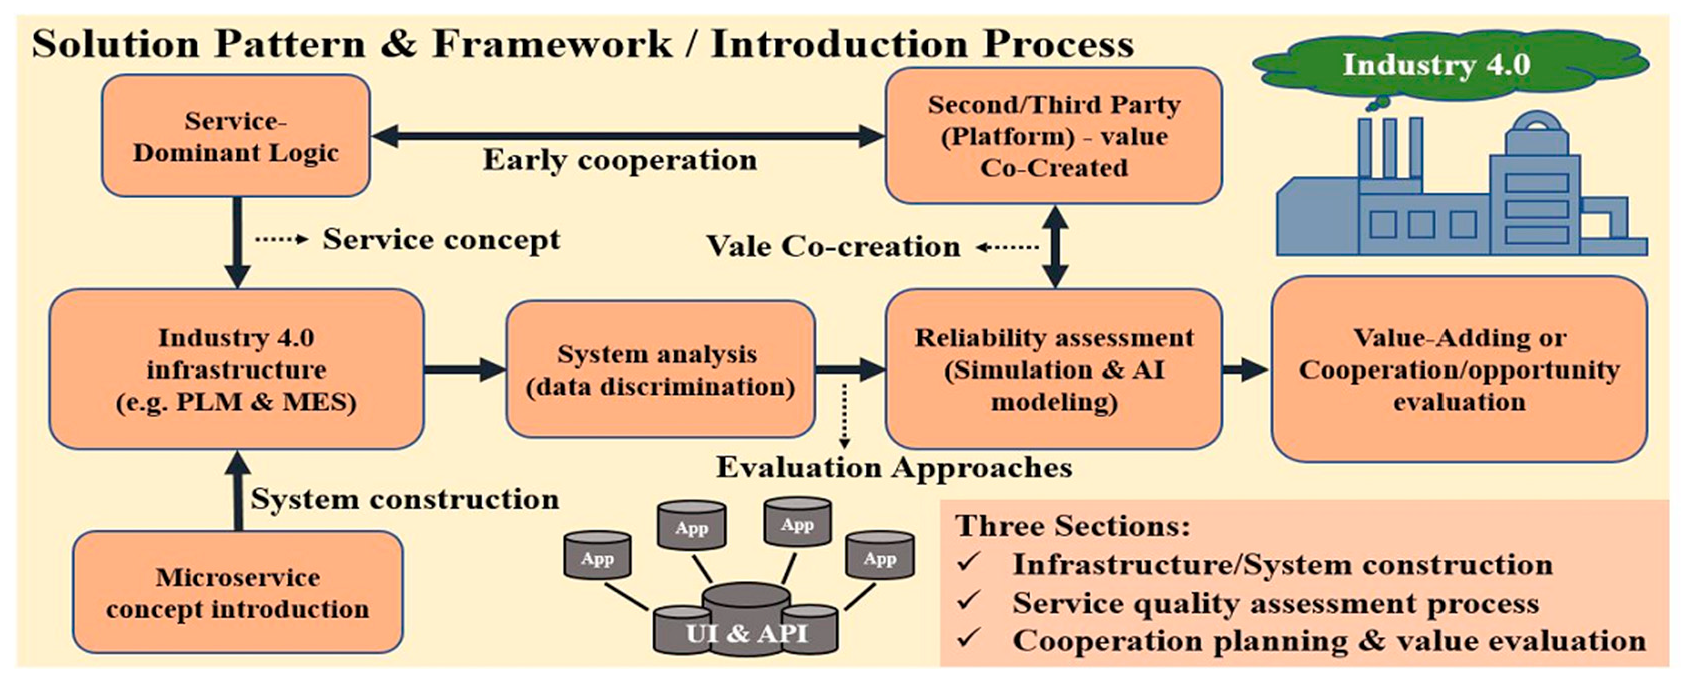
5]. In this study, the service was modularized into several microservices with an integrated application programing interface (API) after adopting a microservice architecture. Furthermore, service providers can split or combine different applications based on the requirements of their customers (
Figure 1). However, the storage cost, which is difficult to estimate, can be calculated by the volume of operations performed and applications stored [
6].
The achievements on the level of system integration and requirement can be used as indicators of digitalization progress to identify the gaps and limitations in different systems [
8]. Upstream and downstream firms can develop integrated strategies by alternating between the roles of service providers and customers for the benefit of information transparency. Service quality is always one of the crucial factors affecting the business development of a firm despite the challenges posed by market changes and business transformations [
9]. Service-dominant (S-D) logic is a concept of combining services and individual business elements with product or process innovation to emphasize the value of cocreation [
10]. The strategy of building a dynamic adjustment and cocreated mechanism with business partners is crucial in handling business chaos. In this study, we modularized various services into several microservices to reduce and spread the operational risk. The proposed modularized structure stimulates the innovation process to effectively meet the distinct customer requirements within the market [
10]. Firms can expand their business across different markets by integrating the recommendations of second or third parties. In addition to the specification and description language that are critical to the entire framework, the cocreated features and microlevel service viewpoint assist the system by allowing self-moderation.
Service quality can influence business performance directly or indirectly based on service orientation strategy and microservice architecture. However, invisible quality issues, which are related to system design, may damage goodwill [
11]. Service quality indicators, such as reliability or different yield rate issues, are considered in the manufacturing industry. Various evaluation methodologies have been proposed under different scenarios owing to the rapid development of the digitalization applications [
12]. The research question in this study is how corporations conduct service innovation through specific processes or approaches under complicated Industry 4.0 construction scenarios. We assessed the reliability of different system combinations to evaluate the manufacturing service quality [
13]. In addition, combining different microservices with failure causal relationships and electronics domain knowledge supported firms in new business development [
14]. Furthermore, the Kaplan–Meier estimator was employed to calculate the reliability ratio using the failure time point. A multilayer perceptron (MLP) model facilitated additional assessment and validation mechanisms owing to the limitations in the existing methods for extracting real-time data. For the originality, by combining MLP and Kaplan–Meier estimation methodologies via extracting the characteristics of realistic datasets, the system integrated with anticipated functions will accelerate service innovation and optimization. On the other hand, the research gap may be non-sufficient scenarios or domain knowledge data that can be applied to the model. This study proposes a system framework and evaluation methodologies based on machine learning and simulation methodologies to assist corporations with service innovation and quality assessments.
2. Related Works
One research work has demonstrated that the manufacturing revolution is highly associated with physical or digital technology applications [
15]. The main paradigm of Industry 4.0 includes autonomous manufacturing and simultaneous monitoring features [
16]. The flexibility of Industry 4.0 has fostered new business models for developing new markets [
17]. Digital applications, such as telecommunication technologies and blockchain and artificial intelligence (AI), can be implemented by integrating with physical technologies. Among the system integration processes, the existing system combined with the AI function will enhance the insights provided by smart features [
18,
19]. Enterprises must synchronize diverse information before decision making to achieve smart factory criteria. A combination of MES with supply chain management, customer relationship management (CRM) and business intelligence systems can synergize the effects of data convergence in producing many integral orientations [
20].
The scalability and availability criteria should be considered when a manufacturing firm invests in equipment to develop a product or process [
21]. Similarly, the modularity, reusability, capacity and controllability criteria should be considered within the software industry [
22]. Therefore, several cloud manufacturing architectures were proposed by firms and scholars under different business considerations [
12]. Corporations prefer introducing high market-shared telecommunication protocols or specifications to increase their product or process scalability for business extensions and expansions. IoT and 4G/5G technologies are two global standards that focus on communication applications related to smart manufacturing development [
23,
24]. In 2014, Lewis and Fowler first proposed the core concept of microservices [
25]. Microservices and serverless environments are emerging as solutions to complex problems because of the architecture transformation trend [
26]. Auer et al. compared the monolithic and microservice architecture using their information and metrics analysis [
7]. Industry leaders, such as Twitter, Amazon and Spotify, deployed microservice architecture infrastructure in their business territories [
27]. By merging with the specific application programing interface (API), firms can utilize the microservice to provide flexible applications to target segmentations. Furthermore, Soldani et al. substituted the system dependency and exploited mismatching issues caused by intrinsic complexity [
28]. Service providers can focus on dedicated functions for target customers to overcome the limitations of microservice-based transformations. Microservice has the features of high scalability, flexibility and availability, which makes firms able to formulate relative strategies for various markets. However, the decentralized characteristics may be the drawbacks of the microservice architecture. Firms may face mismatching issues if there integration problems occur.
In contrast to goods-dominant (G-D) logic, the S-D logic proposed by Lusch and Vargo [
29] promoted the idea of exchanging services instead of goods; an evolution of information technologies would allow the transformation of services into different types and processes [
30]. Firms can employ microservices for various services owing to their similarity with S-D logic. The combination of microservices and business model development steers the alternative strategy orientation of the market forces. Further investigation defined the system framework of small and medium enterprises to identify the hierarchical layers for various applications [
31]. The microservice design stimulates business innovation to expand service delivery. The S-D logic is widely used in specific or general digital transformation scenarios. Cellary introduces the S-D logic for CRM applications [
32]. Customers can add value to optimization by actively involving themselves in cocreation [
33]. Furthermore, while the progress of technology and markets influence demand, multiactor interactions within the industry can stimulate innovation and facilitate adaptive transformation. Every stakeholder in the ecosystem contributes different perspectives to improve the value chain. Therefore, the decision maker must develop assessment mechanisms for different business models or applications.
Service quality is one of the crucial factors influencing the cooperation among firms. Customers’ satisfaction determines the service and product quality. However, reliability is considered a time-oriented quality that indicates the ability of a machine or product to perform the intended functions throughout its lifecycle [
34]. In terms of service demand in the manufacturing industry, engineering-related departments, such as R&D and quality analysis, should be responsible for reliability assessment and in addressing quality issues [
35]. For physical or digital services, defining the specification restriction using domain knowledge gives meaning to the evaluation mechanism. Remote sensing and cloud computing techniques are commonly used in cloud service architectures to monitor real-time applications [
36,
37]. Compared to Nandra et al.’s study, quality deterioration is also an essential factor that may directly influence the supply chain quality process [
38]. Failure time plays an indispensable role in evaluating the reliability and quality issues. In contrast to previous research, Chauhan et al. (2021) also utilized the customization concept to design a dual-channel supply chain model to help the higher manager to make decisions [
39]. The combination of costs and inventory model provides a different perspective on strategy formulation. Mubarok et al. proposed a hierarchical structure for reliability assessment, in which the reliability of the upper and lower layers will alternately affect the final service quality [
12]. Service compositions are one of the methods for allocating resources and discovering new possibilities. Furthermore, cloud services associated with customizing applications are influenced by the reliability and combinations of the system layer. In Gorski and Wozniak’s work (2021), the analysis of service reliability and business process indicates the importance of higher reliability requirements. The web service (UML) can also implement different tasks by applying registry and storage mechanisms and evaluating the service quality [
40].
In terms of maintenance, in addition to considering the degree of system matching and mutual support, the life cycle of each layer must be estimated [
41]. Several newly developed algorithms can considerably increase the accuracy and diversify analysis despite the difficulty to obtain most of the data in the past. In this research, the proposed framework can assist corporations in handling complex automation issues and expanding their business models. The data modeling approaches combining artificial intelligence can also help higher managers conduct service innovation and process integration.
3. Materials and Methods
Scholars frequently employ the Kaplan–Meier estimator and machine learning to capture and predict complexity in reliability analysis. The evaluation of complex manufacturing issues is limited by the scarcity and availability of data access and still depends on precise analysis techniques [
42]. The incomplete failure, as well as censored data, were used for subsequent analysis during the investigation [
43]. Using censored data for predictive simulation can practically help decision makers to improve the system. In censored data prediction, Regattieri et al. investigated reliability assessment in the presence of censored data [
44]. However, the development of genetic and neural network algorithms has improved the prediction accuracy for system reliability analysis. According to Alsina et al. [
45] and Chatterjee and Bandopadhyay [
46], data-driven design triggered historical and fitting verification. Several scholars have used machine learning and neural networks to monitor system reliability of supervised and unsupervised learning in the past. Time-series analysis is used to track equipment failure and optimize maintenance procedures [
47]. Furthermore, da Silva et al. [
48] used an artificial neural network to control risk using system reliability assessment. Additionally, the decision maker can convert system reliability into a risk and find a corresponding solution to consider the boundary conditions. The model selected for simulating various scenarios depends on the data features [
49]. Machine learning can help in the analysis of system data deficiencies and verification issues when integrated with appropriate service architecture.
Research Background: This study describes a service innovation system framework that a NASDAQ-listed technology corporation (Firm A) can use to expand and manage their business. Firm A’s manufacturing solutions are used by leading automobile companies in Germany (Firm B) and Japan (Firm C) to complete production. The two different business processes within Firm A are consumer electronics product selling (B2C) and manufacturing techniques providing (B2B). In the manufacturing business section, Firm A will define and pack the specific hardware and software for the cooperative corporations to fulfill certain goals. However, most of the process from product development to manufacturing is independently performed by Firm A. In process design, resources are wasted owing to a mass in considering customer requirements [
50]. The introduction of multiple information systems can effectively assist companies in integrating relevant resources as they progress toward Industry 4.0. Firm A can use the characteristics of the information system to align the requirements of Firms B and C and provide a relatively optimal solution. Using the value cocreation principle, the service provider will make dynamic adjustments to meet the requirements of both the parties and improve production efficiency. This study proposes a theoretical concept and uses the current Firm A system to optimize and improve the practical process and design.
4. Theoretical Framework
The research design introduces the S-D logic concept and reliability analysis to explore the possibility of service innovation. In many companies, self-assessment and inspection mechanisms have not been implemented [
51]. Regardless of whether the original design’s integrity can meet manufacturer requirements, the establishment of a verification mechanism is still required [
52]. Incorporating third-party stakeholder opinions into the review can effectively reduce the cost of trial and error [
7,
53]. However, this process must be continuously updated and modified as the market reflects dynamics because losses may occur if the response is too slow or not reflected. For instance, the designer must consider customer requirements during the preliminary stage of the product design and incorporate product feedback into the revision or innovation consideration. Similar to service process innovation, process optimization cannot be accomplished solely by the service provider. The theoretical framework concludes the process by applying relevant theories and analytical approaches to generalize service innovation and evaluation.
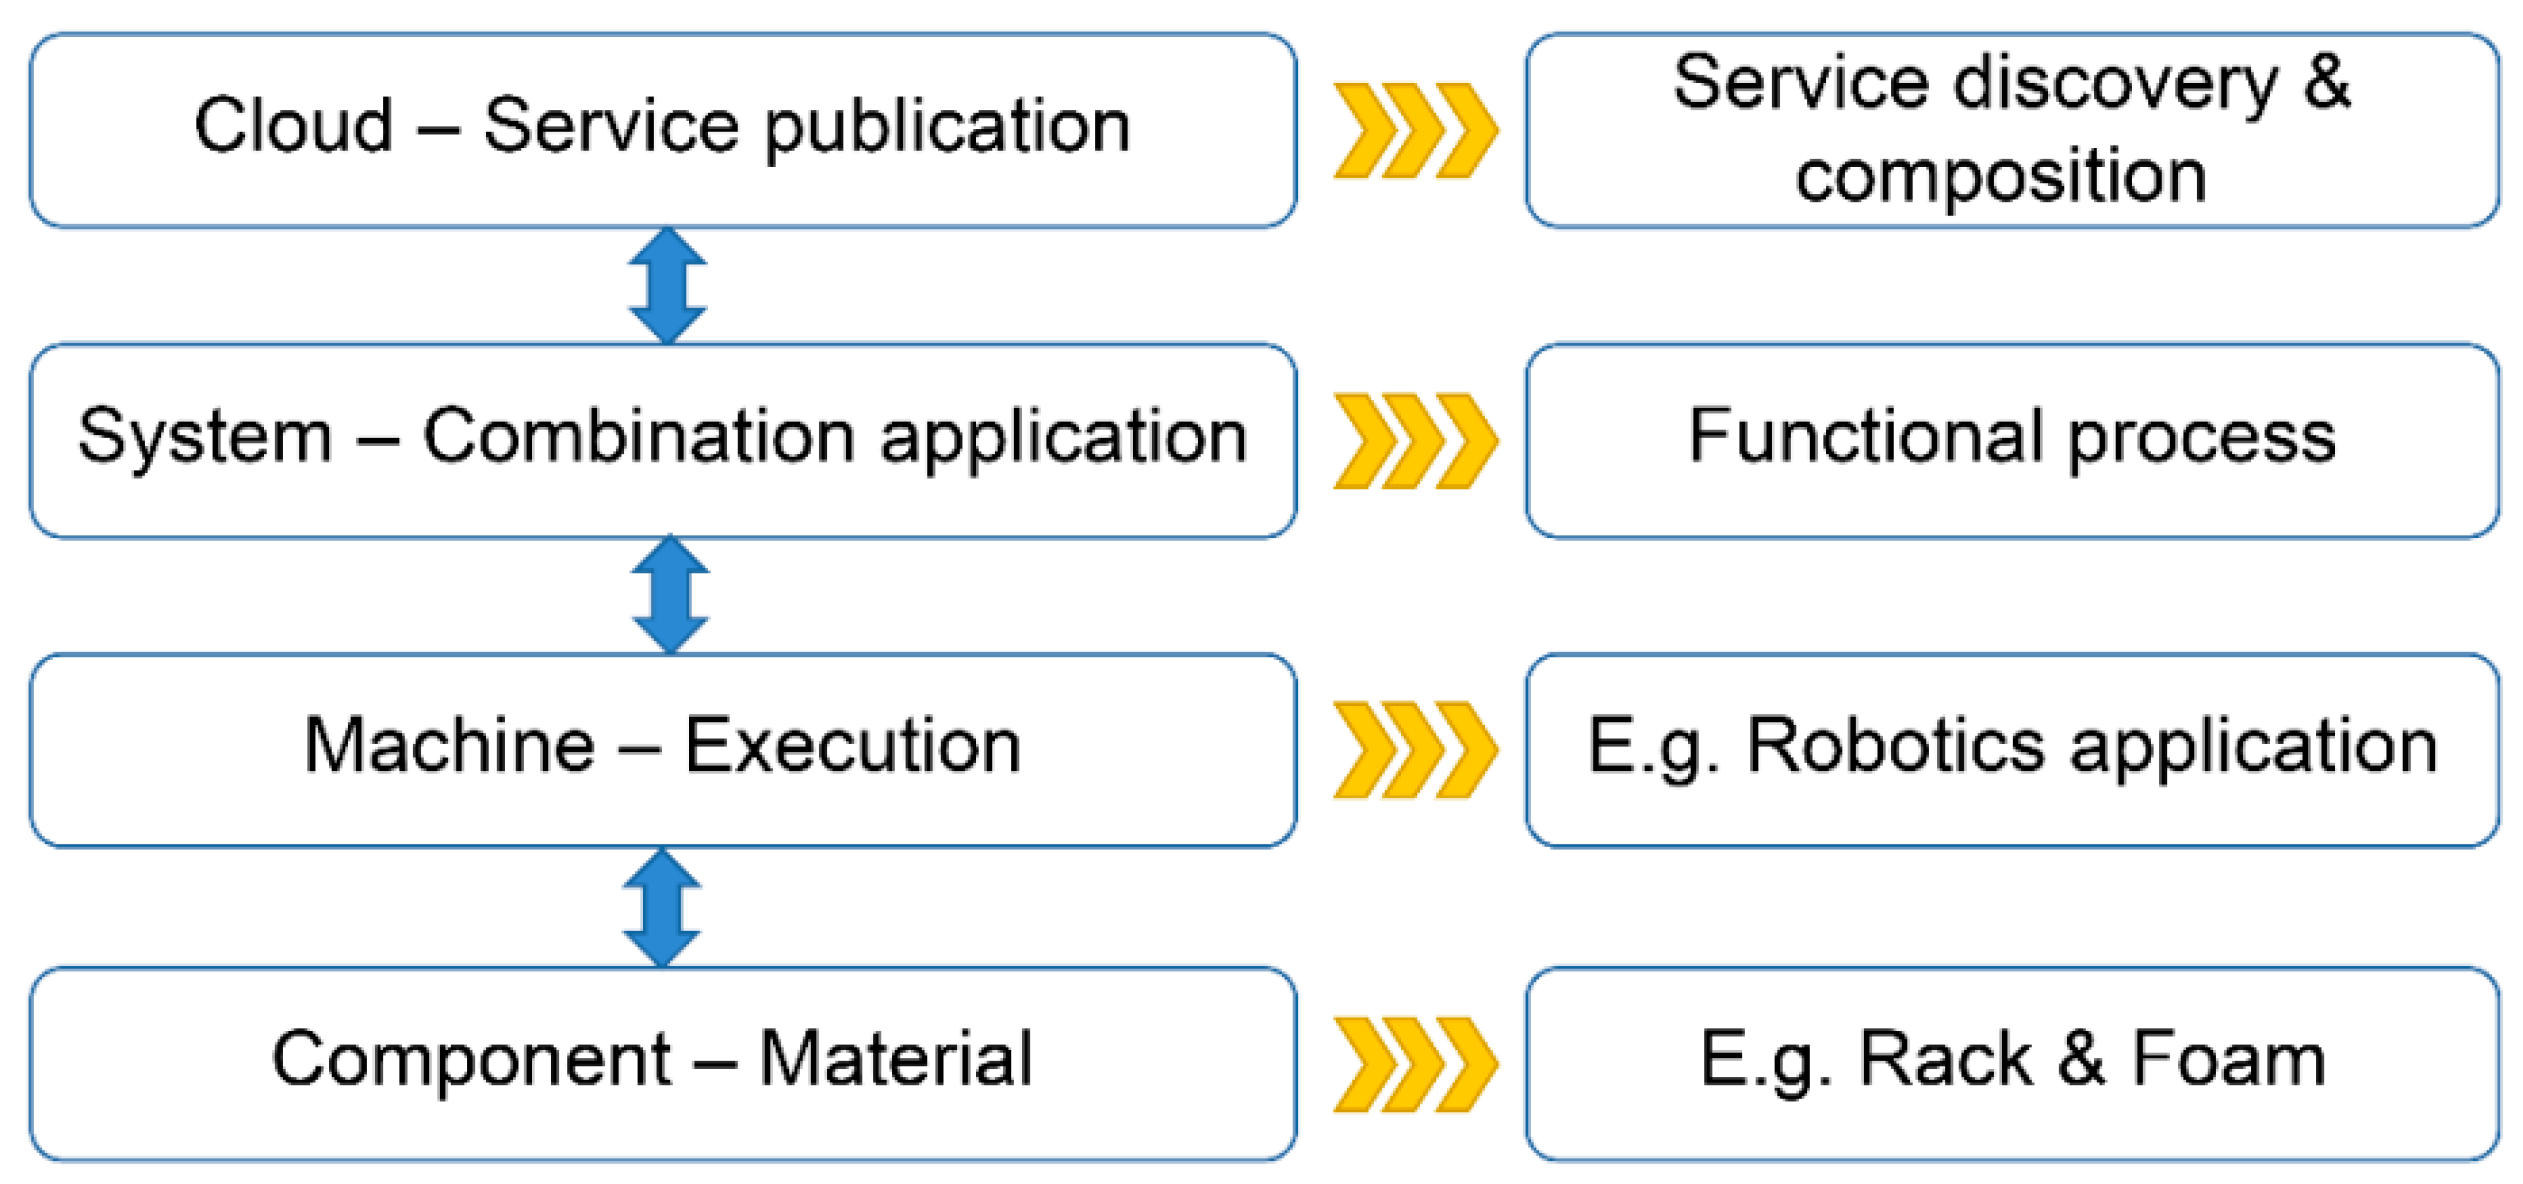
Integrating configurations for service delivery is essential in the framework of Industry 4.0. The hierarchical framework of the infrastructure is shown in
Figure 2, indicating the different layers and relative functions. Although the service areas we are discussing are mainly the system and cloud layers, other related layers will also directly or indirectly affect its performance. For the manufacturing industry, many software and hardware services will be packaged and become solutions for customers [
54]. For example, Siemens Manufacturing Services and ABB Automation integrate solutions for their customers to meet various criteria. Firm A is an electronics manufacturer that designs and manufactures automotive systems and consumer electronics for automakers and consumers. Firm A decided to invest in industrial automation products with a few automotive systems produced by various entities after designing and manufacturing various systems and products. Firm A can expand its business models and knowledge by establishing various services and value propositions. The concept of joint development and co-manufacturing has not yet been introduced into the framework of relevant stakeholders in the process of expansion. With the increase in cooperative projects, unintegrated and imperfectly planned design, Firm A has gradually fallen into the dilemma of poor quality and fewer customers. Under the orientation of Industry 4.0 development, Firm A has developed digital dashboards to monitor production issues. However, the development core is often related to the existing design and architecture [
27]. Many system designs are obsolete and often require software refactoring or rebuilding, resulting in resource depletion. Although the integration of various parts will result in the duplication of work and wastage of resources, the modular system constructed will facilitate subsequent development [
55,
56]. In terms of troubleshooting, the modular features effectively clarify each component and confirm related functions, resulting in a rapid recovery.
In digital development, system architecture and service mode are often inextricably linked [
27]. Several service items and data access were planned at the same time that Firm A began to restructure the system. Furthermore, because of the different service items and products, the system integration often has considerable differences. Additionally, learning to identify the differences between general and specific services to distinguish them is a huge challenge [
22]. Several functions derived from design considerations are retained through communication with product designers, and unified management with general functions will greatly improve system efficiency [
22]. In Firm A’s system, several existing designs are those of monolithic architecture. While restructuring the system, service provision must be considered. Taking Firm A’s system service content as an example, the configuration and function of the software system will affect the refactoring process and the system’s operating efficiency.
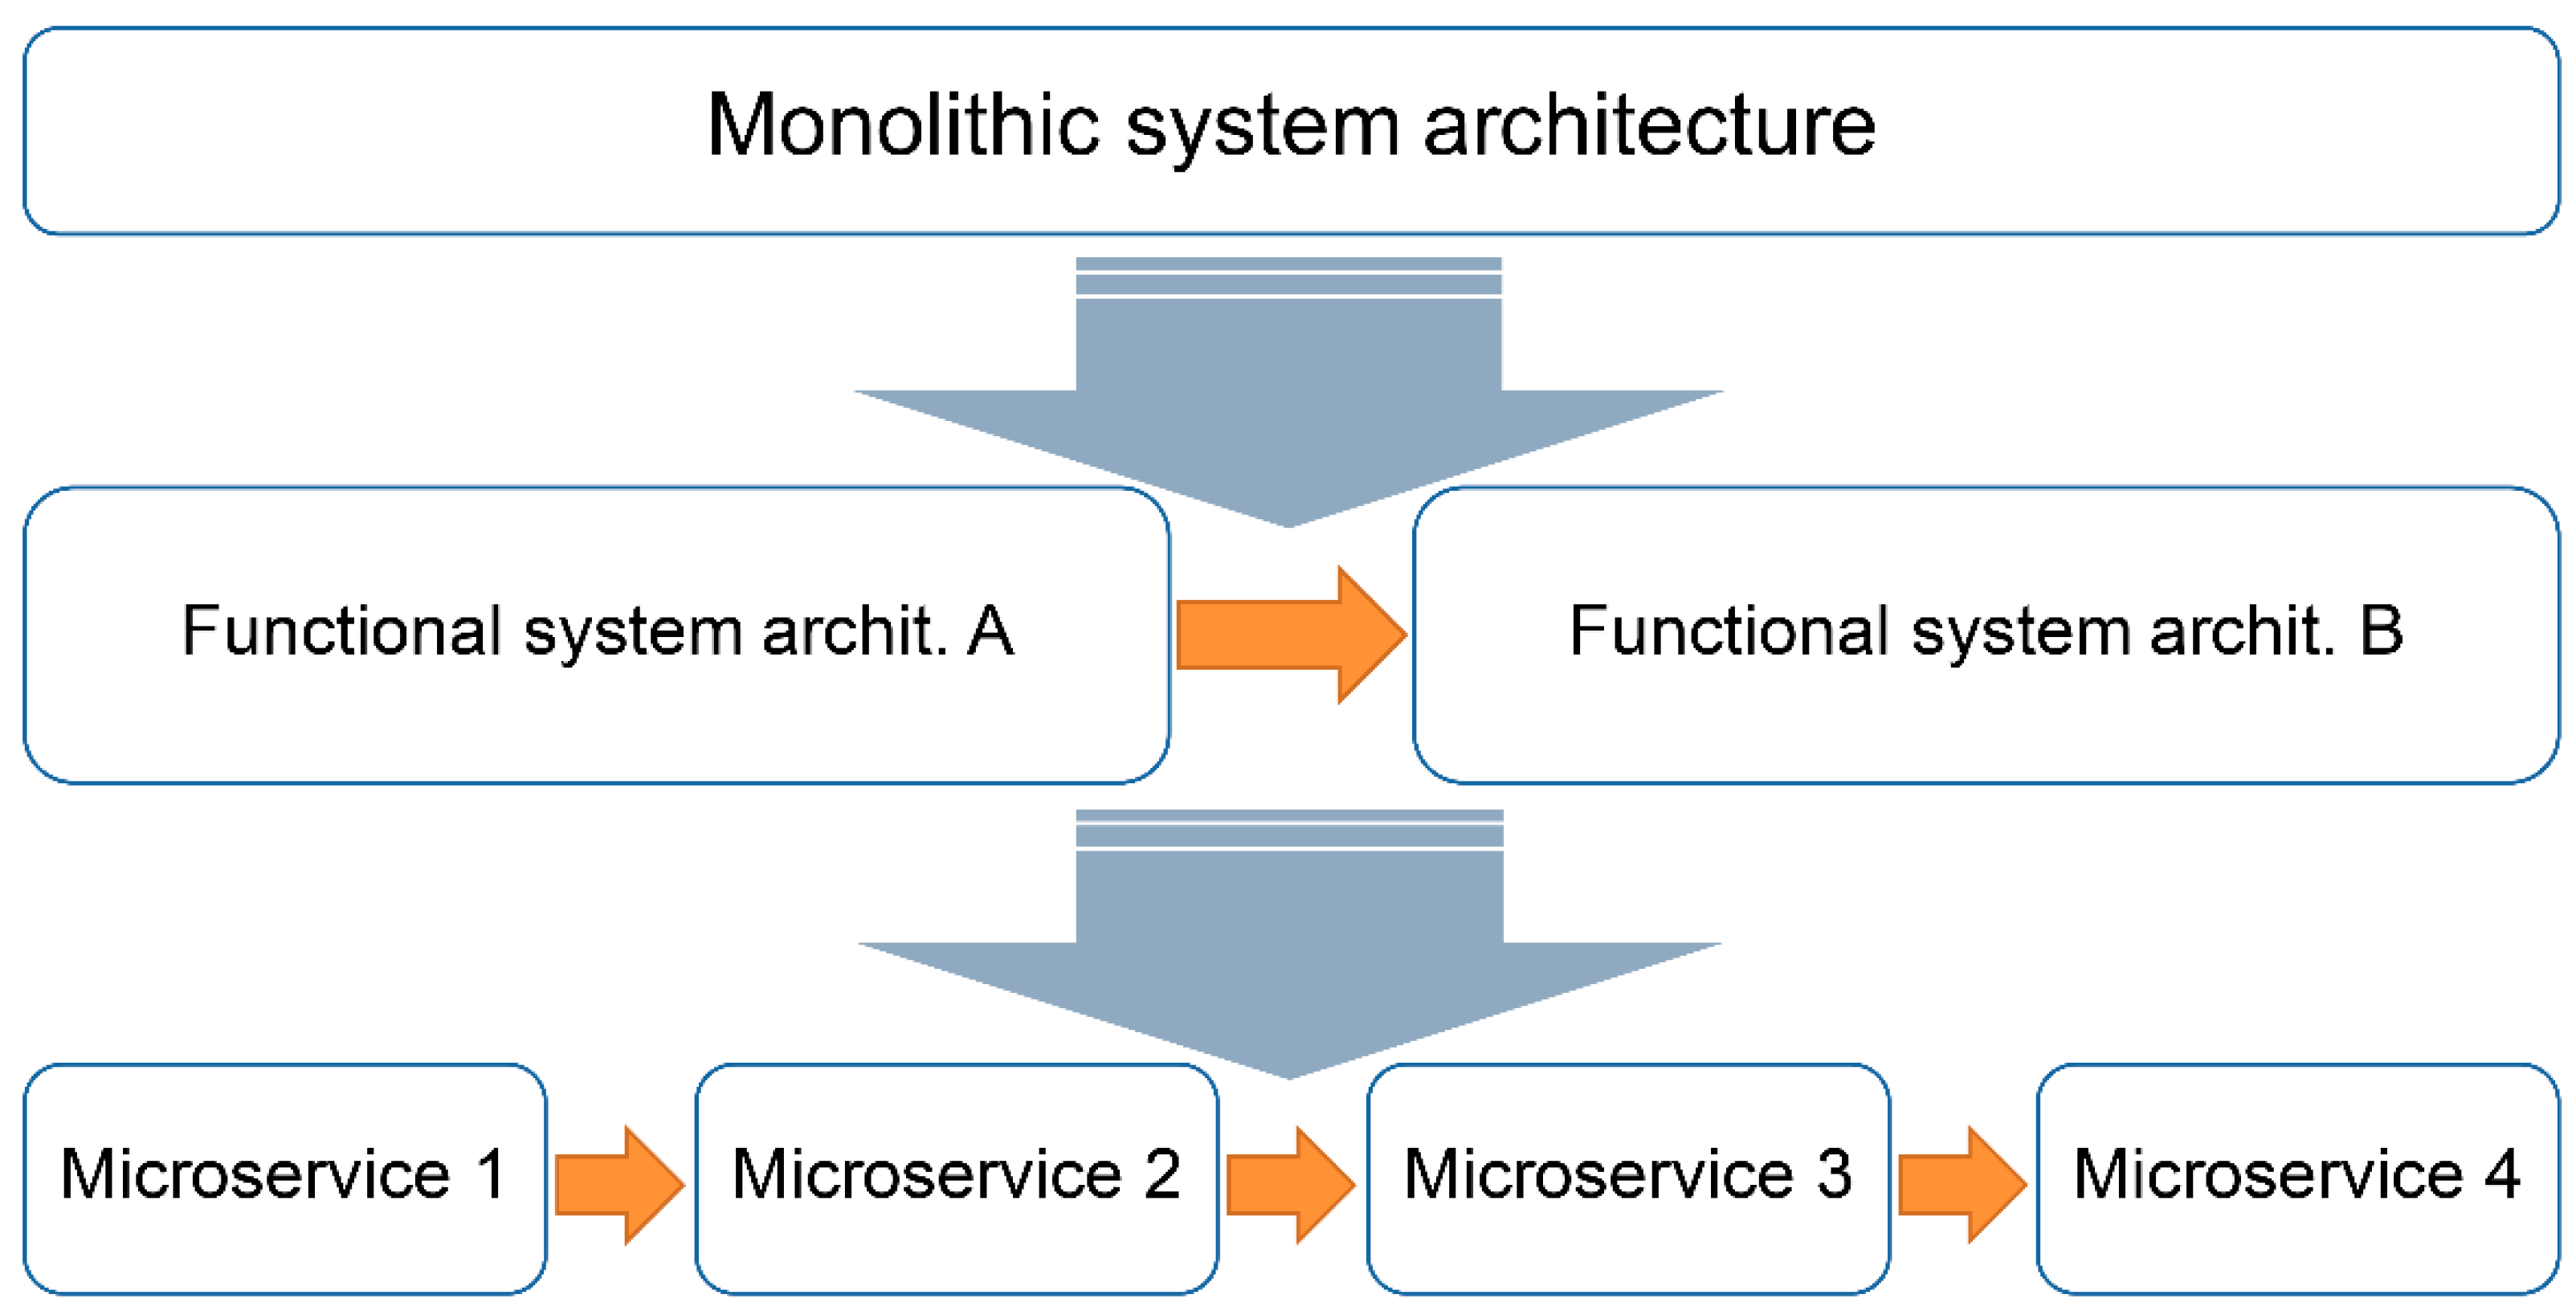
Figure 3 shows the reconstruction process in Firm A after the introduction of S-D logic.
The system was briefly classified and disassembled during the preliminary reconstruction of the structure, based on the relevance and functionality of its data tables. However, because of their binding services, many systems with decentralized operations could not achieve the desired performance. In monolithic architecture, if Functional System A fails to function, it will also affect Functional System B, causing the entire system to suspend service. Similarly, if decision makers can miniaturize the service system and decentralize it using the S-D logic concept, the risks of system failure will be reduced [
28]. Furthermore, identifying the corresponding requirements and service process architecture while disassembling the system will help in the innovation and optimization of the service portfolio. In the system architecture theory, the introduction of the microservice system has the characteristics of high scalability, which enables making necessary changes when the market changes in the future [
7]. From the standpoint of a partner company, more flexible services are easier to introduce into their systems. Taking the microservice system architecture as an example, the service application side can find the best architecture and import it through combination. Therefore, following the introduction of related concepts, Firm A will construct its microservices based on the specifications and requirements of the partner and customer after performing a matching analysis.
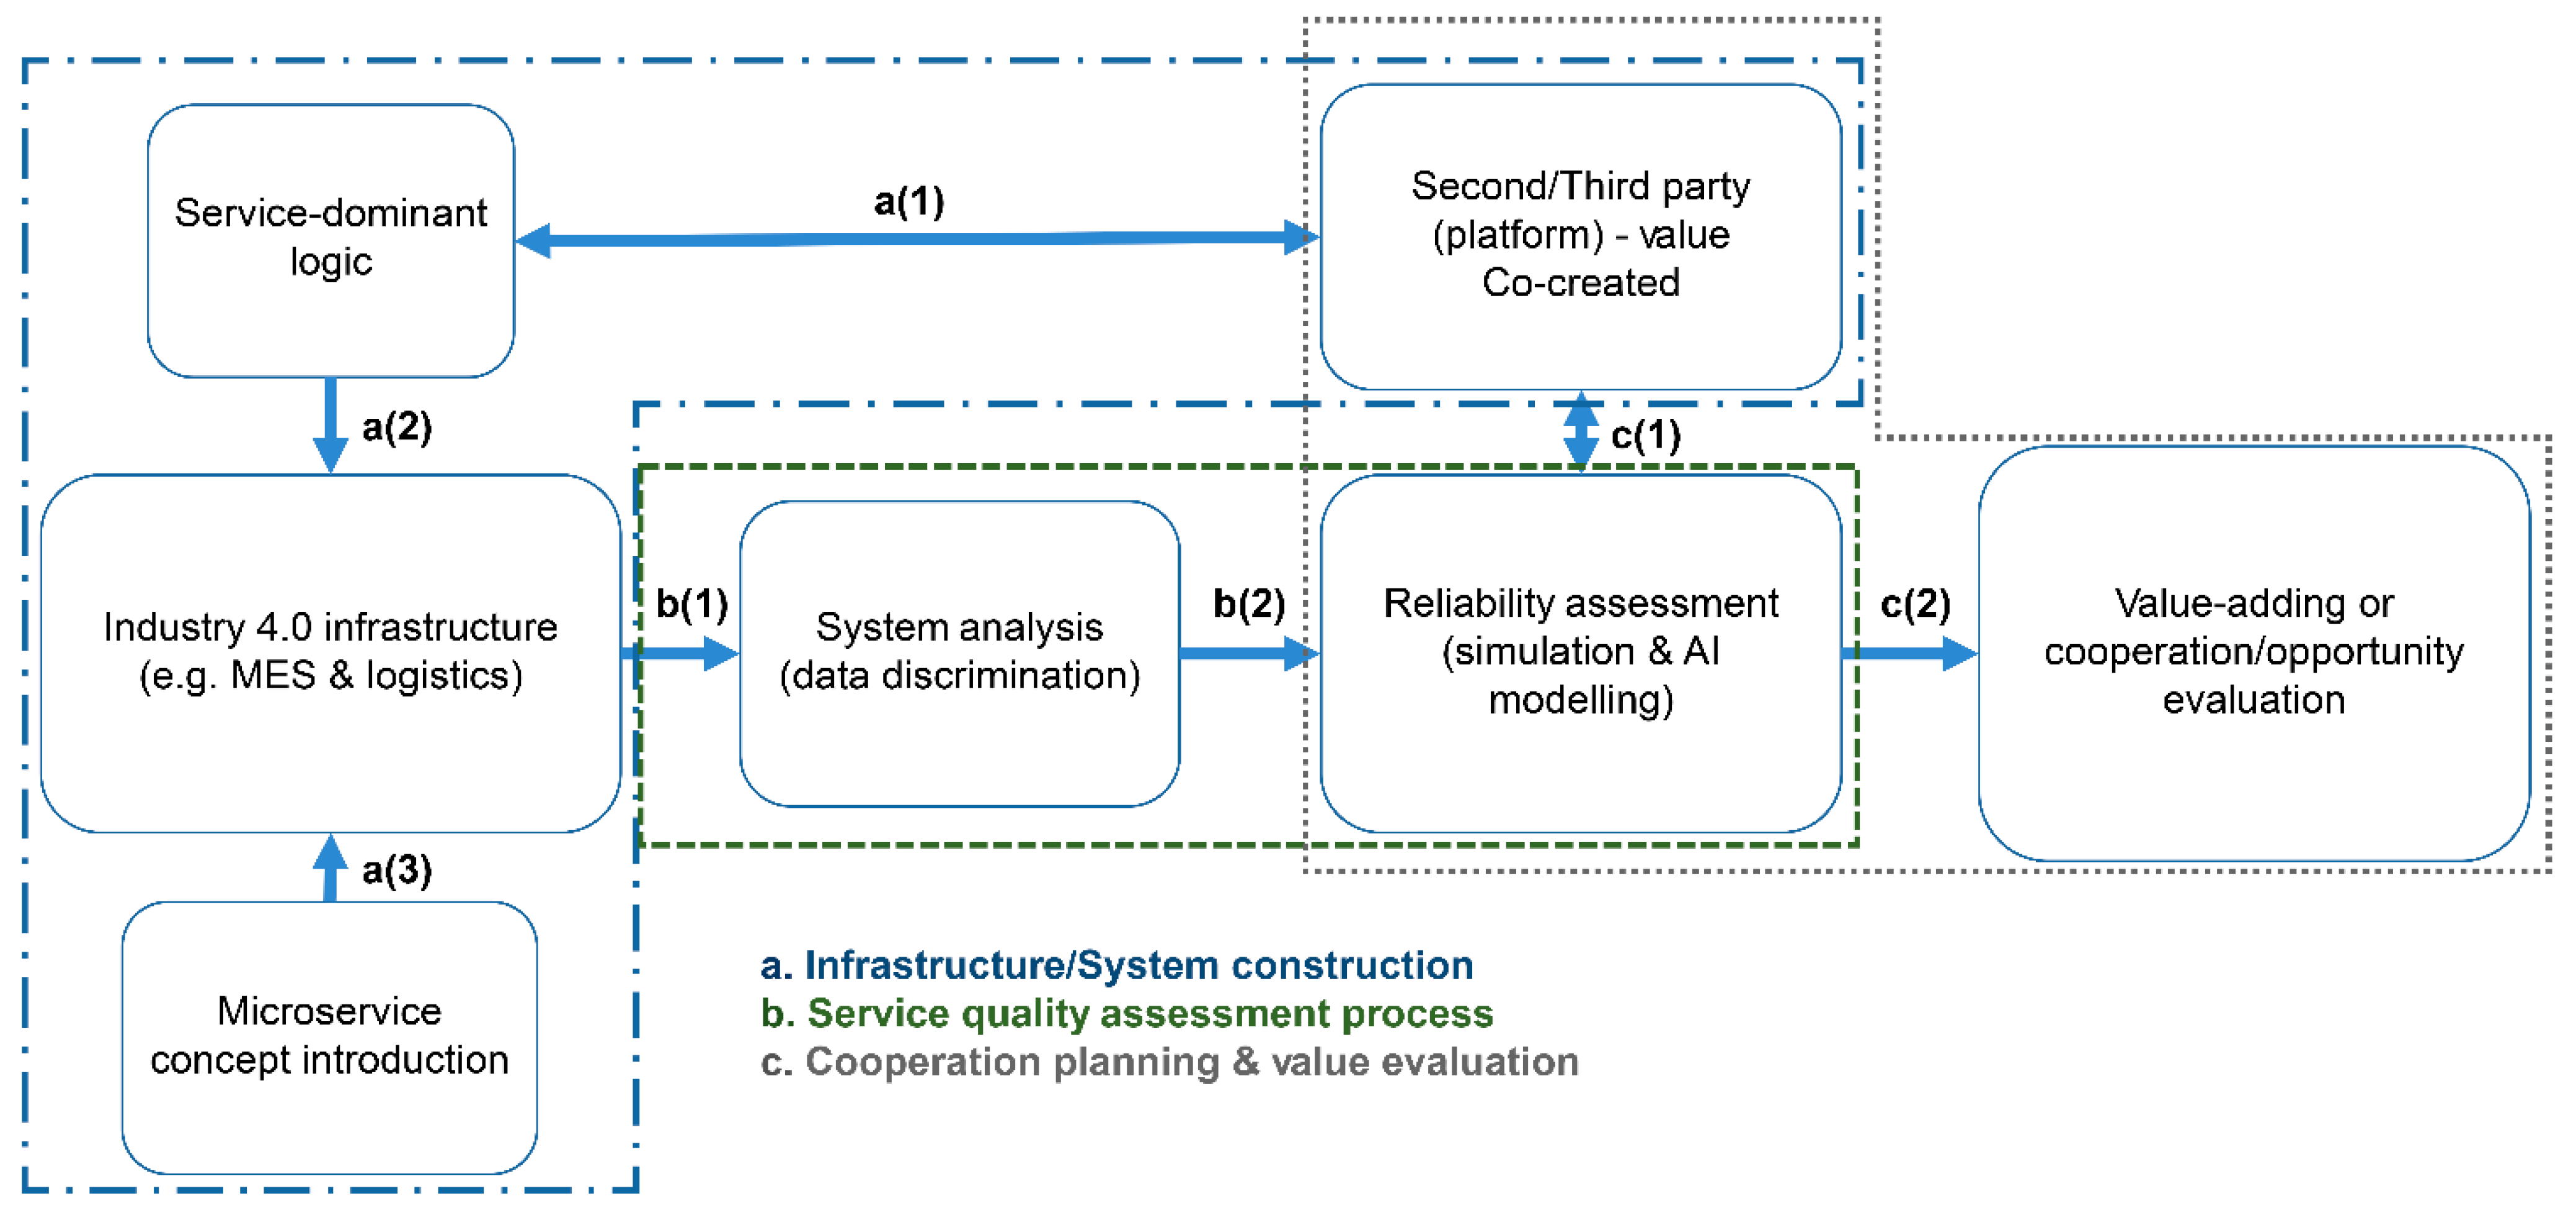
The theoretical framework combining system construction, service quality assessment and cooperative innovation planning process guides the exploration of cocreated value. From a different perspective, adding a third party to the verification mechanism will make the system architecture more comprehensive [
57,
58]. Cooperating companies can obtain corresponding knowledge from partners and create value together [
59]. Finally, companies can discover opportunities to create value sustainably during mutual turmoil. This study framework (
Figure 4) can be divided into three parts. A dynamic innovation framework can be derived by combining each block.
4.1. Infrastructure/System Construction
The construction of the system will affect the current efficiency and change the subsequent expansion of the value proposition. In the early stage of system construction, it is required to communicate and cooperate with partners to meet the requirements of both parties [
59]. Considering the stacking and development of technologies, investment and development of advanced technology applications are often required. The technical level of partners must be evaluated [
23]. If an enterprise is unaware of new technologies and fails to match development cost with the systems of second-third parties, it may suffer a loss of resources. Therefore, when the enterprise is conducting the construction of the advanced system, the technology development platform with its partners has achieved the greatest intersection, which can effectively integrate various business demands. The system must be evaluated from the standpoint of service construction [
19]. After combining the S-D logic, the microsystem’s service development can develop different service models. Similar to the characteristics of microservices, the construction of microsystems is extensible and can unite services to achieve the purpose of portfolio expansion. If an enterprise constructs a microsystem architecture with a microservice orientation, it can also gain the advantages of relatively easy maintenance and integration [
31]. In the Industry 4.0 framework, real-time information updates can assist supply and demand parties in maintaining information transparency [
11]. For manufacturing demands, many services must be provided or improved promptly. Therefore, it is bound to build a framework that truly meets the requirements in the early stages of development, dynamically communicating with the demand side, introducing the concept of microsystems and microservices and making timely corrections.
4.2. Service Quality Assessment Process
For service providers, establishing a comprehensive inspection mechanism can ensure the quality of service and project processes. In the business model of manufacturing and OEM, productivity and yield rate are essential indicators of service performance [
60]. Further, the reflection efficiency after a problem occurs will affect the overall quality. In the production process, systemic problems lead to misconfiguration of software and hardware, which affects shipments and causes the company to suffer losses. For instance, if the specifications of the shipped materials do not match the finished product because of material system problems and the system does not analyze and intercept, the materials may be scrapped or even delay delivery. This theoretical framework puts the checking mechanism in the center of the structure to determine the problems in service definitions and system construction. Although many systems are developed using test-driven design (TDD) concept at the preliminary stage of development, other requirements are usually derived from the project entering the market evaluation stage [
52]. As the business grows, the initial design is no longer sufficient to support the latest requirements [
61]. Adding the proposals of second or third parties to the framework increases the possibility of obtaining an optimal solution. Based on the TDD core concept, this evaluation system will analyze the system’s reliability and predict with the AI model to optimize the service system. In the review process, second or third parties can use the evaluation results to add or improve related functions or issues during the system revision process. Companies can maintain market competitiveness by adjusting corresponding strategies based on predictive analysis through step-by-step simulation testing and the introduction of AI analysis models.
4.3. Corporation Planning and Value Evaluation
Companies can transform data and analysis results into portfolio strategies to increase revenue after dynamic improvement and evaluation. In the technological manufacturing industry, advanced technologies are usually used to conduct service innovations [
62]. The use of advanced technology has corresponding risks [
63]. Many systemic changes still have the opportunity to directly or indirectly cause operational problems. Therefore, while eliminating systemic problems, evaluating service transition or stability is also an important issue. However, systematic errors in technology manufacturing industry are often difficult to measure. If an error occurs, even if the company suffers significant losses, the company will be unable to import the system based on the test data. Simulation and prediction models can help companies develop services in response to ambiguous conditions and environments [
62]. In the predictive simulation model, the consideration of market mechanisms will allow the constructed service to be analyzed first in a realistic environment. In the face of drastic market change, companies should control the corresponding changes and conduct related experiments to facilitate subsequent development. The change and improvement of strategies will depend on the industrial ecosystem, and the positioning of the role of a company in different ecosystems often has different impacts [
63]. Companies can define their position in various ecosystems based on different system criteria during the cooperating process. Finally, while evaluating the overall strategy, the enterprise can apply the simulation evaluation system’s insights to its services to expand the scope of business.
We will use Firm A as a case study in this research framework to construct and optimize the service process, simultaneously cooperating with Firms B and C to find out the possibility of problems and propose effective solutions. Absorbing the corresponding domain knowledge through learning with Firms B and C can also increase the accuracy of system analysis. To develop and optimize the service construction, we will follow the original industrial automation framework of Firm A, simultaneously cooperating with Firms B and C to identify potential problems and propose effective solutions. Absorbing the corresponding domain knowledge through learning with Firms B and C can also increase the accuracy of system analysis. To develop and optimize the service construction, we will use the original industrial automation framework of Firm A. Following data extraction and analysis with corresponding domain knowledge, we will build prediction and simulation models based on the environment to facilitate subsequent evaluation. As the service changes, Firm A can adjust decision making based on simulation results, which achieved significant benefits.
5. Research Methodology and Empirical Findings
Firm A can adjust decision making based on simulation results, which achieved greater benefits. In terms of research methodology, this study will combine AI and simulation models for data analysis using the Kaplan–Meier estimation method, thereby improving and expanding the overall service structure. In the technology manufacturing industry, urgent problem handling usually lacks sufficient data for analysis, so relevant mechanisms for systematic assistance are required to increase accuracy [
34]. Following the completion of the system’s construction by the enterprise, the evaluation mechanism will be introduced by the context of the research framework to identify problems. Considering the concerns of the third party during the developing process will assist the enterprise in filtering the data and obtaining a relatively objective input [
7]. After deriving the reliability function from the data, we will use the AI algorithm to make further predictions. In terms of simulation systems, the predictive power of AI models will affect the final analysis results. To meet the practical requirement, the simulation model will consider the censored data. The prediction model’s loss function will also be tested to confirm its performance. We can also verify the predictive results with residuals by comparing them with realistic data. Finally, based on the data returned by the evaluation system, we will adjust the innovation and composition of the services between the microsystems. Companies can propose different business models with various service architectures by integrating business resources [
14].
5.1. Reliability Analysis
This study will start from the perspective of system reliability before proceeding to the quality of the service system. Reliability analysis can be used to measure the characteristics of items in a stated time interval and conditions [
34]. Finding corresponding relationships between variables and defining the probability function assist in system reliability analysis. The system maintenance period is defined as the interval between malfunctions and the unavailability duration [
35]. The longer a system operates without failure and with higher availability, the higher its reliability can be interpreted. In reliability engineering, the meantime to failure (MTTF), which is commonly defined for calculating system availability, is the factor for measuring the reliability function [
35]. The function of the system reliability is also derived from the probability of nonfailure within the time interval (0, t] [
34].
For analyzing the reliability, scholars commonly assumed
defining the system mean time-to-failure (MTTF), as follows [
35]:
Except for defining the complex system, the MTTF function can also measure the reliability of a single item configuration. For the boundaries, the system lifecycle is tacitly assumed to be infinite for the derivation. After establishing the system lifecycle boundary, we can approximate the probability polynomial to obtain the function of failure ratio
.
Setting
, the reliability function is given by
In this study, Firm A has several systems combinations for complex manufacturing requirements. Considering that the original system design’s characteristics will directly affect its reliability, the proportions
and q in the equation are used to identify the functional and architectural differences, respectively. To improve the accuracy assessment in reliability analysis, the definition of proportion can be designed regarding third parties’ consideration. The adjustment coefficient factors can effectively assist in the differentiation of similar systems. The reliability of the selected system can be formulated as follows:
where
and
represent the failure rate of the system. By integrating systems with similar design structures, companies can simplify simulation models. After eliminating duplicate variables, the model can deal with complex system service structures. Deriving from Equation (3), the failure rate with the time-dependent feature is considered.
In the process of observing the failure rate, the value will monotonically decrease from
to
. We can calculate the defective rate of each time interval by decreasing the value from the average rate to the minimum value of 0. In the failure of different events, the root cause must be analyzed by professionals in related fields. The difference in the degree of decline between the values must still be explored using raw data. While data censorship is usually unavoidable in the extraction process, companies can use different methodologies to overcome the problem [
41]. Once recognized that the data processing and exploration process are related to the various enterprises’ development, the trend for introducing new technology is still the same.
5.2. AI and Simulation System
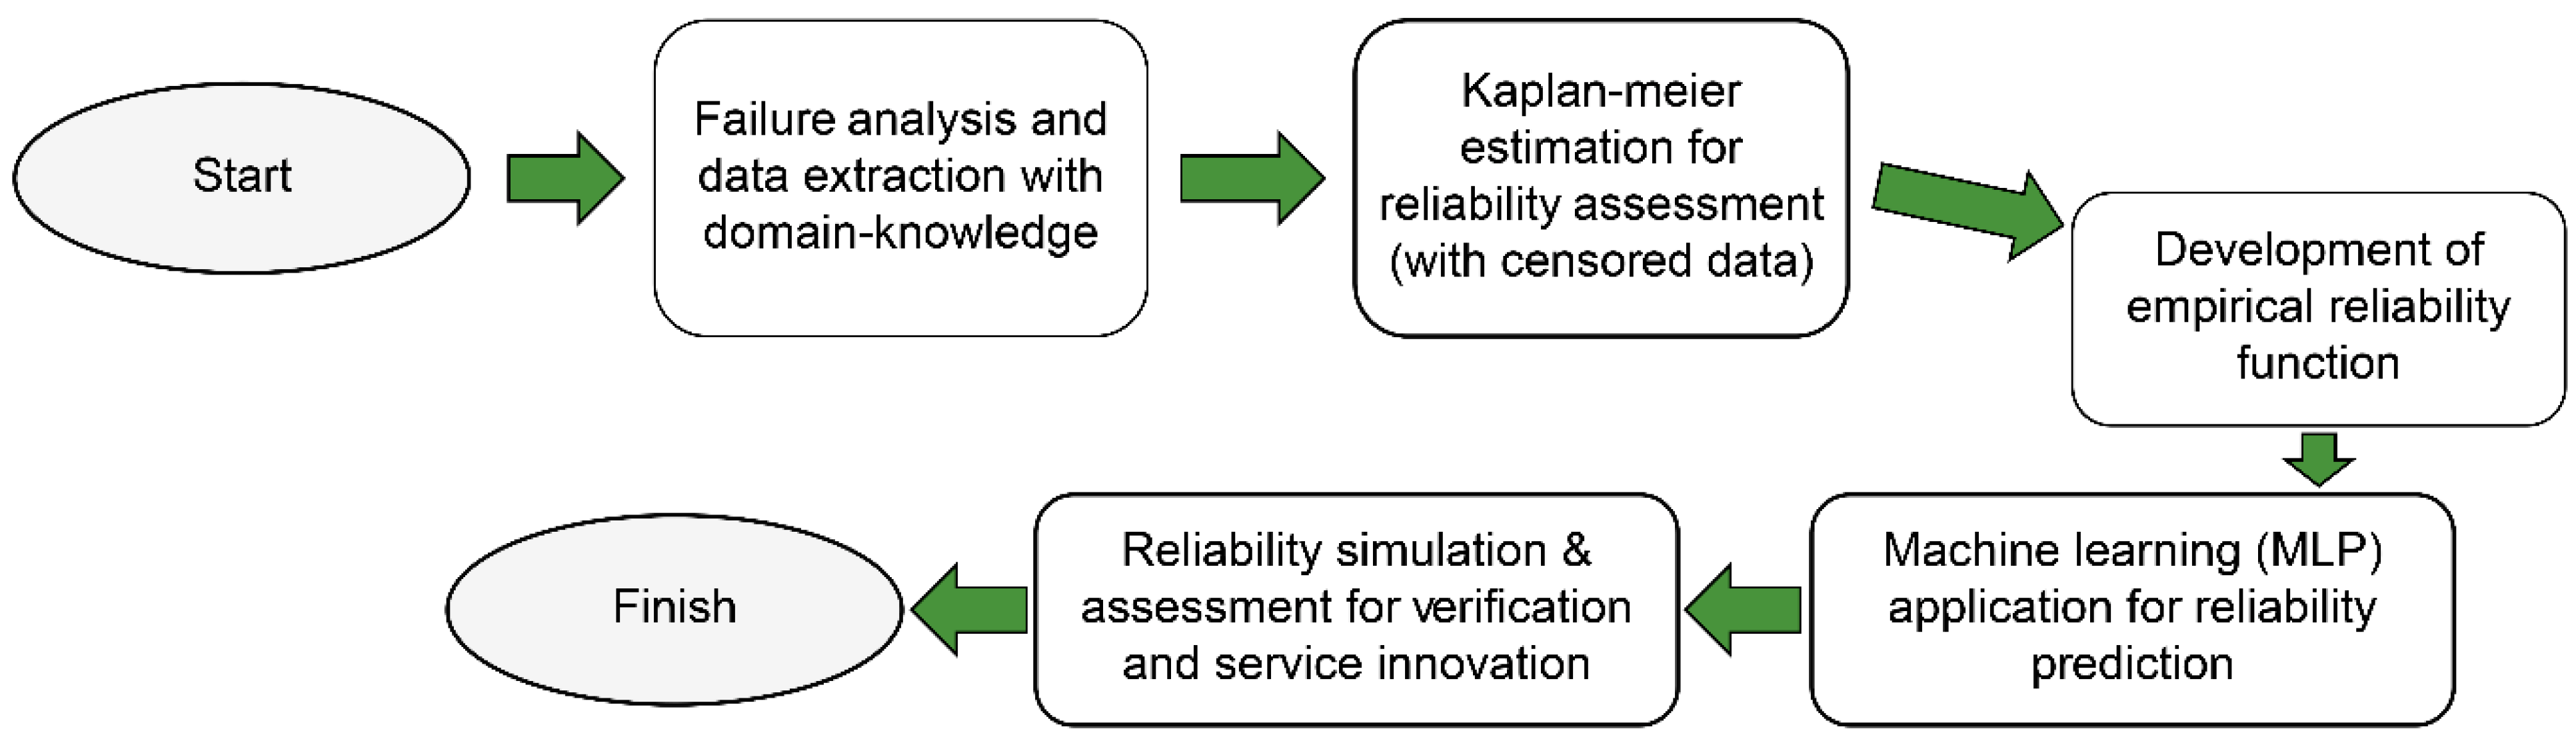
With existing data and architecture, introducing AI models and performing predictive analysis models can effectively help companies solve service problems and accelerate innovation.
Figure 5 shows the modeling process of service quality and reliability prediction in this framework. In the reliability analyzing process, lack of data and omissions will cause analysis difficulties. However, in addition to searching for relevant and possibly usable data, the interpretability of identification data is crucial. Removing the outliers and adding the integrated sections can make the presentation of the observation more objective. The data scarcity issue still cannot be solved after using the Kaplan–Meier methodology. Alsina et al. proposed and compared the structure for predicting reliability by various machine-learning models [
45]. A recent study showed that in reliability prediction, the MLP model has relatively better predictive capabilities [
45]. To obtain valuable referenced forecasting, we will use the MLP model because of its performance. After obtaining the prediction results, the simulation structure can perform a series of analyses and adjustments following the current service delivery status for the reference of decision makers.
5.3. Reliability Estimation and Prediction
Service delivery status is for the reference of decision makers. In the establishment of reliability assessment, subsequent simulations and predictions are based on the empirical reliability function. Considering the possibility of censored data, we will use the Kaplan–Meier methodology to conduct a preliminary reliability analysis. Because right censoring occurs in most cases, univariate censorship and survival analysis will be used to explore reliability studies [
64]. The reliability derived from the failure rate fits the nonparametric analyzing function. Kaplan and Meier proposed the Kaplan–Meier methodology to conduct incomplete observations [
65]. During the experiment, the decreasing survival status and the ratio will be measured. Converting the survival rate into the system failure rate, the reliability estimation becomes [
66]
Defining the event time interval [0, d], malfunction
and the survival observation
, we can measure the probability of system malfunction. In the data extraction, the time and process of each event will be recorded and sorted. Regarding the system failure model, rearrange the failure results, which help analysts conduct model examining. While failures or accidents may occur, the system still has an opportunity to operate normally through foolproof and safety mechanisms [
66]. Therefore, estimating the remaining functioning system and promptly supporting for troubleshooting can improve the service quality.
5.4. Multilayer Perceptron
Because of data censorship, the introduction of machine-learning models into the simulation system can increase the accuracy of system analysis. Many AI models, such as random forest, support vector regression and MLP, can be used to analyze reliability [
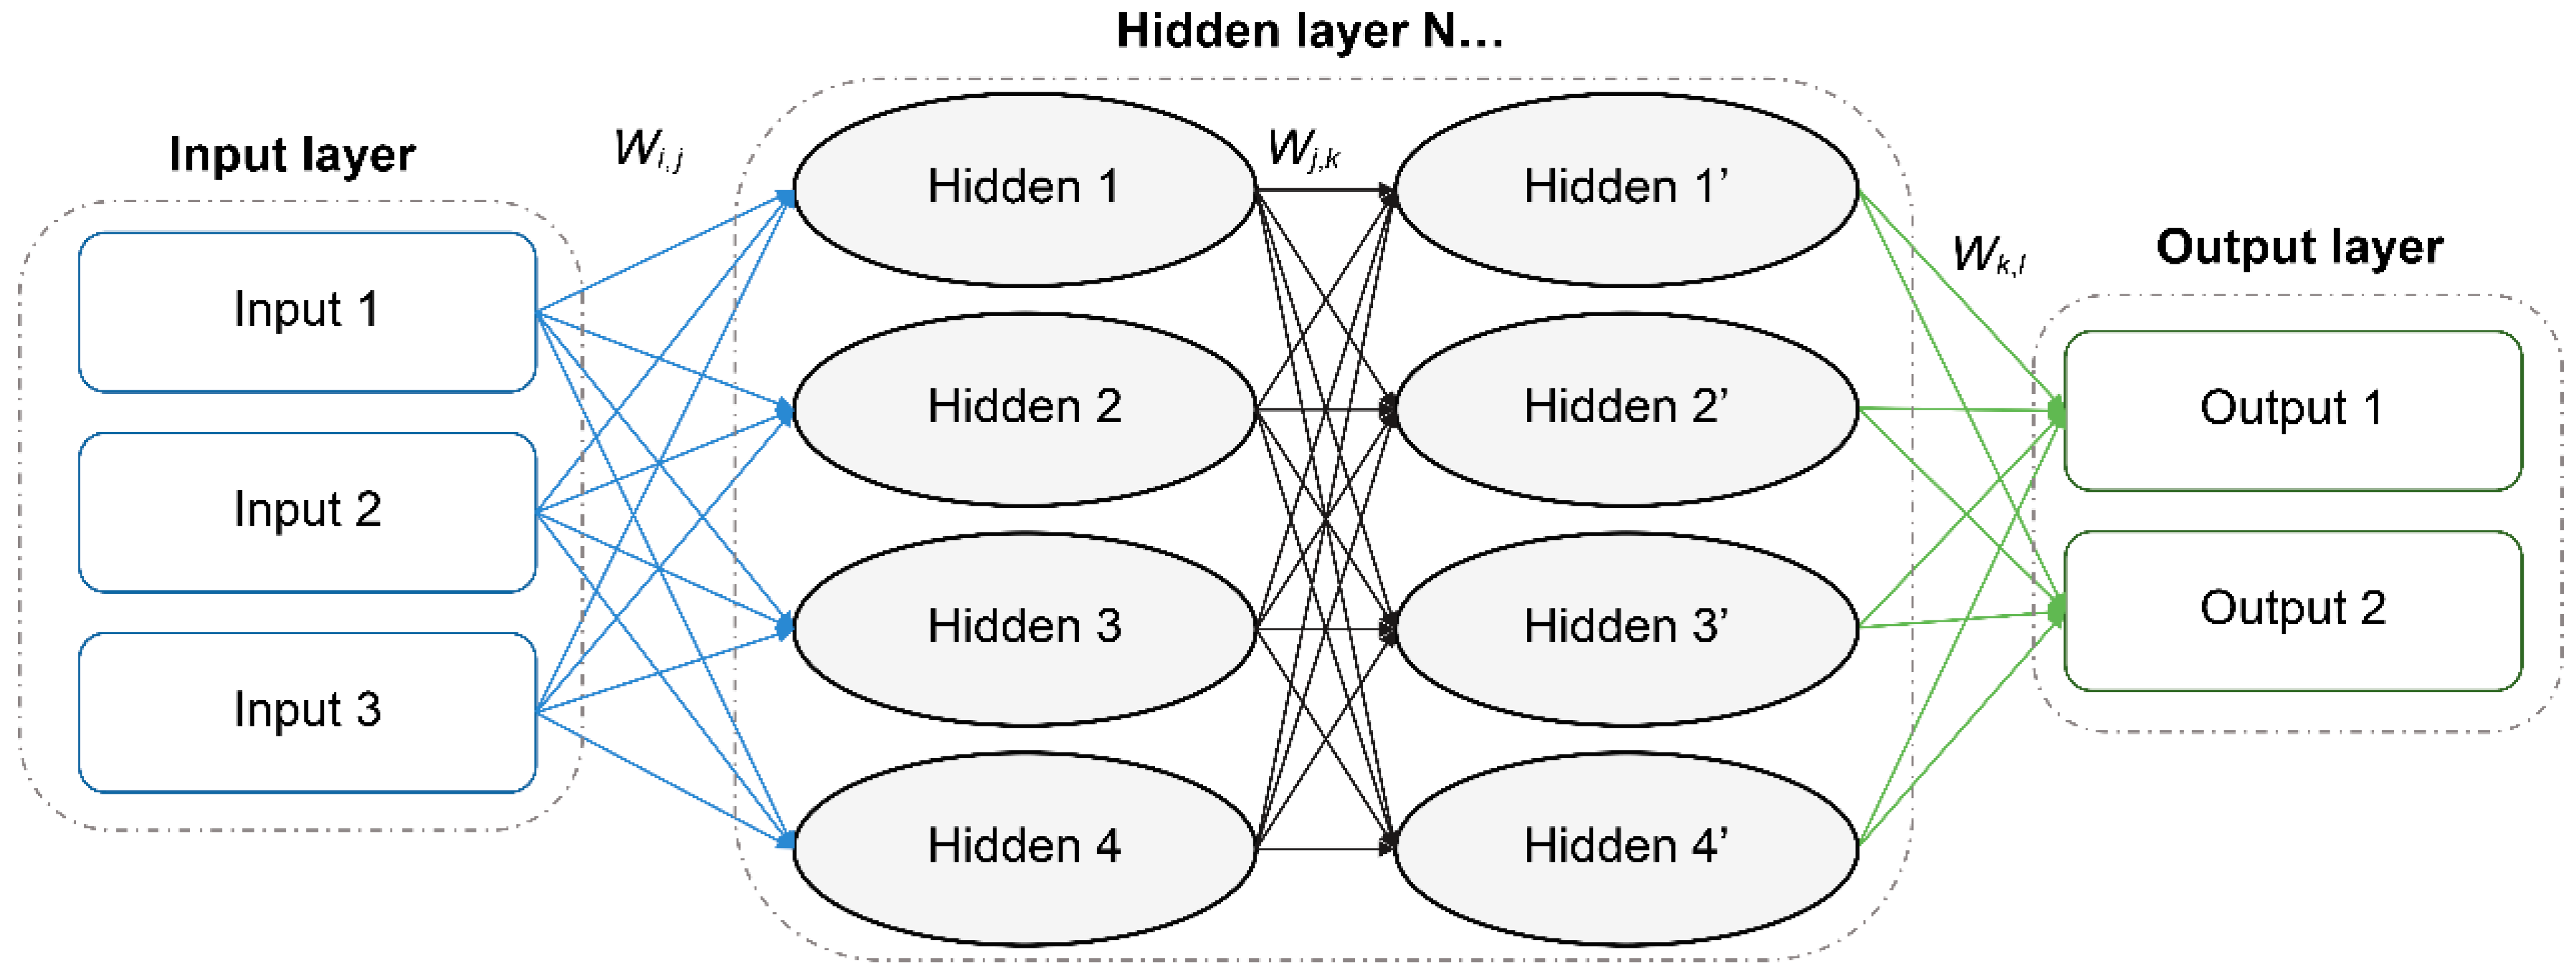
45]. Artificial neural network is an algorithm derived from the concept of the human brain. It uses neurons, or so-called perceptrons, as a unit to calculate outputs in response to given inputs. For complex or nonlinear analysis, this algorithm can use big data to deduce predictions. This study will use the conjugate gradient method with the iterative search concept to define the weighting coefficients. In MLP models, the hidden layers and sampling of the batch should also be defined. The connecting and weighting mechanism by two hidden layer structures [
67] is shown in
Figure 6. The feed-forward characteristics make the system prediction accuracy largely dependent on the data input [
68]. The optimal solution for the weights connecting to the gradient is defined after the model is tested.
In this nonparametric model, we will use the sigmoid function as the perceptron for expressing the nonlinear features of the data. It is expressed as follows [
67]:
In the N-dimensional network, the weighting and offset () are defined for the activation function used for MLP models. The gradient descent methodology achieves convergence of the result using the activation function. The test data verification mechanism can identify the optimal solution for the nonparametric model. The mean square error (MSE) and root mean square error will be regarded as the loss function of the MLP model to measure the performance of the system. Finally, companies can combine the reliability forecasts of different service items to define the optimal service program.
5.5. Simulation
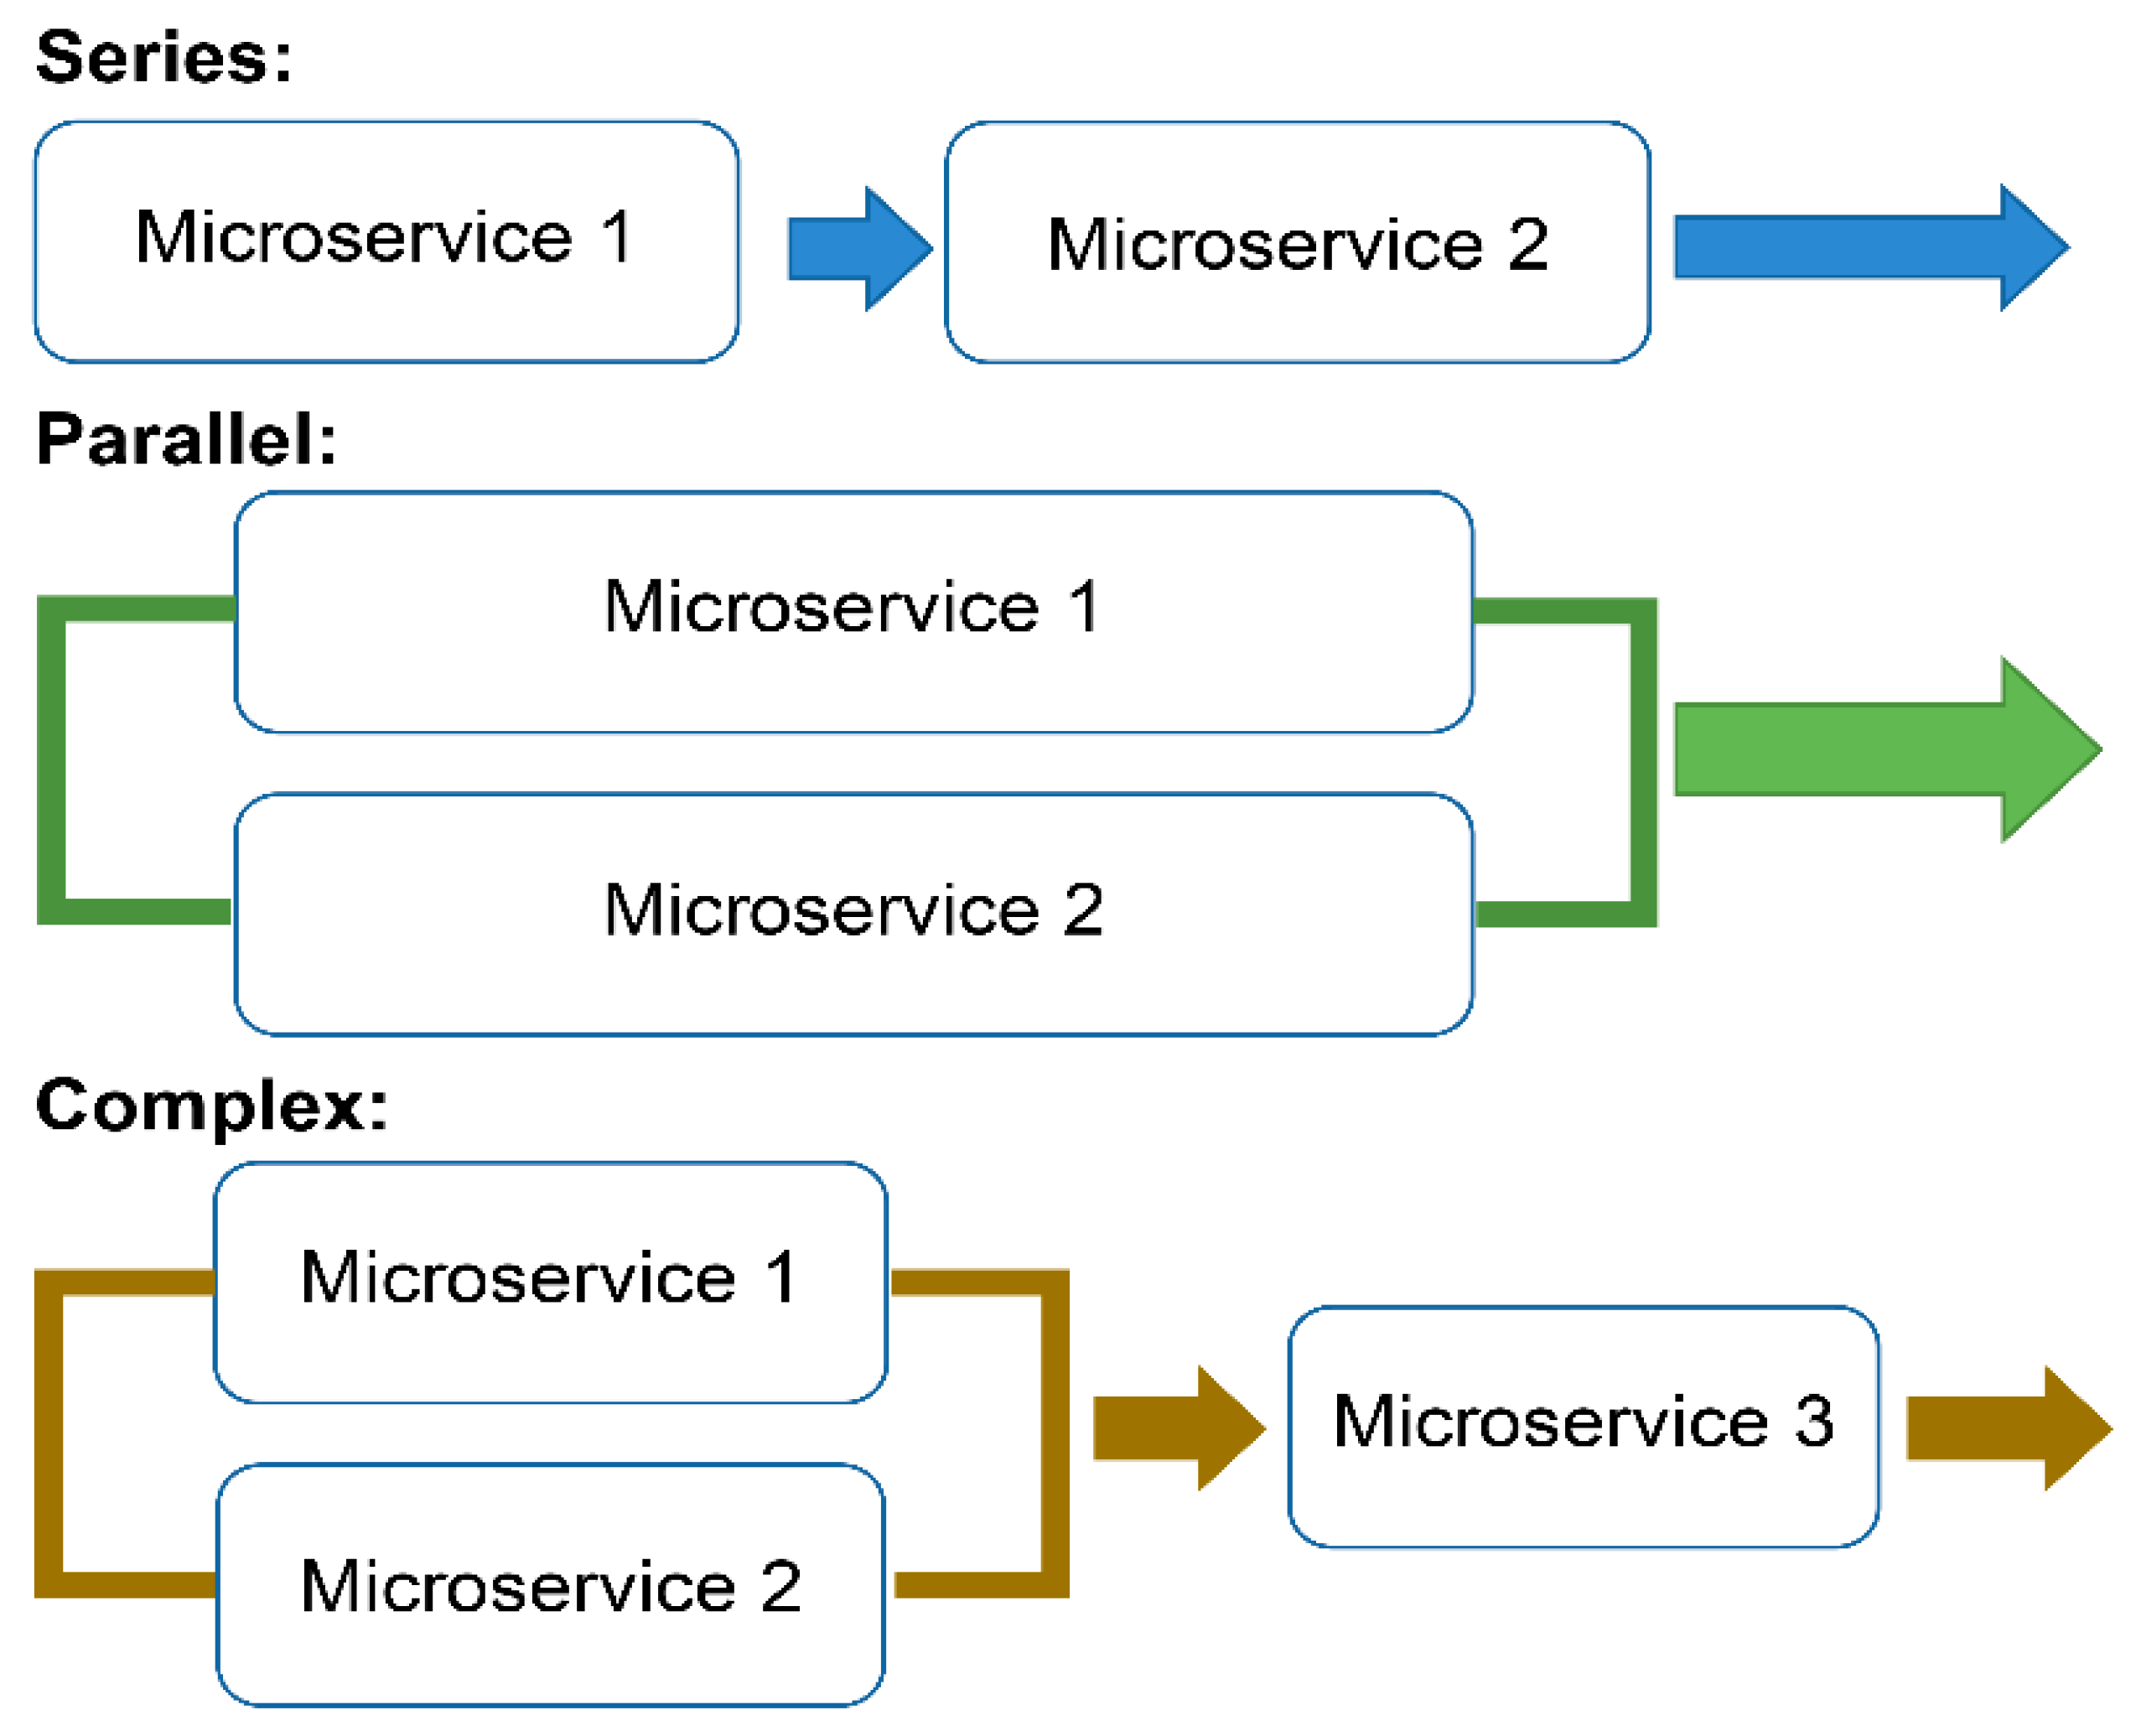
In the simulation system, we will introduce the composition of series, parallel and complex structures to analyze the final results. Reliability analysis plays the role of evaluation and improvement [
34]. Companies should consider the orientation of all stakeholders to define the balance efficiency point through value cocreated. Decision makers would identify the potential risk by scenario analysis through the analysis of the reliability simulation system [
41]. Three simulation architectures, which are series, parallel and multiple complex structures, are shown in
Figure 7. In application, the basic structural unit (single, series or parallel) will be integrated to derive various structures in practice [
35]. The system can stack up the corresponding environment for discussion by analyzing the application in each situation.
In the state of the series connection of microservice systems, reliability analysis can be divided into
Deriving from Equation (4),
stands for the reliability of the series structure. For setting the reliability block diagram, duplicate or time redundancy is checked for its function performing. Because the system may have more than one mean in an item, the redundancy design can help improve the common failure mode [
35]. The independent element analysis within the structure will affect the final failure performance of the system.
For a parallel structure, the probability of a minimum m pass could be represented as
under n times Bernoulli trial. In the observations, the MTTF and the failure ratio can also be used to define parallel reliability. Two services in parallel can be connected in series in their respective systems to expand services (
Figure 7).
defines the reliability of the complex architectural system contributed by two different structures. In the complex system shown in
Figure 7, we analyze Microservice 1 and 2 as parallel systems connecting to Microservice 3 in series. In various engineering scenarios, the configuration and composition of complex structures will affect the reliability of the overall system. The next issue that manufacturing companies will face is defining the optimal combination with the trade-off between cost and quality.
6. Results and Discussion
Empirically, we will use the cooperation data of three multinational listed companies to conduct service quality and analysis to improve service and innovation. In this study, we will discriminate 330,837 datasets within four microservices for modeling and simulation construction. With Python, Keras, Tensorflow and Reliability packages used for modeling evaluation, we can integrate different models in the same platform. For data creation and connection, we used MSSQL and MySQL servers to retrieve and query system data. The failure data must be identified, such as systematic, component and product failures [
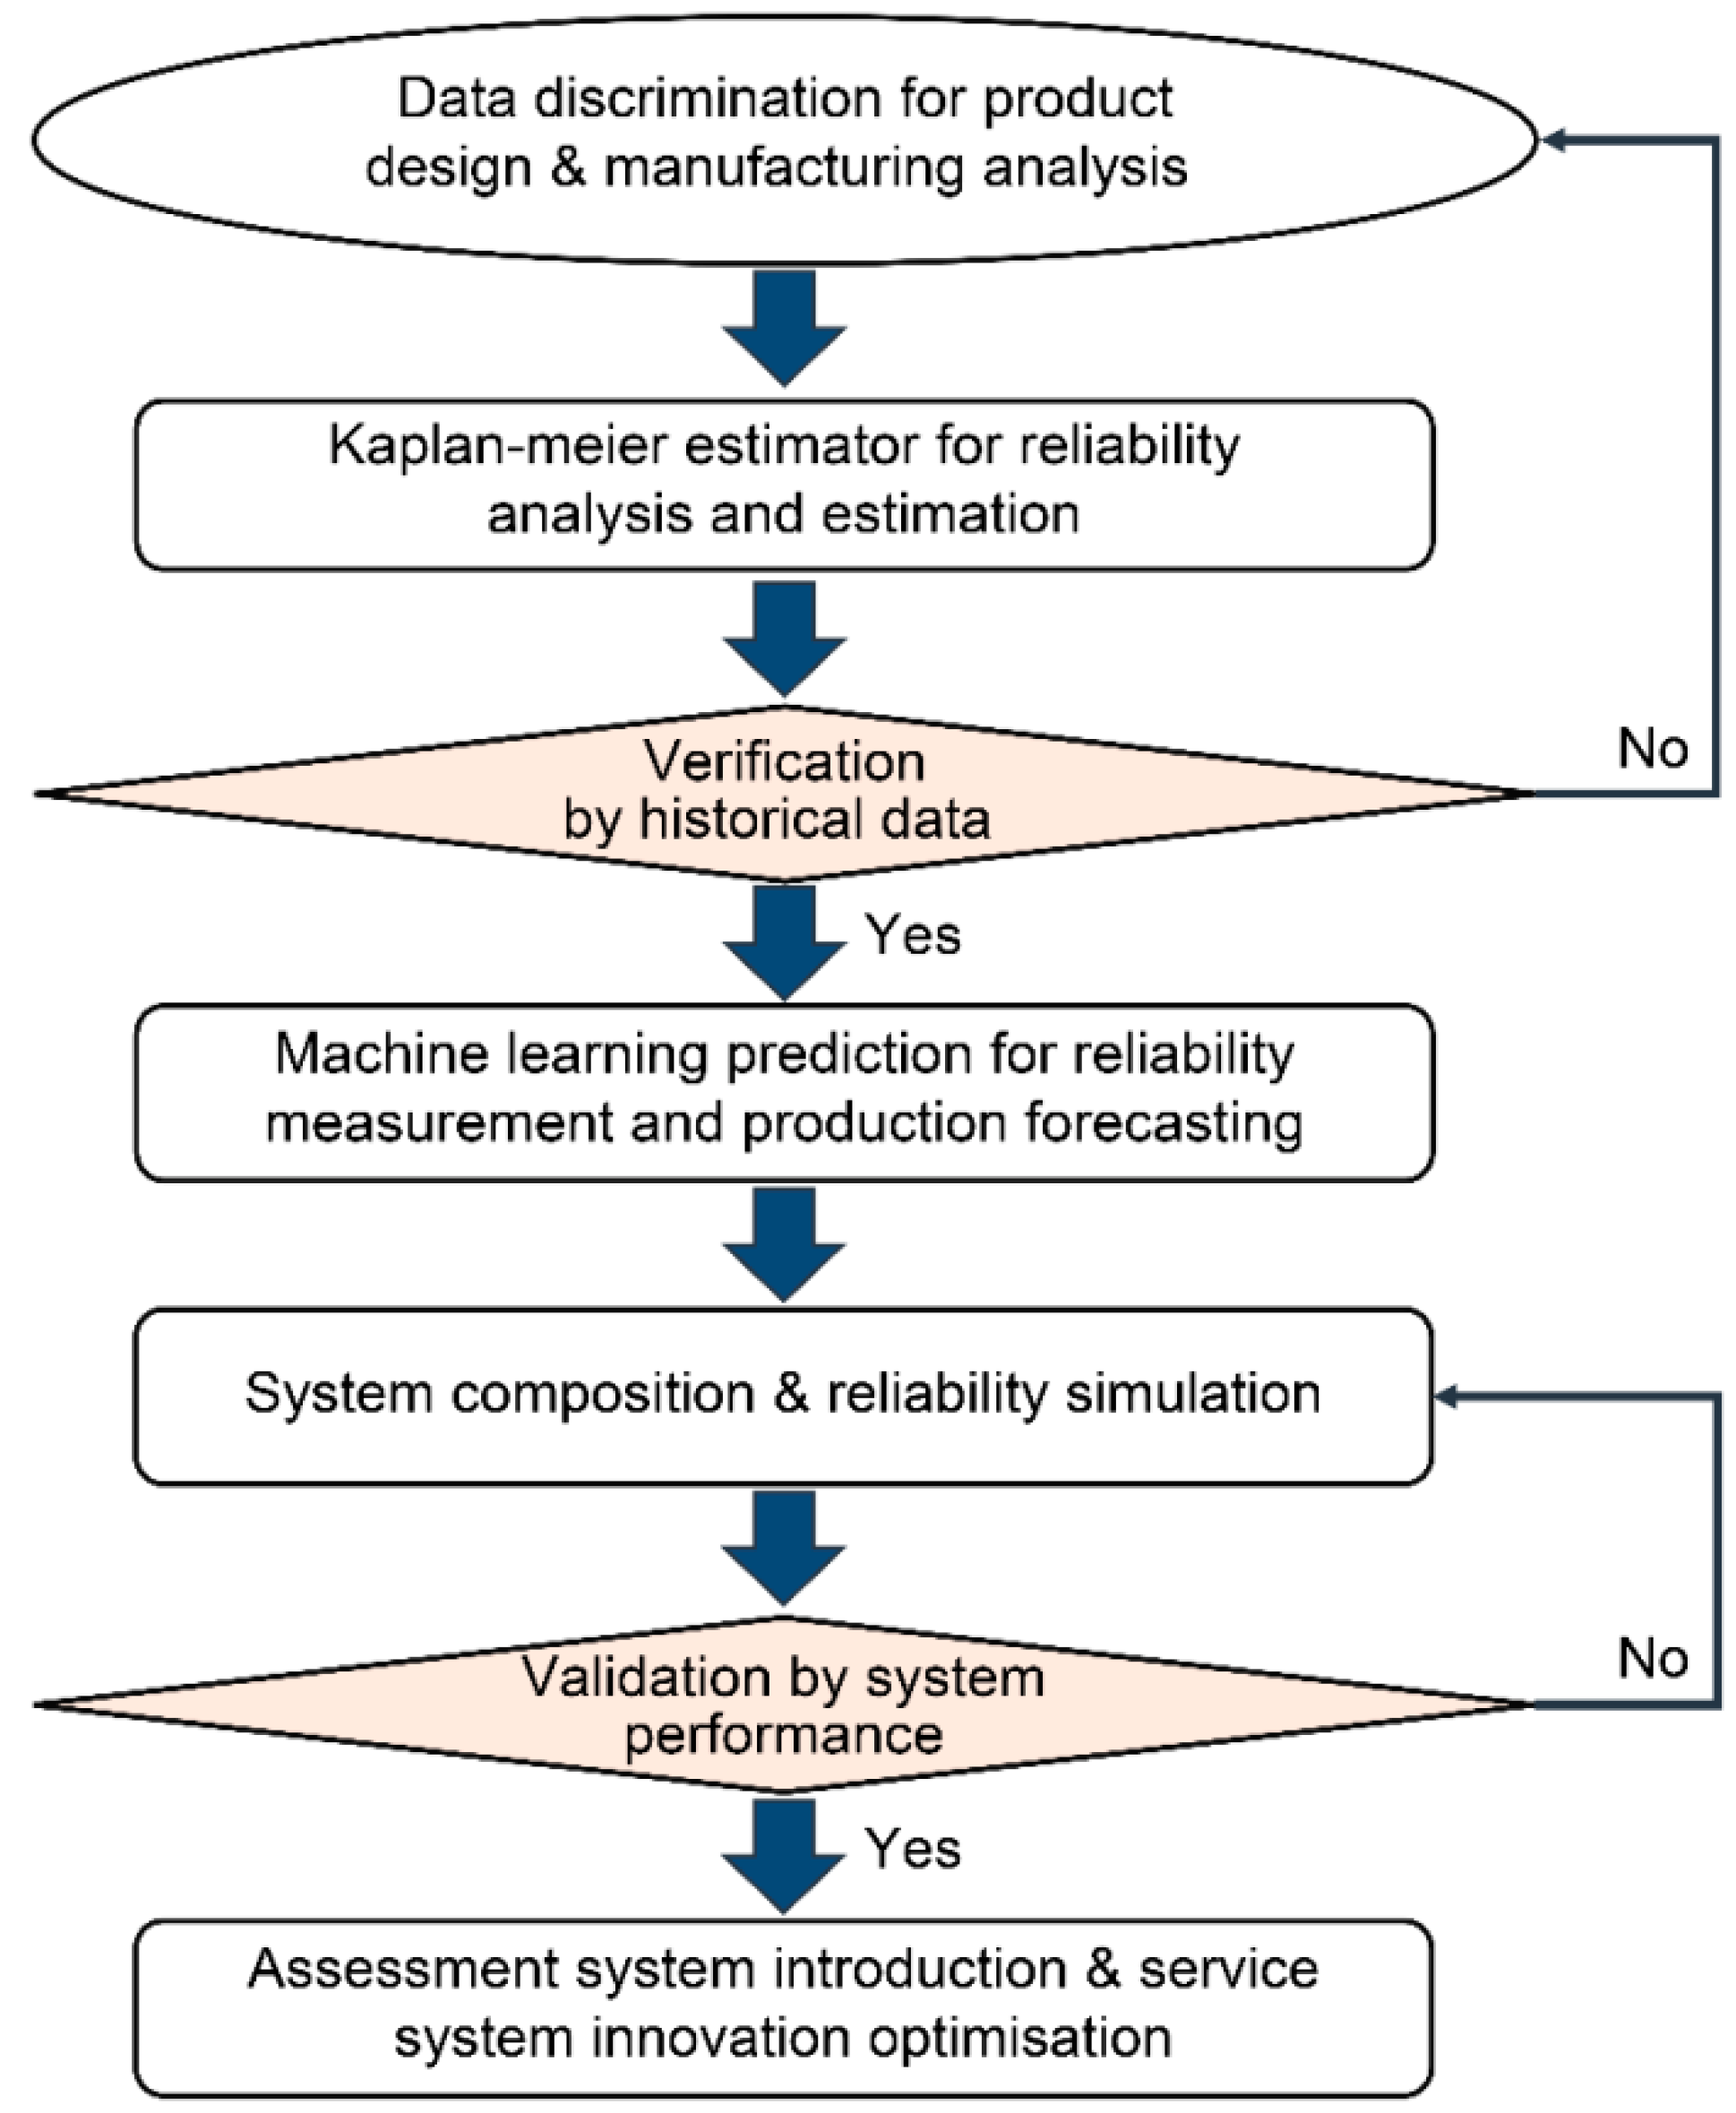
12]. According to
Figure 8, the Kaplan–Meier methodology is used to analyze the failure ratio and MTTF to define the reliability function. To gain a model with higher accuracy, the introduction of the MLP algorithm will increase the reference for prediction. Two verification stages defined for reliability function and simulation model checking make the system applicable. Finally, we will use additional practical data to verify the final results and make adjustments to decisions.
Data Extraction and Results
With the development of the Industry 4.0 architecture, each microservice is equipped with a corresponding monitoring mechanism. When a failure occurs, the system can notify relevant personnel and access corresponding information in the meantime. The configuration logic of the database will affect the completeness of information analysis during data collection. We will delete the comparison datasets based on the causal analysis results by concatenating different data tables. The data on the product side are related to external environmental factors, not service system issues, and will not be considered. The problems of the service system may be difficult to identify in the data, and detailed data analysis is required. The MTTF and failure ratio can be defined and measured after data cleaning and concatenation.
Table 1 will plan the data arrangement using one of the microservice systems as an example.
In the measurement, the data will be arranged by different electronic serial number, and the failure rate of the microservice system will be integrated and analyzed in real time. Furthermore, the data collation list shows the individual failures and accumulated time.
In the construction of reliability functions and AI prediction models, the impact of censored data must be evaluated in the simulation of the final system.
Table 2 shows the system reliability assessment conclusion constructed by the Kaplan–Meier methodology. Using the Microservice 2 as an example, the censoring code shows the initial mastery of the data acquisition system on the manufacturing status. In the estimation of the survival rate, system data were processed in the discrimination stage, so the estimated value varies according to the characteristics of each microservice. For the estimation analysis, we can analyze the confidence interval of the estimated value with upper and lower bound to define the boundary value. We use the nonparametric MLP model to predict the reliability of the corresponding service after the definition of the reliability function is completed. The results in
Table 3 show the predicted reliability of each microservice system. Because of the various features of each service system and the number of remaining features in different microservices, this will affect the proportion and time. For evaluating the failure rate, we define the corresponding ratios and root causes of the main failure events based on the failure mode and effects analysis report [
69]. Comparing the results of the practical verification and prediction, the accuracy of the AI model will be presented.
In the configuration, the values of hidden nodes and conjugate gradient are shown in the setting field. To improve the model’s explanatory power, the hidden nodes of microservices are three, and the iterations are 10,000 times. In terms of error evaluation, the analysis of residuals shows that this nonparametric MLP model has a lower error value. In the definition of the AI model, we will use MSE as the loss function to confirm the accuracy of the model. The MSE of this model is within 0.00032 (
Table 3), and the average is only 0.00024. However, to clearly define the frequent failure ratio of microservice, we refer to the design documents, PFMEA, DFMEA and historical data to obtain the reliability of each service system [
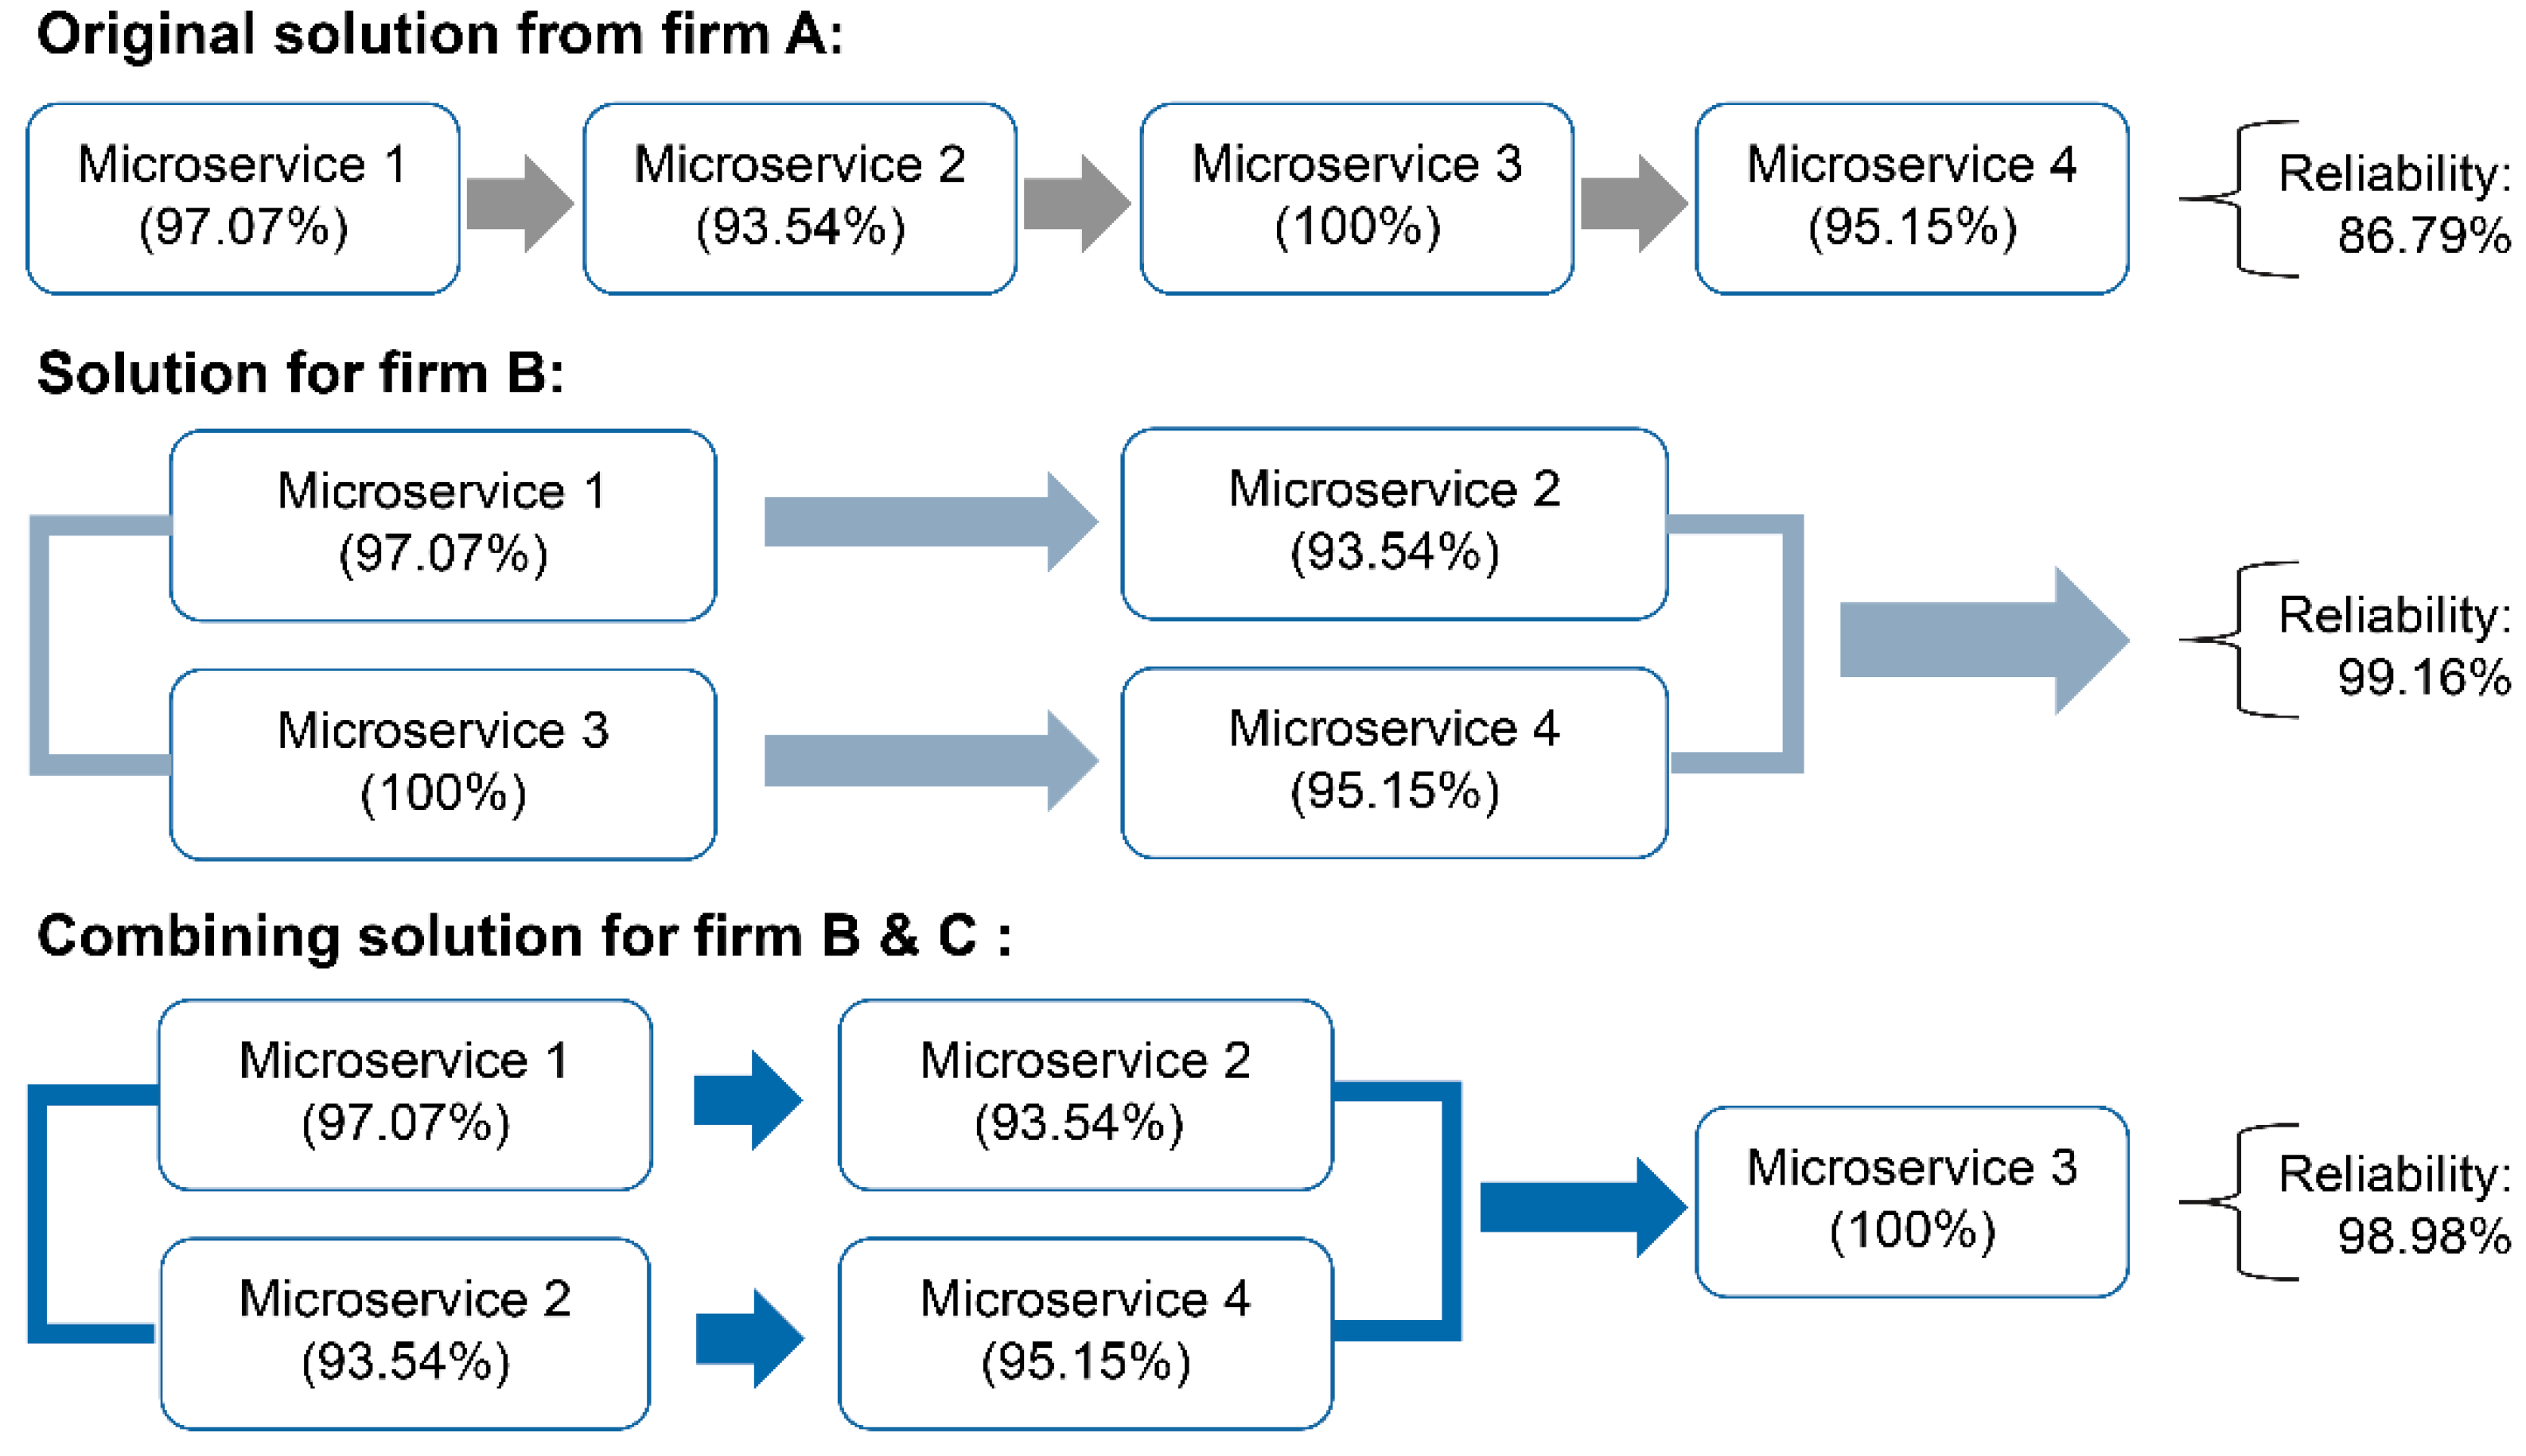
70]. Regarding the design guidelines of Firm B and C, the malfunction defined in the microservice system can be closer to the actual situation. The simulation and analysis results of three main service scenarios are shown in
Figure 9. The service provider Firm A must provide four microservices to Firm B and C for production operations. The reliability of the four microservice systems has been defined in related documents and prediction models and is shown in
Figure 9. Considering the individual requirement of each company, the system architecture is moving toward modular design in terms of improvement and integration [
71]. After partitioning the system with the architecture shown in
Figure 5, various microservices deliver different solutions.
In the original architecture, the cascade of systems will affect the overall reliability of each service, resulting in only 86.79%. Under the demand-oriented design for Firm B, the reliability is greatly improved owing to its parallel structure. Although the service system has high mobility characteristics, it still has to refer to the requirements of most cooperating manufacturers during construction and modification. Following the exploration and simulation of numerous service combinations, various service functions and combinations will help enterprises optimize service quality. We merged some of the necessary demand functions of Microservice 1 and 4 into Microservice 3 by combining the requirements of the two major multinational automobile manufacturers. The overall reliability of the final proposed model can reach 98% after arranging the reliability of each microservice system, although the reliability compared to the solution that only considers Firm B is lower. The final solution can consider both services without causing poor quality. Compared to the original structure and the actual situation, Firm A has increased the overall reliability by ~12.09% after introducing this framework and solution. In this model, the variation and combination of the system are adjusted based on manufacturer cooperation, and the introduction of the S-D concept will allow for more details to be considered. In terms of service innovation, this new architecture and solution are applied to the service with other vendors to expand the various markets. The value proposition will become more diverse after being dynamically validated by third parties.
7. Conclusions and Future Works
This study proposed a theoretical framework for service innovation and quality inspection that incorporates S-D logic and microservice architecture. Companies can refactor the system to improve scalability and compatibility under the digitalized architecture of Industry 4.0. Referring to third-party considerations during the service provision and verification stages can achieve value cocreation. In this study, we used the Kaplan–Meier estimation methodology and MLP model to predict reliability. In deduction, using the NASDAQ-listed company (Firm A) and the world’s two major automakers (Firm B and C) as cases, the microservice reliability system was built and simulated to define the best solution and assist decision making, and eventually be implemented and validated. The average loss function (MSE) of the reliability model was only 0.00024 in the application scenarios of the four microservice systems. Combining different microservice systems and constructing corresponding problems in practice will expand the simulation system usage scenarios. Using the predictive models, the company can improve its service quality by 12% through simulation results and innovative architecture. Finally, firms can use this validated innovative architecture to expand their business model. This innovative process and inspection framework have been introduced between NASDAQ-listed companies and multinational automobile brands. Service-oriented verification and modification of the corresponding structure will continue.
In future research, we will divide the recommendations into two categories: research methodology and service architecture for ecosystems. The use of advanced AI models to analyze complex problems is the future trend, with the rapid development of computational statistics. Most companies will be able to extract huge amounts of data by utilizing the data collection framework. Scholars can analyze the features of the data in each service system and select appropriate models for applications. Nowadays, companies’ roles in the ecosystem are not limited to a single one. The limitation of this study is that it is difficult to analyze complete cooperation networks within the value chain. A major focus of the analysis will be on how companies play self-worth in the ecosystem. Exploring the introduction of the system of business models along with the service system architecture is another practical research direction.


