Article

Assessment of Radiofrequency Exposure in the Vicinity of School Environments in Crete Island, South Greece

by
Theodoros N. Kapetanakis
1,2,
Melina P. Ioannidou
3,
Anargyros T. Baklezos
1,2,
Christos D. Nikolopoulos
1,2,
Eleftheria S. Sergaki
4,
Antonios J. Konstantaras
1,2 and
Ioannis O. Vardiambasis
1,2,*
1
Department of Electronic Engineering, Hellenic Mediterranean University, 73133 Chania, Greece
2
ATHENA European University, 11742 Athens, Greece
3
Department of Information and Electronic Engineering, International Hellenic University, 57400 Thessaloniki, Greece
4
School of Electrical and Computer Engineering, Technical University of Crete, 73100 Chania, Greece
*
Author to whom correspondence should be addressed.
Appl. Sci. 2022, 12(9), 4701; https://doi.org/10.3390/app12094701
Submission received: 12 April 2022 / Revised: 29 April 2022 / Accepted: 4 May 2022 / Published: 7 May 2022
(This article belongs to the Collection Electromagnetic Antennas for HF, VHF, and UHF Band Applications)

Abstract

:
This study aimed to estimate the radiofrequency exposure levels in the vicinity of nursery and primary schools at the northwest part of Crete island in Greece. Moreover, the compliance with the exposure limits, according to Greek legislation, was investigated. A total of 396 in situ frequency-selective and broadband measurements were conducted around 69 schools, classified in urban and suburban environments, in the range of 27–3000 MHz (subdivided in seven frequency bands). The measured value of the electric field strength (V/m) was recorded and, subsequently, the exposure ratio was calculated. Statistical analysis was performed in order to analyze and evaluate the data. In addition, a worst-case scenario was examined by considering the highest measured exposure level around each school. The statistical tests indicated that the mean and median values of the exposure ratio, even in the worst-case scenario, were found well below 1 for all frequency bands. The calculated distributions of the electric field measurements demonstrated that almost 90% of the latter were below 1 V/m, with the majority of values lying in the range of 0.5–1 V/m. The main contributors to the total exposure were the mobile communication frequencies and broadcasting, while the exposure was greater in urban than in suburban environments.

1. Introduction

The operation of radio-frequency (RF) electromagnetic field (EMF) sources, especially in residential areas, has been a matter of concern over recent years. The growing demand for wireless communications in recent decades has resulted in the installation of a rapidly increasing number of RF emitters. Thus, there is a strong interest in assessing the potential health hazards associated with RF radiation, especially in environments where sensitive population groups are present such as schools, hospitals, and eldercare facilities. A great number of experimental studies have been performed in an attempt to evaluate the exposure of the public to nonionizing radiation emitted by RF sources. A systematic review of the studies conducted in Europe between 2000 and 2015, on the public RF exposure in everyday environments, has been presented by Sagar et al. [1]; an update for the period between 2015 and 2018 has also been reported [2].
Information about RF exposure levels in environments relevant to children, such as schools, kindergartens, and playgrounds, may be found in the literature [3,4,5,6,7,8,9,10,11], but, generally, the investigation of children’s EMF exposure is somewhat limited. Outdoor and indoor environmental, as well as personal, RF exposure has been examined in places where children are mostly present. Bhatt et al. [3] conducted EMF measurements in kindergartens in Melbourne, Australia; Gallastegi et al. [4] carried out spot and personal measurements in homes, schools, and parks in Spain; Yener et al. [5] performed spot measurements at RF and extremely low-frequency (ELF) bands inside and outside school buildings in Turkey; while the personal exposure of children to RF-EMF radiation in Europe has been extensively studied by Birks et al. [6]. Moreover, several researchers have examined the RF exposure of children in microenvironments, by conducting indoor measurements in homes, schools, and crèches in Belgium and Greece [7] and in Amsterdam schools [8]. In addition, a study of the temporal variation in children’s RF exposure in homes and schools has been presented [9].
Recently, Christopoulou and Karabetsos [10] reported the results of an experimental campaign carried out by the Greek Atomic Energy Commission (EEAE); in situ measurements of RF-EMFs and ELF electric and magnetic fields were carried out in children’s playgrounds all over Greece, in urban and suburban areas. Furthermore, a statistical analysis for the RF exposure levels in Greek schools, based on pilot measurements conducted in 65 schools, was presented by Kiouvrekis et al. [11]. Other studies, regarding the general public RF exposure in Greece, include the continuous monitoring of the EM radiation in the environment [12,13], the performance of measurements in the vicinity of base stations all over Greece [14], and the development of a national telemetric network to monitor the EMF levels from all kinds of antenna stations in the range of 100 kHz–7 GHz [15]. In addition, the occupational exposure to EMFs has been investigated in specific workplaces in Greece [16].
In this study, we present the results of frequency-selective and broadband EMF measurements conducted around schools in Crete island, Greece, in the frequency range of 27 MHz–3 GHz. The electric (E-) field strength was recorded in seven specific bands, as well as in the whole aforementioned range. The exposure ratio was calculated and the results were statistically analyzed and evaluated by examining the compliance with the established exposure reference levels for RF exposure in Greece.

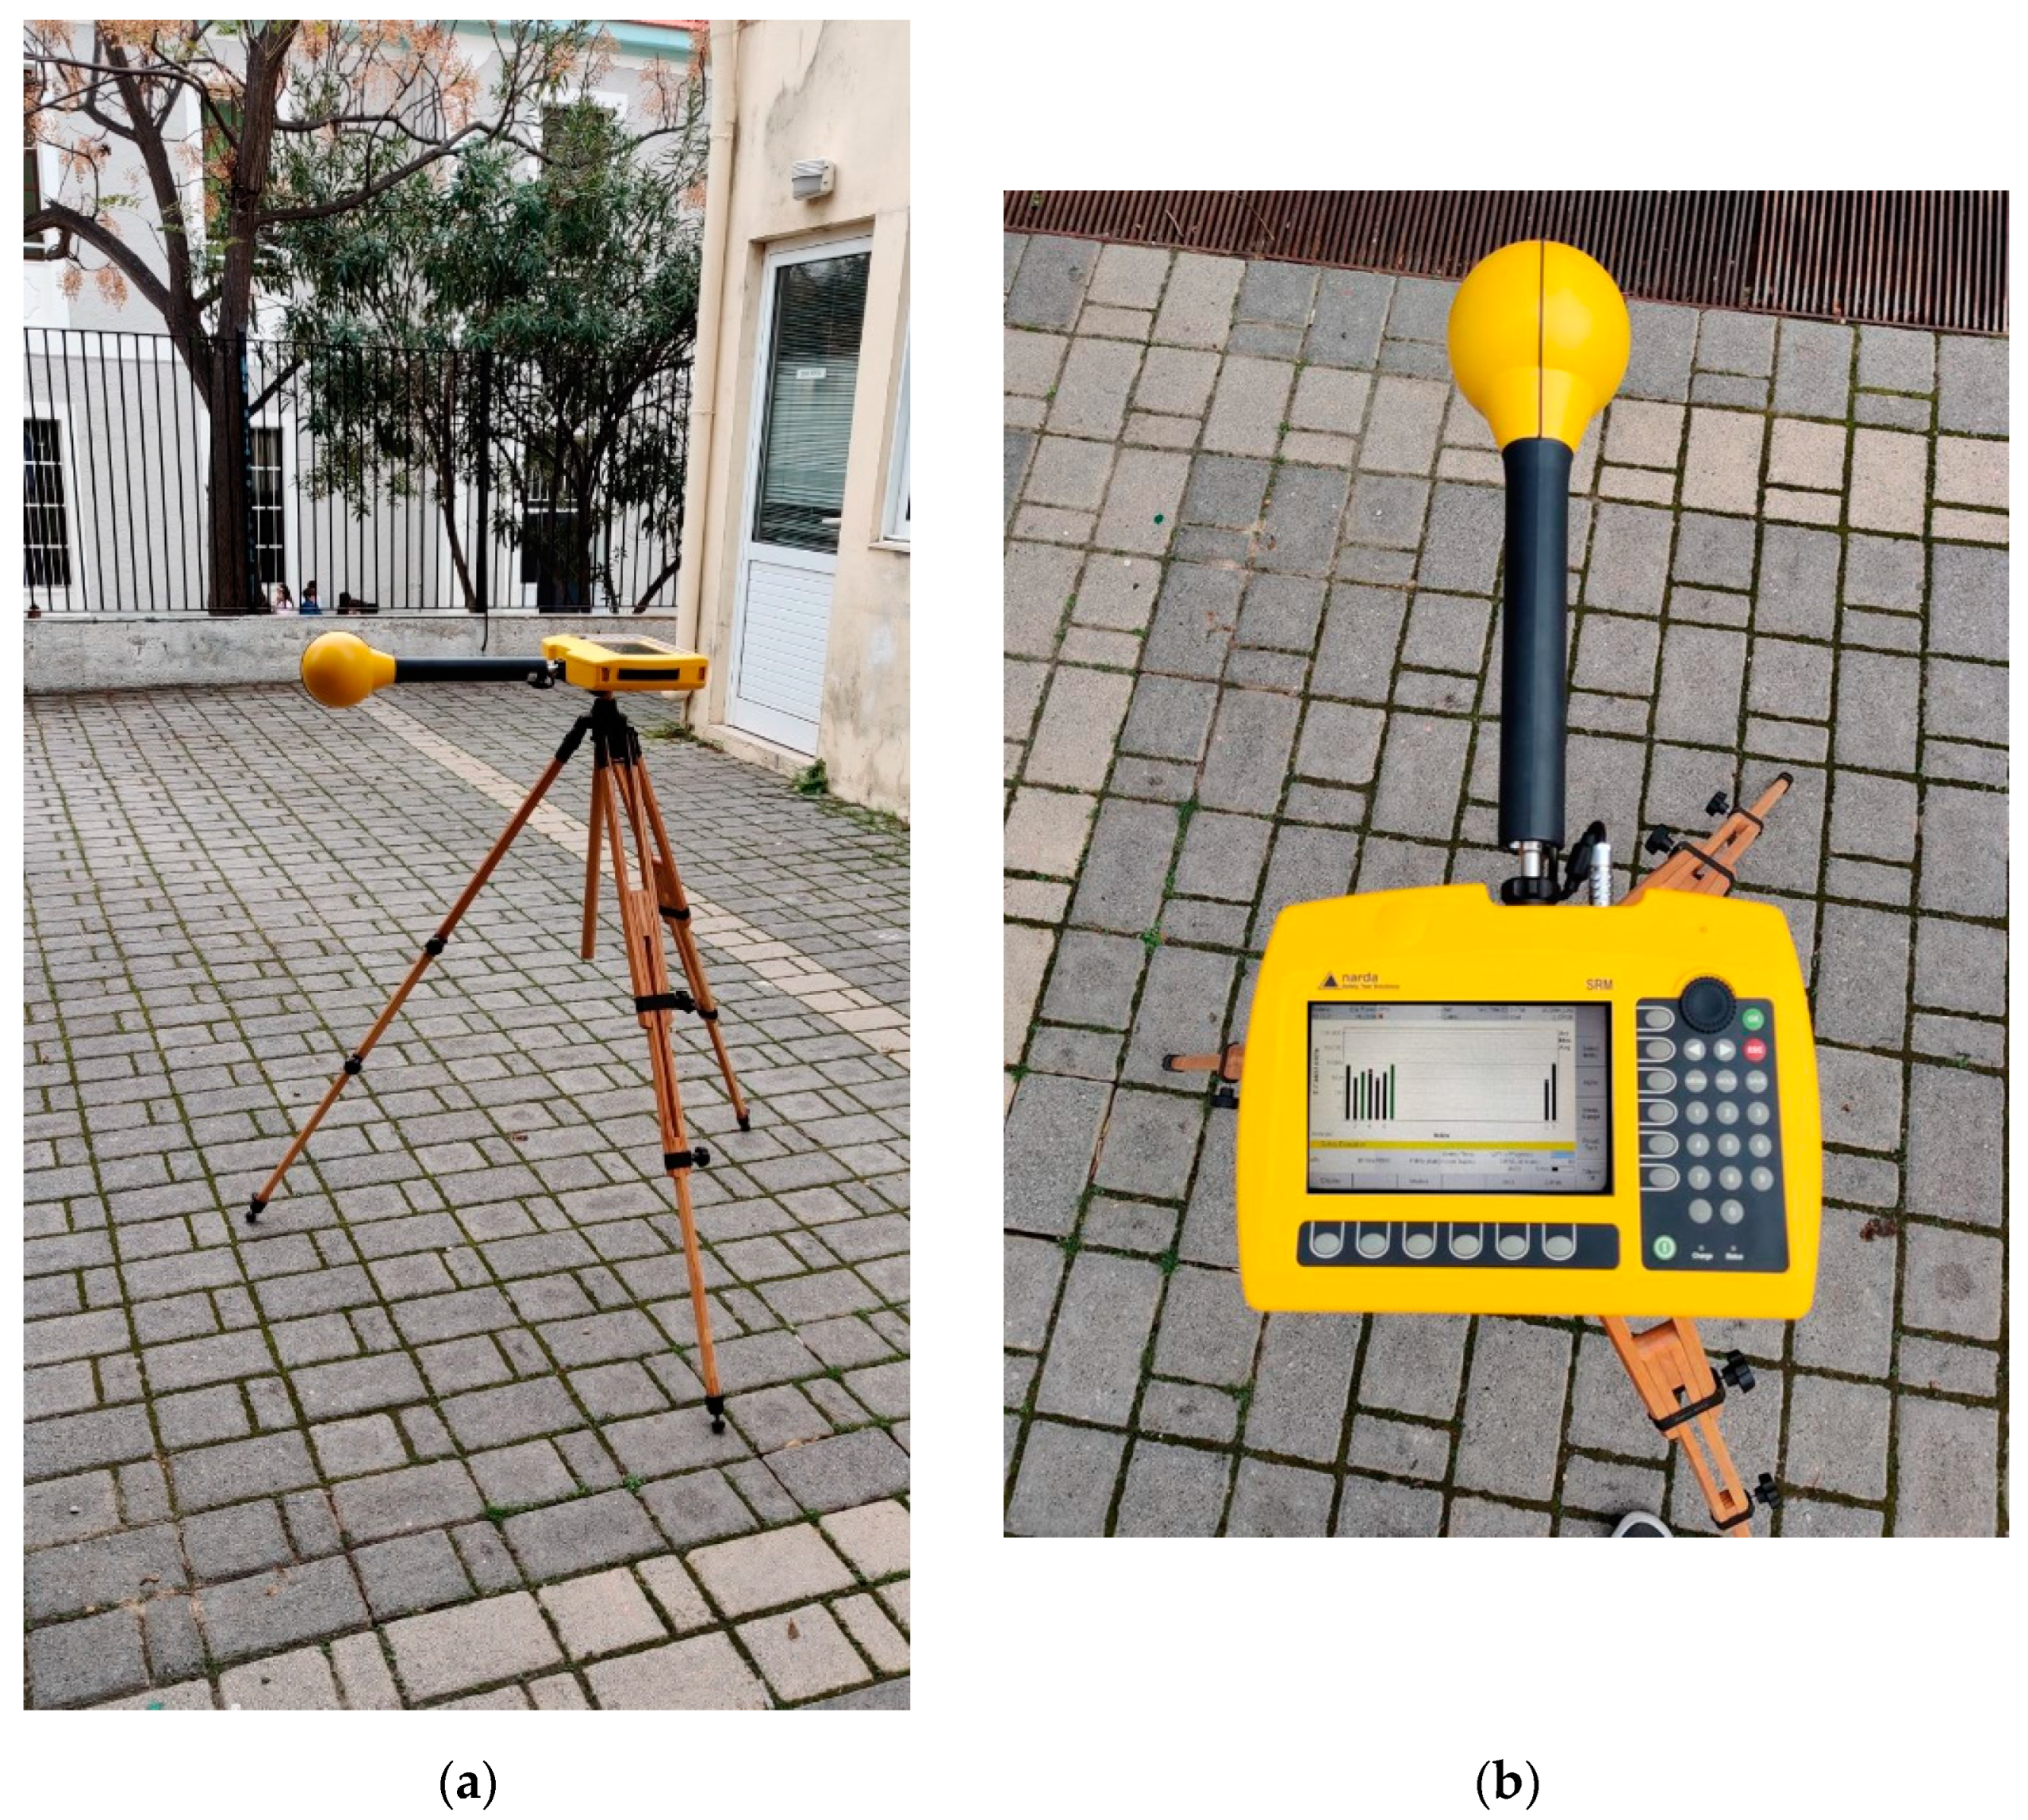
2. Materials and Methods

The EMF measurements were conducted during an experimental campaign of the Telecommunications and Electromagnetic Applications Laboratory of the Department of Electronic Engineering of the Hellenic Mediterranean University, on RF exposure levels estimation in the vicinity of nursery and primary schools at the broad area of the municipality of Chania (population about 110,000), which is located in the northwest part of Crete island in Greece. The time period of the measurement campaign was during May, June, and September 2018.
The selective radiation meter SRM-3006 (Narda Safety Test Solutions, Pfullingen, Germany) at 9 kHz–6 GHz was used. The Narda 3501/03 three-axis (isotropic) E-field antenna (frequency range: 27 MHz–3 GHz, dynamic range: 0.2 mV/m–200 V/m) was adapted to the basic unit. The expanded measurement uncertainty for the electric field strength, in conjunction with the SRM basic unit and 1.5 m RF cable, valid for the temperature range of + 15   ° C to + 30   ° C, is +3.3/−5.3 dB (worst case) according to the Narda datasheet [17]. However, the estimated sampling uncertainty should also be taken into account by summing the squares [18]. Thus, the end result of the calculations for the uncertainty (worst case) is +4.5/−6.1 dB (confidence level 95%).
The measurements were conducted around 69 nursery and primary schools, named simply as schools hereafter. Calibration was performed at the beginning of the measurement set, in the vicinity of each school. The points of interest were selected in the vicinity of each school by surveying the area and avoiding proximity to objects as indicated in [19]. Moreover, the sweep method [19] was used in order to determine the most appropriate measurement locations.
The radiation meter SRM-3006, in connection with the three-axis E-field antenna, has the capability to perform broadband and frequency-selective measurements simultaneously. The result of any broadband measurement, as given by the radiation meter, is a single value of the electric field strength that corresponds to the entire frequency range (i.e., 27 MHz–3 GHz) and is denoted as “total” in the last line of Table 1. The frequency-selective measurements comprise recordings of the electric field strength from 7 distinct frequency bands; the latter are listed in the first column of Table 1.
A total of 396 in situ audits were performed. Each audit comprised both broadband and frequency-selective recordings, as explained in the previous paragraph. Τhe results were grouped per environment type; 168 audits were conducted around 29 schools in urban areas, whereas the remaining 228 audits were carried out in the vicinity of 40 schools in suburban environments. During each audit, measurements were performed with the radiation meter attached onto a wooden tripod at three different heights: 1.1, 1.5, and 1.7 m [20]. Figure 1 depicts the experimental setup used in this study, i.e., the selective radiation meter with the isotropic antenna, attached onto the wooden tripod at a height of 1.1 m.
At each height i (i = 1, 2, 3 for 1.1, 1.5, and 1.7 m, respectively) and frequency band f, the measured value of the electric field strength (V/m), averaged over 6 min, was recorded and is denoted by E i , f j ; the superscript j is used to identify the specific measurement points; thus, j = 1, 2, …, 396. Hereafter, the mean value of E i , f j , i = 1, 2, 3 is taken into consideration, for the frequency band f, i.e., E f j = ( 1 / 3 ) i = 1 3 E i , f j . In the case of exceptionally high values of the measured electric field strength, an effort was made to pinpoint possible radiation sources in the area and determine whether the measurement location was along the direction of the maximum radiation intensity of the source.
The exposure ratio λ f j may be defined as [20]
λ f j = ( E f j E l i m , f j ) 2 ,
where E l i m , f j is the corresponding reference level; the latter is defined by the International Commission of Non-Ionizing Radiation Protection (ICNIRP) [21]. However, it should be noted that, according to Greek legislation [22,23], the established reference levels for general public exposure in the vicinity (i.e., 300 m from the perimeter) of schools and kindergartens in Greece are set to 60% of the 1999 EU Council’s reference level values [24]. Thus, E l i m , f j , in Equation (1), is taken as equal to the Greek reference level in all calculations presented in this paper (Table 2). The total exposure ratio, for point j, is given by:
Λ j = f λ f j

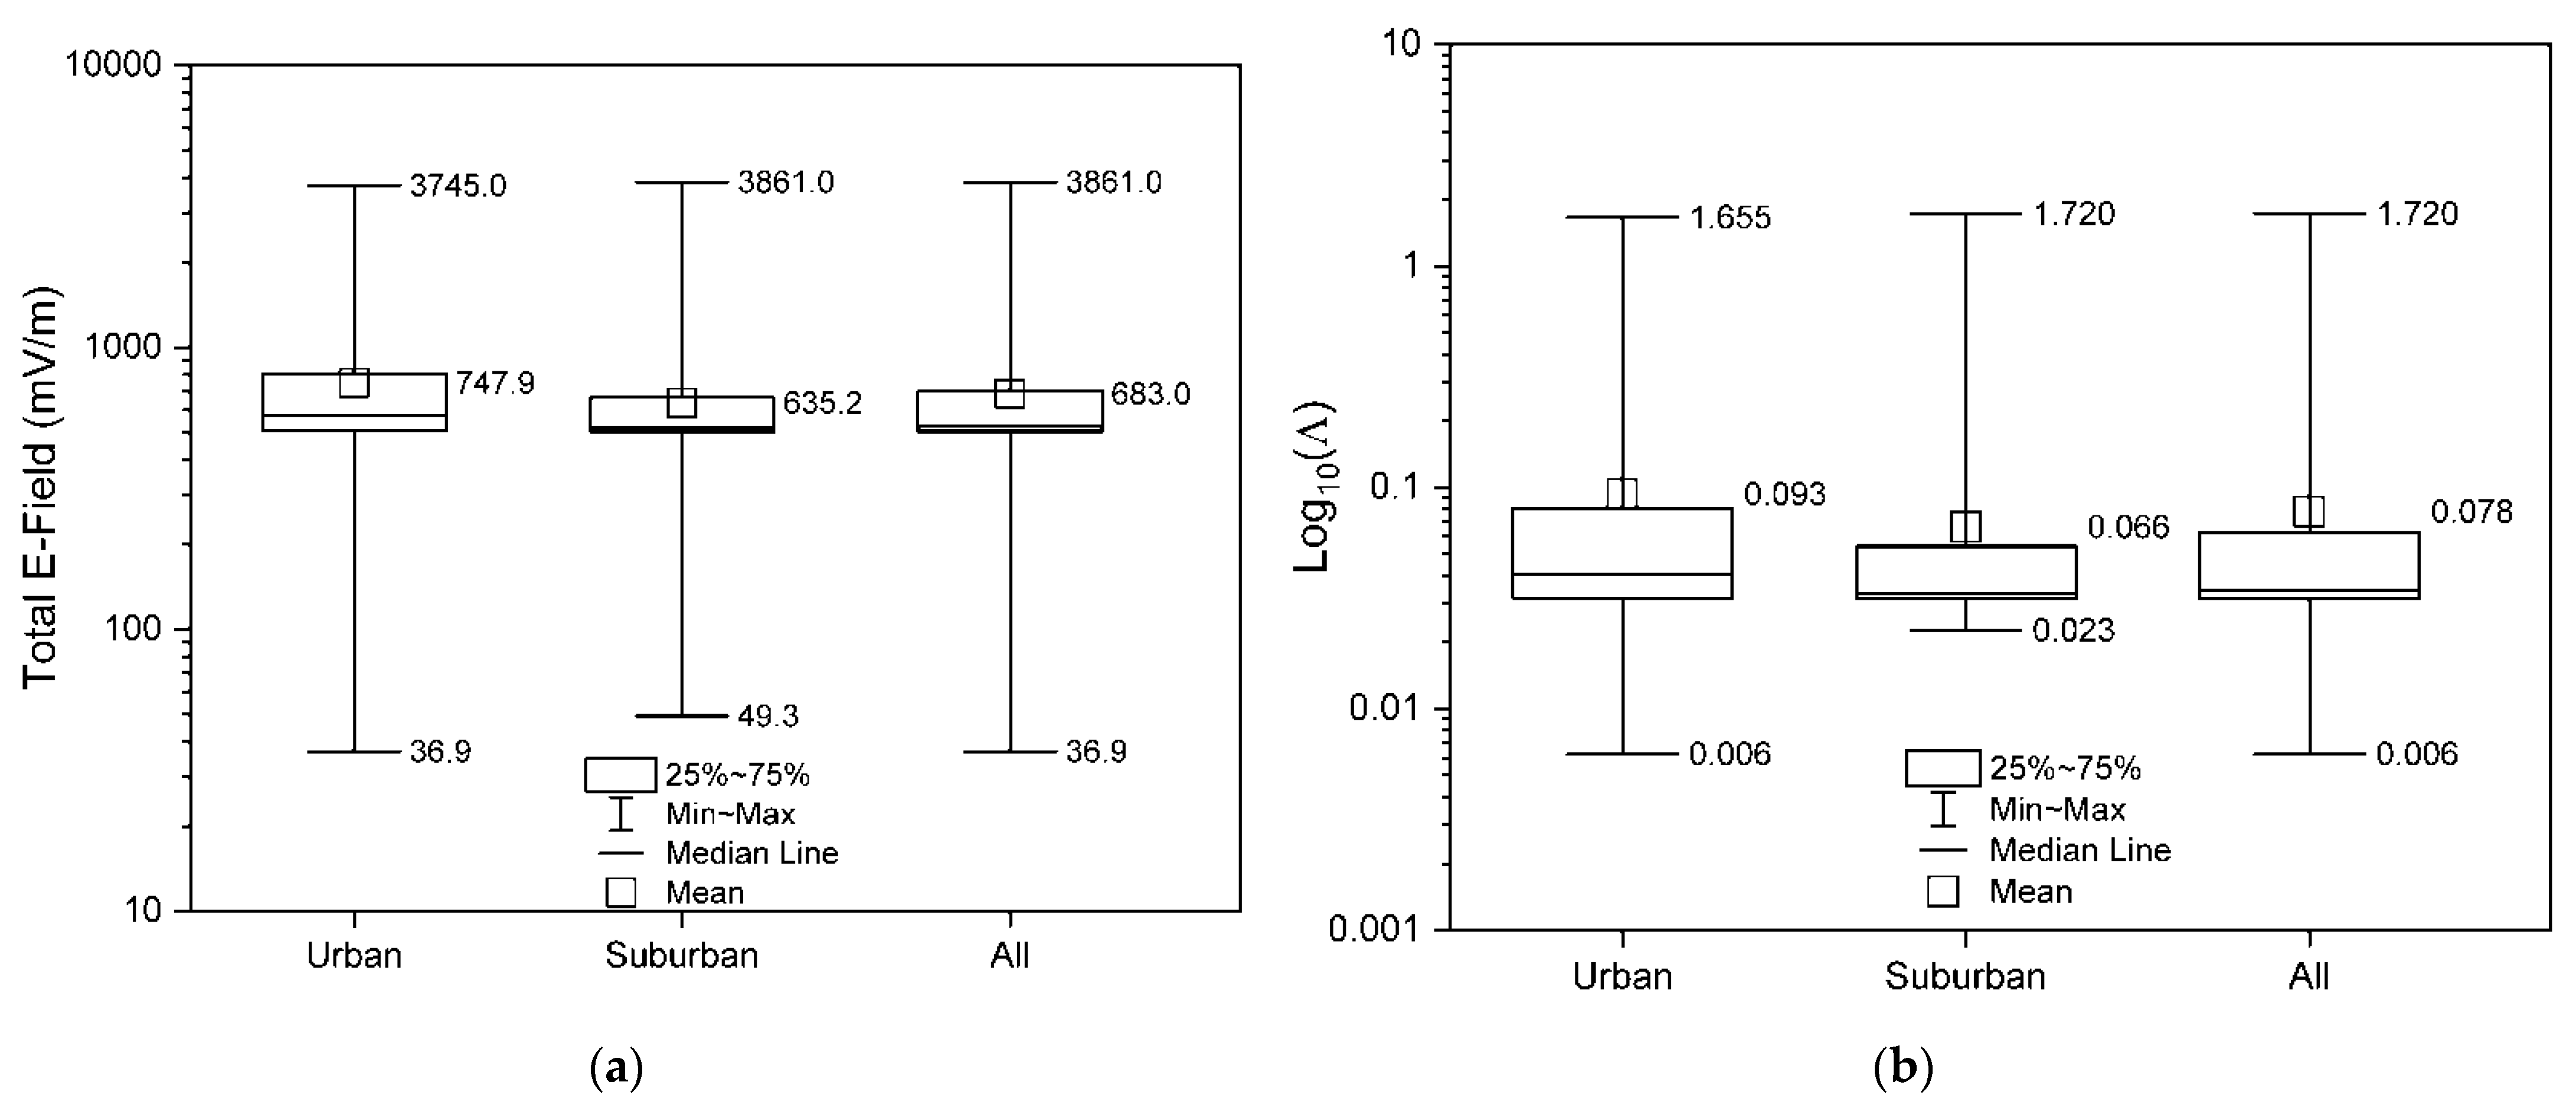
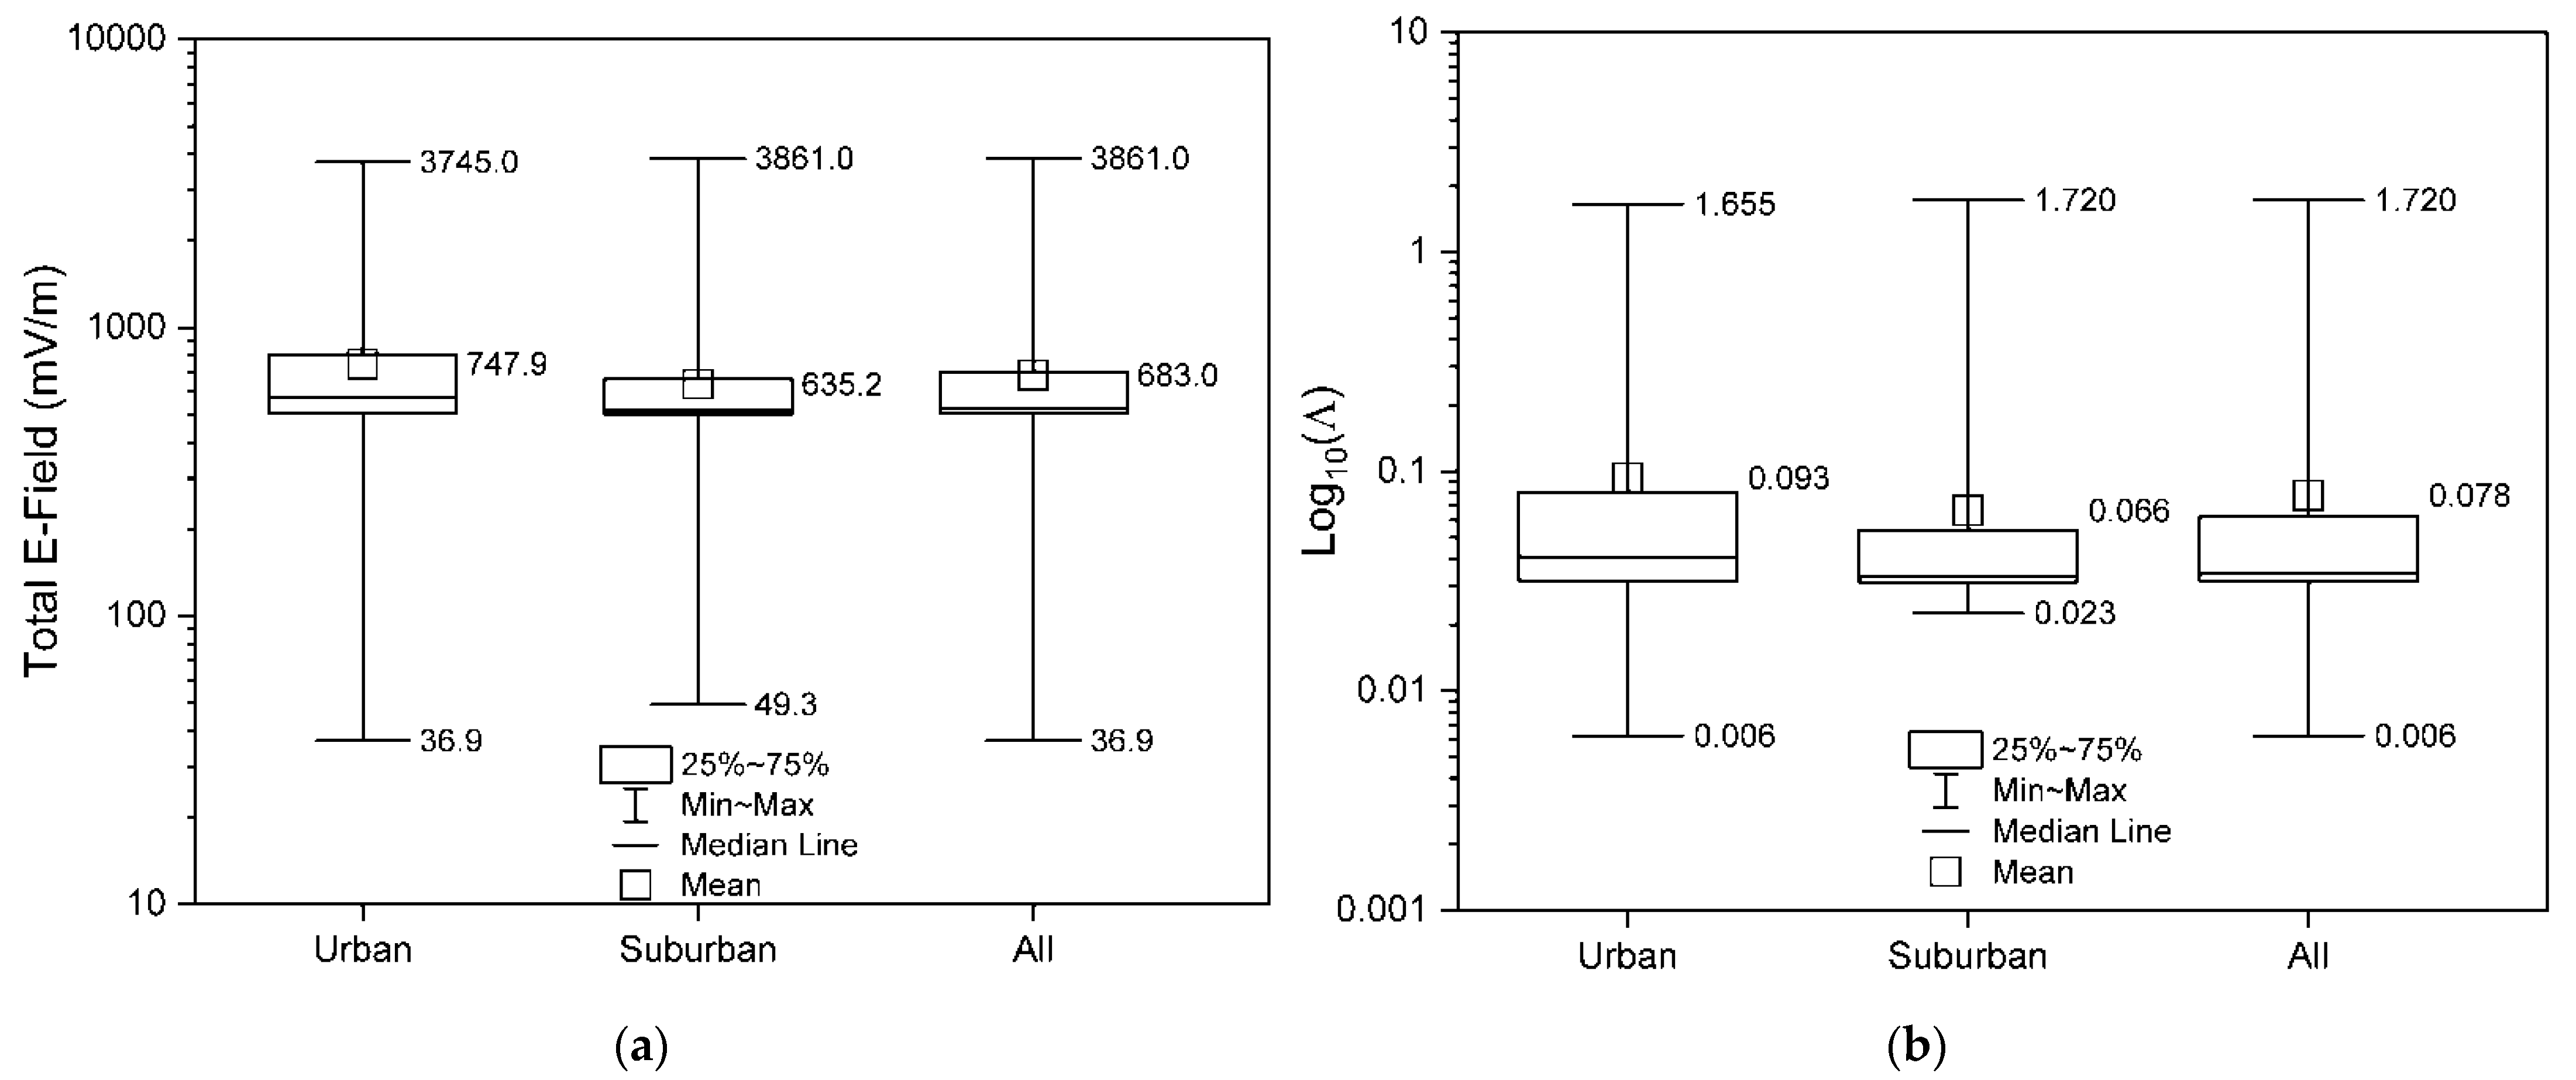
3. Results and Discussion

Table 1 summarizes all measurement data, i.e., from 396 area points, per frequency band. The minimum and maximum values of E f j and λ f j , j = 1, 2, …, 396, are given together with the mean, standard deviation (SD), and median value. The first remark about Table 1 is that, even the maximum value of λ f j is found well below 1, for all frequency bands except for the band of 27–879 MHz where the maximum exposure ratio is 1.25. The latter is an extreme outlier and it may attributed to an antenna located on a roof near the first primary school, in the suburb named “Kounoupidiana”. This specific measurement corresponds to location #7 (out of 10), in the vicinity of the aforementioned school, and it was probably along the main beam of the antenna. Due to the aforementioned outlier, the maximum value of Λ j at the last row of Table 1 is found above the reference level. In addition, Table 1 indicates that the SD of E f j and λ f j is high, for all frequency bands, a remark that may be attributed to the wide distribution of the sample; great SDs have been reported by other researchers, too [14]. The fact that the SD values of λ f j are greater than the corresponding mean values may be a sign that the distribution of the results is not normal; thus, the median value (as well as the related parameters, such as the interquartile range shown in Figure 2) is of greater importance than the mean value of the exposure ratio.
Mood’s median tests (95% confidence level) were performed in order to determine whether there exist statistically significant differences in median values of E f j and λ f j between urban and suburban environments; the results, per frequency band, are presented in the last column of Table 1. The latter suggests that all median values for urban and suburban environments, except for those corresponding to the 27–879 MHz band, are found to be statistically significantly different, i.e., p < 0.05. Thus, herein, the alternative hypothesis turns out to be true, i.e., the urban and the suburban environments may be viewed as different populations (with the exception of the 27–879 MHz band). This is a reasonable result and it is justified below.
Urban areas differ significantly from the suburbs, as the radiation sources in the former are generally greater in number and placed much closer to each other, albeit the greater the number of sources, the less power they emit. In addition, there exist many more obstacles of any kind (tall buildings, various constructions, reflective surfaces, etc.) in the urban than in the suburban areas; thus, a direct line-of-sight propagation path is more likely to occur in suburban than in urban environments. The aforementioned arguments are further supported by the fact that several well-known propagation models, such as Okumura-Hata, are quite different for urban and suburban environments; a difference that is expected to be imprinted in EMF measurements, too. Regarding the p-value obtained for the 27–879 MHz band, i.e., p > 0.05, it denotes that urban and suburban environments are not statistically significantly different for this specific frequency range. Applications of the aforementioned band include mainly broadcast radio and television, with the emitters usually located outside the cities and the suburbs. Thus, urban and suburban environments may not differ significantly as far as such sources are considered.
Box-and-whisker plots, per environment type, for the total electric field strength and the total exposure ratio are depicted in Figure 2. Plots considering all 396 measurement points are also included therein. It is evident that the interquartile range that corresponds to the suburbs is narrower than the one obtained for the urban areas, a result that may be attributed to the fact that the suburban environments exhibit a more uniform construction than the urban areas. Moreover, the difference between urban and suburban environments is a reasonable outcome as the p-values obtained from the aforementioned Mood’s Median tests were <0.05 (with the exception of the 27–879 MHz band).
Figure 3 summarizes the measured values of the electric field strength (Figure 3a) and the calculated values of the total exposure ratio Λ (Figure 3b) by plotting the cumulative distribution, as the percentage of measurements. The range of the E-field strength recordings is divided into eight consecutive sub-ranges, as indicated on the horizontal axis of Figure 3a, whereas the nine sub-ranges of Λ are depicted on the horizontal axis of Figure 3b. Each shaded bar comprises the values that fall within the denoted sub-range; the light gray bar corresponds to the percentage of the values that refer to suburban areas, whereas the remaining (i.e., the dark gray bar) incorporates the urban measurements. For example, in the first sub-range of Figure 3a (i.e., 0–0.5 V/m), 38% of the E-field measurements were recorded in urban environments, while the remaining 62% correspond to the suburbs.
It may be readily verified, from Figure 3a, that the greatest number of measurements, i.e., almost 90%, correspond to an E-field strength lower than 1 V/m, while only 1% of the values exceed 2.5 V/m. Moreover, a great percentage (68%) of the measurements are found between 0.5 and 1 V/m, as denoted by the abrupt increase when the distribution transitions from the range 0–0.5 to 0.5–1 V/m. Regarding the total exposure ratio (Figure 3b), the vast majority of values (almost 94%) are lower than 0.2, a remark that ensures compliance with the established reference levels. Only a very small percentage (i.e., 0.8%) of the values of Λ exceed 1, and it may be attributed to extreme outliers such as the one mentioned in the beginning of this Section, in the suburb “Kounoupidiana”.
The original (measured) and certain approximating distributions of the E-field measurements are presented in Figure 4, whereas the corresponding approximating distributions for the total exposure ratio Λ are depicted in Figure 5. Both urban (Figure 4a and Figure 5a) and suburban (Figure 4b and Figure 5b) environments are considered. The distributions that correspond to the original data are depicted in the form of bar graphs. On the one hand, Figure 4 confirms the familiar remark that the majority of E-field measurements are below 1 V/m, with most of them ranging between 0.5 and 1 V/m. On the other hand, it is evident from the bar graphs of Figure 5 that most of the total exposure ratio values lie in the range of 0 Λ 0.2 . This is an expected outcome if one considers the results depicted either in the last line of Table 1 or in Figure 3b.
According to goodness-of-fit tests, the depicted lognormal, gamma, Weibull, and normal distributions are the most suitable to approximate the measurements in urban environments, whereas the lognormal, gamma, and normal distributions fit better to the data obtained for the suburbs. The estimated parameter values for the distributions depicted in Figure 4 and Figure 5 are listed in Table 3 and Table 4, respectively. However, it should be kept in mind that the great concentration of Λ values in the aforementioned narrow range make it difficult to find a good approximating distribution, as may be verified from Figure 5.
Subsequently, a worst-case scenario is examined, i.e., only the highest measured value is taken into account among all measurements in the vicinity of each school. Thus, a total of 69 audits (as many as the schools) constitute the aforementioned scenario; 29 audits were conducted in urban areas and the remaining 40 in the suburbs. The results are summarized in Table 5. It is evident that the mean values of the exposure ratio are slightly higher compared with the ones given in Table 1. This is an expected outcome as the results of Table 5 include only the maximum values acquired around each school. However, even in this worst-case scenario, the mean exposure ratio is well below 1 for all cases examined. The last column of Table 5 comprises the p-value obtained from Mood’s Median tests (95% confidence level) in order to investigate the statistically significant differences in median values of λ f j between urban and suburban environments. The result p > 0.05, for all frequency bands, indicates that the two environments are found as not statistically different. This outcome may be attributed to the fact that, regarding the worst case, i.e., the highest possible values of the E-field around each school, the two environment types do not differ significantly, as expected.
Box-and-whisker plots for the aforementioned worst-case scenario are presented in Figure 6. A comparison between Figure 2a and Figure 6a (or Figure 2b and Figure 6b) indicates that the whole range of values in Figure 6 is narrower, i.e., the whiskers are shorter in Figure 6 than in Figure 2, albeit the interquartile range is slightly wider in Figure 6 than in Figure 2. This is a reasonable outcome, as the plots of Figure 2 comprise all measurements that, evidently, span a broader range than the highest values (one for each school) that constitute Figure 6. Moreover, the familiar remark, derived from Figure 2, that the box for the suburban environments is narrower than the one that corresponds to the urban areas, may be verified from Figure 6, too.

4. Comparisons

Table 6 offers a comparison between basic parameters and results of the experiment presented herein and pertinent experimental studies found in the literature. An extensive review about EMF measurements and evaluation of the RF exposure is beyond the scope of this paper; only certain studies are included in Table 6 for the sake of comparison.
The first three lines of Table 6 comprise 3 studies, respectively, that deal with the development of networks for monitoring the nonionizing EM radiation in Greece. Gotsis et al. [12] referred to two networks, comprising 46 monitoring stations in total, spread in urban and rural areas all over Greece. Mean values of the measured E-field strength are presented therein, over a five-year period, and the measured EM radiation levels were found significantly below the reference levels. Manassas et al. [13] reported the measurement data from 90 monitoring stations (urban and rural) in Greece and temporal variations were investigated. Median total exposure levels were presented, making the results comparable with other studies. A significant difference in the electric field measured in urban and rural environments was found and higher exposures were observed during the day- rather than the night-hours. Last year, Karastergios et al. [15] presented the measurement results, of the first 3 years of operation, from the National Observatory of EMF fields (NOEF) in Greece, which is a monitoring network operated by EEAE. Annual average values of the E-field strength were reported; all values were below the reference levels established by the Greek legislation. Data from measurements conducted by EEAE were also analyzed by Christopoulou and Karabetsos [14], as indicated in the fourth line of Table 6. The audits were performed in the vicinity of base stations; thus, the mean value of the E-field strength (i.e., 2.24 V/m) was somewhat higher than the one reported by Karastergios et al. [15], as expected, albeit the latter refers to more recent results.
In addition, Christopoulou and Karabetsos [14] found a few specific cases not complying with Greek reference levels for general public exposure, at locations near antenna installations, an outcome that is in line with the present study.
The rest of the studies cited in Table 6 refer to measurements that were conducted outdoors and in the vicinity of places where children tend to spend most of their time, such as schools, kindergartens, and playgrounds. Bhatt et al. [3], Yener et al. [5], and Gallastegi et al. [4] conducted measurements in Australia, Turkey, and Spain, respectively, whereas the studies by Christopoulou and Karabetsos [10], Kiouvrekis et al. [11], as well as our work, refer to playgrounds and schools in Greece. It may be verified from Table 6 that the recent work by Kiouvrekis et al. [11] and the present study report greater median values of the measured E-field strength than the studies performed a few years ago [3,4,10]. This may be attributed to the fact that more and more RF emitters are installed in urban and suburban areas as time goes by.
Another remark about Table 6 is that we observed a higher median total value of the E-field strength in urban than in suburban environments, a result supported by other findings, too [10]; this is a reasonable outcome as the radiation sources in the urban areas are, generally, installed more densely than in the suburbs. An even more pronounced difference in the readings of urban and rural environments in Greece was reported by Manassas et al. [13]. It is worth mentioning that higher readings in urban than in suburban/rural areas have been observed by researchers that conducted personal measurements [6], as well as indoor measurements [7].
Regarding the contribution of sources, Table 6 suggests that the majority of studies [3,4,5,12,13,14], including our work, agree that mobile communication frequencies contributed most to the total RF exposure. The mobile phone downlink was also found to be the predominant contributor to the total exposure in indoor [7,8] and personal [6] measurements. Another important contributor to the total exposure proved to be broadcasting, a result supported by several studies [4,12,13,14] as well as ours.
Compliance with the local established exposure reference levels is achieved in most of the cases shown in Table 6, especially when average or median values of the E-field strength are examined. A few outliers were observed by Christopoulou and Karabetsos [14], in spatially localized areas, at a short distance from antenna installations, where general public access should not have been allowed. Moreover, we did find a few cases, in the 27–879 MHz frequency band (Table 1), where the maximum exposure ratio exceeded 1, albeit the corresponding median and mean values were much lower. These cases, as mentioned earlier, refer to the vicinity of a school that was probably along the main beam of an antenna.

5. Conclusions

In conclusion, our results indicate that, in the vast majority of cases, we observed compliance with the Greek established reference levels for RF exposure. The median values of the exposure ratio were found less than 0.035 in all cases examined, whereas the maximum values of the exposure ratio lay below 0.28 except for a very few cases, where the maximum value of the E-field strength exceeded the reference level. Most recordings of the electric field strength (i.e., 90%) were found lower than 1 V/m, while the majority of the total exposure ratio values (i.e., almost 94%) were below 0.2. The median values of the E-field strength were found to be statistically significantly different in urban and suburban environments, except for the 27–879 MHz band where broadcast applications dominate. Readings were slightly higher in urban areas than in the suburbs and the latter exhibited a narrower interquartile range than the former due to their more uniform construction. We also found that mobile communication frequencies and broadcast were the sources that contributed most to the total exposure.
Our future plans include EMF measurements not only around but also inside schools and classrooms, in the frequency range of 27 MHz–6 GHz, especially with the prospect of the rapidly upcoming 5G mobile services everywhere. A comparison of the electric field strength at the same measurement locations, before and after the advent of 5G, will be interesting and revealing.

Author Contributions

Conceptualization, T.N.K. and I.O.V.; methodology, T.N.K. and I.O.V.; software, T.N.K. and I.O.V.; validation, T.N.K., M.P.I., A.T.B., C.D.N. and I.O.V.; formal analysis, T.N.K., M.P.I., A.T.B., C.D.N. and I.O.V.; investigation, T.N.K., M.P.I., A.T.B., C.D.N. and I.O.V.; resources, T.N.K., A.T.B., C.D.N. and I.O.V.; data curation, T.N.K., A.T.B., C.D.N., E.S.S., A.J.K. and I.O.V.; writing—original draft preparation, T.N.K., M.P.I. and I.O.V.; writing—review and editing, M.P.I. and I.O.V.; visualization, T.N.K., M.P.I., A.T.B., C.D.N., E.S.S., A.J.K. and I.O.V.; supervision, I.O.V.; project administration, I.O.V.; funding acquisition, C.D.N. and I.O.V. All authors have read and agreed to the published version of the manuscript.

Funding

This research received no external funding.

Data Availability Statement

The data used in this study are available on request from the corresponding author.

Conflicts of Interest

The authors declare no conflict of interest.

References

  1. Sagar, S.; Dongus, S.; Schoeni, A.; Roser, K.; Eeftens, M.; Struchen, B.; Meier, M.N.; Adem, S.; Roosli, M. Radiofrequency electromagnetic field exposure in everyday microenvironments in Europe: A systematic literature review. J. Expo. Sci. Environ. Epidemiol. 2018, 28, 147–160. [Google Scholar] [CrossRef] [PubMed]
  2. Jalilian, H.; Eeftens, M.; Ziaei, M.; Roosli, M. Public exposure to radio frequency electromagnetic fields in everyday microenvironments: An updated systematic review for Europe. Environ. Res. 2019, 176, 108517. [Google Scholar] [CrossRef] [PubMed]
  3. Bhatt, C.R.; Redmayne, M.; Billah, B.; Abramson, M.J.; Benke, G. Radiofrequency-electromagnetic field exposures in kindergarten children. J. Expo. Sci. Environ. Epidemiol. 2017, 27, 497–504. [Google Scholar] [CrossRef]
  4. Gallastegi, M.; Huss, A.; Santa-Marina, L.; Aurrekoetxea, J.J.; Guxens, M.; Birks, L.E.; Ibarluzea, J.; Guerra, D.; Roosli, M.; Jimenez-Zabala, A. Children’s exposure assessment of radiofrequency fields: Comparison between spot and personal measurements. Environ. Int. 2018, 118, 60–69. [Google Scholar] [CrossRef] [Green Version]
  5. Yener, S.C.; Cerezci, O.; Seker, S.S. Determination of the electromagnetic pollution in local school indoor and outdoor environments. IU-J. Electr. Electron. Eng. 2017, 17, 3509–3515. [Google Scholar]
  6. Birks, L.E.; Struchen, B.; Eeftens, M.; Van Wel, L.; Huss, A.; Gajsek, P.; Kheifets, L.; Gallastegi, M.; Dalmau-Bueno, A.; Estarlich, M.; et al. Spatial and temporal variability of personal environmental exposure to radio frequency electromagnetic fields in children in Europe. Environ. Int. 2018, 117, 204–214. [Google Scholar] [CrossRef] [PubMed] [Green Version]
  7. Vermeeren, G.; Markakis, I.; Goeminne, F.; Samaras, T.; Martens, L.; Joseph, W. Spatial and temporal RF electromagnetic field exposure of children and adults in indoor micro environments in Belgium and Greece. Prog. Biophys. Mol. Biol. 2013, 113, 254–263. [Google Scholar] [CrossRef] [PubMed] [Green Version]
  8. Van Wel, L.; Vermeulen, R.; Eijsden, M.; Vrijkotte, T.; Kromhout, H.; Huss, A. Radiofrequency exposure levels in Amsterdam schools. Bioelectromagnetics 2017, 38, 397–400. [Google Scholar] [CrossRef] [PubMed]
  9. Verloock, L.; Joseph, W.; Goeminme, F.; Martens, L.; Verlaek, M.; Constandt, K. Temporal 24-hour assessment of radio frequency exposure in schools and homes. Measurement 2014, 56, 50–57. [Google Scholar] [CrossRef] [Green Version]
  10. Christopoulou, M.; Karabetsos, E. Evaluation of radiofrequency and extremely low-frequency field levels at children’s playground sites in Greece from 2013 to 2018. Bioelectromagnetics 2019, 40, 602–605. [Google Scholar] [CrossRef] [PubMed]
  11. Kiouvrekis, Y.; Manios, G.; Tsitsia, V.; Goulzoulidis, G.; Kappas, G. A statistical analysis for RF-EMF exposure levels in sensitive land use: A novel study in Greek primary and secondary education schools. Environ. Res. 2020, 191, 109940. [Google Scholar] [CrossRef] [PubMed]
  12. Gotsis, A.; Papanikolaou, N.; Komnakos, D.; Yalofas, A.; Constantinou, P. Non-ionizing electromagnetic radiation monitoring in Greece. Ann. Telecommun. 2008, 63, 109–123. [Google Scholar] [CrossRef]
  13. Manassas, A.; Boursianis, A.; Samaras, T.; Sahalos, J.N. Continuous electromagnetic radiation monitoring in the environment: Analysis of the results in Greece. Radiat. Prot. Dosim. 2012, 151, 437–442. [Google Scholar] [CrossRef] [PubMed]
  14. Christopoulou, M.; Karabetsos, E. In situ measurements of radiofrequency exposure levels in Greece from 2008 to 2013: A multi-parametric annual analysis. Bioelectromagnetics 2015, 36, 325–329. [Google Scholar] [CrossRef] [PubMed]
  15. Karastergios, I.; Gialofas, A.; Karabetsos, E. National observatory of electromagnetic fields: National telemetric network for the measurement of high-frequency electromagnetic fields in Greece. Radiat. Prot. Dosim. 2020, 188, 413–423. [Google Scholar] [CrossRef] [PubMed]
  16. Gourzoulidis, G.A.; Tsaprouni, P.; Skamnakis, N.; Tzoumanika, C.; Kalampaliki, E.; Karastergios, I.; Gialofas, A.; Achtipis, A.; Kappas, C.; Karabetsos, E. Occupational exposure to electromagnetic fields. The situation in Greece. Phys. Med. 2018, 49, 83–89. [Google Scholar] [CrossRef] [PubMed]
  17. Narda Safety Test Solutions. Selective Measurement of High Frequency Electromagnetic Fields; Selective Radiation Meter SRM-3006. NSTS 0321-E0272L; Narda Safety Test Solutions GmbH: Pfullingen, Germany, 2012. [Google Scholar]
  18. Narda Safety Test Solutions. Accounting for Measurement Uncertainty in the SRM-3000; Application Note. AN_HF_1004_Measurement_Uncertainty; Narda Safety Test Solutions GmbH: Pfullingen, Germany, 2007. [Google Scholar]
  19. International Electrotechnical Commission (IEC). BS IEC 62232:2011. Determination of RF Field Srength and SAR in the Vicinity of Radiocommunication Base Stations for the Purpose of Evaluating Human Exposure; BSI Standards Publication: London, UK, 2011. [Google Scholar]
  20. CENELEC TC 106x European Committee for Electrotechnical Standardisation. Electromagnetic Fields in the Human Environment. EN 50492:2008/A1:2014. Basic Standard for the In-Situ Measurement of Electromagnetic Field Strength Related to Human Exposure in the Vicinity of Base Stations; European Committee for Electrotechnical Standardisation: Brussels, Belgium, 2014. [Google Scholar]
  21. International Commission of Non Ionizing Radiation Protection (ICNIRP). Guidelines for limiting exposure to time varying electric, magnetic and electromagnetic fields (up to 300 GHz). Health Phys. 1998, 74, 494–522. [Google Scholar]
  22. Act, No. 1105. Common Ministerial Order of the Ministries of Development, Transport and Communications, Health and Environment, Physical Planning and Public Works. Measures for the Protection of the General Public from the Operation of Land Based Antenna Stations; Articles 2–4, Act No.1105/Vol.B/6-9-2000; Hellenic Republic: Athens, Greece, 2000. (In Greek) [Google Scholar]
  23. Law No 4070. Electronic Communications, Public Works and Other Provisions; Article 30, par. 9–10, Official Gazette 82/A/10-4-2012; Hellenic Republic: Athens, Greece, 2012. (In Greek) [Google Scholar]
  24. Council of the European Union. 1999/519/EC. Council Recommendation of 12 July 1999 on the Limitation of Exposure of the General Public to Electromagnetic Fields (0 Hz to 300 GHz). Off. J. Eur. Communities 1999, 199, 59–70. [Google Scholar]
Figure 1. Experimental setup of the RF-EMF measurements. (a) On-site measurement layout and (b) measurement data recording.
Applsci 12 04701 g001
Figure 2. Box-and-whisker plots, per environment type and for all measurement points together. (a) Total electric field strength E (mV/m) and (b) total exposure ratio Λ .
Applsci 12 04701 g002
Figure 3. Cumulative distribution (%) of (a) the E-field strength measurements and (b) the calculated values of the total exposure ratio Λ , for specific value ranges, and classification by environment type.
Applsci 12 04701 g003
Figure 4. Plots of the distributions of the E-field values. The bar diagrams represent the measured data, whereas the curves are the corresponding approximating distributions of their values. (a) Urban and (b) suburban environment.
Applsci 12 04701 g004
Figure 5. Same as Figure 4, but the distributions refer to the total exposure ratio Λ . (a) Urban and (b) suburban environment.
Applsci 12 04701 g005
Figure 6. Box-and-whisker plots for the worst-case scenario described in the text. (a) Total electric field strength E (mV/m) and (b) total exposure ratio Λ .
Applsci 12 04701 g006
Table 1. Statistics for E f j and λ f j for all measurement data and p-values obtained from the Mood’s median tests between urban and suburban environments.
Frequency Band
(MHz)
E-Field ( E f j ) (mV/m)Exposure Ratio ( λ f j )Mood’s Test
MinMaxMeanSDMedianMinMaxMeanSDMedianp-Value
27–87936.932382.0444.15259.14344.0001.2500.0580.1190.0260.155
879.1–96134.17316.365.7542.9048.2600.0100.0010.0010.0000.004
961–170961.32963.0175.04104.95134.6500.0850.0040.0080.0020.042
1709.1–188130.321070.0112.1999.5477.9300.0590.0010.0040.0000.042
1881.1–191929.05275.547.1129.0436.0600.0040.0000.0000.0000.042
1919.1–217192.65902.2156.10101.62115.8000.0370.0020.0040.0010.012
2171.1–300019.932482.0441.88272.71336.3500.2770.0120.0260.0050.042
Total36.933861.0683.03418.38524.150.0061.7200.0780.1620.0340.042
Table 2. Reference level E l i m , f j for general public exposure in the vicinity of schools, according to Greek legislation.
Frequency RangeE-Field Strength E l i m , f j (V/m)
1–3 kHz150/f
3 kHz–1.43 MHz52.2
1.43–10 MHz67.3/f
10–400 MHz21.7
400–2000 MHz1.065∙f1/2
2–300 GHz47.2
Table 3. Estimated parameters for the distributions that approximate the E-field measurements in urban and suburban environments.
EnvironmentDistributionParameterEstimated Value
UrbanLognormalµ (mean)6.49
σ (standard deviation)0.48
Gammaα (shape alpha)4.19
θ (scale thita)178.5 (deg)
Weibullα (scale alpha)846.87
β (shape beta)1.77
Normalµ (mean)747.90
σ (standard deviation)469.06
SuburbanLognormalµ (mean)6.37
σ (standard deviation)0.37
Gammaα (shape alpha)6.37
θ (scale thita)99.79 (deg)
Normalµ (mean)635.22
σ (standard deviation)370.55
Table 4. Estimated parameters for the distributions that approximate the values of the total exposure ratio Λ in urban and suburban environments.
EnvironmentDistributionParameterEstimated Value
UrbanLognormalµ (mean)−2.91
σ (standard deviation)0.85
Gammaα (shape alpha)1.07
θ (scale thita)0.09 (deg)
Weibullα (scale alpha)0.09
β (shape beta)0.91
Normalµ (mean)0.09
σ (standard deviation)0.17
SuburbanLognormalµ (mean)−3.13
σ (standard deviation)0.65
Gammaα (shape alpha)1.35
θ (scale thita)0.05 (deg)
Normalµ (mean)0.07
σ (standard deviation)0.15
Table 5. Statistics for λ f j for the worst-case scenario and p-value obtained from the Mood’s median tests between urban and suburban environments.
Frequency Band
(MHz)
Exposure Ratio ( λ f j )Mood’s Test
MeanSDMedianp-Value
27–8790.1140.2250.0330.404
879.1–9610.0010.0020.0010.186
961–17090.0080.0150.0020.404
1709.1–18810.0030.0090.0010.729
1881.1–19190.0000.0010.0000.186
1919.1–21710.0030.0070.0010.186
2171.1–30000.0240.0500.0070.404
Total0.1540.3080.0440.404
Table 6. Comparative synopsis of studies dealing with RF-EMF outdoor measurements and general public exposure.
StudyMicro- EnvironmentLocationFrequency RangeEquipmentMedian
(Total, All Bands)
Highest Measured ValueMain Contributors to the Total ExposureExcess of Local Reference Levels
[12]46 continuous monitoring stations (urban, rural)Sites all over Greece100 kHz–3 GHzEM radiation monitoring networks comprising spectrum analyzers, selective radiation meters, isotropic E-field sensors, control and storage units, etc.-
(mean values: 0.03–3.93 V/m depending on the location)
-Mobile communication frequencies and broadcastNo (regarding the mean measured electric field strength)
[13]90 continuous monitoring stations (urban, rural)Sites all over Greece100 kHz–3 GHz
and 3 sub–bands 925–960 MHz, 1805–1880 MHz, 2110–2170 MHz
EM radiation monitoring networks comprising spectrum analyzers, selective radiation meters, isotropic E-field sensors, control and storage units, etc.1100 mV/m (urban)
300 mV/m (rural)
4.83 V/mMobile communication frequencies and broadcastNo (regarding the total exposure ratio)
[15]489 monitoring stations273 municipalities all over Greece100 kHz–7 GHzBroadband Narda AMB-8057-03/G-type EMF monitoring station-
(91% of the annual average values < 2 V/m)
-
(20% of the annual maximum values > 2 V/m)
-No
[14]4705 audits in the vicinity of base stations (urban, suburban, rural)Sites all over Greece27–3000 MHz (8 bands)Selective radiation meter SRM-3006 with isotropic E-field antenna (Narda)-
(mean value: 2.24 V/m)
14 V/m (1% of measurements)Mobile communication frequencies and broadcastNo (regarding the total exposure ratio), occasionally yes
[3]20 kintergardensMelbourne, Australia88–5800 MHz (16 bands)Exposimeter ExpoM-RF 64 (Fields at Work)233 mV/m-GSM-900 downlinkNo
[5]24 primary schoolsNilüfer, Bursa, TurkeyRF (especially GSM bands) and ELFSelective radiation meter SRM-3006 and isotropic EM-field meter (Narda)-3–4 V/m (4.2% of measurements)GSM frequencies (900, 1800, 2100 MHz)No
[4]26 school playgrounds and 79 parksBasque country, Spain87.5–6000 MHz (16 bands)Exposimeter with 3-axis isotropic antenna275 mV/m (playgrounds)
216 mV/m (parks) *
2.36 V/m *Broadcast and mobile phone downlink-
[10]317 playgrounds (urban and suburban)16 municipalities in Greece27–3000 MHzSelective radiation meter SRM-3006 with isotropic E-field antenna (Narda)244 mV/m (urban)
229 mV/m (suburban)
1.66 V/m-No (regarding the total exposure ratio)
[11]65 schools (urban)Greece27–3000 MHzSelective radiation meter SRM-3006 with isotropic E-field antenna (Narda)403 mV/m1.35 V/m-No
Current study69 nursery and primary schools (urban and suburban)Chania, Crete island, Greece27–3000 MHz (7 bands)Selective radiation meter SRM-3006 with isotropic E-field antenna (Narda)576 mV/m (urban)
516 mV/m (suburban)
3.86 V/mMobile communication frequencies and broadcastNo (regarding the total exposure ratio), occasionally yes
* Gallastegi et al. [4] reported values for the measured power density that have been converted to values for the E-field intensity for the sake of comparison.
Publisher’s Note: MDPI stays neutral with regard to jurisdictional claims in published maps and institutional affiliations.

