1. Introduction
The development and implementation of future wireless communication systems will depend on the availability of radio frequency spectrum resources. Different agencies dedicated to the regulation of frequency spectrum usage, such as the Federal Communications Commission (FCC), have issued reports demonstrating that the fixed spectrum allocation is currently inefficient and does not satisfy future needs for such resources [
1,
2]. Cognitive radio networks (CRNs) have been proposed to improve inefficient spectrum utilization [
3]. The CRNs are capable of detecting and adapting to changes in the radio spectrum through the usage of the same frequency spectrum by secondary users (SUs) in the periods when primary users (PUs) are not active. Therefore, the possibility of reusing the same frequency spectrum by a different type of user is the key aspect of CRNs. Although SUs and PUs are spectrum users, due to the status of PUs as licensed users, they get precedence when using the spectrum. The SUs, as unlicensed users (also known as “cognitive users”), have less precedence when it comes to spectrum exploitation, and they use the spectrum when licensed users (PUs) do not transmit. Thus, when the PU is not active, the activity of the SU can lead to the utilization of the currently unused spectrum. This contributes to the reduction of the spectrum scarcity problem [
4,
5].
Various local spectrum sensing (SS) techniques have been introduced in published works. Energy detection (ED) is the core SS technique and the most prevalent in practice. This is because the ED method does not require prior information about the licensed user’s (PU) signal and the goal of the ED SS process is to detect the received signal energy in a specific part of the frequency spectrum. Additionally, the ED SS approach is less complex when compared with other known local SS approaches and this is an important implementation advantage that results in the broad practical implementation of the ED method [
6].
Nevertheless, the ED method has different drawbacks such as the inability to distinguish between signals and noise in low signal-to-noise ratio (SNR) environments, and has degradation of sensing precision in the presence of uncertainty in noise power (referred to as “noise uncertainty” (NU)). This is the consequence of the nature of the ED process which is based on a comparison of the energy level of the received signal with the predefined detection threshold (DT) level. The DT level is determined by the amount of energy contained in the noise. The two most common DT strategies with respect to the selection of DT are the adaptive/dynamic detection threshold (DDT) and the nonadaptive/fixed detection threshold (FDT) selection. The FDT is determined using a fixed noise level above the noise floor and it remains unchanged during the SS process while the DDT is dynamically determined based on the instantaneous level of NU in the environment. The SU can better deal with NU when using DDT adjustments as part of the detection of the PU signals. This makes the ED process more accurate. Although in communications systems, Orthogonal Frequency Division Multiplexing (OFDM) technology improves the spectral efficiency and robustness against inter-symbol interference (ISI) and frequency selective fading, while Multiple-Input Multiple-Output (MIMO) transmission technology improves the system capacity and reliability [
7], the influence of NU challenges the accurate estimation of the channel occupancy even when DDT is employed in the MIMO-OFDM communication system [
8,
9,
10].
To improve the accuracy of ED, various diversity techniques can be used to exploit multiple receive (Rx) antennas on the SU side of the MIMO communication system. Among the proposed diversity techniques, of particular interest is the square-law combining (SLC) diversity approach. The SLC is a straightforward diversity technique that exploits merging the energy of the received signals from every Rx antenna of the SU. It represents one of the diversity approaches with the lowest computing complexity [
11]. It is expected that exploiting the diversity of the SLC technique during the ED process can improve the signal detection of PU in MIMO-OFDM systems affected by the NU.
The main aim of this article was therefore to analyse the SS accuracy of the ED method employing the SLC approach when the ED process is affected by NU variations and performed using DDT adaptations in MIMO-OFDM communication systems. For pursuing the ED performance analyses, the receiver operating characteristic (ROC) curves indicating an interdependence between the probability of detection and false alarm probability are used as a common approach to analyse the detection efficiency of the SS method. The following is a summary of this paper’s main contributions:
A mathematical modelling of the parameters for the assessment of the effectiveness of the ED process employing the SLC technique in MIMO-OFDM transmission systems affected by NU changes and DDT adaptation.
The verifying of an algorithm that enables the simulation of the ED process assessment in SISO- and MIMO-OFDM transmission systems.
An elaboration on how the different levels of DDT adjustment and NU variations affect the ROC curves when the ED process is performed with a different number of transmitting and receiving antennas, as well as varied sensing sample totals, PU transmitting powers, modulation techniques, and SNR values.
The rest of the paper contains the following sections.
Section 2 provides a literature review of the ED in MIMO-OFDM transmission systems.
Section 3 describes the mathematical formulation of the parameters used for the assessment of the ED efficiency affected by a distinct range of NU and DDT levels.
Section 4 describes the algorithm used for evaluating the ED performance in MIMO-OFDM transmission systems. The extensive discussion on the simulation results presented using ROC curves is shown in
Section 5. Finally, the conclusion is given in
Section 6 of the paper.
2. Literature Review
The previous research works show that a combination of OFDM and MIMO is a frequently used communication technique in CRNs [
11,
12,
13]. As presented in [
12,
13,
14,
15,
16], the ED in the MIMO-OFDM communication system employing SLC approaches is a promising candidate for improving SS. In [
12], the detection performance of the PU signal using SLC ED techniques was analysed. Compared to other ED methods, the authors in [
12] showed that an ED process based on the SLC concept can guarantee a high detection probability at moderate to low SNRs when an ascending number of OFDM symbols is used.
In [
13], the effect of false alarm probabilities, the SNRs, different modulation schemas, and symbol length on the detection probability in OFDM systems was analysed for SISO and single-input multiple-output (SIMO) systems. The ED and cyclo-stationary feature detection performance was examined using the SLC and Equal Gain Combining (EGC) techniques. It was demonstrated that the EGC approach requires exact information about PU signals and provides efficient signal detection. Nevertheless, the SLC method does not require such information and thus achieves lower spectrum efficiency. In addition, the SLC technique demands the use of combiners and detectors to obtain a more precise ED process, which increases the cost of implementation. Despite the stated drawbacks, the SLC is less complex than other diversity combining methods in terms of its practical implementation.
The authors of [
11] discussed the difficulties encountered during the hardware implementation of an OFDM signal detection utilizing the ED SLC method and ED square law selection (SLS) approaches. Significant challenges such as modelling the PU signals, RF imperfections, SNR estimation, and the impact of fading channels were also analysed. Approaches employing simplifications were suggested to facilitate the hardware realizability of the antenna diversity in an actual implementation scenario.
The effect of NU fluctuations on ED performance was analysed in [
17,
18,
19]. Because NU fluctuation impairs the performance of the ED process, the authors in [
17] developed a kernelized detecting approach that focused on the selection of DT. An estimation of the ED performance utilizing MIMO systems was offered for licensed users affected by Gaussian noise in the Cognitive Radio Internet of Things (CR-IoT) network. The results showed that the proposed kernelized detector was not extremely sensitive to the number of samples, Gaussian noise, the number of SU Rx chains, or the SNR values.
In [
18], we examined the effect of NU on the ED process in the SISO-OFDM systems that operate on margin-constrained, rate-constrained or combined transmission concepts. The results show that NU has a powerful impact on PU signal detection. To minimize the impact of NU fluctuation, in [
19], the analysis was extended in relation to the ED performed with a DDT adjustment. The results indicated that DDT adaptation in SISO-OFDM systems can improve the efficiency of the detection of PU signals.
Furthermore, the results shown in [
20,
21,
22] extended the analysis related to the PU signal detection in MIMO-OFDM systems. In [
20], we presented a novel algorithm for the simulation and performance analyses of the ED employing SLC approach in MIMO-OFDM systems. In [
21], we examined the PU signal detection efficiency of the ED method based on SLC in environments characterized by various SNR levels and NUs. The results indicated that the ED process employing SLC which exploits the MIMO transmission positively affects detection probability, which is otherwise prone to the negative impact of NU. The analyses in [
22] were extended in [
23] with an examination of the impact of various SNR values on detection probability in the ED process influenced by NU and DDT adaptions. The results showed that DDT adjustments reduce the effect of NU and significantly improve the ED efficiency in MIMO- OFDM systems that use the SLC technique.
The ED process proposed in [
20,
21,
22] represents a novel principle to the ED of the PU signal in the MIMO-OFDM-based transmission systems impacted by NU fluctuations. While in the previous studies, the exploitation of the SLC technique in the ED process has been examined in MIMO-OFDM systems, analyses of the impact of distinct probabilities of false alarm on detection probability presented in the form of ROC curves for the MIMO-OFDM communication system are missing. Therefore, in this paper, the results of the extensive simulation analyses are presented, thereby showing the effect of the NU fluctuations and the DDT adaptation on the ED efficiency for the different detection samples exploited in the ED process, the level of SNRs, the MIMO Rx and the transmit (Tx) branch combinations and modulation types.
3. Fundamentals of the ED Process
According to
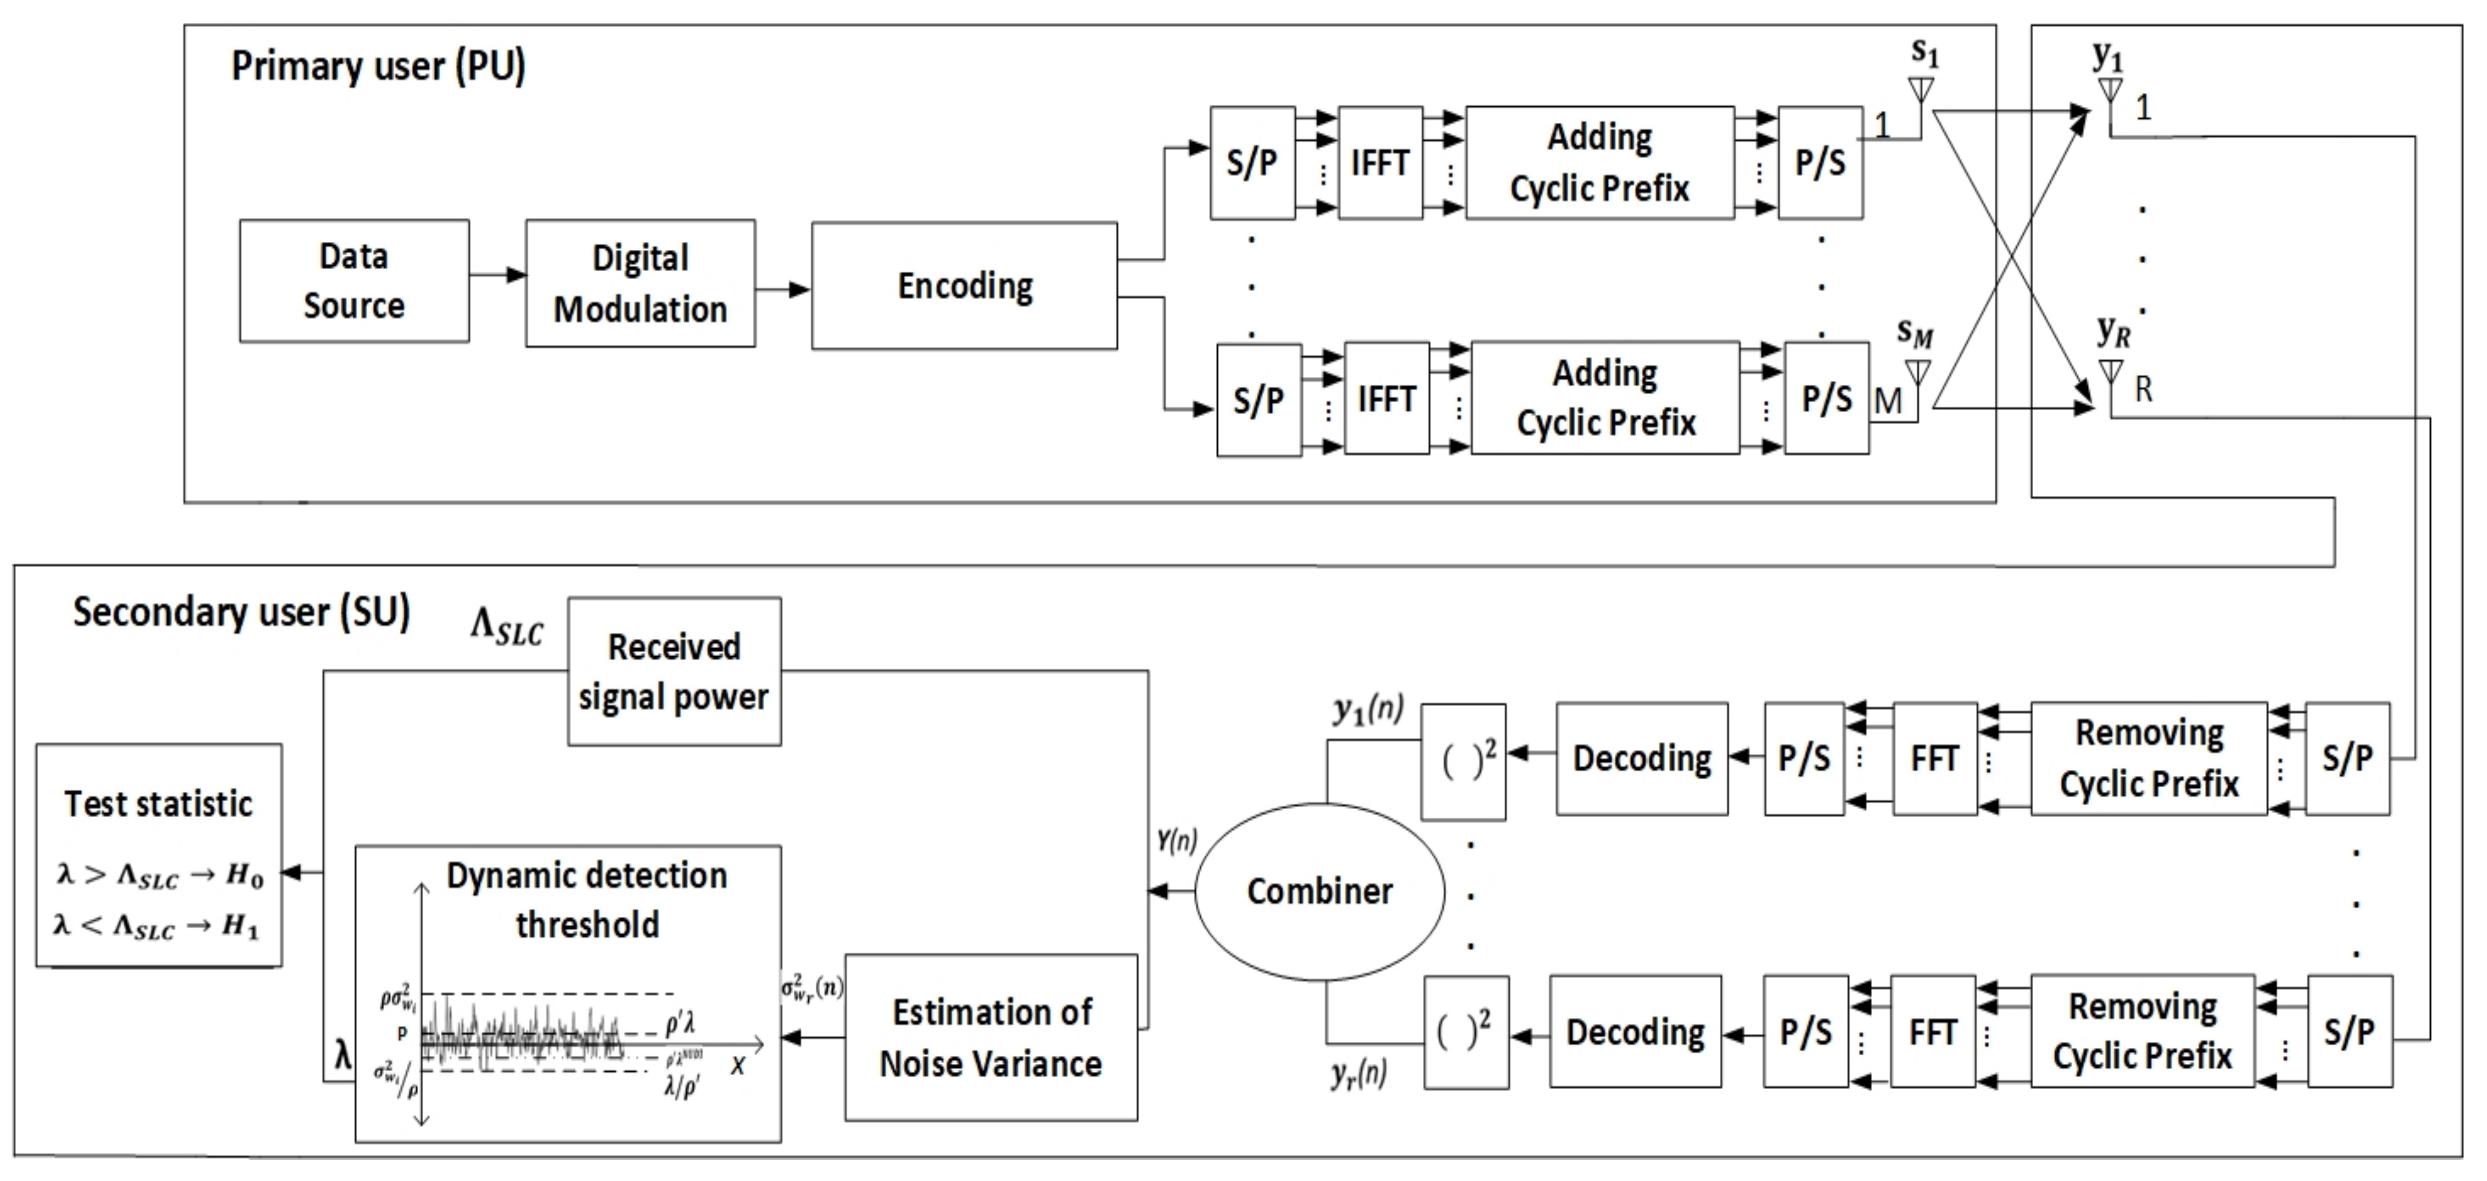
Figure 1, which presents the main blocks of the MIMO-OFDM system employing the ED spectrum sensing realized by the SLC technique, the PU and SU are involved in the MIMO-OFDM transmission and reception processes. On the PU side, the signal is transmitted over an
M Tx antenna(s) according to the principles of an OFDM transmission. The received signal on the SU side at each
r-th Rx antenna is squared and combined using the SLC approach. The energy of the signal received is further exploited in the SS based on the principles of comparing the energy of received signal with the deterministic signal threshold (
Figure 1).
The PU is the licensed owner of the frequency band and has an advantage in terms of spectrum access, whereas the SU only has access to the spectrum when PU is not transmitting. Then, the SU can utilize the spectrum without interfering with the PU’s operations.
Table 1 lists all the parameters exploited in the presented analyses.
The PU signal is sent using
m (
m = 1,...,
M) Tx antenna(s) in the analysed system and the transmitted PU signal is received using
r (
r = 1,...,
R) Rx chains of the SU. The
denotes the PU Tx power of the signal that is transmitted by the
m-th antenna. The total Tx power emitted by the PU over
M Tx antennas is
. The complex signal sent by the
m-th antenna is defined as
, where
and
represent an imaginary and real component of the transmitted signal, respectively. As a result, the SU receives the signal via every of the
r-th Rx antennas and samples it using the
N samples yielding the overall signal received by the SU which can be expressed as:
where
and
are complex vectors of
and
, respectively. The
is the communication channel gain among the
M Tx and
r-th Rx antenna,
is the received signal by SU at the
r-th Rx antennae during the
n-th sampling moment. Additionally, and
represents additive white Gaussian noise (AWGN) associated with the received signal at the
r-th Rx antennae of SU.
It is assumed that the noise can be represented as a Gaussian random variable at the SU with a mean equal to zero and a variance equal to . Moreover, assuming that the received signal distribution is circularly symmetric, the ratio of signal and noise (SNR) at r-th antenna of the SU branch can be expressed as . For the case of all R Rx antennas in the n-th SS period, the total SNR is and the average SNR observed at the SU is =. s
An essential process for CRN is SS, which is dedicated to monitoring the occupancy of the frequency band by the SU in terms of the PU signal transmission or non-transmission. Thus, the current status of the sensing process can be described as testing the binary hypothesis with the variables
and
as formulated in Equation (2):
where hypothesis
indicates that the licensed spectrum is not occupied and hypothesis
implies that the licensed spectrum is not available for SU transmission. In the
n-th ED interval,
reflects the total signal received by the SU over the
R Rx branches. The goal of the ED process is to assess whether the observed signal
conforms to hypothesis
or
. As a result, the existence or absence of a PU transmission in every moment is identified by comparing the energy of the PU signal sensed by all
R Rx branches with those set by the DT.
When the sensed energy of the PU signal detected at all R Rx chains of the SU exceeds the set DT, hypothesis is proven and the spectrum is occupied with the PU transmission. Hypothesis will be confirmed if the measured energy of the PU signal detected by all R Rx chains at the SU site is less than the set DT which suggests that the frequency spectrum is free.
Properties of the Receiver Operating Characteristic Curves
The primary function of SU is to detect spectrum holes using a specific SS method. Methods for detecting PU signal transmission are thus critical for analysing the cognitive capabilities of SUs in CRNs. Two metrics are used to evaluate the SS quality, specifically false alarm probability and detection probability. The probability of a false alarm characterizes the case when the SU reports that a PU signal is present in an unoccupied spectrum. Additionally, the likelihood that SU will perform a correct assessment of the existence of PU when PU really occupies the frequency spectrum is defined as the detection probability.
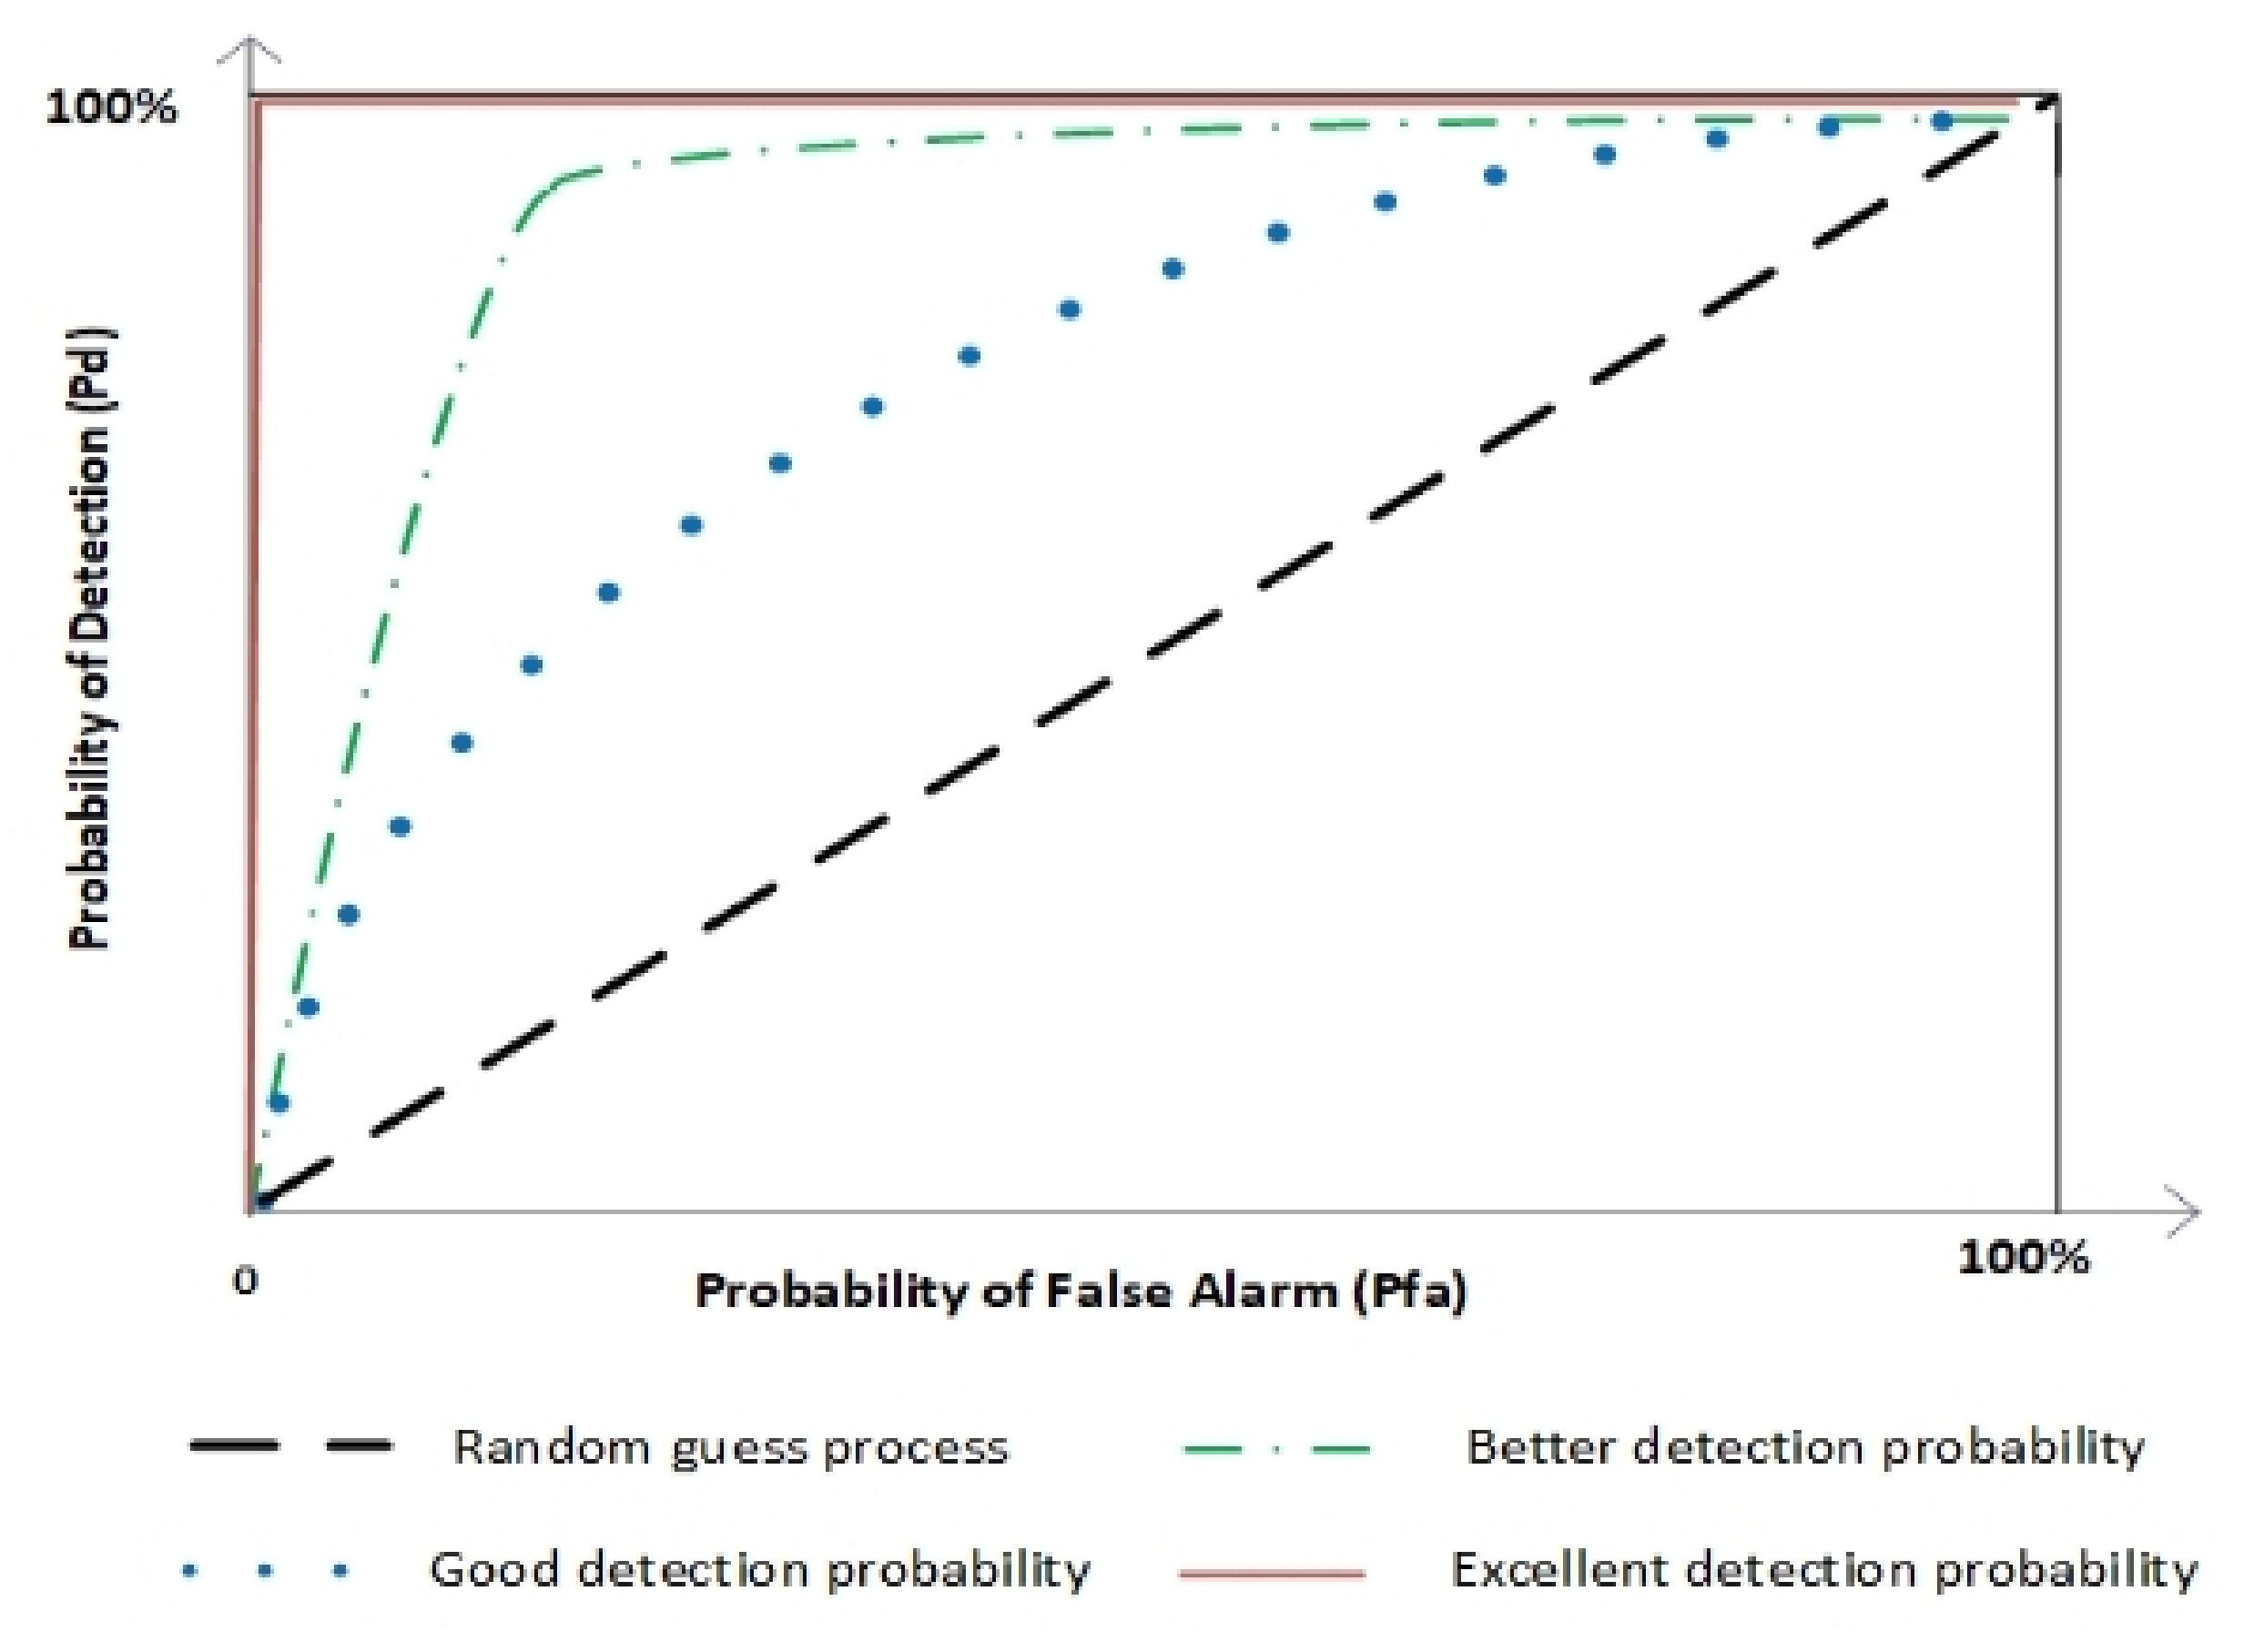
In this paper, ROC curves are used to present the performance of the ED approach. The ROC curve illustrates the relationship between the false alarm and the probability of detection (
Figure 2). The precision of the ED process based on binary hypotheses
H0 and
H1 is comparable to that of a random guess. As shown in
Figure 2, spaces above or below the curve presenting random guess processes represent the good or poor signal detection accuracy, respectively. If the line is near the random guess curve, the ED process is less precise and vice versa (
Figure 2). Additionally, the area under the curve (AUC) is a dimension used to define precise signal detection. The greater the area under the curve, the more precise the signal detection is, and vice versa (
Figure 2). The ROC-AUC model is being further used in this work as it represents the most commonly used model for analysing PU signal detection efficiency.
4. Mathematical Description of the Principles of ED Using SLC in MIMO-OFDM Systems
During the ED of signals admitted at all
R Rx chains of SU using SLC techniques, the process of squaring and combining the signal is performed to form the overall detected energy of the signal, referred as test statistics (
. The aggregate test statistics are expressed as follows:
where
presents the test statistics of the signal received at
r-th Rx antenna of the SU. In order to decide whether a signal is present or not in an analysed frequency band, the total test statistics are compared to the detection threshold
. The process is executed for each sensing sample
n used during ED and can be expressed as:
where
can be dynamically adjusted according to the level of noise in the wireless channel or it can be statically assigned and fixed during the whole ED SS period.
According to [
16,
23], the test statistic from Equation (4) can be represented using normal distribution as:
where
[ּ ] represents the expectation operator, while
[ּּ ] represents the variance operator.
For the n-th SS sample, is used to express the channel gain of the signal received at the r-th Rx antenna. Assuming for simplicity that there is an equal channel gain during n-th sample period on every of R Rx antenna, the complex channel gain is assumed to be . Similarly, to reduce the complexity, the noise variance at the r-th Rx antennas can be assumed to be equal in every of R Rx antenna and thus is expressed as . Consequently, in the n-th sensing interval, the total PU Tx power is equal to . Thus, the relationship between the average SNR values and PU Tx power at the SU site is given as .
According to this knowledge, the overall test statistics from Equation (3) can be approximated as:
According to Equation (6), the entire test statistic at the SU site depends on several parameters that include (
R) representing the number of Rx chains, the
representing noise variance, the
N indicating the overall number of detection samples, and the
representing signal-to-noise ratio.
The following sections present analytical models expressing interdependence of the detection and false alarm probabilities and the role of the level of DDT and NU factors on the ED process. The initial parts of the analytical models presented in the following sections have been partially explained in [
19] for SISO and in [
22] for MIMO-OFDM systems.
4.1. Mathematical Representation of the Detection and False Alarm Probability in MIMO Systems
With respect to Equation (6), the mathematical formulation of the detection and false alarm probability is represented as follows:
where Q (.) denotes the Gaussian Q-function expressed as
. By analysing (7) and (8), it can be noted that
and
probabilities depend on the number of Tx-Rx chains on each side, as well as the total number of detection samples, the total noise variance (
), and the levels of false alarm and detection thresholds. Equation (7) also shows that the
values depend on PU Tx power.
High values of mean that opportunities for reusing the shared frequency spectrum are missed. Thus, a minimum false alarm probability () must be kept to maximize the spectrum efficiency. Furthermore, good detection performance necessitates maximizing the detection probability (). High and low probabilities lead to the suitable protection of PU and a suitable quality of service (QoS) for the SU in terms of ED precision.
Based on Equations (7) and (8), and considering that the DT in the equations is essentially the same (
, the
can be formulated as a function of
as follows:
where
represents the inverse standard Gaussian Q- function. From Equation (9), it can be concluded that if a specified level of false alarm probability is well known, then the PU signal detection can be obtained without the exact knowledge of the level of DT.
4.2. Mathematical Formulation of the Role of Detection Threshold on ED Process
As shown in Equations (7) and (8), the detection and false alarm probability depend on the proper DT settings. The choice of the threshold is an essential step in the sensing process that determines whether the PU signal is present or not. For the FDT, the set DT value is constant, even when noise power fluctuation exists in the wireless channel.
In the FDT approach, the DT based on guaranteeing a constant false alarm rate (CFAR) is often chosen for the specified false alarm probability (
), noise variance
and the number of Rx branches. Following the CFAR principles, the threshold of false alarm (
) for the concept of ED employing SLC can be expressed as:
In the case of the CFAR approach, the threshold values are selected to ensure the highest detection probability. The CFAR approach is used in the ED process when, for the maximum utilization of the channel, the false alarm probability must be set to some small and predefined fixed values (
), whereas the detection probability needs to be maximized (
).
Similarly, to guarantee the priority of PU transmission, the expression for the detection threshold level selection based on the constant detection rate (CDR) principles is derived from Equation (7):
The CDR method is used to reduce the leverage of interference during the observed SS period. Based on Equations (10) and (11), it can be concluded that DT based on CFAR principles (Equation (10)) does not require information about PU Tx power. The result is a greater use of CFAR principles in real implementations. Additionally, CFAR principles enhance the throughput of the SU signal, but it does not guarantee sufficient security for the licensed PU in terms of possible transmissions overlapping with the SU. Consequently, using the DT set on CFAR principles is not the most appropriate approach to the selection of DT.
As fluctuations in noise power in real wireless channels represent regular phenomena, more precise signal detection can be accomplished through DDT selection during the ED process. To obtain maximum detection accuracy, the DT level should be adjusted dynamically in time according to the NU fluctuations of the detected signal. This yields an approach to realizing ED that is based on the principles of DDT selection. Such an approach to ED can reduce the number of errors in the SS process and thus provide sufficient protection of the PU signal against overlapping in transmissions with SU. This results in better spectrum usability. The DDT principles achieved through the dynamic selection of DT represent the most appropriate solution for precise signal detection in the targeted frequency spectrum. However, the implementation of DDT principles in realistic wireless systems is very demanding.
For the mathematical formulation of the DDT concept, the DT adaptation level is expressed with the DDT factor
(
) in the further analyses. The values of the DDT factor determine the level of DDT adaptation and unlike the fixed values based on FDT, the DDT values are assumed to be in the interval
. When an ED process employing the SLC technique exploits the DDT adjustment in the MIMO communication system, the detection (
) and false alarm probabilities (
) can be defined as:
where
represents a number of sensing samples,
the detection threshold and
the false alarm threshold. Based on (12) and (13), the probability of detection can be formulated in relation to the probability of false alarm in CR systems, where the PU signal is detected by employing DDT adjustments:
If the DDT factor is fixed and set to 1 (= 1), Equation (14) is identical to Equation (9) and the DDT adjustment does not exist. If the DDT factor is greater than 1.00 ( > 1.00), some level of DDT adaptation is implemented in the process of ED. A greater DDT factor leads to a higher scope of DDT level for potential selection.
4.3. Mathematical Formulation of the Role of Noise Uncertainty in the ED Process
Equations (12) and (13) reveal that the threshold values depend on the precise knowledge of noise variance (
). As the noise level in a wireless channel is variable in time, predicting in advance exact information about the level of noise variance (
) in every moment of the ED process is a highly demanding task. The NU, therefore, refers to the lack of knowledge on the exact information about the noise power during the ED process. Uncertainty in noise power reduces the precision and accuracy of the PU signal detection. However, to simulate the realistic operations of the MIMO-OFDM system, the impact of NU in the wireless channel must be considered in the ED performance evaluation. Therefore, these fluctuations in noise power are considered through the NU factor
(
). To demonstrate the impact of NU variation, in the analysis, the scope of NU variation is assumed to be in the range
. The detection and false alarm probabilities in a scenario that considers such a fluctuation in noise power can be expressed by:
where
and
represents the detection and false alarm thresholds, respectively. From Equations (15) and (16), it can be concluded that choosing adequate values of thresholds (
and
) can significantly improve the ED process.
The probability of detection
can be defined with respect of the probability of a false alarm
in the channel impacted by NU as follows:
If the NU factor is set to 1.00 (= 1.00), there is no fluctuation in noise power and Equation (17) is identical to Equation (9). If the NU factor is greater than 1 (> 1), the impact of NU is present in the wireless channel. Greater values for the NU correspond to the simulation of the wireless channel which is impacted by more fluctuations in noise power and vice versa.
4.4. Mathematical Formulation of the Combined Role of Noise Uncertainty and Detection Threshold on the ED Process
Involving DDT in the ED process considerably increases ED effectiveness and reduces the adverse effects caused by NU. The most realistic simulation approach to implementing the ED with the SLC method in the MIMO-OFDM transmission system is an analysis of the joint role of DDT adaptation and NU variation on ED performance. However, this scenario is the most challenging for simulation or practical implementation since it demands the continuous estimation and adaptation of DDT according to the NU level.
In this case, NU and DDT parameters were used to model detection and false alarm probabilities. To model noise variance, bounds in the interval
were used to model NU fluctuation, while to model the DDT adaptation boundaries, the interval
was used. The detection (
and false alarm (
) probability was given as follows:
According to Equation (18), DT (
) can be expressed with respect of the detection probability:
Furthermore, according to Equation (19), the false alarm threshold can be defined with respect of false probability as follows:
According to Equations (20) and (21), the minimum number of sample points required for precise signal recognition can be determined according to Equation (22):
The probability of detection can be defined with respect of the false alarm probability as
According to Equation (23), the NU and DDT parameters affect the sensing efficiency of the PU signals. The purpose of this work was to examine the influence of varying degrees of NU fluctuations and DDT adaptations on the precision of the ED process in the MIMO-OFDM system.
5. Implementation of the Simulation Algorithm
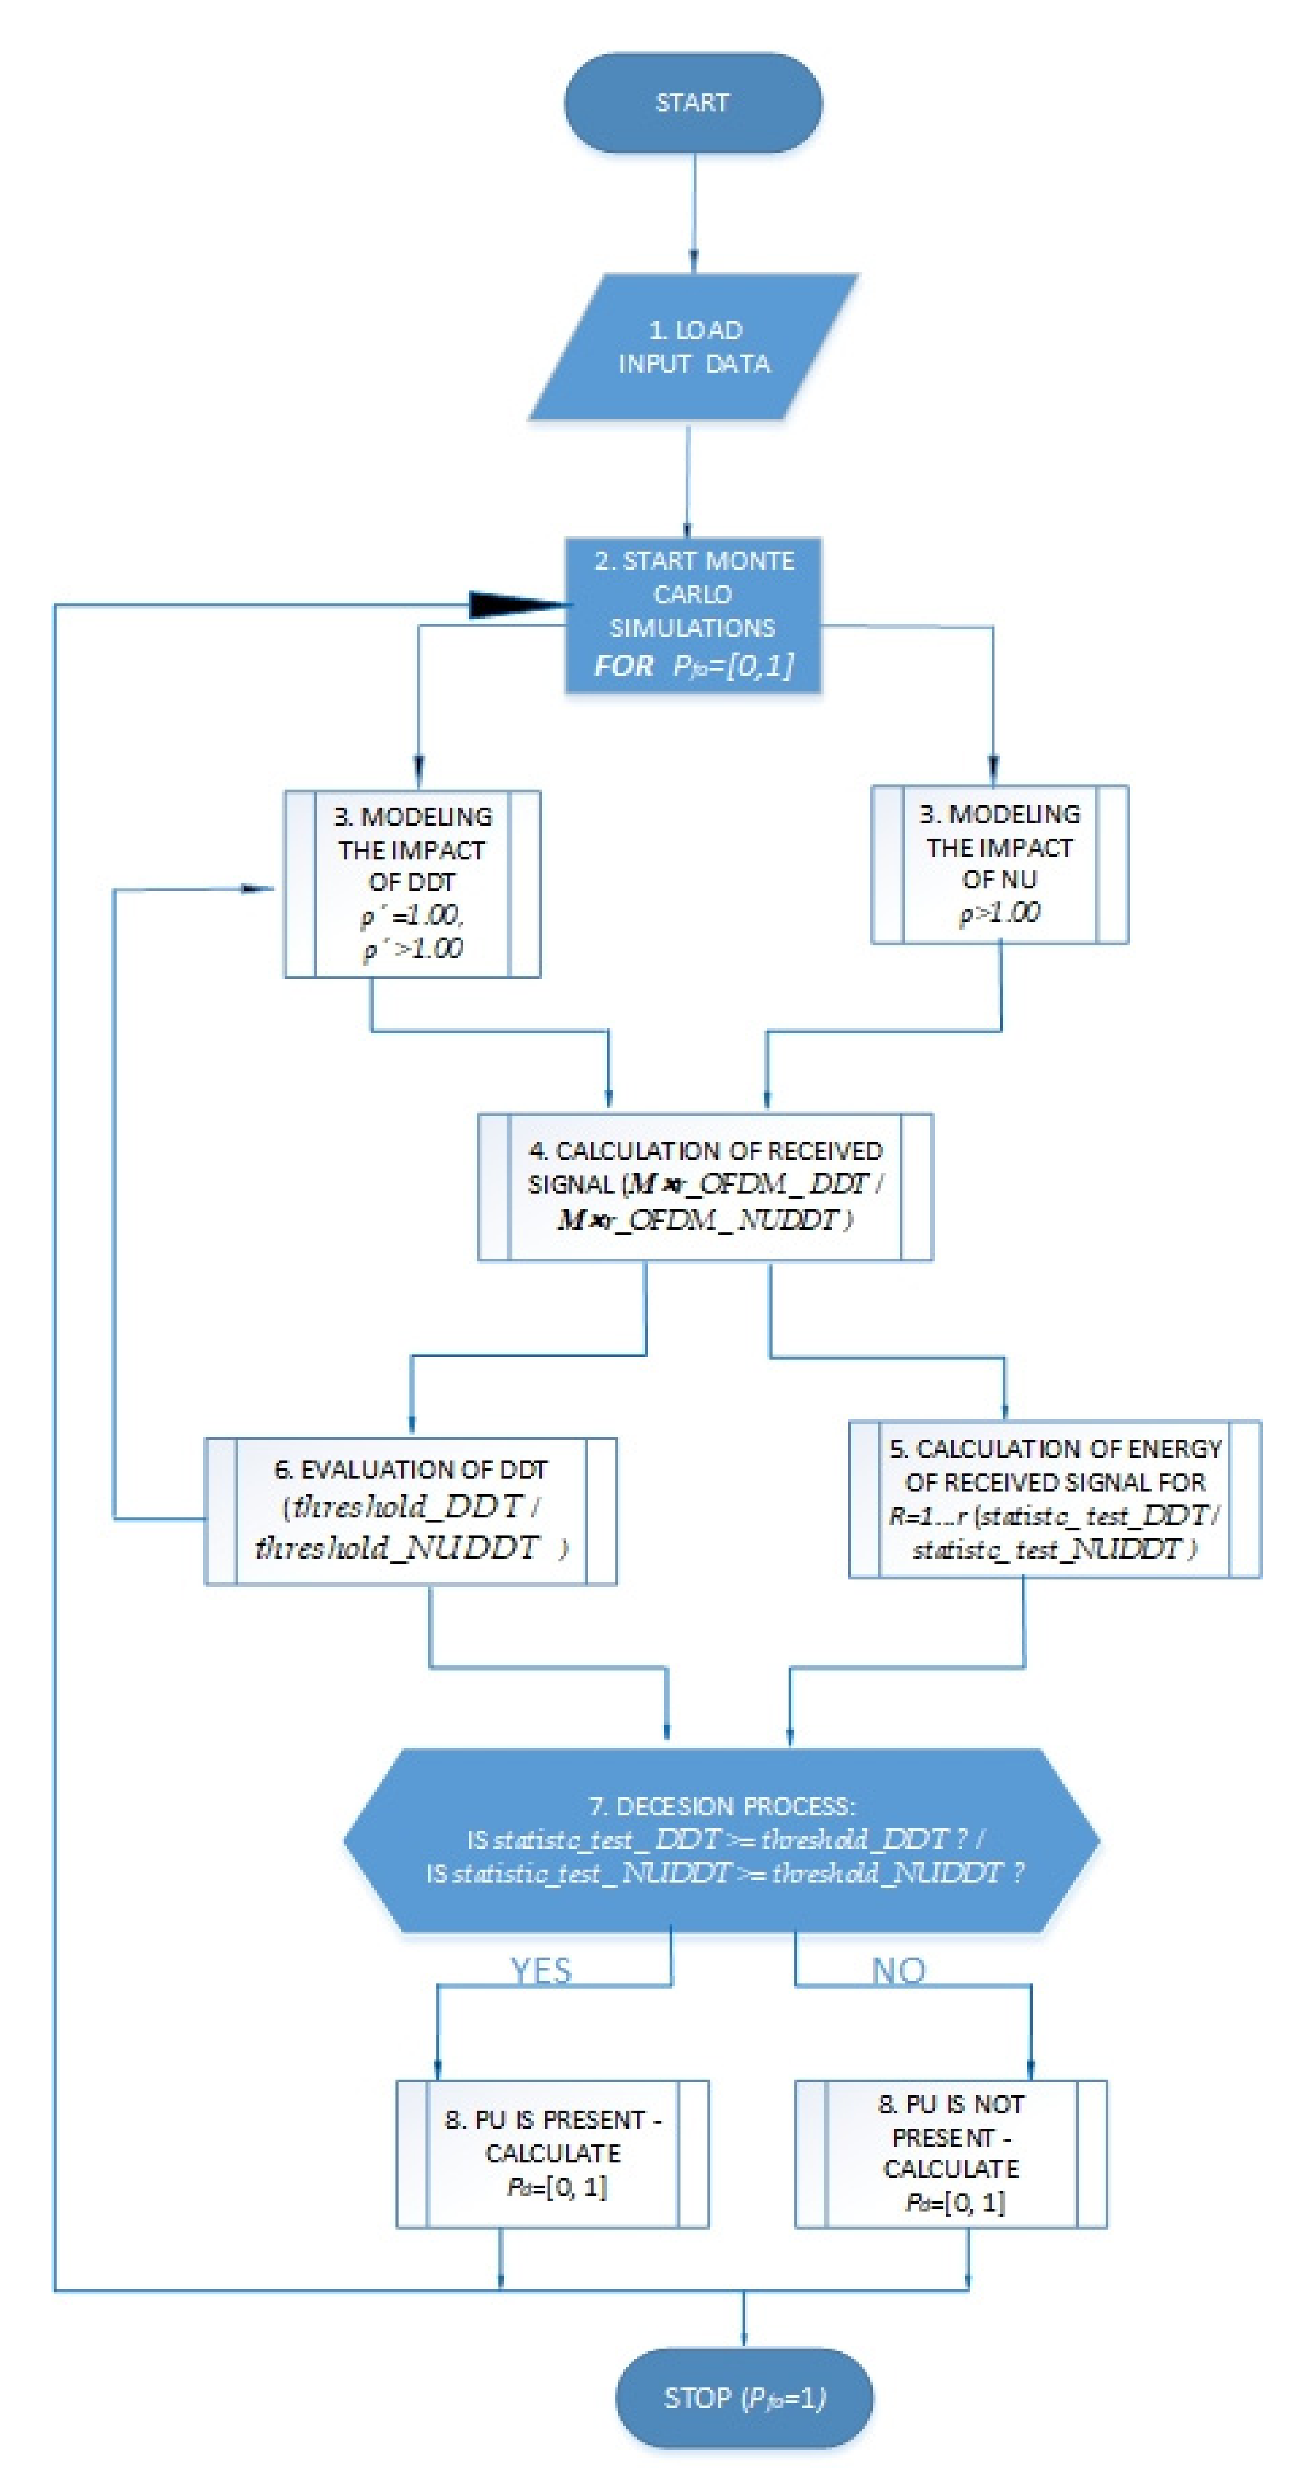
Algorithm 1 presented in this section was used to assess the accuracy of the ED SS process by employing the SLC method in the CRNs based on the MIMO-OFDM transmission. The algorithm was executed in Matlab software and it enabled the simulation of PU signal detection when impacted by different levels of NUs and DDTs. The flowchart presenting the workflow process of Algorithm 1 is shown in
Figure 3.
| Algorithm 1. Simulation phases of the ED SS employing SLC with one PU and one SU in a wireless communication system. |
1. Input: Number of Rx antenna: r = R, Number of Tx antenna m = M,
Modulation type: m-PSK/m-QAM, Number of detection samples: N,
Tx power of PU: PTx, Number of Mote-Carlo simulations: mk,
OFDM symbol length: length_mimo_ofdm_data,
transmitted signal by the PU: M⨯r.
2. FOR range [0,1] and
FOR a number of mk iterations
3. Modelling the impact of AWGN noise with variance
AWGN_DDT (= 1.001.00)=
sqrt( = 1.00).*randn (1, leght_ data_ ofdm _ mimo);
AWGN_NUDDT (ρ > 1.00, p’> 1.00)=
sqrt( > 1.00).*randn (1, leght_ data_ ofdm _ mimo);
4. Computation of received signal impacted with AWGN
M⨯r_OFDM_ DDT = M⨯r + AWGN_DDT;
M⨯r_OFDM_ NUDDT = M⨯r + AWGN_NUDDT;
5. REPEATE FOR r= 1:R energy calculation
calculation _energy_ DDT = abs(M⨯r_OFDM_ DDT).^2;
calculation _energy_ NUDDT= abs(M⨯r_OFDM_ NUDDT).^2;
END
6. FOR r = 1:R calculation based on (3)
statistic_ test_DDT = sum(calculation _energy_ DDT);
statistic_ test_NUDDT = sum(calculation _energy_ DDT);
END
7. Evaluation of according to (21)
threshold_DDT = ((qfuncinv()./sqrt(N))+ 1)./;
threshold_NUDDT = ((qfuncinv().* ρ./sqrt(N))+ ρ)./;
8. Process of making a decision based on (4)
IF (statistic_test_ DDT >= threshold_DDT);
END
IF (statistic_test_ NUDDT >= threshold_NUDDT);
END
END
9. Evaluation and using Monte Carlo
simulation (based on (2))
END
10. Until = [0, 1] |
After defining the initial simulation parameters of Algorithm 1, in line 1, the generation of the PU signal and the reception of this signal over the
R Rx antennas of SU were performed according to the principles of MIMO-OFDM transmission. As a result, the OFDM signal vector (
Mxr) represented by Equation (2) was computed for each of the SU Rx branches. In lines 2–10 of Algorithm 1, the ED procedure employing the SLC technique was performed (
Figure 3). The
Mxr signal detected at each of the
R Rx branches of the SU, serves as the input signal of the ED process. To get reliable simulation results, several Monte-Carlo simulations (
mk) were executed, and the efficiency of the ED method was assessed through the generation of ROC curves for the probability of false alarms in the range [0, 1] (
Table 2). The impact of the AWGN with zero mean and variance
on ED process was modelled in line 3 of Algorithm 1.
In line 4, a computation of the received signal impacted by AWGN was executed (
Figure 3). The received signal
Y(n) (
Figure 1) was divided into two different types. The first type of received signal (
M⨯r_
OFDM_ DDT) was detected using the DDT adaptation for the MIMO-OFDM communication system which is not impacted by the NU variations (
= 1.00,
> 1.00). The second type of the MIMO-OFDM signal (
M⨯r_
OFDM_ NUDDT) was detected by the DDT adjustments in a simulated environment which takes into consideration the impact of the NU variations (
> 1.00,
> 1.00). By employing the SLC approach, the energy calculation of the signal detected over all
R Rx antennas (
calculation _energy_ DDT,
calculation _energy_ NUDDT) was performed in line 5 of Algorithm 1 (
Figure 3).
In line 6 of Algorithm 1, the assignment of the test statistic was performed by combining the energies of the signals received from the
R Rx branches in accordance with the Equation (3). This process resulted in the calculation of the two variants of test statistics (
Figure 3). In the first variant, the calculation of the test statistics was executed based on the signals detected using DDT selection (
statistic_ test_DDT) in an environment lacking any impact of NU. In the second variant, the test statistic calculation was executed on the signals impacted by NU and for the ED performed with DDT selection (
statistic_ test_NUDDT). Based on the test statistics in line 7 of Algorithm 1, the two false alarm thresholds according to Equation (21) were calculated (
Figure 3). The first threshold was computed without considering the NU variations (
threshold_DDT), while the second calculated threshold included the effect of NU fluctuations on the ED performed by exploiting the DDT adjustments (
threshold_NUDDT).
Finally, in line 8 of Algorithm 1, the decision-making process was executed using the binary hypothesis testing according to Equation (4). Hypothesis
is confirmed if the received signal energy from all Rx antennas is greater than or equal to the threshold (
threshold_DDT or
threshold_NUDDT). This confirms that the PU occupies the licensed band (
Figure 3). In contrast, if the received energy at the SU is lower or equal to the DDT, hypothesis
is correct and the PU is not transmitting which allows the SU to reuse the spectrum (
Figure 3). Line 9 of the algorithm indicates that for each simulated case, 10,000 Monte-Carlo simulations were run to determine the probability of detection which is according to line 10 in the range [0, 1].
6. Simulation Results and Analysis
This section describes the simulation software used to implement the ED using the SLC approach in the MIMO-OFDM transmission systems and the observations gained from the simulations. The SLC method investigates the performance of the ED process in the SISO, asymmetric and symmetric MIMO systems. The simulation was performed for simulation configuration based on one PU and one SU. Different NU () factor values illustrate the effect of the NU variations on the SS process. Additionally, versatile DDT factor values () illustrate the effect of NU variations on the SS process. The results demonstrate how the amount of PU and SU communication chains, the amount of detection samples used during SS, the OFDM modulation types, the Tx powers of PU, and the versatile levels of DDT and NU factors affect the accuracy of the ED process expressed with ROC curves.
6.1. Review of the Simulation Software and Parameters
The assessment of ED precision was performed using various operational parameters through simulations using the Matlab software. All parameters utilized in the assessment of the ED performance efficiency are listed in
Table 2. The transmission of the PU signals was simulated using the QPSK, 16 QAM, and 64 QAM modulations, which represent the frequently applied modulation constellations in real MIMO-OFDM communication systems. Different numbers of detection samples during the SS equal to 128, 256 and 512 were used for the analysis of the ED performance (
Table 2). The SNR values of the received signal at the SU used in the analyses were −20 dB, −15 dB, and −10 dB. They represent typical operating SNR values in MIMO-OFDM communication systems.
Furthermore, the false alarm and detection probability intervals based on which the ROC curves will be plotted are in the designated range [0, 1] (
Table 2). Specific values for the NU and DDT factors were used to express the impact of variations in noise power and DT adaptation on the sensing performance. More precisely, the values of the factors expressing NU and DDT equal to 1.05 and 1.03 indicate a higher or lesser influence of NU fluctuations and DDT adaptations (
Table 2) on the simulated ED process, respectively. As a compromise between simulation quality and simulation time, 10,000 Monte Carlo simulation runs per each case study were employed to get simulation results with an appropriate accuracy (
Table 2).
Such a large number of Monte Carlo simulations enables the repeating of ED performance tests. However, they can hardly be performed in real practical environments since 10,000 simulations performed for each of 69 case studies analysed in this work (690,000 in total) will be highly time-consuming if it will be performed in a real environment. Hence, Monte Carlo simulations represent an important approach to verifying the confidentiality of obtained results and are a valuable tool for numerical analyses of complex wireless systems [
24]. These are the main reasons why practical experiments have not been performed and instead, in further sections we present results obtained through comprehensive Monte Carlo simulations.
6.2. The Role of the Number of Tx-Rx Chains in the ED Sensing Efficiency
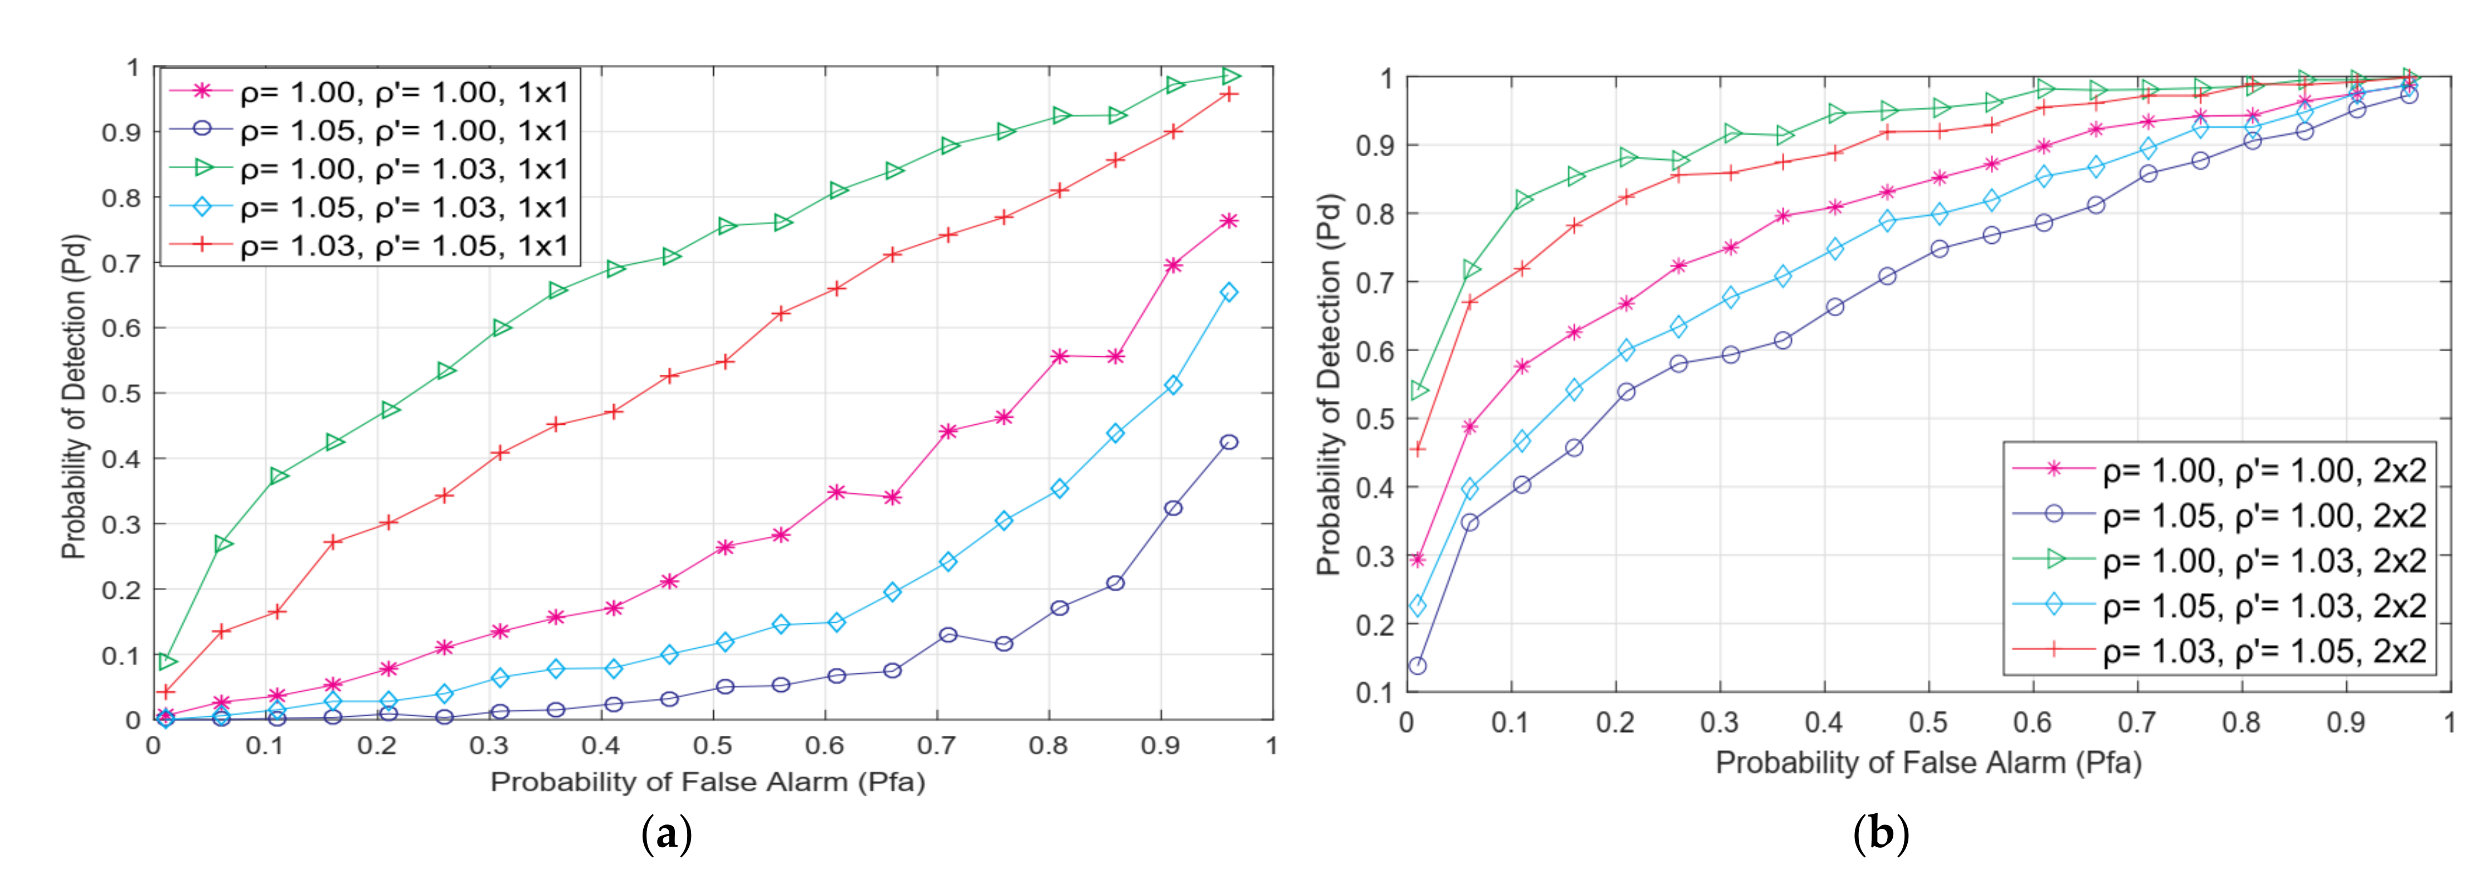
Figure 4 shows the ROC curves for various NU and DDT factor combinations in symmetric 2 × 2 MIMO and SISO communication systems. The results of the simulations were derived using the same number of detection samples (128), an identical level of SNR (−15 dB), and the same PU Tx power (100 mW). For the same channel characteristics, the detection probability is equal to the versatile modulation techniques (QPSK, 64 QAM and 16 QAM). This is indicated as the m-PSK/m-QAM in figures presenting ROC curves.
According to
Figure 4, the higher number of Tx branches on the PU side and Rx branches on the SU side contributes to the improvement of ED efficiency. While the results presented in
Figure 4a confirm the weak ED precision in SISO systems (which is no better than a random guess), in
Figure 4b, for the same operating environment communication system with one additional Tx and Rx branch (2 × 2) contributes to the enhancement of ED precision.
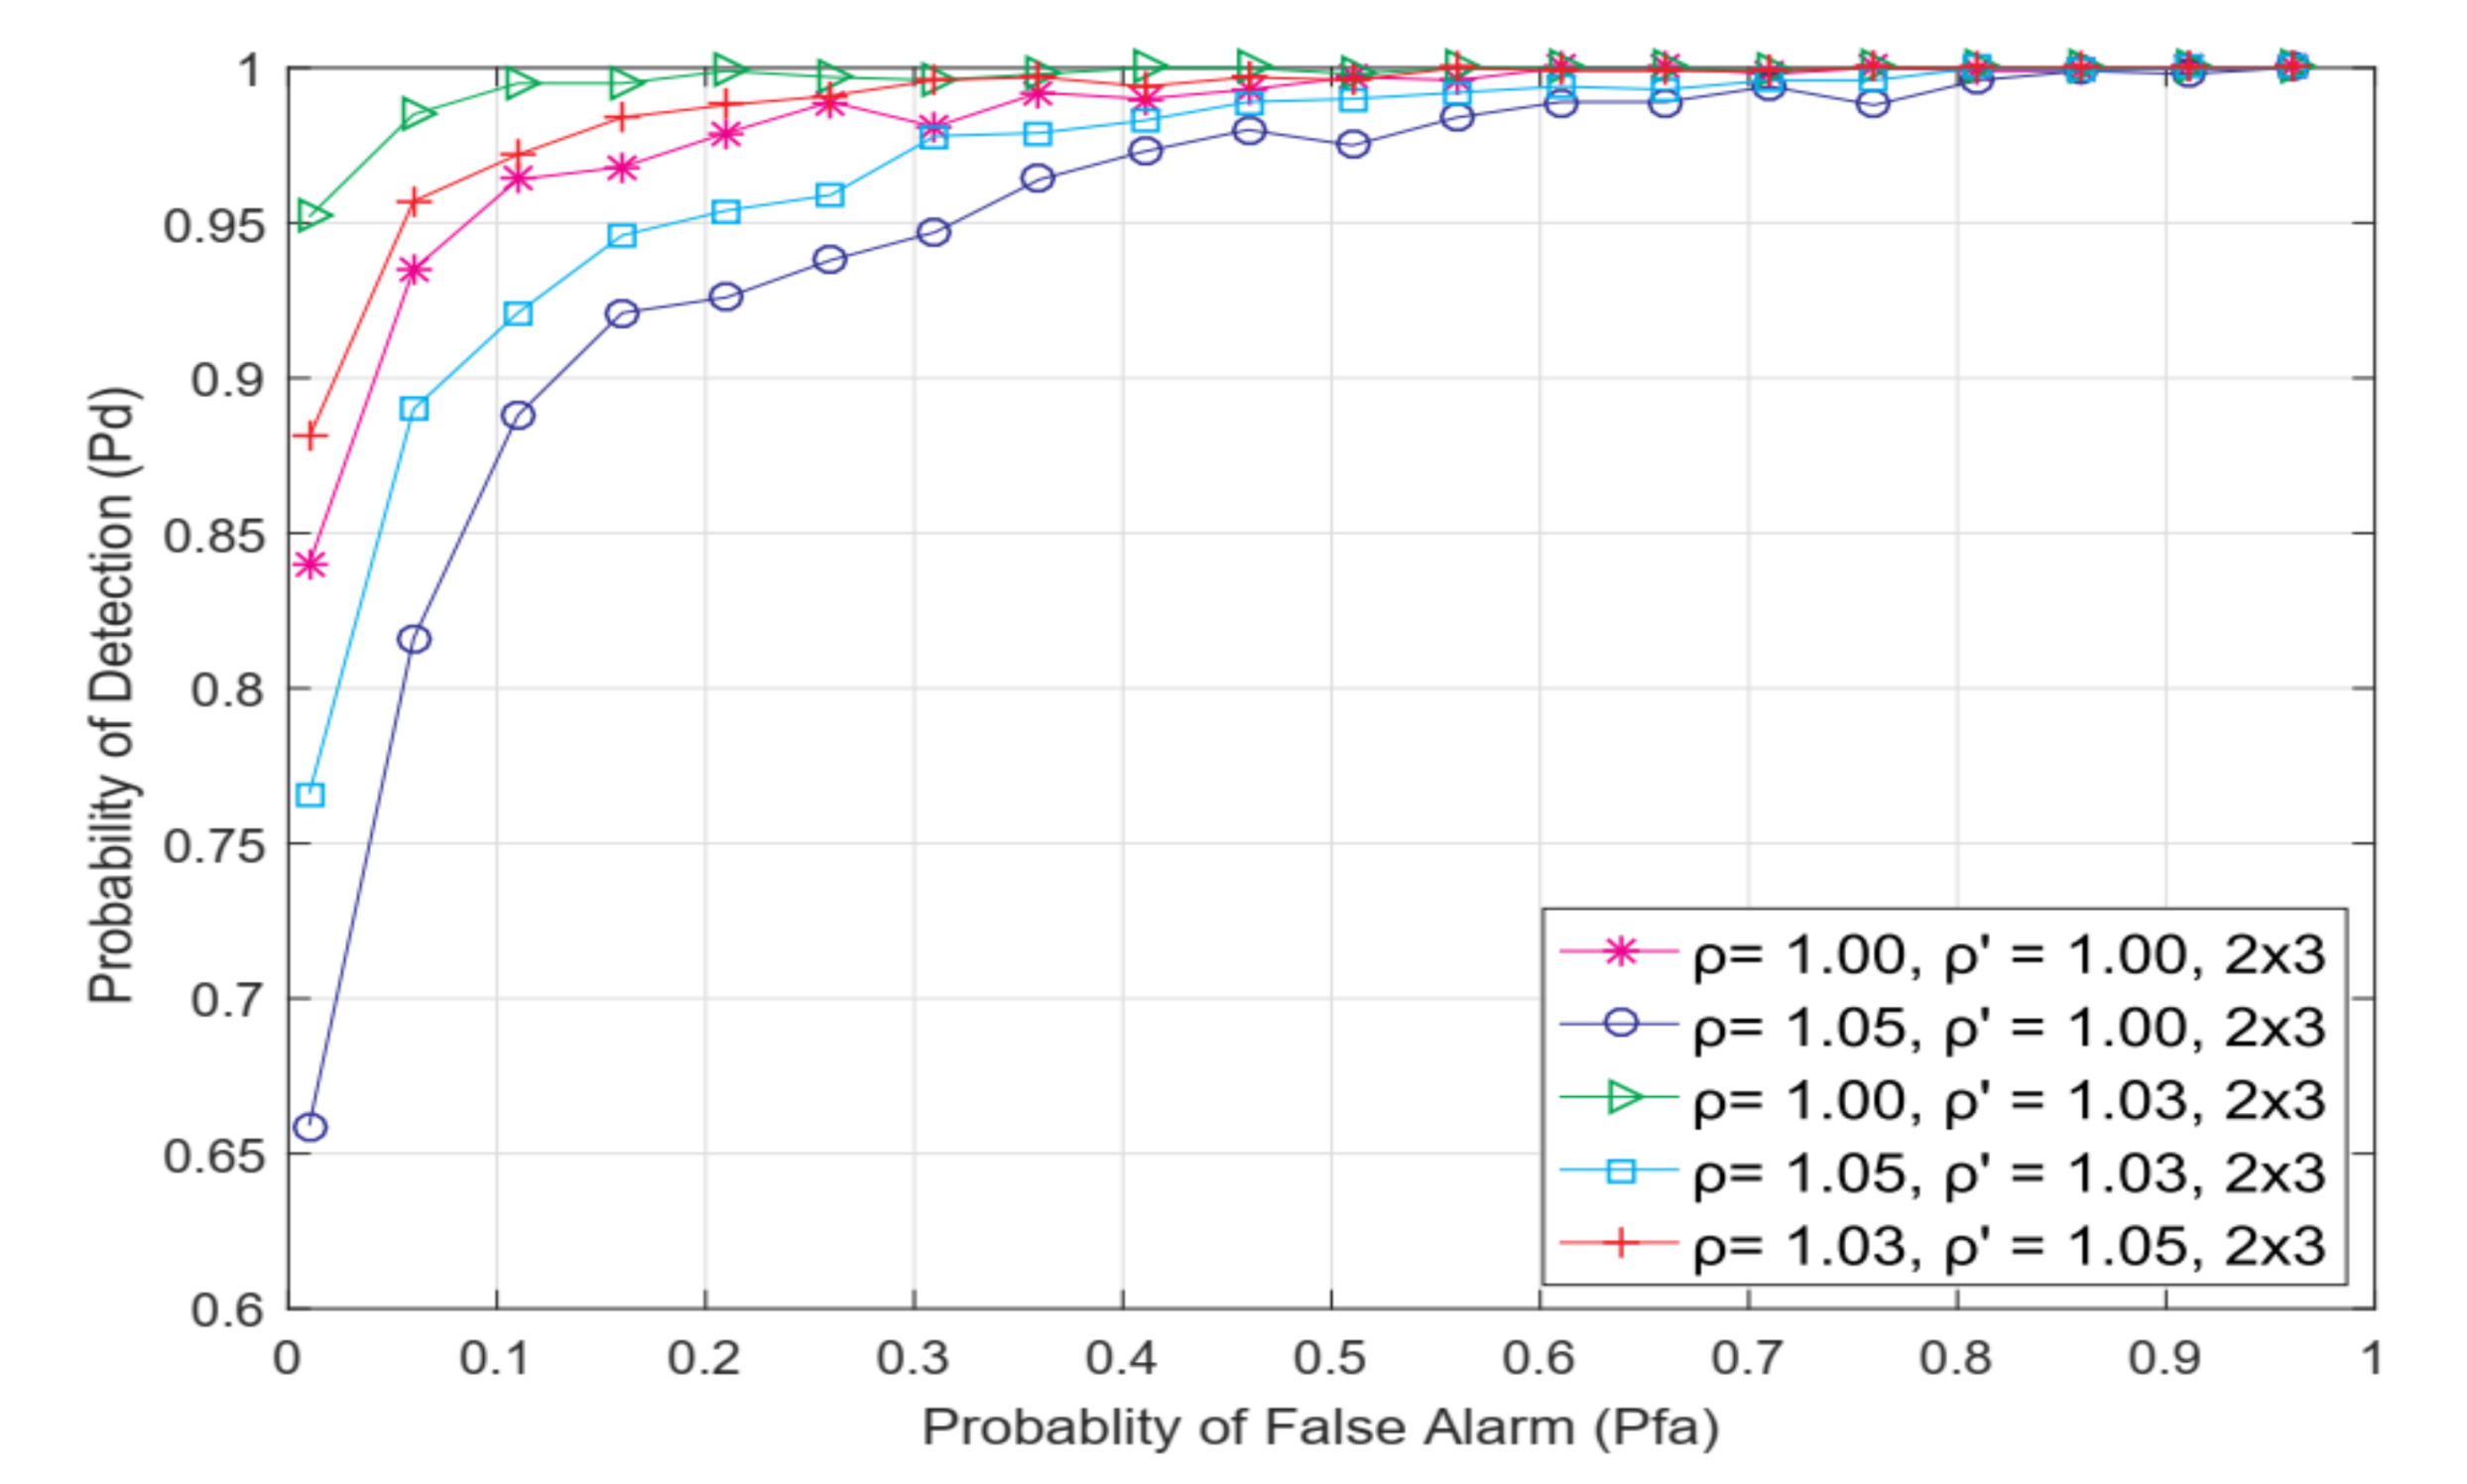
In
Figure 5, even better results are shown for the asymmetric 2 × 3 MIMO communication system, which yields the conclusion that an increase in the number of Rx antennas will, for the same radio environment, participate in contributing to the enhancement of the ED precision. Therefore, a larger number of Rx and Tx antennas on both the SU and PU sides has a beneficial influence on the ROC curves in terms of the improvement in the probability of detection for the same probability of false alarm in the MIMO-OFDM wireless system.
6.3. The Role of Various DDT Adaption Levels and NU Fluctuations on the ED Sensing Efficiency
The effect of various levels of DDT adaptation and NU variation on the detection probability in the ED process is also shown in
Figure 4 and
Figure 5. The performance of the ED process will be reduced when the NU variation increases for the same channel parameters and when no DDT adjustments are performed (
= 1.05,
= 1.00). Where there is a continual adaptation of DDT in line with the NU changes (
= 1.03,
= 1.05 and
= 1.05,
= 1.03), increased detection probability can be attained while maintaining the same value of false alarm probability (
Figure 4 and
Figure 5). Furthermore, for higher DDT levels of adjustment and lower NU variations (
= 1.03,
= 1.05), a higher detection probability will be obtained and vice versa (
= 1.05,
= 1.03). The highest chance of detection is obtained when DDT adaptation occurs in the absence of NU variations (
= 1.00,
= 1.03). However, this is not common in real-world wireless communication systems which are often characterized by noise power fluctuations. Hence, the results presented in
Figure 4 and
Figure 5 reveal that the enhanced probability of detection for all modulation techniques can be achieved if the SS process is realized through DDT adaptation. The level of the DDT adjustment needs to be performed according to the level of NU variations. Thus, greater levels of NU variations must be followed with a larger range of possible DDT levels for adjustments and vice versa.
The results presented in
Figure 4 and
Figure 5 also reveal that the OFDM modulation type has no effect on detection probability regarding any false alarm probability. In the case where signals with different modulations (16 QAM, 64 QAM and QPSK) are generated independently, the detection probability is the same for every modulation type denoted as m-PSK/m-QAM. These results are confirmed mathematically with Equations (7), (9), (12), (14), (15), (17), (18) and (23), indicating that adjusting the modulation types in rate-adaptive OFDM communication systems characterized by a constant Tx power does not affect the probability of detection in the ED process.
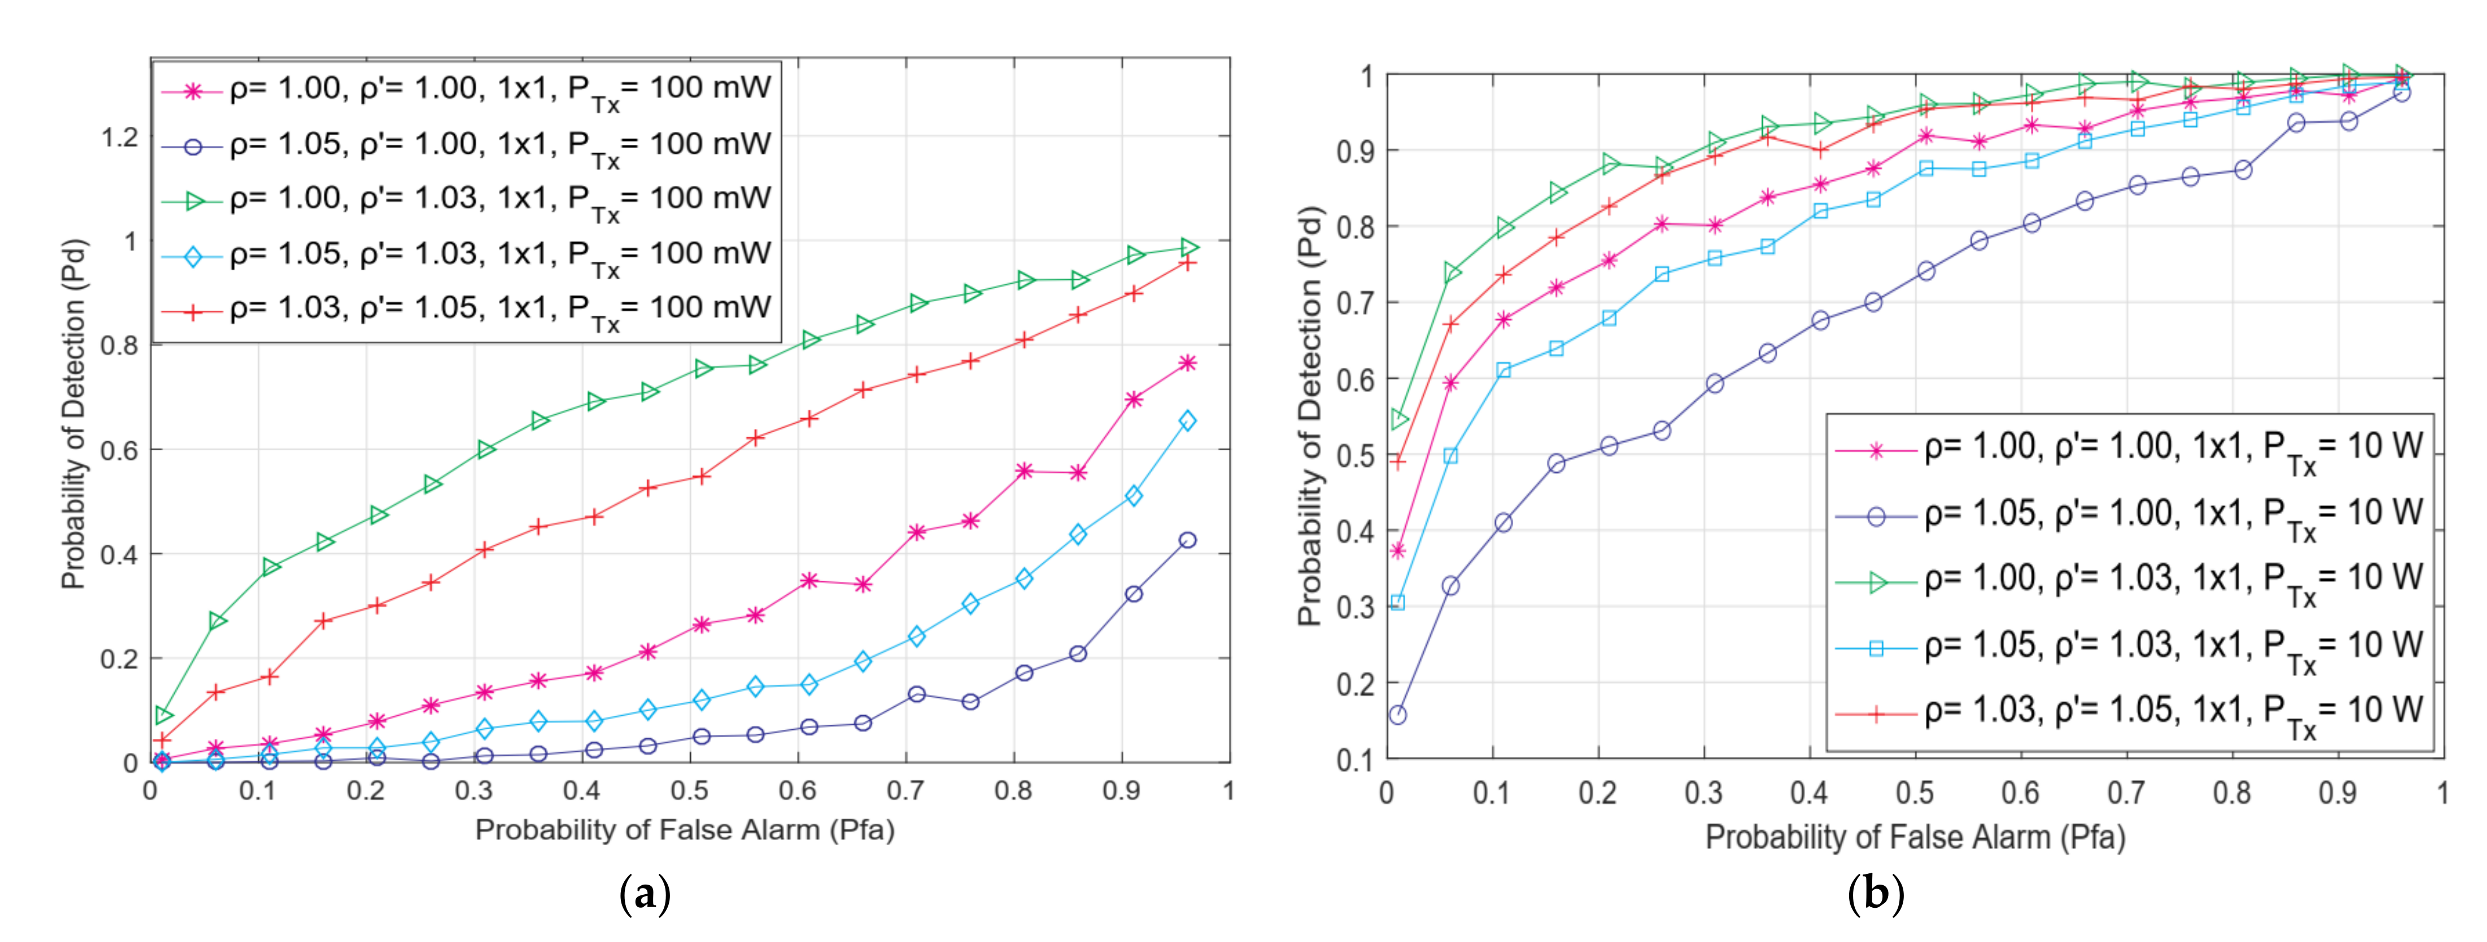
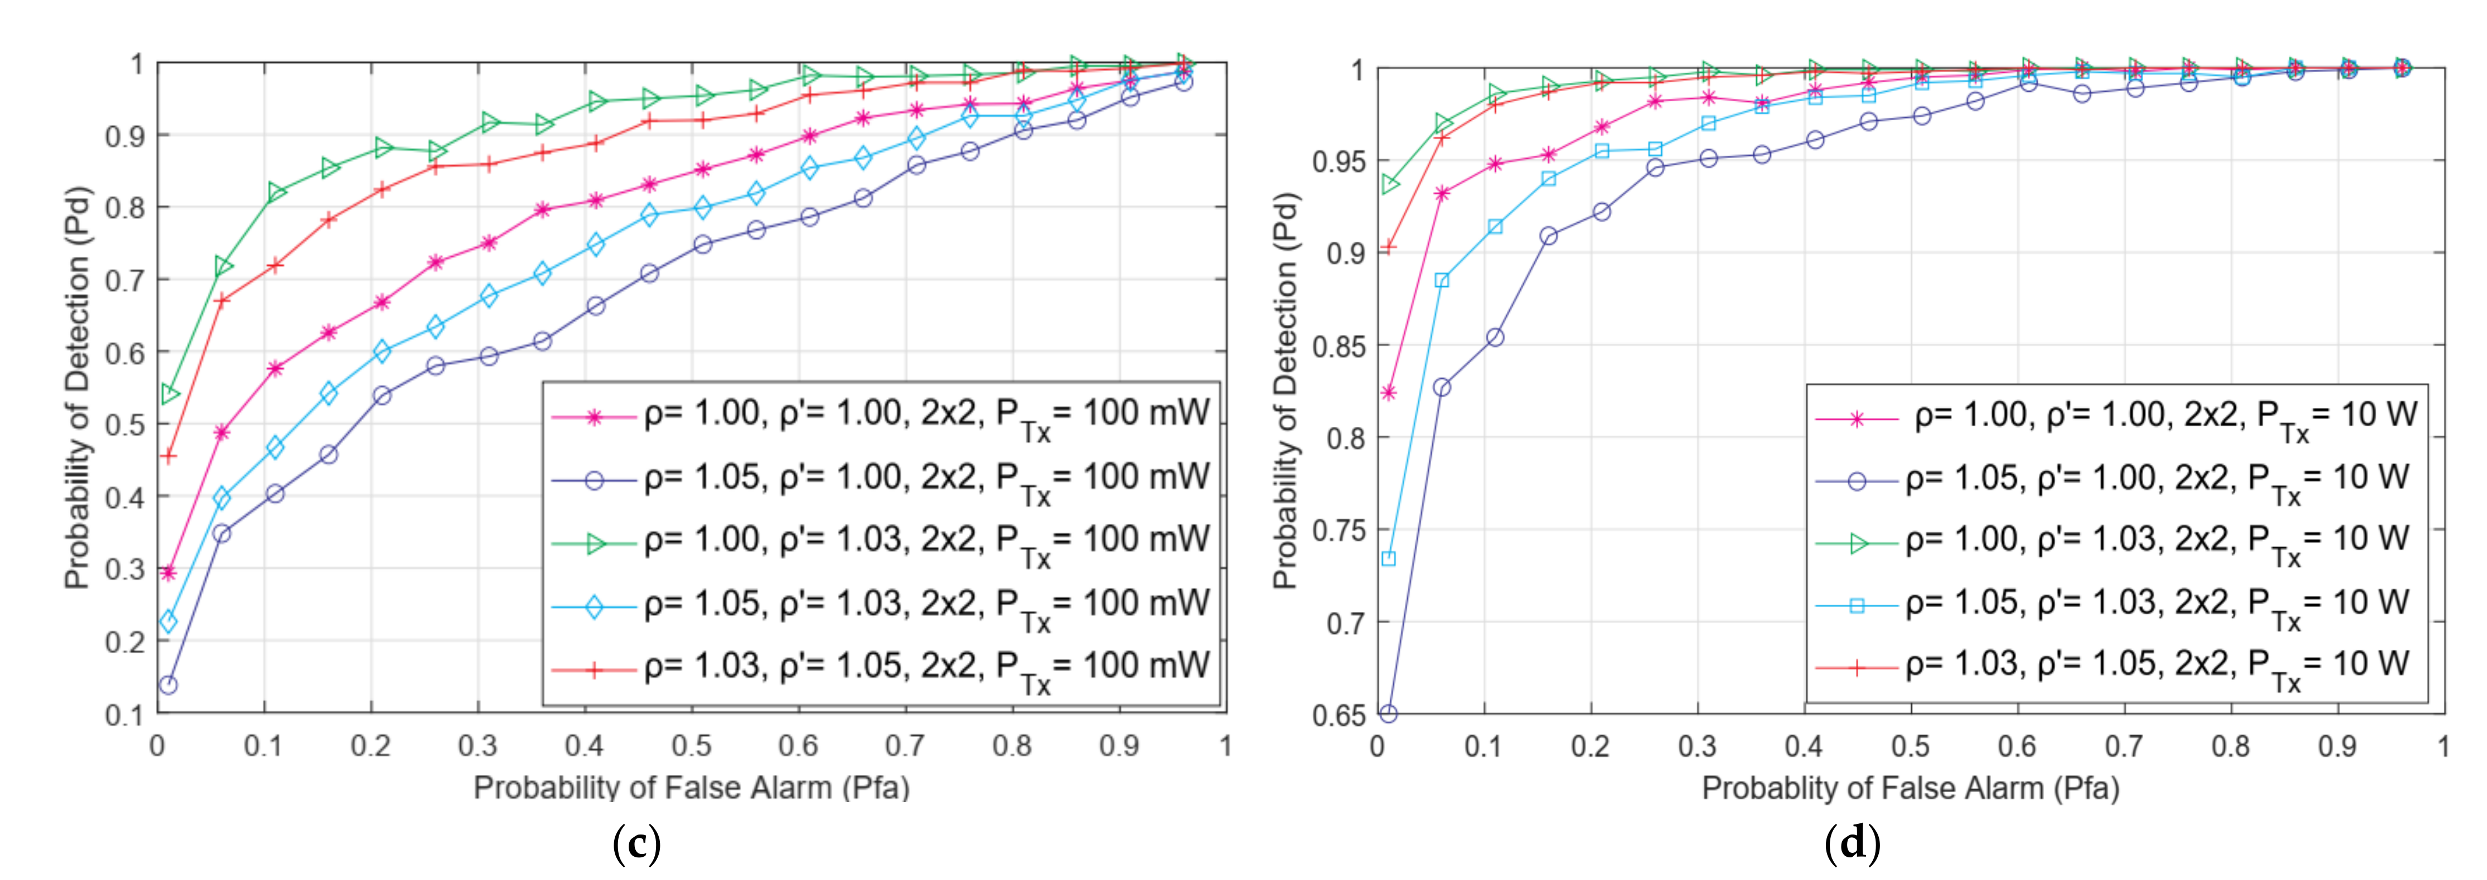
6.4. The Role of Various PU Transmit Power Levels on the ED Sensing Performance
The influence of the level of the PU TX power on the detection accuracy in the MIMO and SISO transmission systems is elaborated on in this subsection. The results of the simulations were obtained for the radio environment where SS was performed for a constant SNR value at the SU antenna (−15 dB), the PU transmission using QPSK modulation, the fixed number of detection samples (128), and the different NU and DDT factor values.
Figure 6 shows the results obtained in the form of ROC curves for the two PU Tx power levels of 10 W and 100 mW and the ED performed in the 2 × 2 MIMO and SISO systems.
Based on the results presented in
Figure 6, the transmission of PU signals at a higher Tx power yields a higher detection probability for a given false alarm probability. These results are predictable since the PU transmission at a higher Tx power eventually results in larger energy for the signal received by the SU Rx chains. However, the OFDM signals transmitted over more Tx and received over more Rx antennas (e.g., for 2 × 2 MIMO systems compared to SISO systems) and at a greater Tx power level (e.g., at 10 W compared to 100 mW) can significantly contribute to the amendment of the probability of detection (
Figure 6). In
Figure 6, the obtained results show that the combination of higher PU Tx power and the number of Tx-Rx antennas at the PU and SU, significantly contributes to the improvement of the ROC curve shape with respect of achieving better probabilities of detection for the same false alarm probabilities. Thus, the performance of ED can be boosted with an enlargement in PU Tx power and through the MIMO transmission, where a larger number of Rx and Tx branches participating in the MIMO transmission represents a more favourable option.
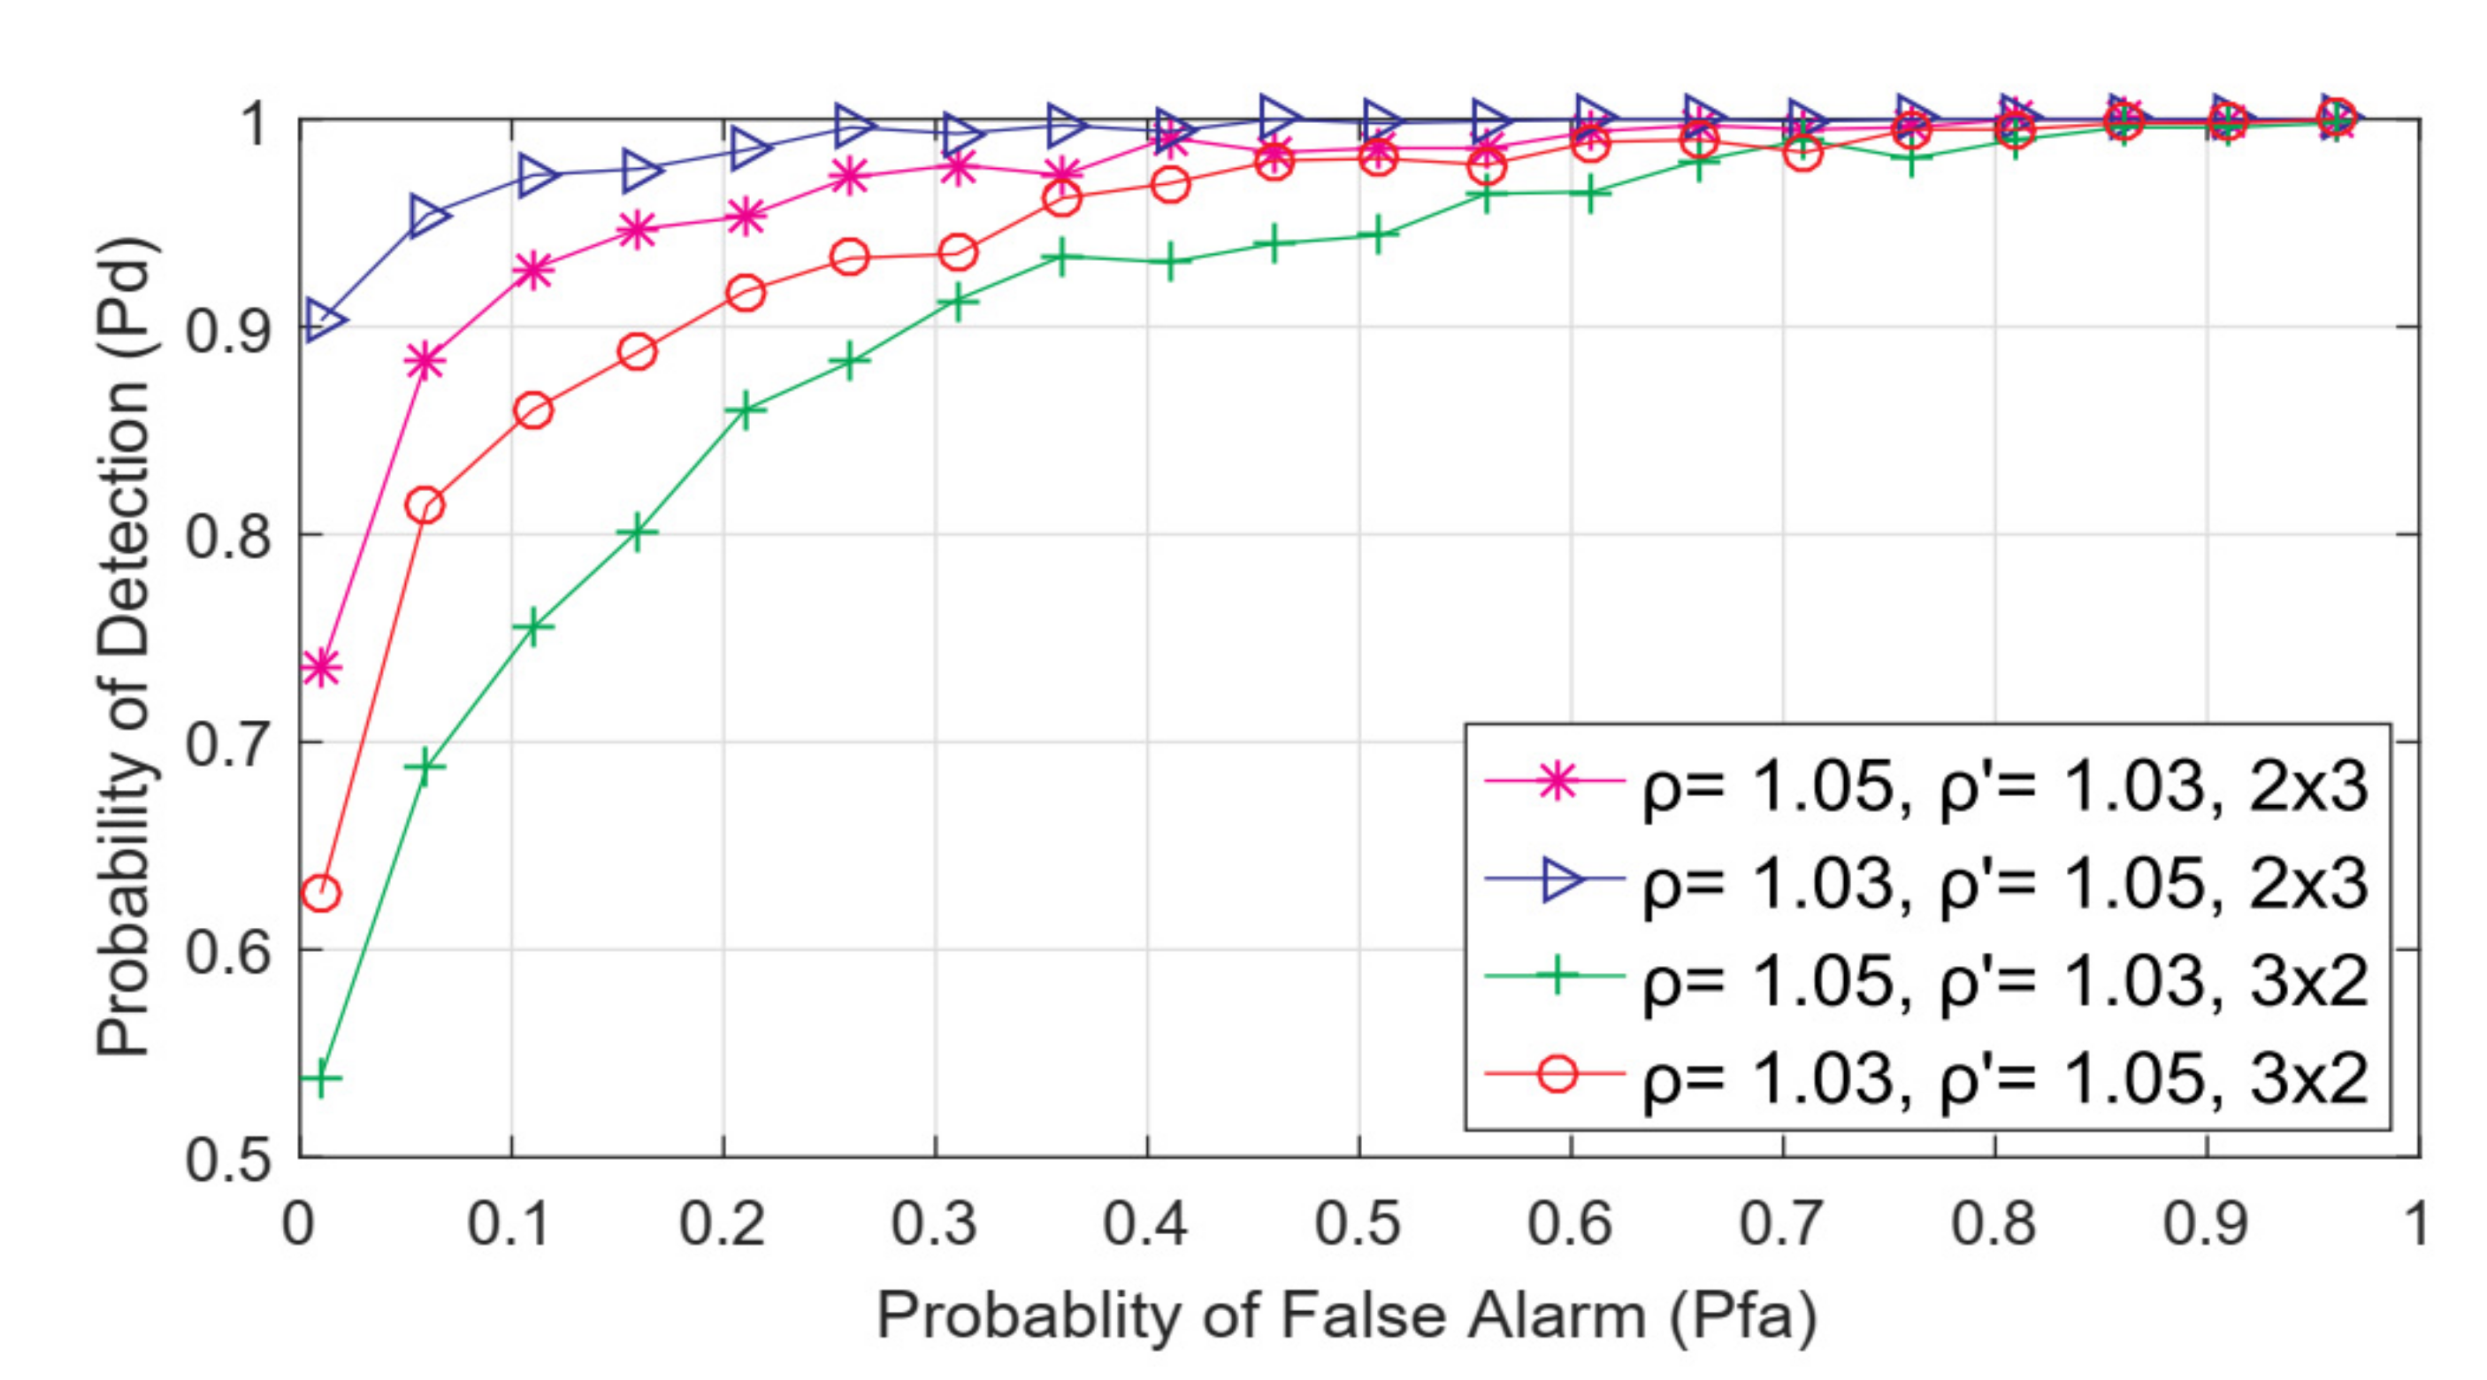
6.5. The Role of Different Numbers of Asymmetric and Symmetric MIMO Transmission Branches in the ED Sensing Efficiency
This subsection focuses on the analysis of the effect of the number of SU Rx and PU Tx antennas on the ED efficacy in SISO and asymmetric/symmetric MIMO wireless systems. For the acquired results of the simulations, analyses were performed involving the QPSK-modulated PU signals, the constant number of samples (128), the SNR equal to −15 dB at the SU site, and the constant PU Tx power (100 mW).
The results of simulations in the form of ROC curves obtained for transmission in the asymmetric 2 × 3 and 3 × 2 MIMO communication systems performing ED are presented in
Figure 7. The obtained results indicate that asymmetric MIMO systems having a number of Rx antenna chains (
N) that is for one higher than the number (
N) of Tx antenna chains, achieve better results in terms of their ED accuracy in comparison with the systems having a reversed amount of Rx and Tx chains. As the number of SU Rx chains increases, the detection efficiency also increases due to the larger number of Tx antennas and corresponding chains. This can contribute to the higher signal energy detection through SLC at the SU side. More accurate sensing performance and lower false alarm rates are therefore provided for the asymmetric 2 × 3 MIMO systems compared to the 3 × 2 MIMO systems.
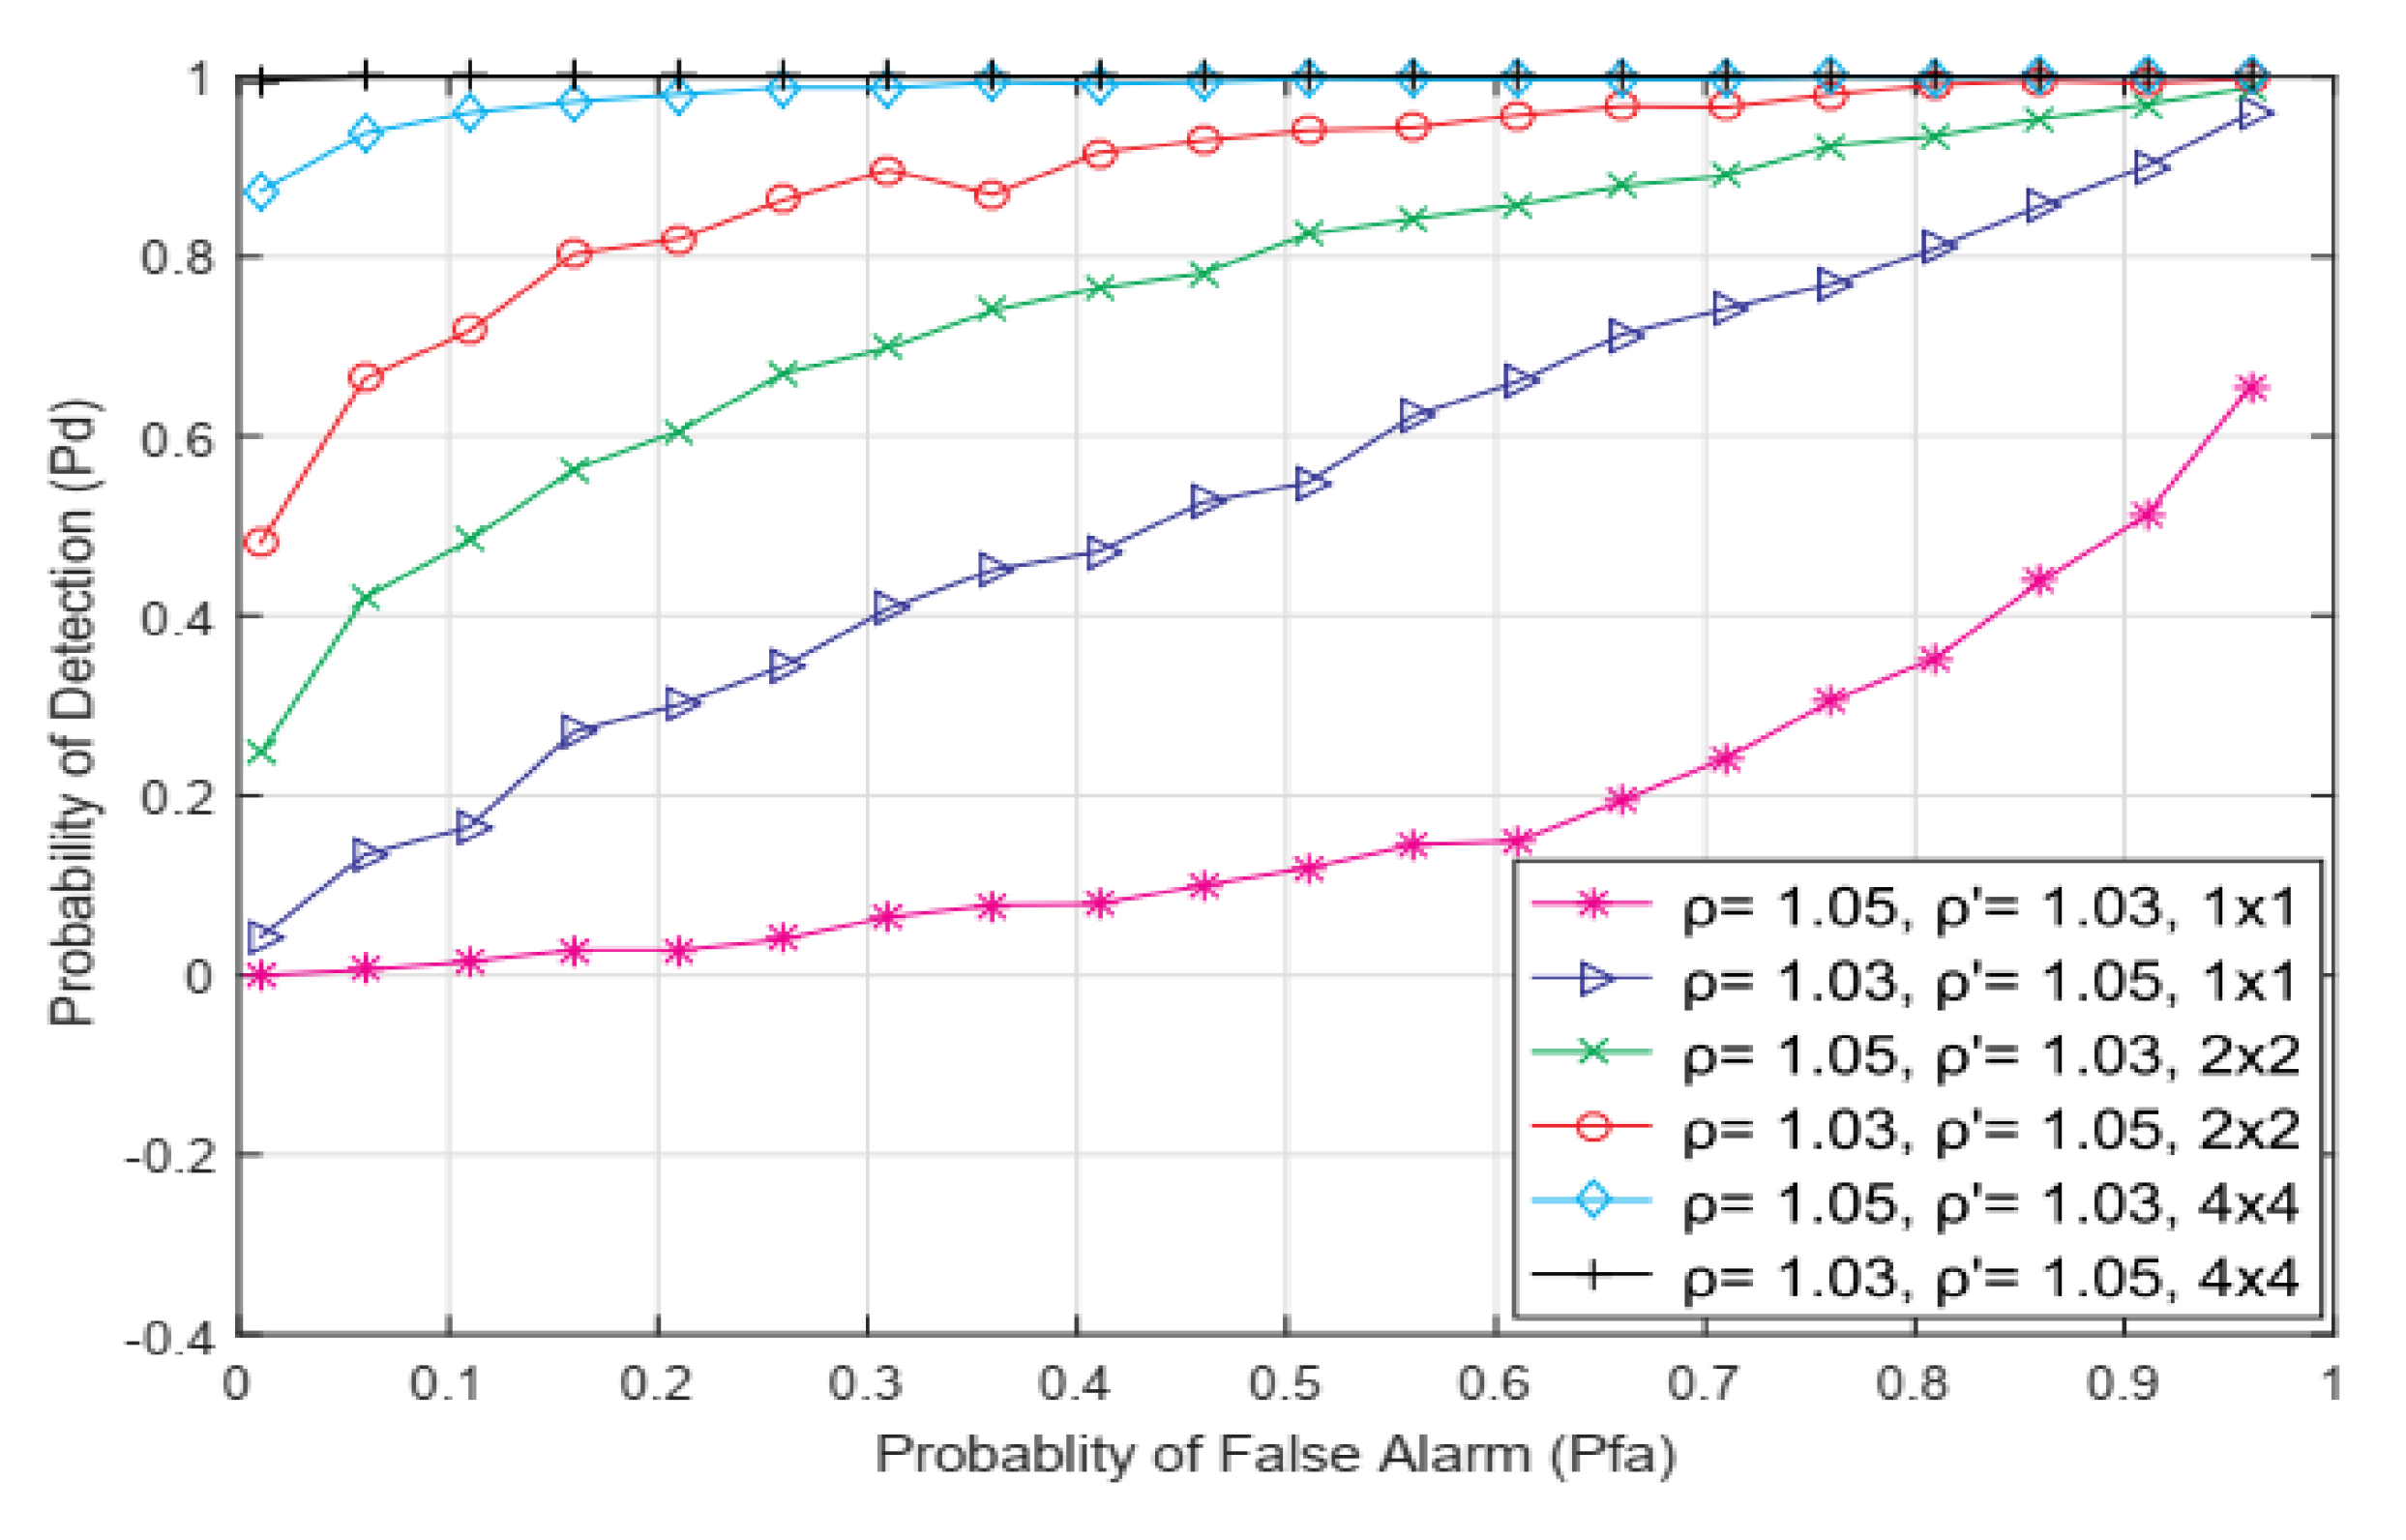
Additionally, as illustrated in
Figure 8, the results of the simulations in the form of ROC curves for the MIMO systems and SISO systems were presented. The obtained results reveal that the asymmetric 4 × 4 MIMO system outperforms the SISO and 2 × 2 MIMO-OFDM systems in terms of its detection accuracy. This is the result of the exploitation of a larger amount of Rx chains and the corresponding antennas at the SU side, which imposes a greater likelihood of detecting the PU signal for an equivalent value of false alarm probability. Because the ED is based on the SLC principle that combines the energy of the received signals at the Rx antennas, a higher number of Rx chains can process a greater number of PU signal streams. This contributes to the increase in the ED sensing capabilities (
Figure 7 and
Figure 8). As a result, increasing the number of antennas participating in transmission on the PU and particularly SU side contributes to the enhancement of the sensing performance.
6.6. The Role of Various SNR Levels on the ED Sensing Efficiency
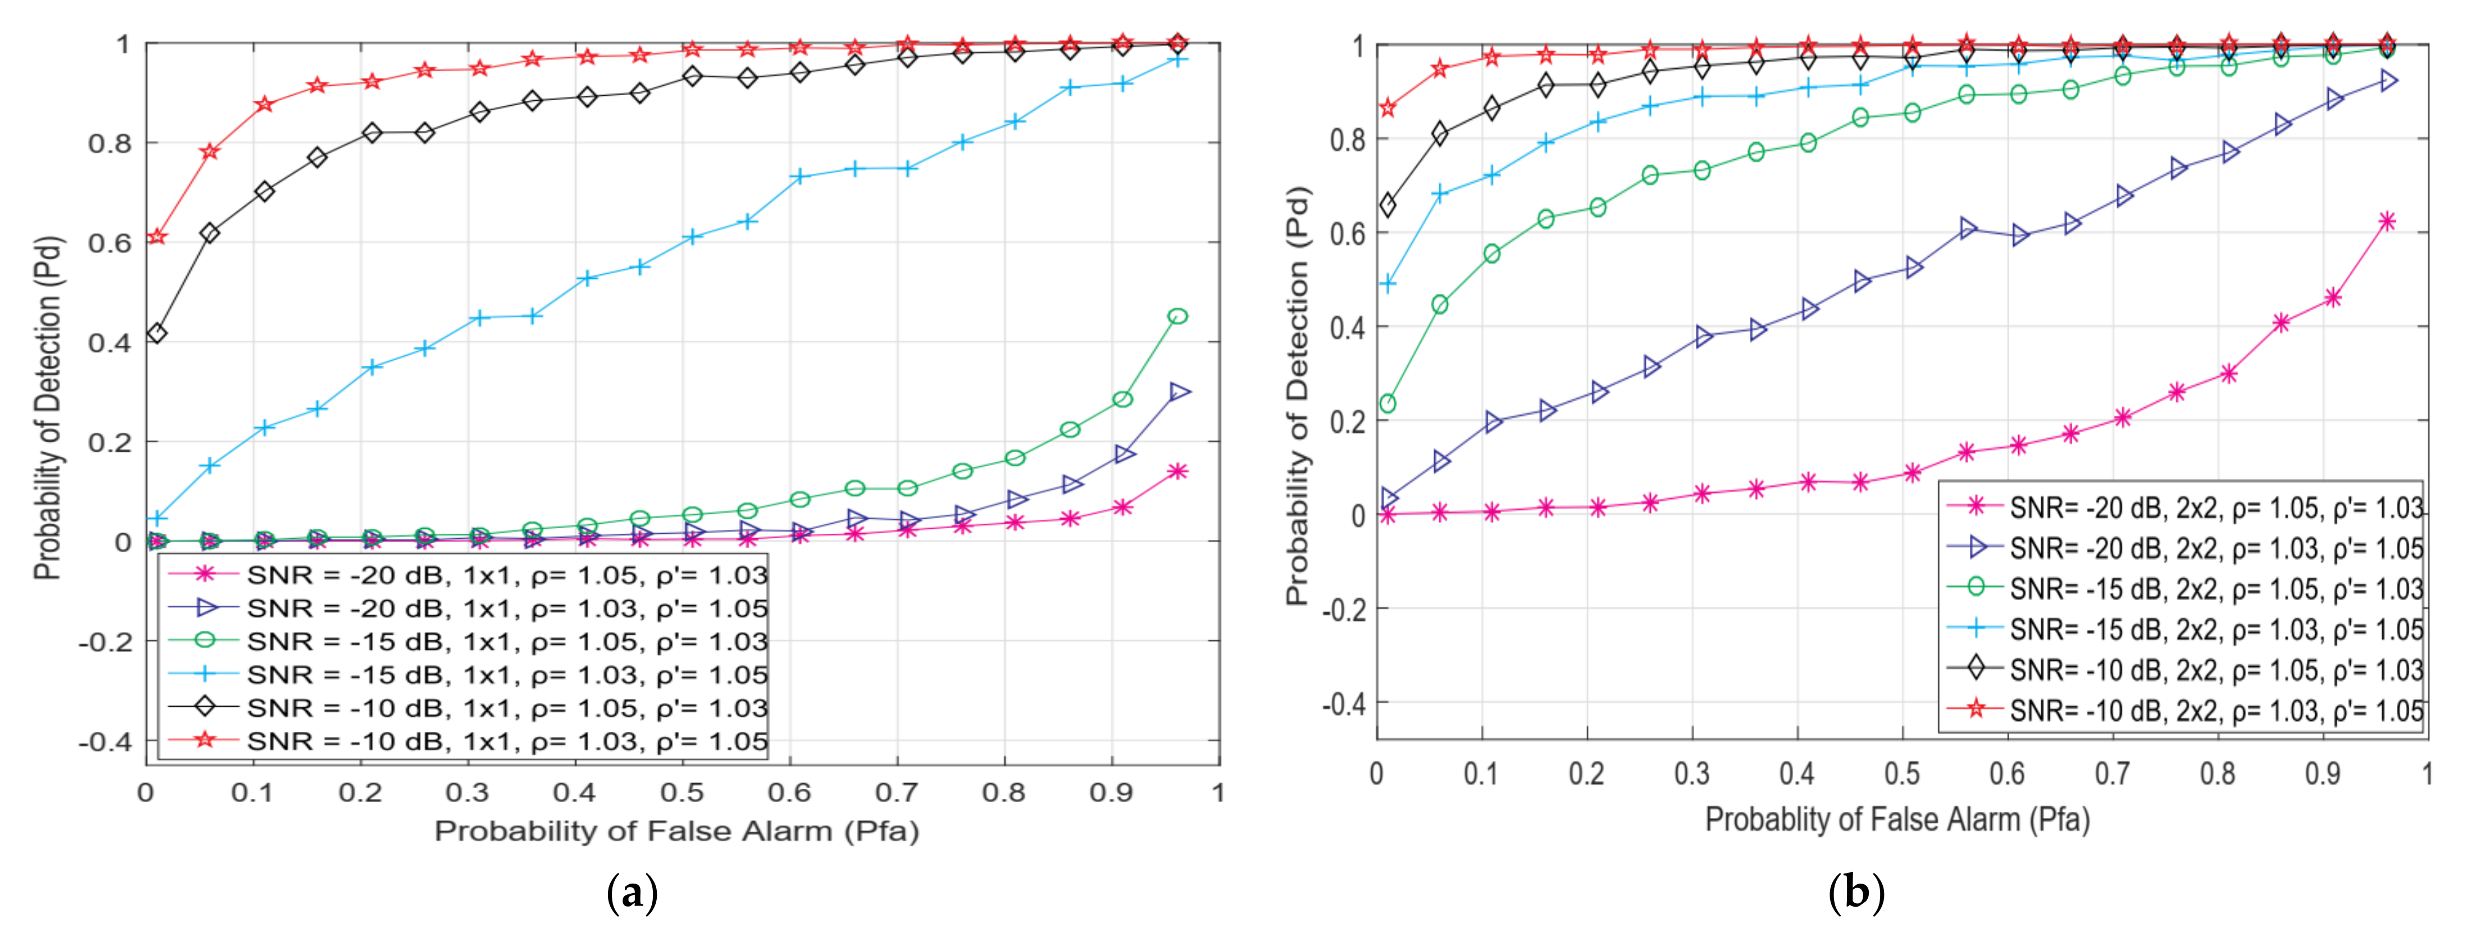
In this subsection, for the SISO and 2 × 2 MIMO communication systems, the results show the effect of SNR changes on the SU side on the shape of the ROC curves. The ROC curves were calculated for the communication system characterized by three characteristic SNR levels (−20 dB, −15 dB and −10 dB) at the SU side, the continuous PU Tx power (100 mW), the QPSK modulation, the versatile NU fluctuation, and the DT adjustments levels (;).
The results presented in
Figure 9a,b indicate that greater SNR at the SU side increases the detection probability of the SISO and 2 × 2 MIMO systems. A higher SNR level (−10 dB) at the SU side leads to a more precise PU signal recognition and a more efficient SS procedure. Furthermore,
Figure 9a,b show the degradation of the detection performance at low SNR values, which confirms the strong influence of the SNR level at the SU side on the precision of the SS. Additionally, for the higher SNR levels (greater than −10 dB), the results show that detection probability can be guaranteed (
= 1) for any MIMO Tx-Rx chain combination. This is due to the high levels of SNRs which correspond to the appropriate signal intensities that ensure excellent PU signal recognition.
Furthermore,
Figure 9 shows that higher NU fluctuations (
= 1.05) reduce the recognition ability of the PU signal by the SU for identical SNRs at the SU antennas and false alarm probabilities. The detection performance can be increased for every SNR level by choosing an appropriate level of DT adaptation (
or
).
Figure 9 further shows that using the MIMO communication system instead of SISO in conjunction with greater SNR values on the SU side, significantly improves the detection performance. This is due to the possibility of detecting higher levels of PU signal through multiple Rx antenna chains of SU.
6.7. The Role of Various Number of Detection Samples on the ED Sensing Efficiency
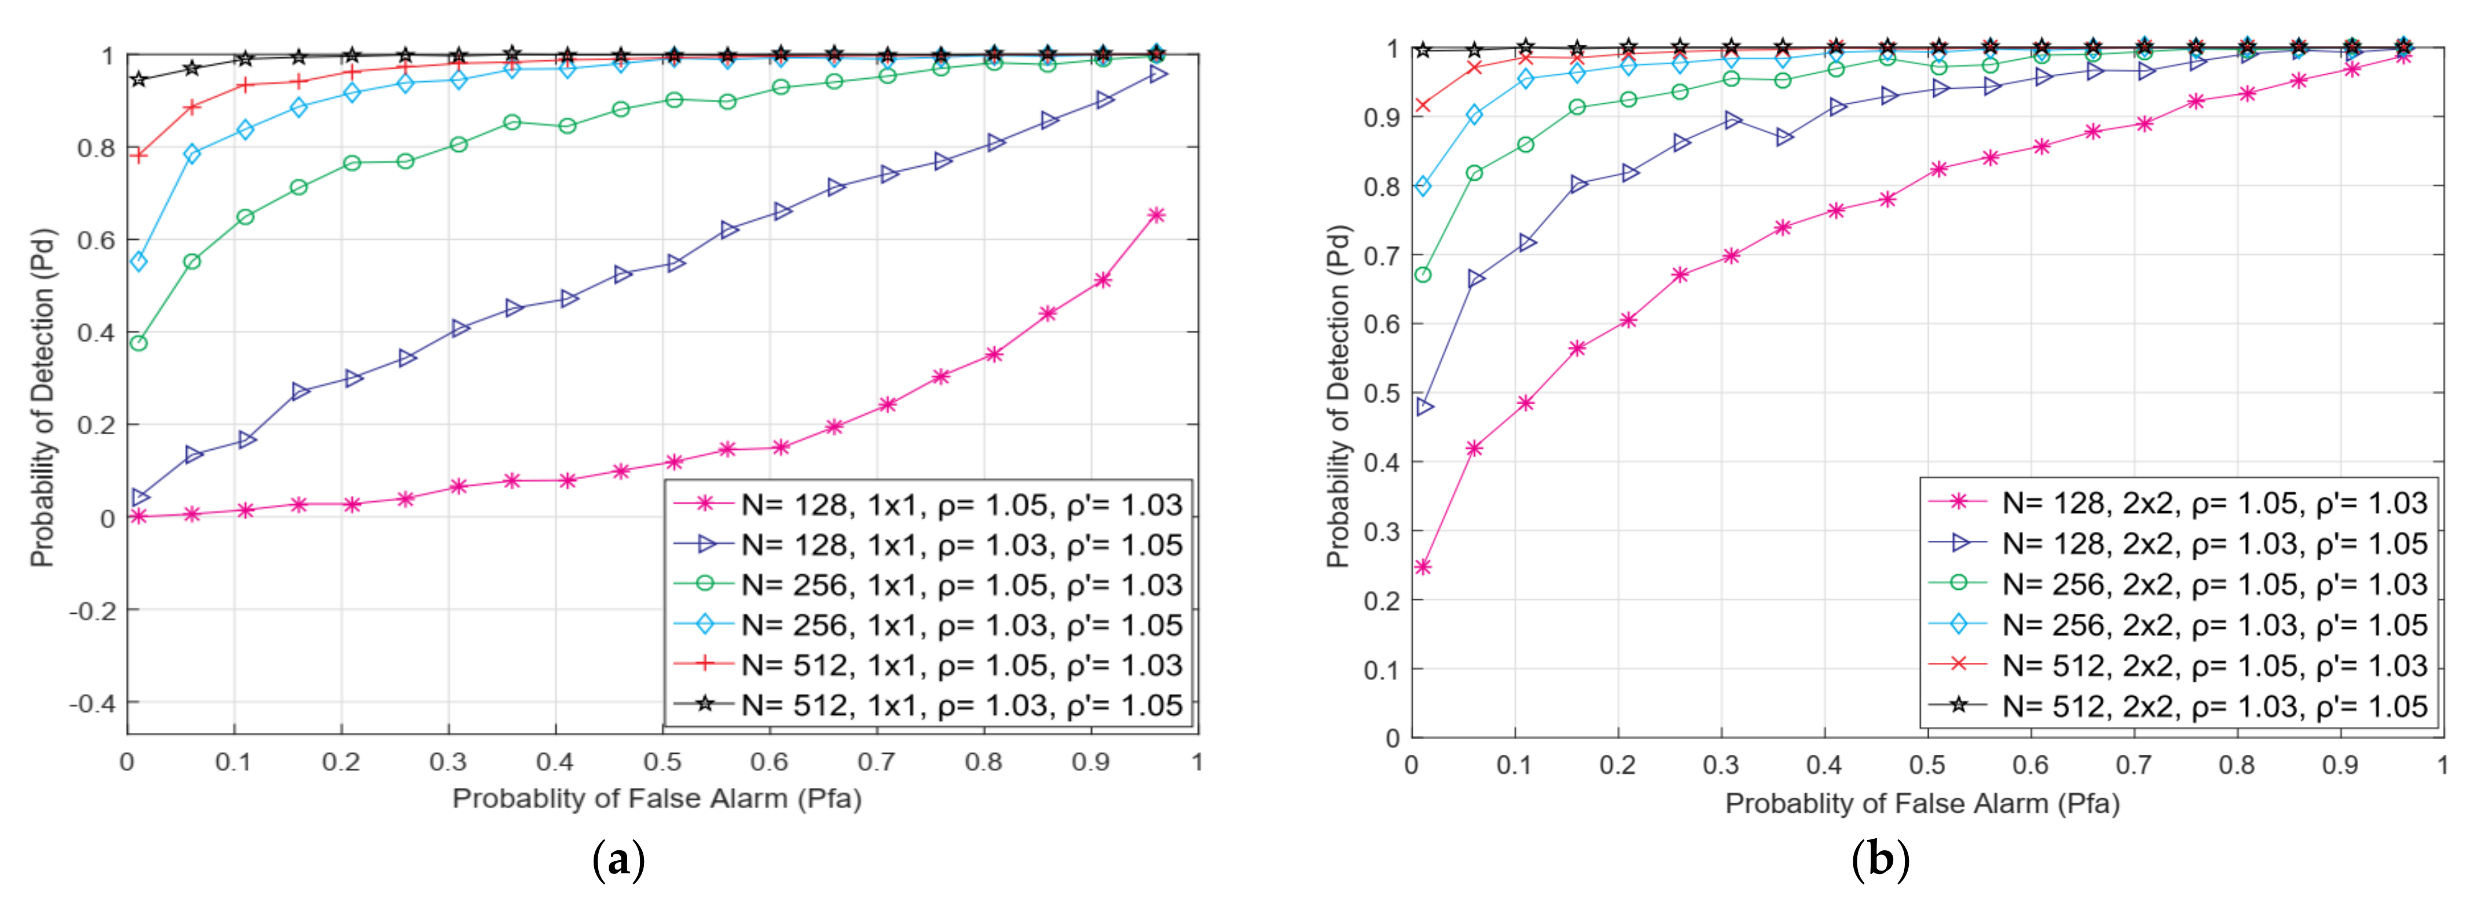
The role of a number of detection samples on ED efficiency in the 2 × 2 MIMO and SISO systems was analysed in this subsection. The ED efficiency was analysed in simulated SISO and MIMO communication systems characterized by the PU transmission with a 100 mW constant Tx power and use of QPSK modulation, the SNR at the SU side equal to −15 dB, and various DDT and NU parameters.
The results shown in
Figure 10a,b demonstrate that increasing the number of detection samples enhances the likelihood of detecting a PU signal for any Tx-Rx antenna combination, as well as any combination of DDT and NU factors. Such a result is supported by Equation (23), which shows that a larger number of detection samples employed in the ED SS improves detection probability. This is expected as a higher number of detection samples used for the ED SS represents an increased number of detection attempts during the PU signal recognition process. This increases the probability that the PU signal will be detected accurately.
In addition, the ROC curves presented in
Figure 10a,b show that for identical channel conditions and a higher number of detection samples, the 2 × 2 MIMO system outperforms the SISO system in terms of sensing performance. As previously explained, this is due to the diversity gain of the MIMO system. This cognition allows the MIMO system to achieve the same sensing performance as the SISO system using a reduced number of detection samples for the same channel conditions.
Figure 10 also shows the ROC curves for various combinations of DDT and NU parameters (
= 1.05,
= 1.03;
= 1.03,
= 1.05). In an operational environment where moderate levels of NU (
= 1.03) impact the PU signal, a higher value of DT adaptation (= 1.05) results in a better detection performance for an equal number of detection samples. The detection probability will decrease where there are higher NU fluctuations ( = 1.05) and lower DDT adaption values (
= 1.03) for any number of the detection samples used for the ED SS. This confirms that larger NU levels have a stronger unwanted impact on the ED process and that more flexible DDT adaptations improve the ED performance in the presence of strong NUs. Therefore, increased NU variation during the ED process must be accompanied by an adequate increase in DDT adaptations.
The results presented in
Figure 10 also point out that reliable PU signal detection can be enhanced by exploiting more detection samples during the ED SS. This results in a more precise identification of the PU signal at the SU side. Hence, different combinations of triples related to choosing the number of detection samples, the degree of DDT adaptation, and the number of Rx and Tx branches in the MIMO communication system according to the specifics of the radio channel conditions, can contribute to the enhancement of detection probability in the ED SS process.
7. Conclusions
The sensing process in realistic CR systems is negatively affected by inconsistent variations in noise power, which are known as NU. A possible approach to reducing the impact of NU on the ED process is the exploitation of DDT adaptations during SS. In this paper, the analysis of the ROC curve shapes for the SS process performed by the energy detector exploiting the SLC technique in MIMO-OFDM CRN has been elaborated on to explore the different impacts of NU variations and the levels of DDT adaptations.
To evaluate the proposed ED performance, mathematical models were developed to express the interdependence of the PU detection probability in MIMO systems on essential performance factors such as the PU Tx power, the number of detection samples, the threshold levels, the number of Tx-Rx MIMO branches, and the SNR values. Furthermore, a simulation algorithm for analysing the accuracy of the ED SS employing SLC is presented and exploited for the simulation of different DDT and NU impacts on the shape of the ROC curves. The results of the extensive simulation analysis are presented for a variety of operational parameters including the number of transmitting and receiving antennas on the PU and SU, the SNR values at the position of the SU, the number of detection samples, the amount of PU Tx power, the modulation technique used for the PU signal transmission, and various NU and DDT factors.
Generally, the presented results indicate that better ROC curves in terms of detection probability will be yielded when variations in the intensity of NU are followed by an appropriate level of DDT adaptations. Additionally, better shaped ROC curves in terms of the ED precision will be obtained for the ED process employing SLC when SS is performed for a larger Tx power of the PU, a higher number of Rx and Tx chains, a larger number of detection samples, and higher SNRs values at the SU side. The presented analyses of the impact of such factors on the shape of ROC curves can serve as a baseline for the planning and practical development of ED SS using SLC in MIMO-OFDM communications systems.
Given the importance of MIMO systems in CRNs, our future work will focus on presenting the results of the analyses indicating how massive MIMO systems influence the performance of ED SS based on SLC.


