
Performance Prediction of Rolling Bearing Using EEMD and WCDPSO-KELM Methods


Abstract
:1. Introduction
2. Methodology
2.1. The WCDPSO Algorithm
2.1.1. Improving Inertia Weight
2.1.2. Linear Adjustment Learning Factor
2.1.3. Adding Disturbance Term
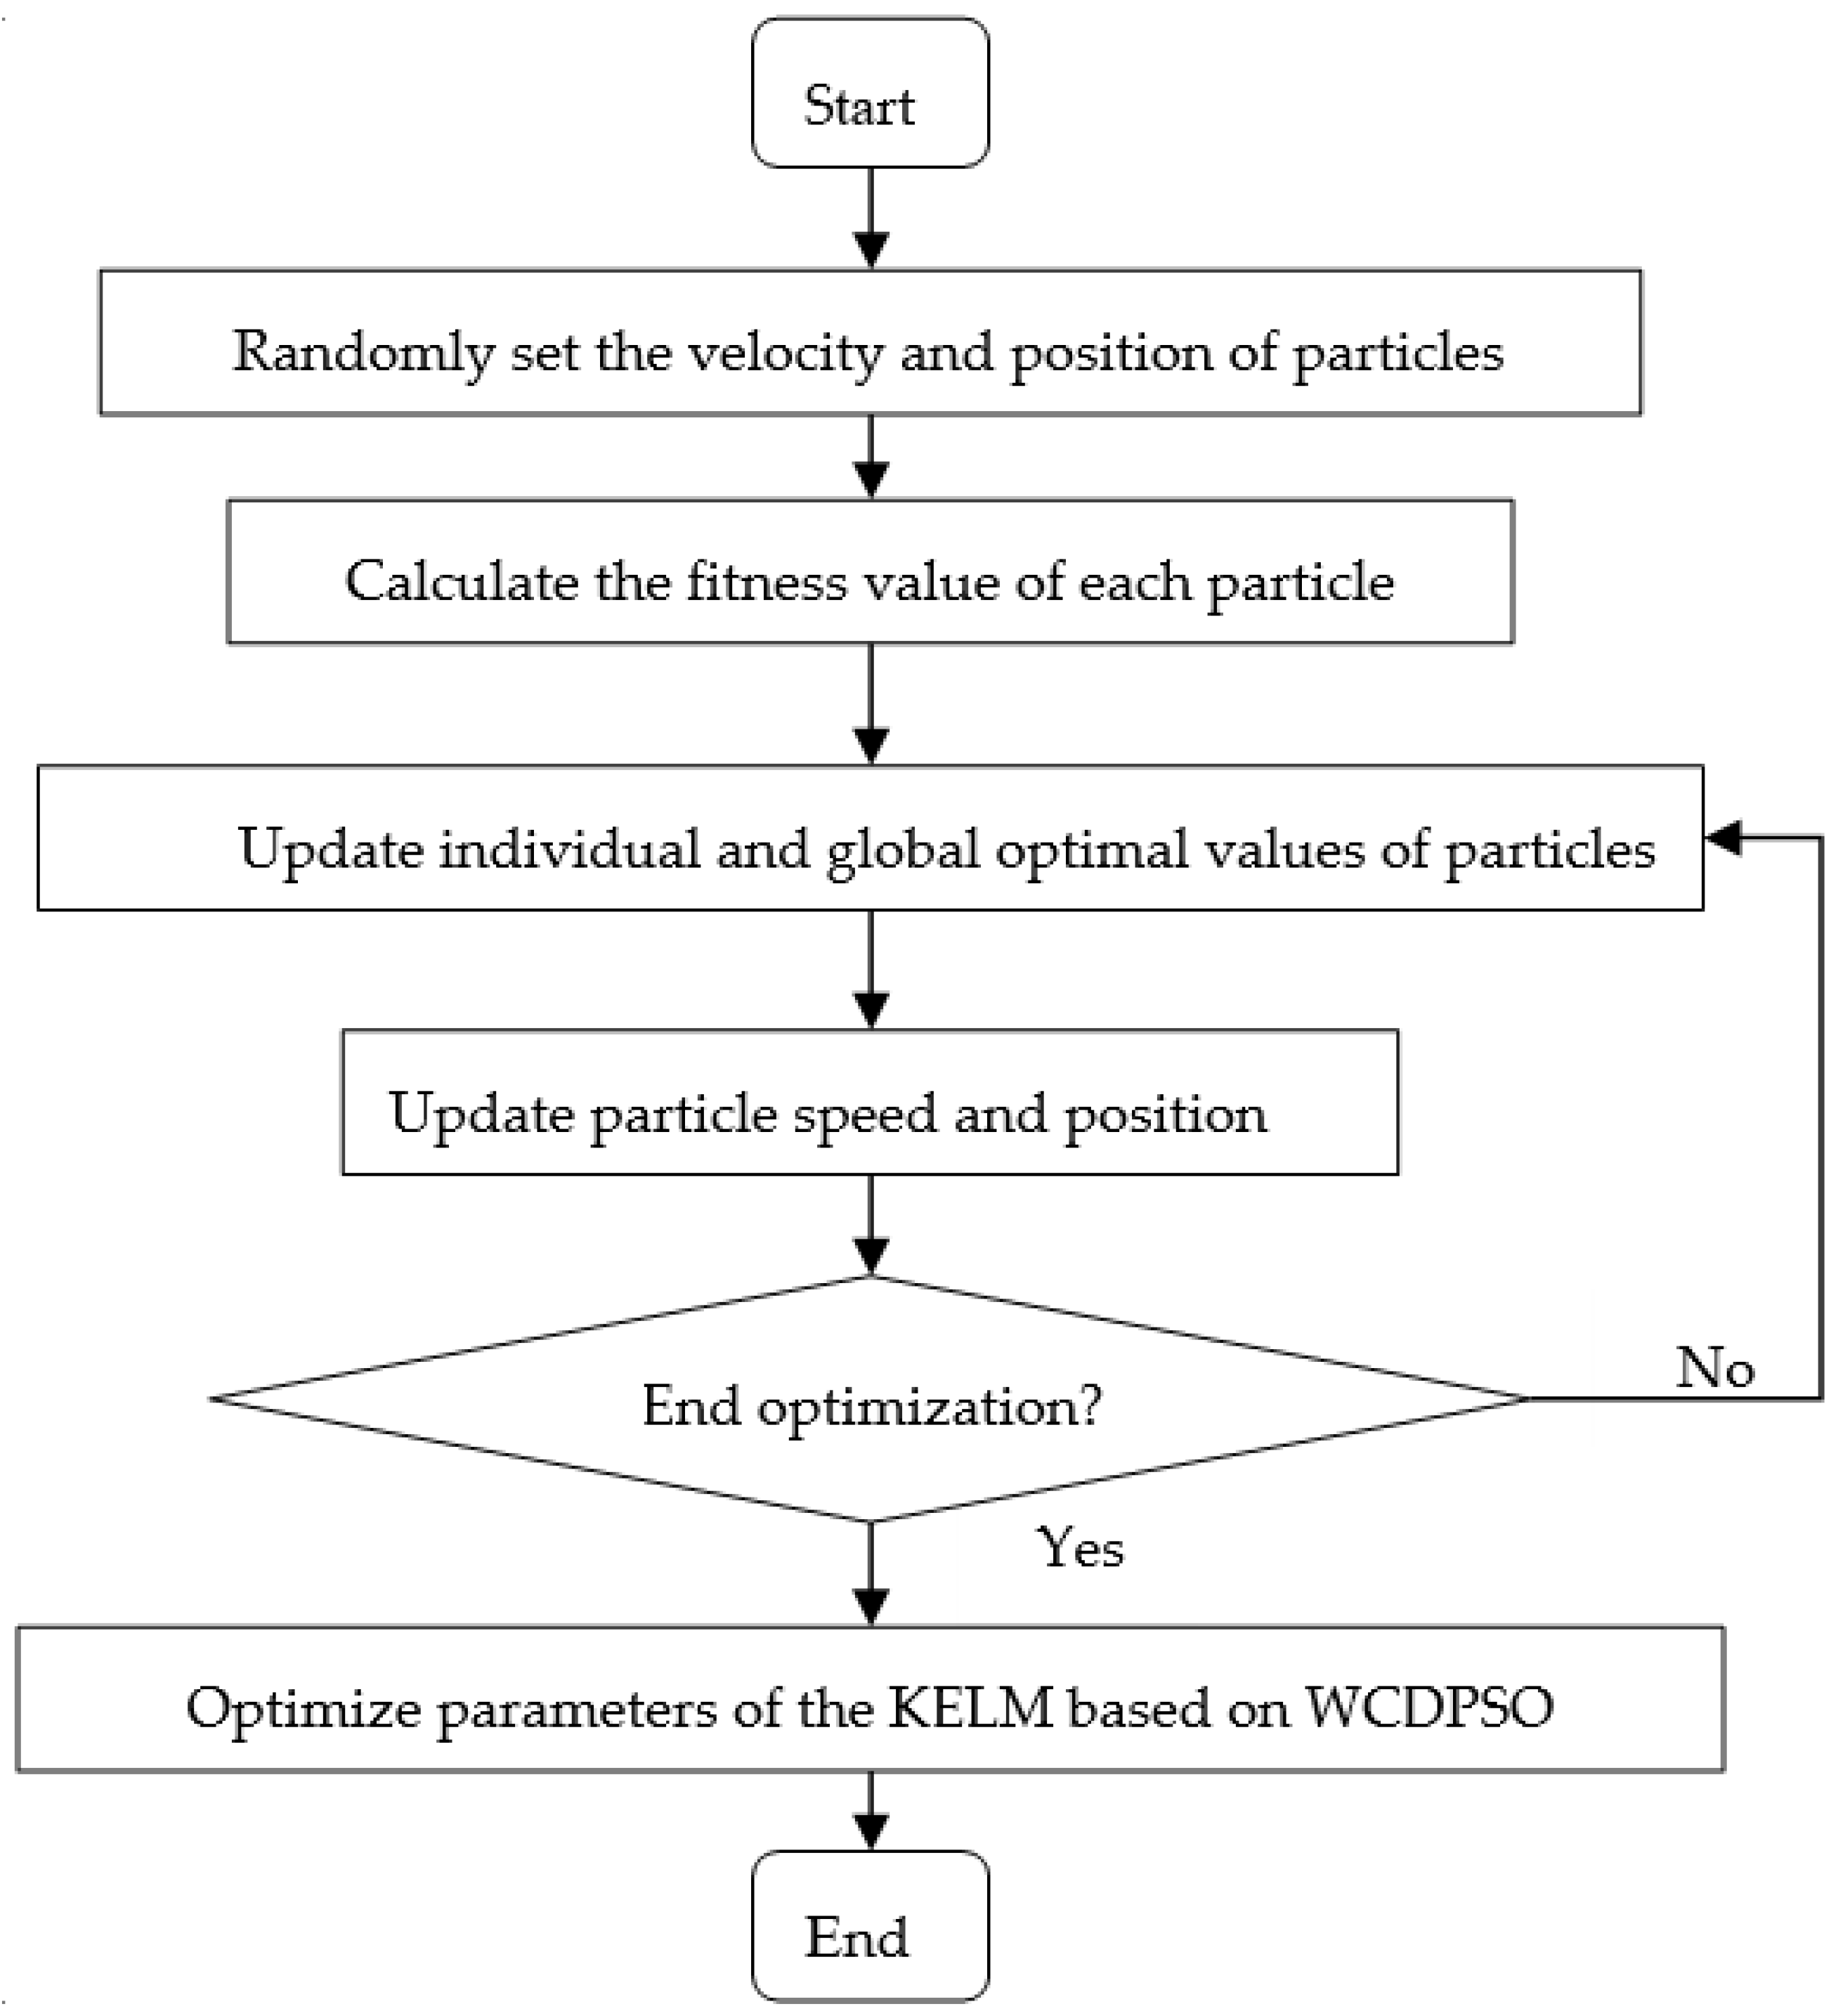
2.2. Optimizing Parameters of KELM Model
2.3. Assessming the WCDPSO-KELM Model
3. Data Acquisition and Processing
3.1. Pronostia Experiment Platform
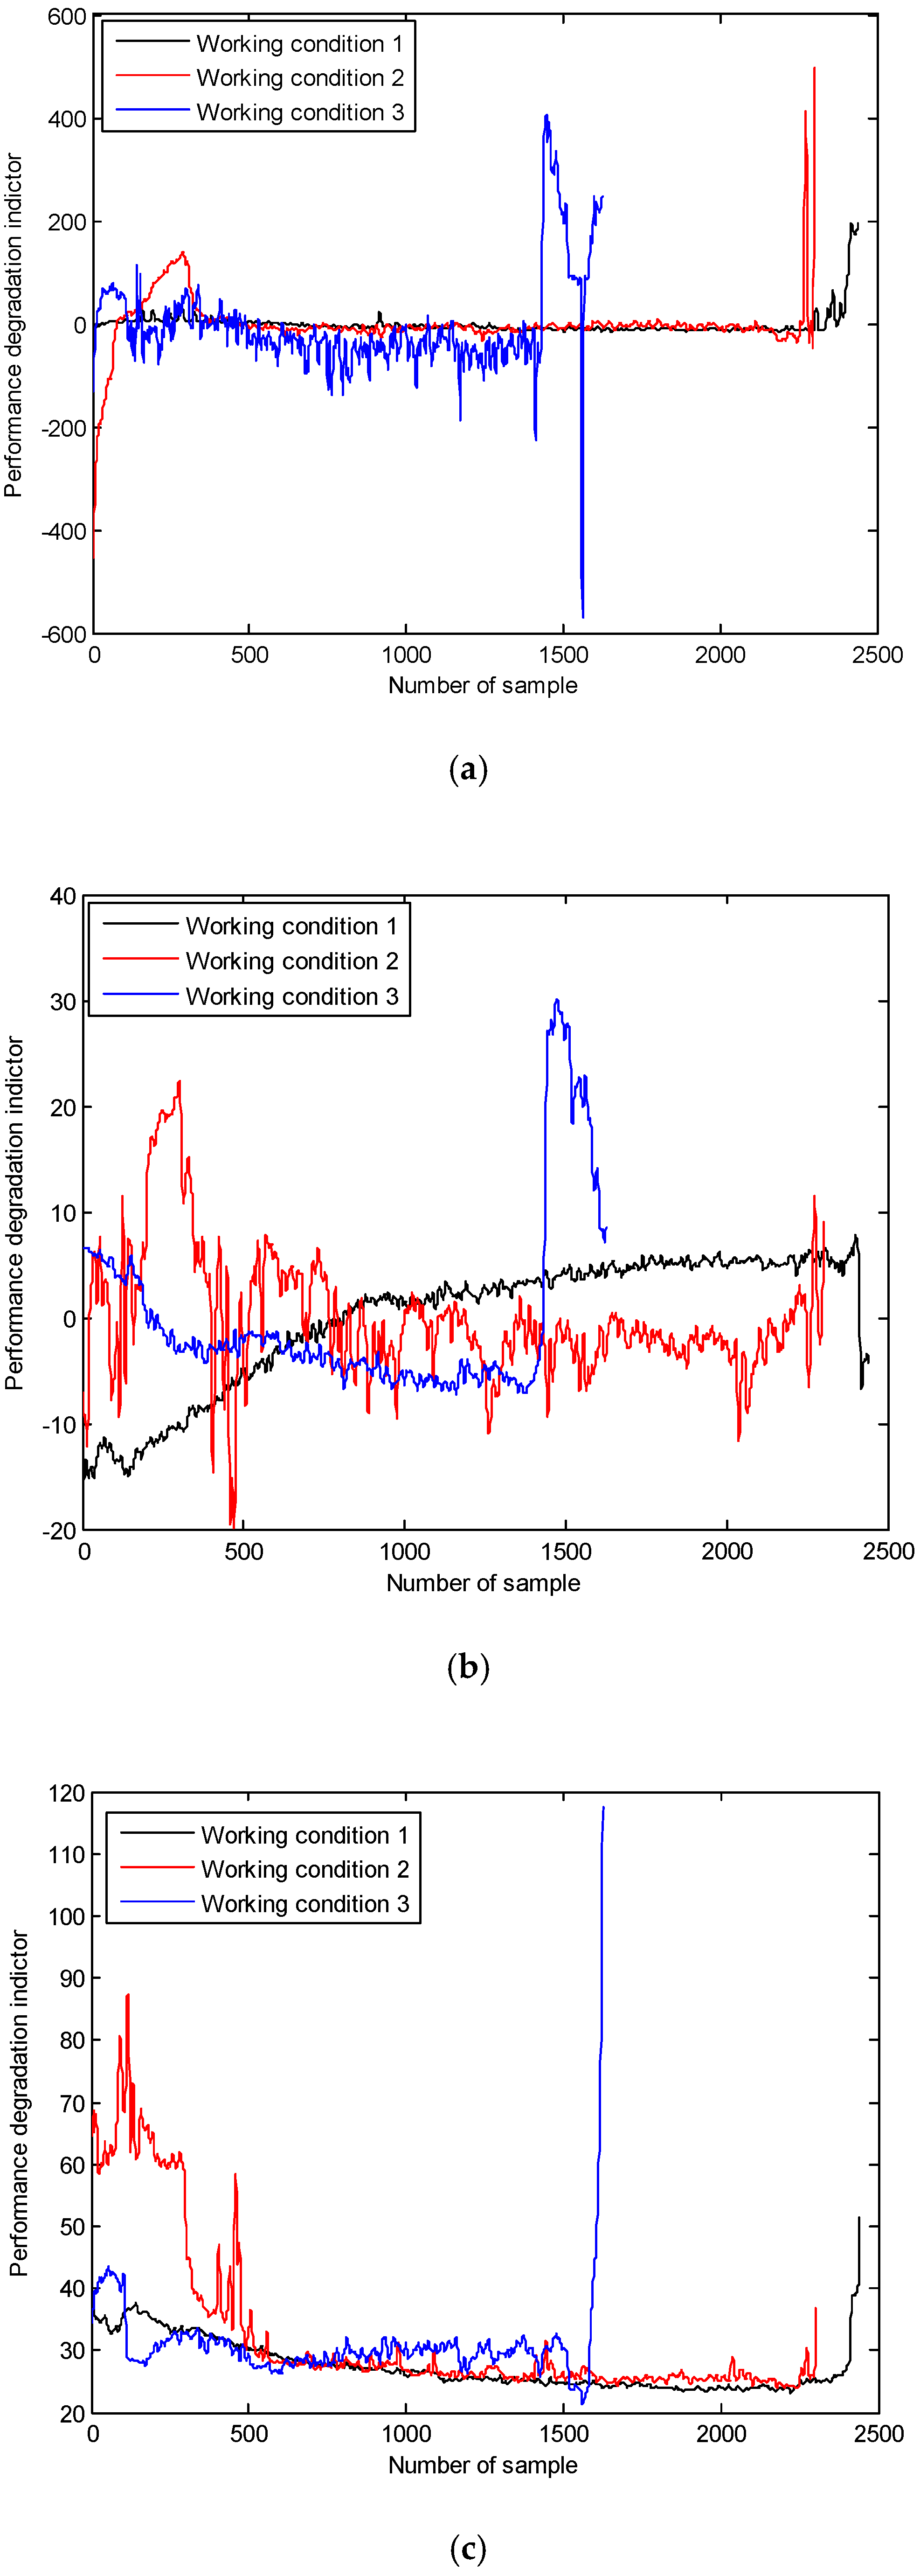
3.2. Selecting Performance Degradation Index
3.2.1. Feature of Time–Frequency Domain
3.2.2. Features of Wavelet Packet Space
3.2.3. Features of EEMD Space
4. Experimental Results
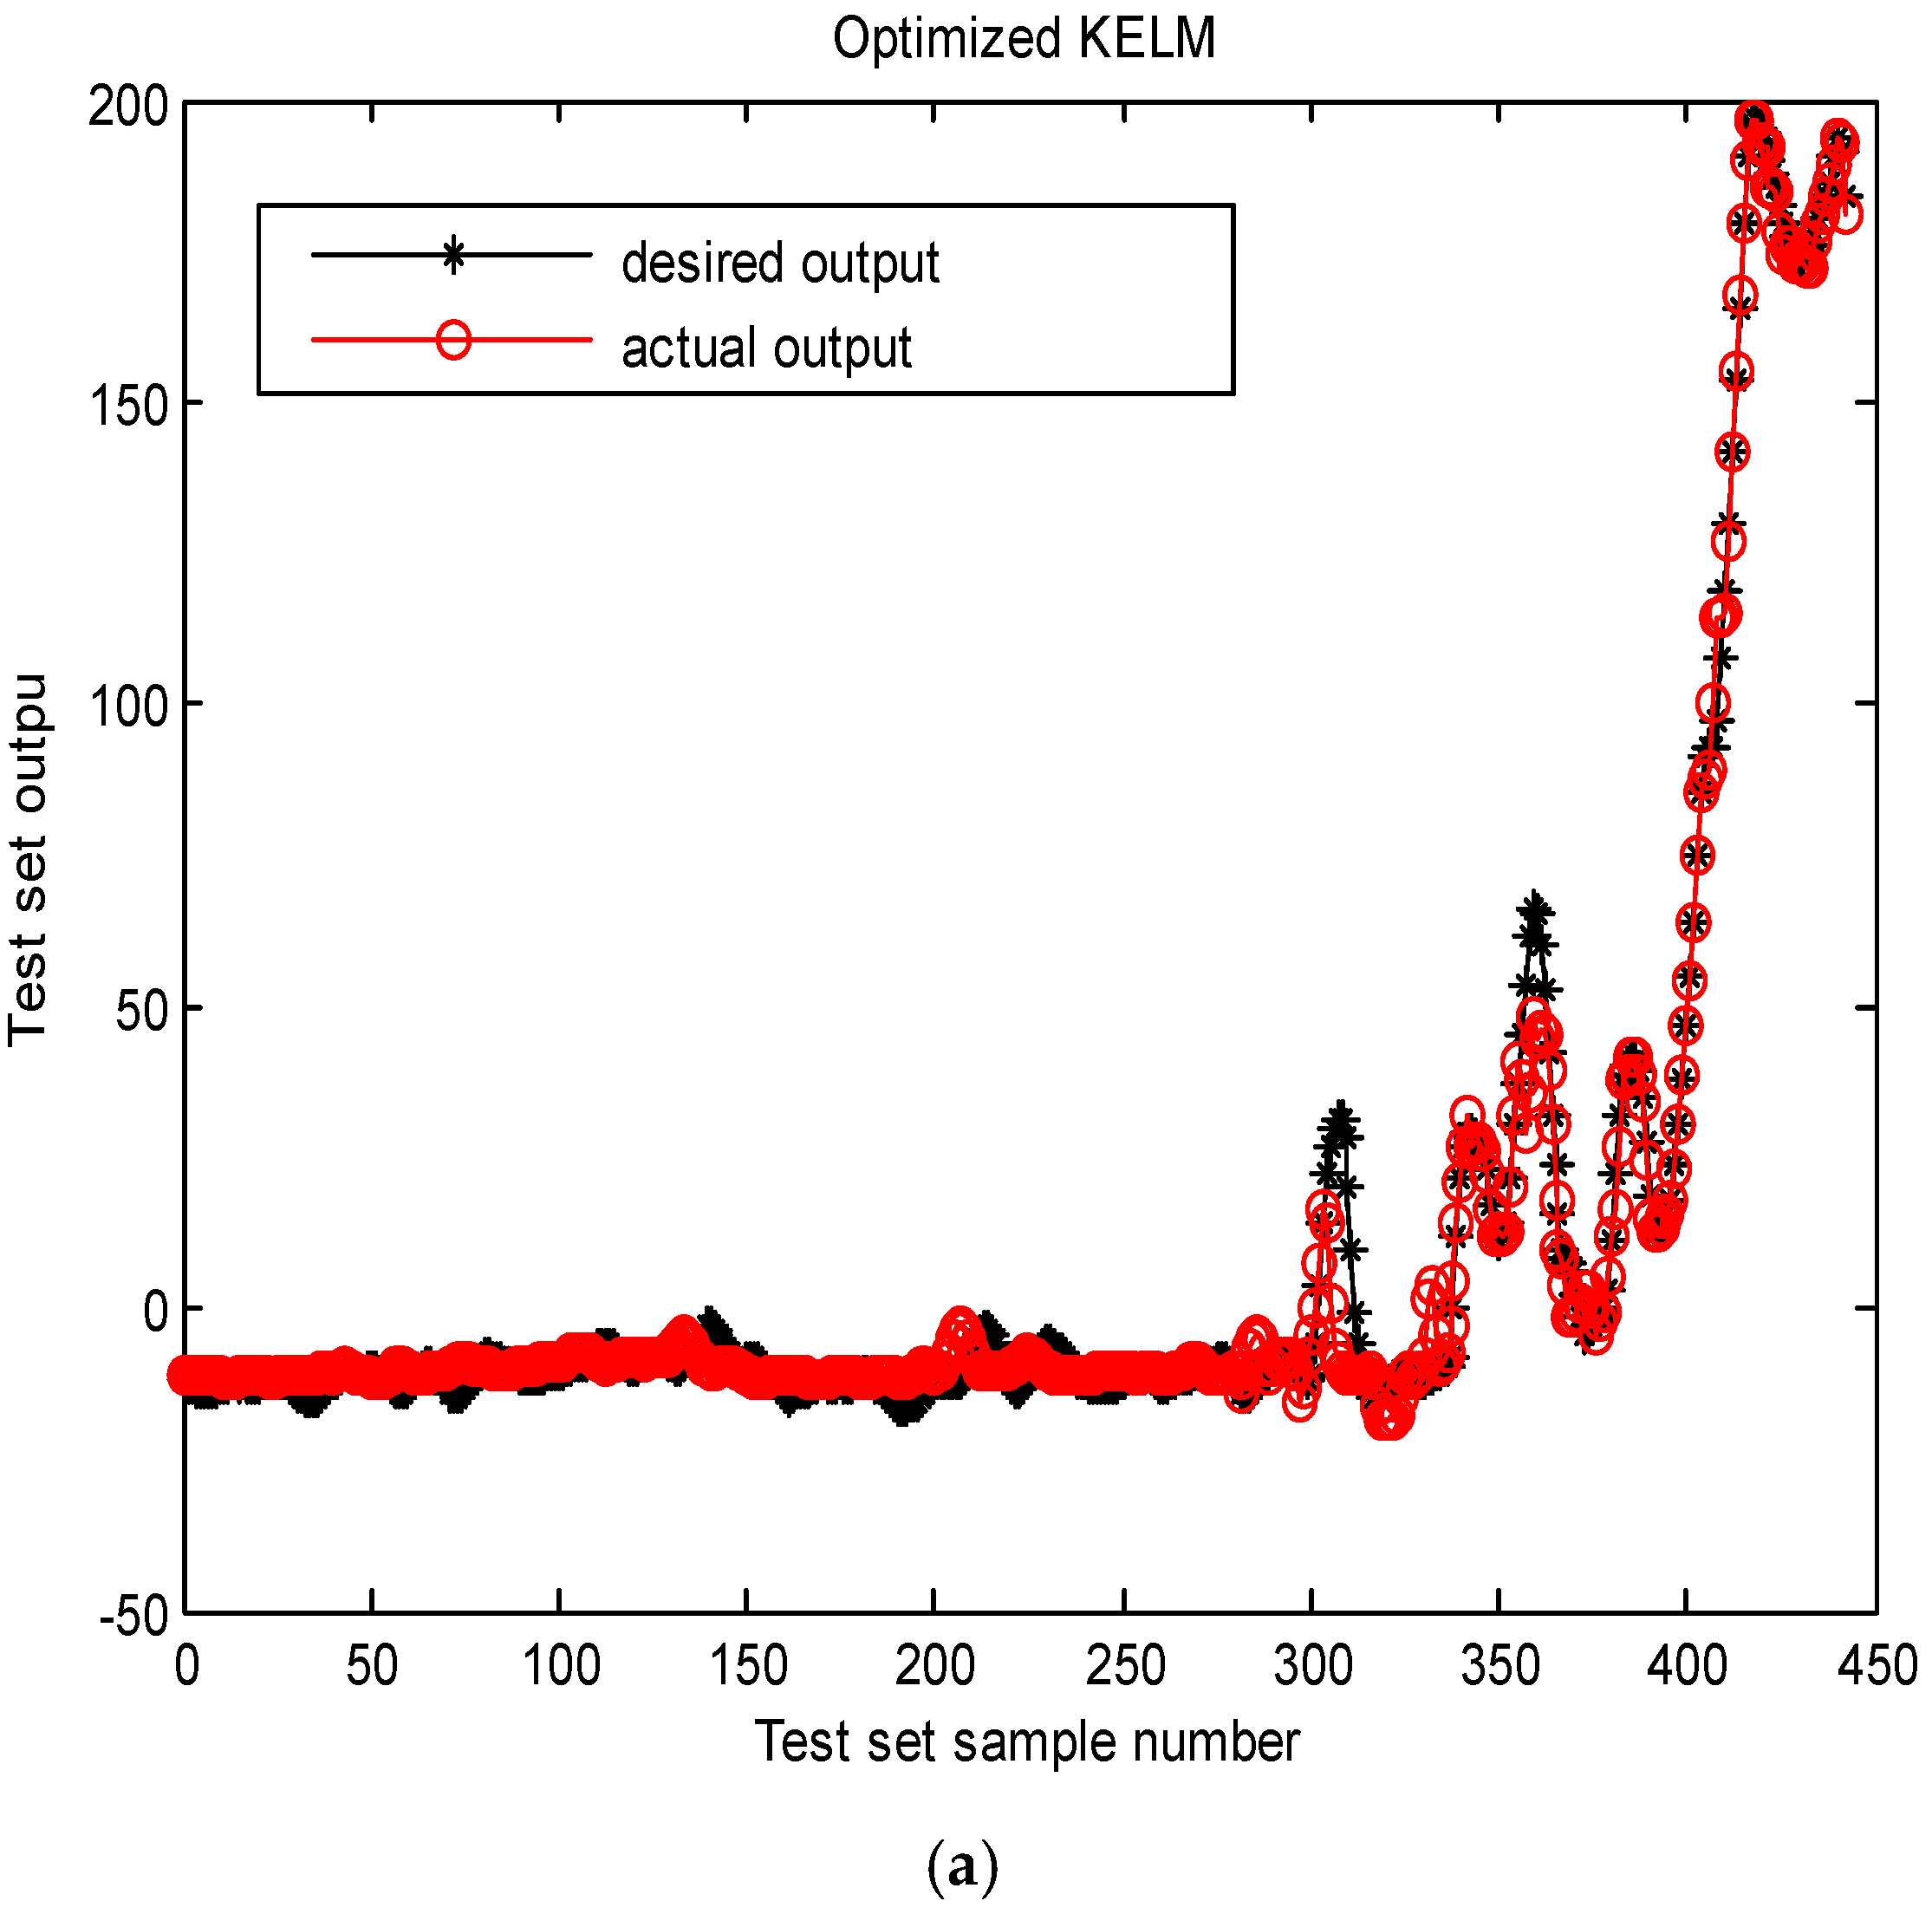
4.1. Testing the Performance of the WCDPSO-KELM Model
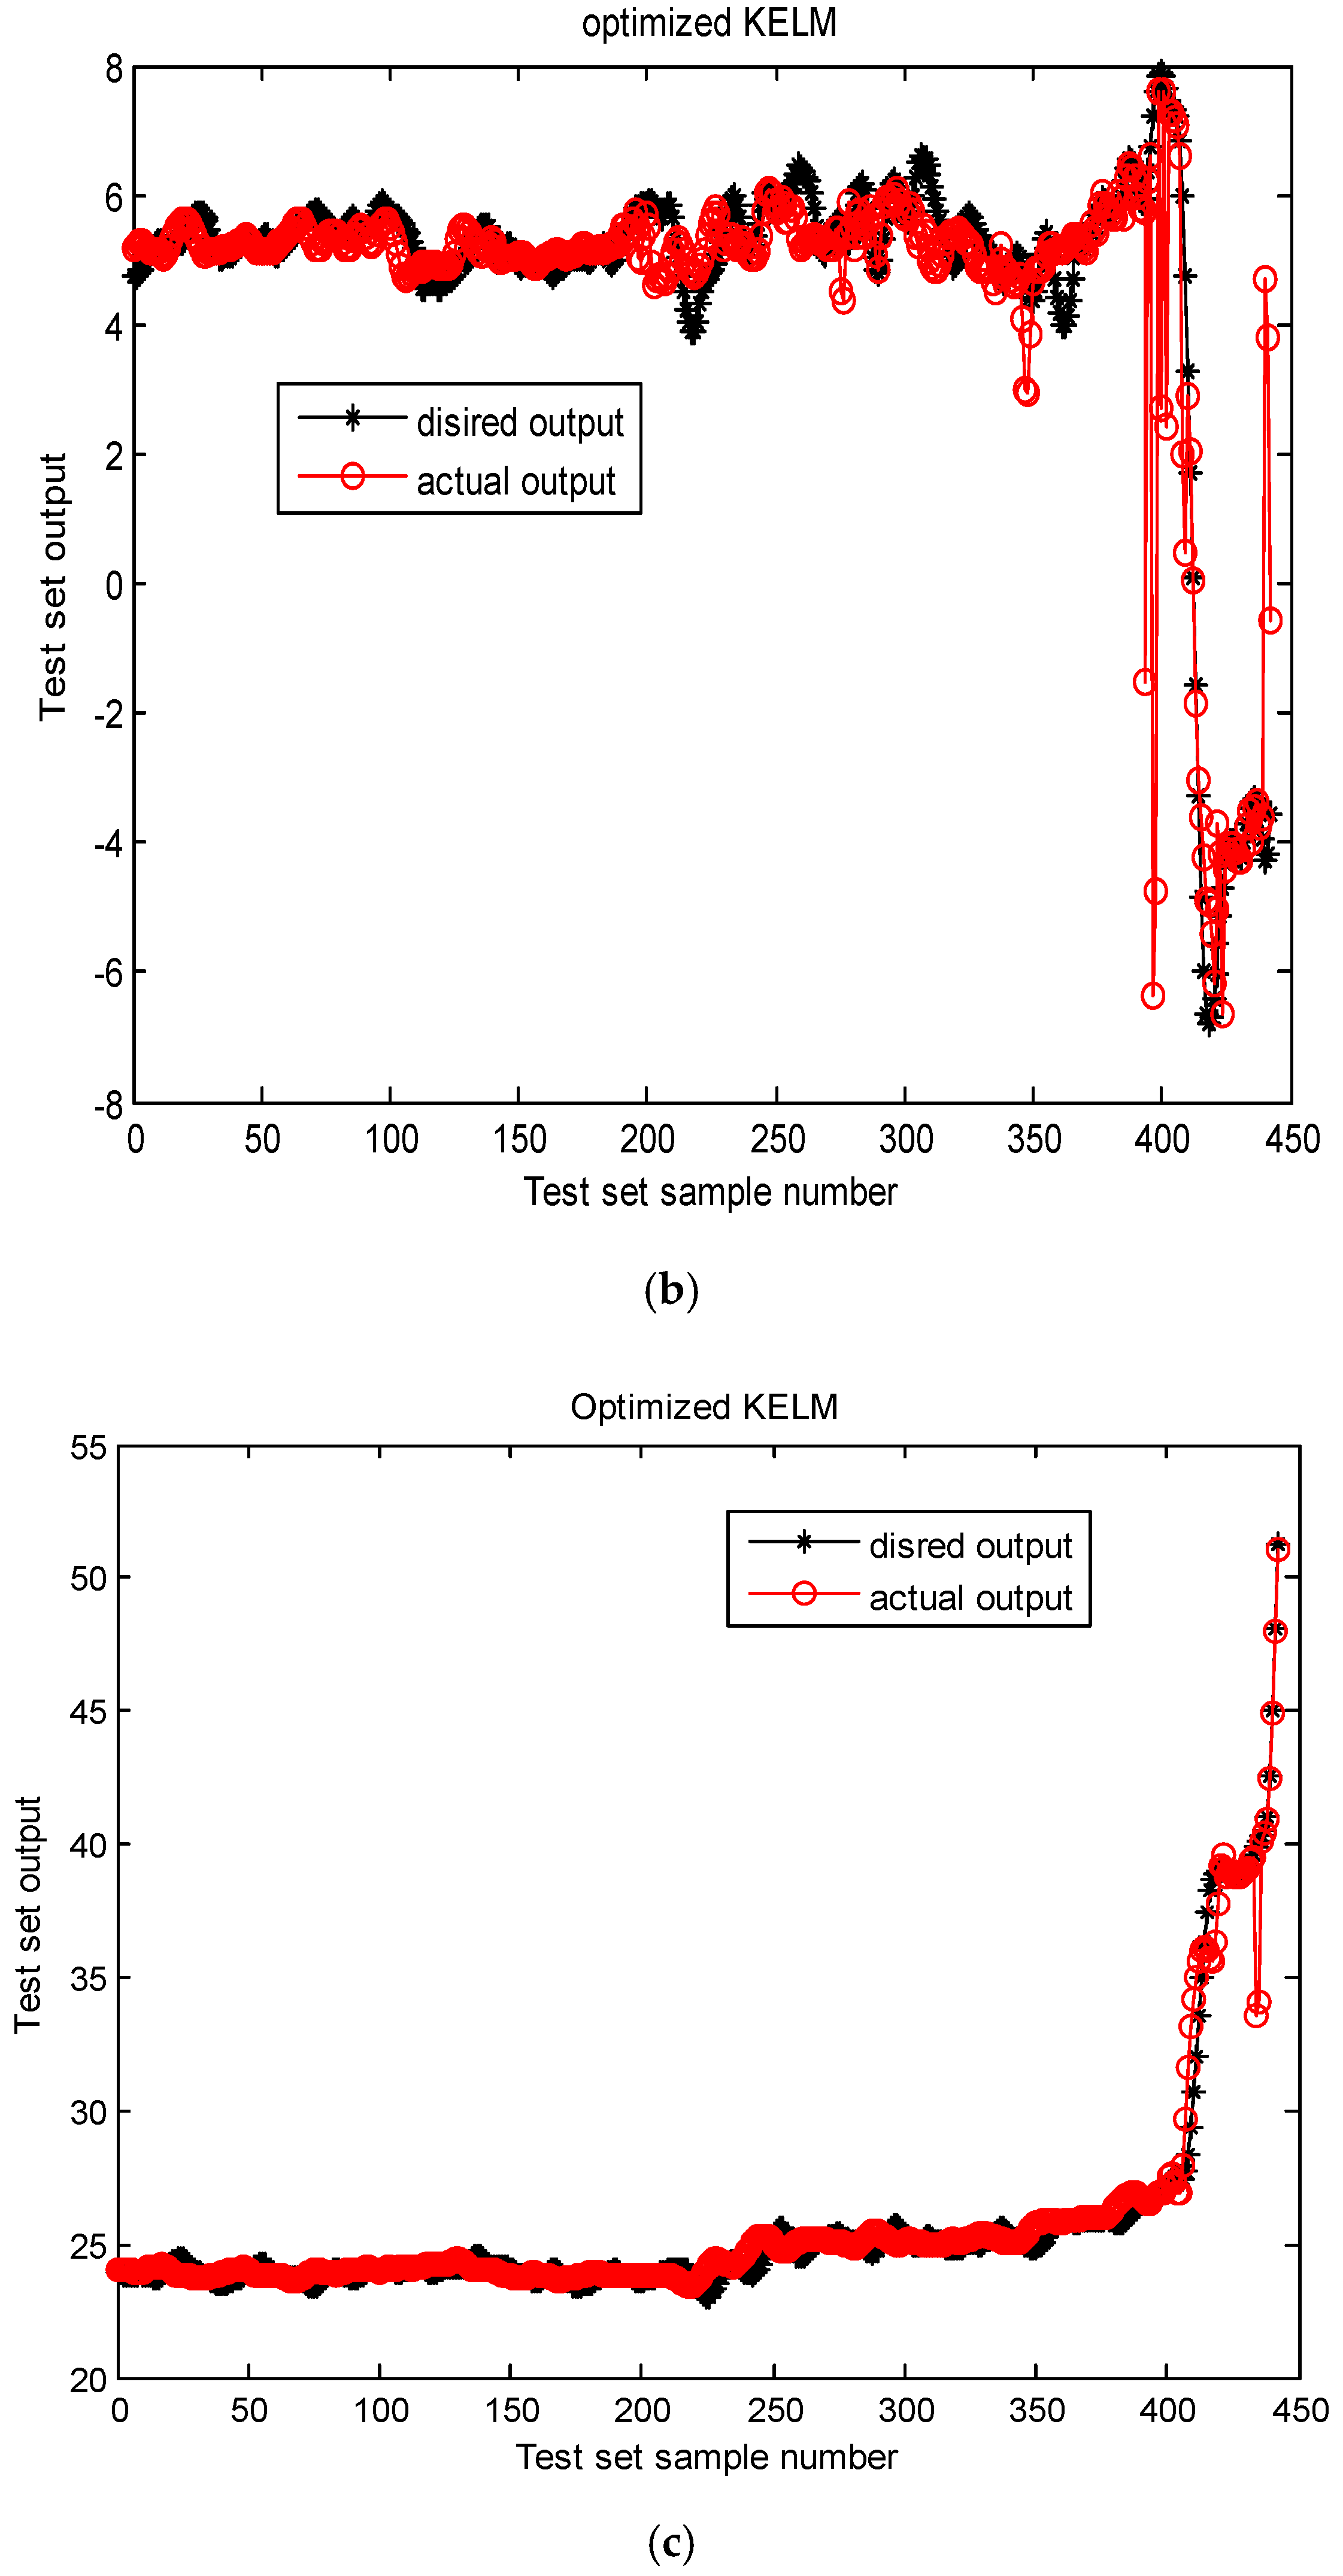
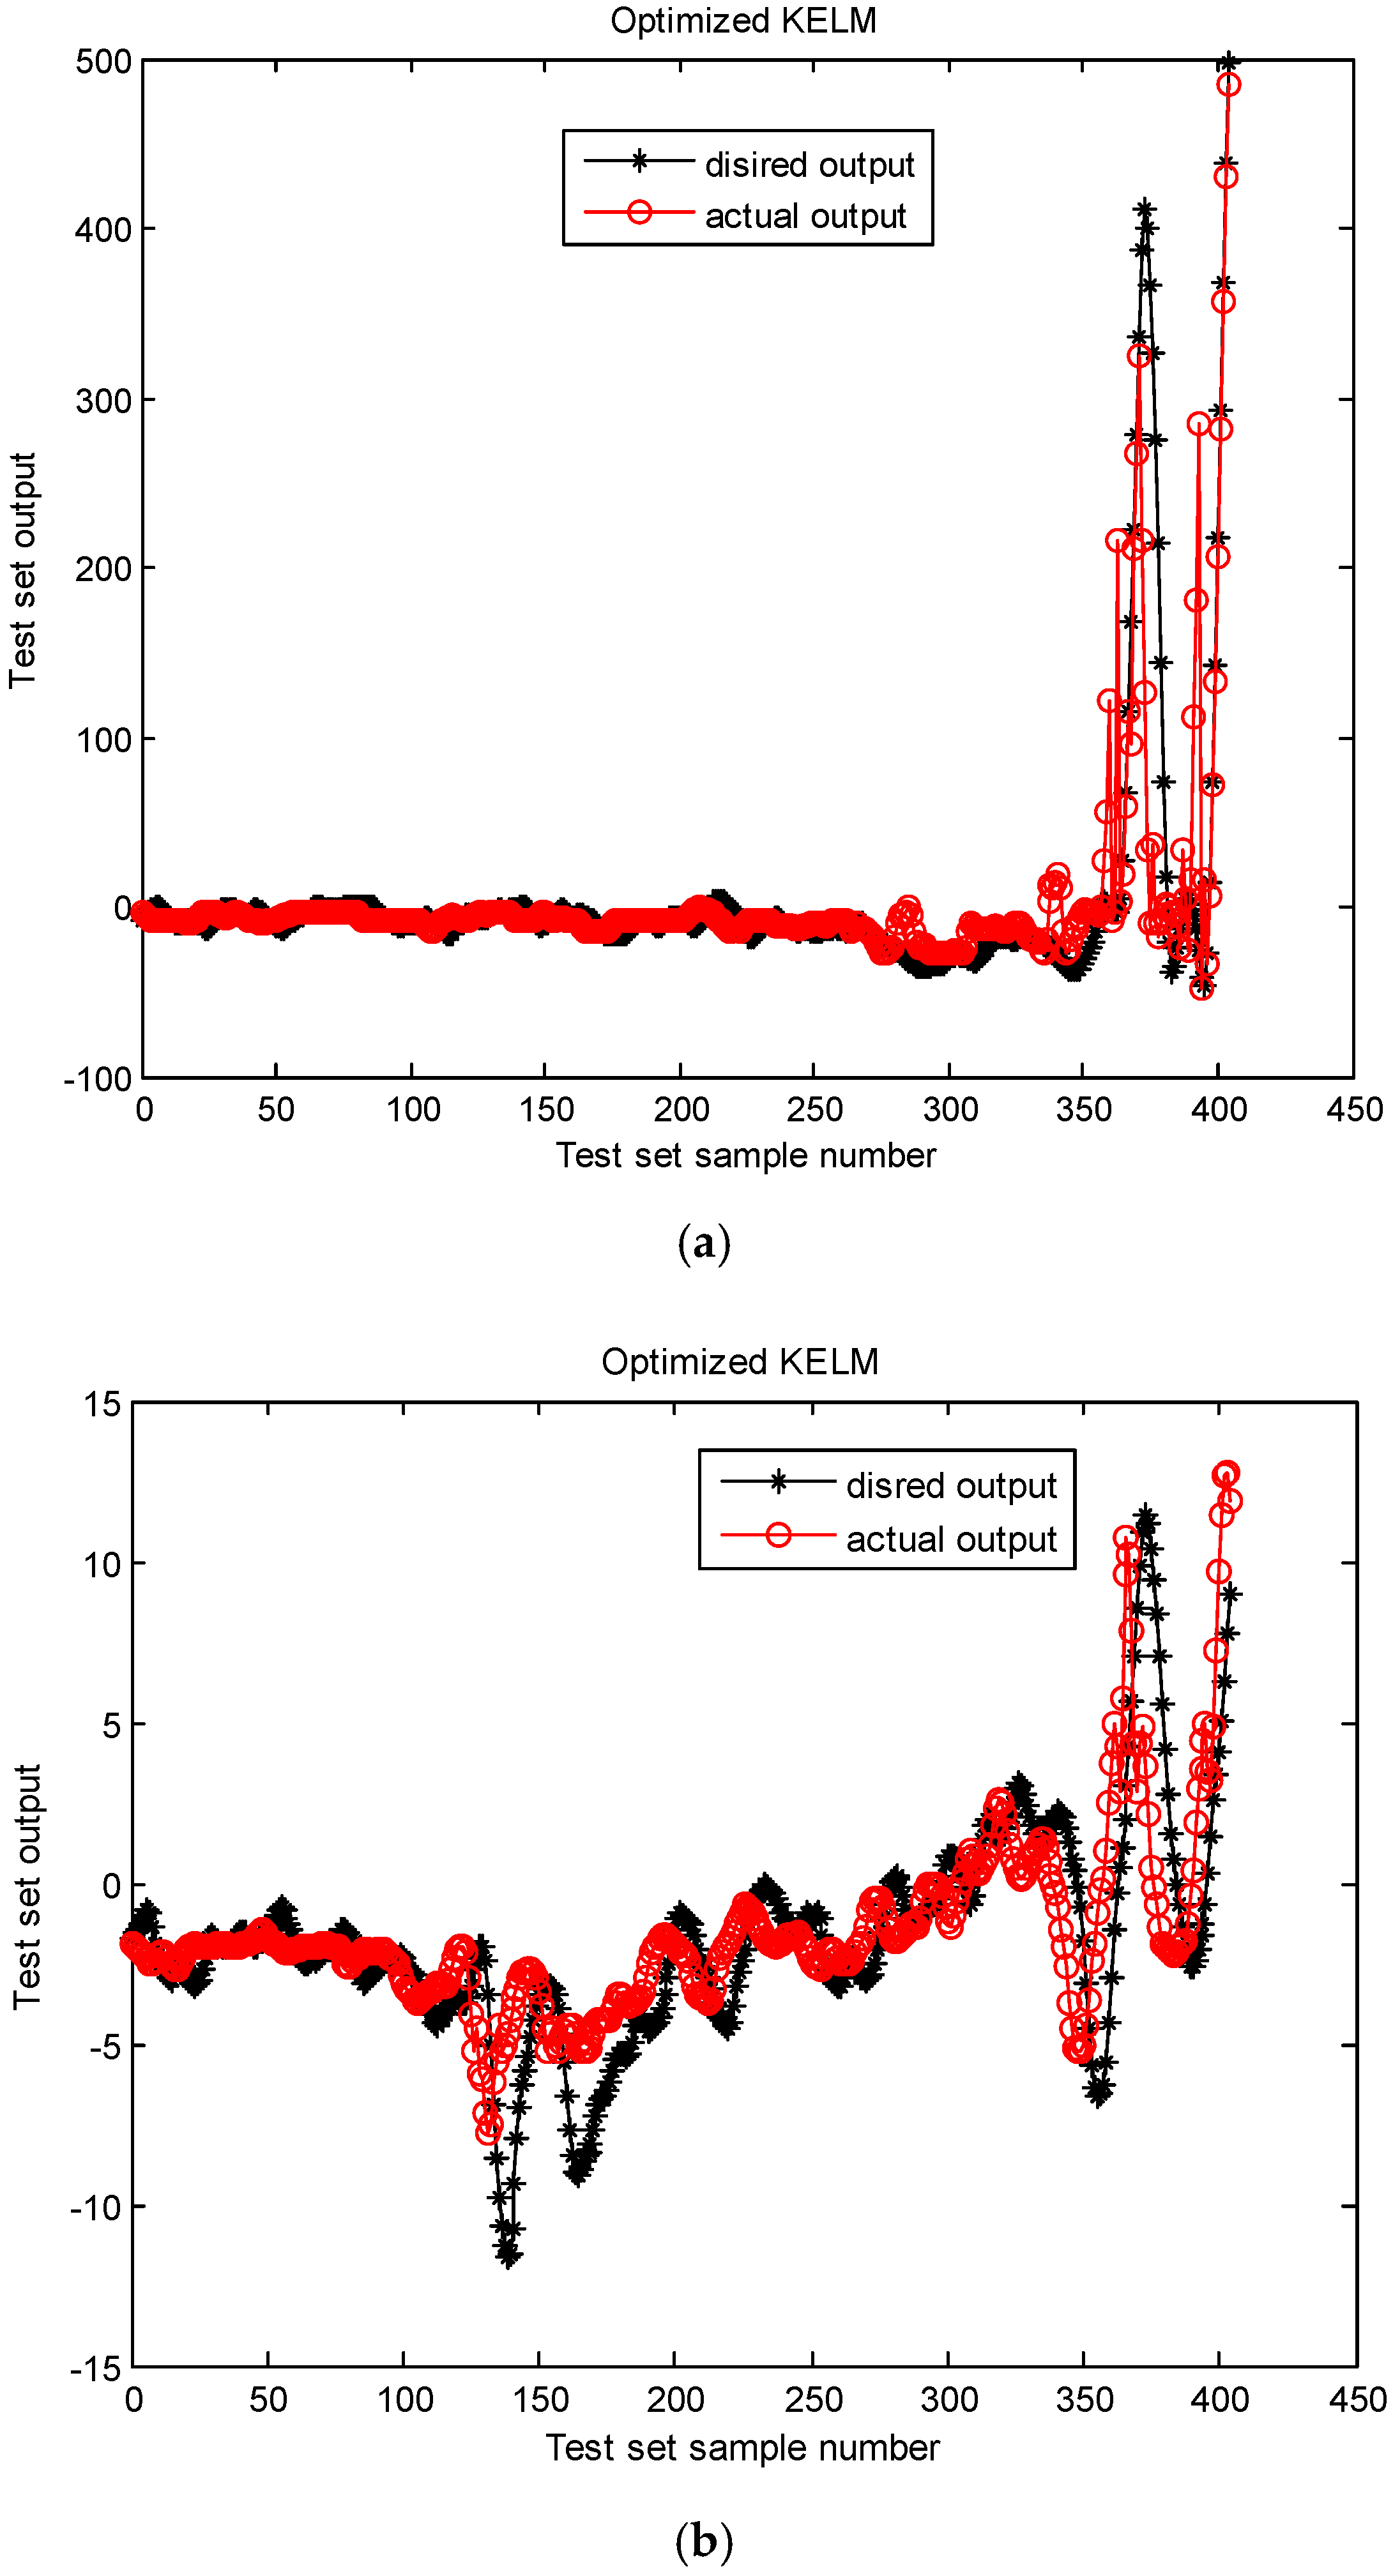
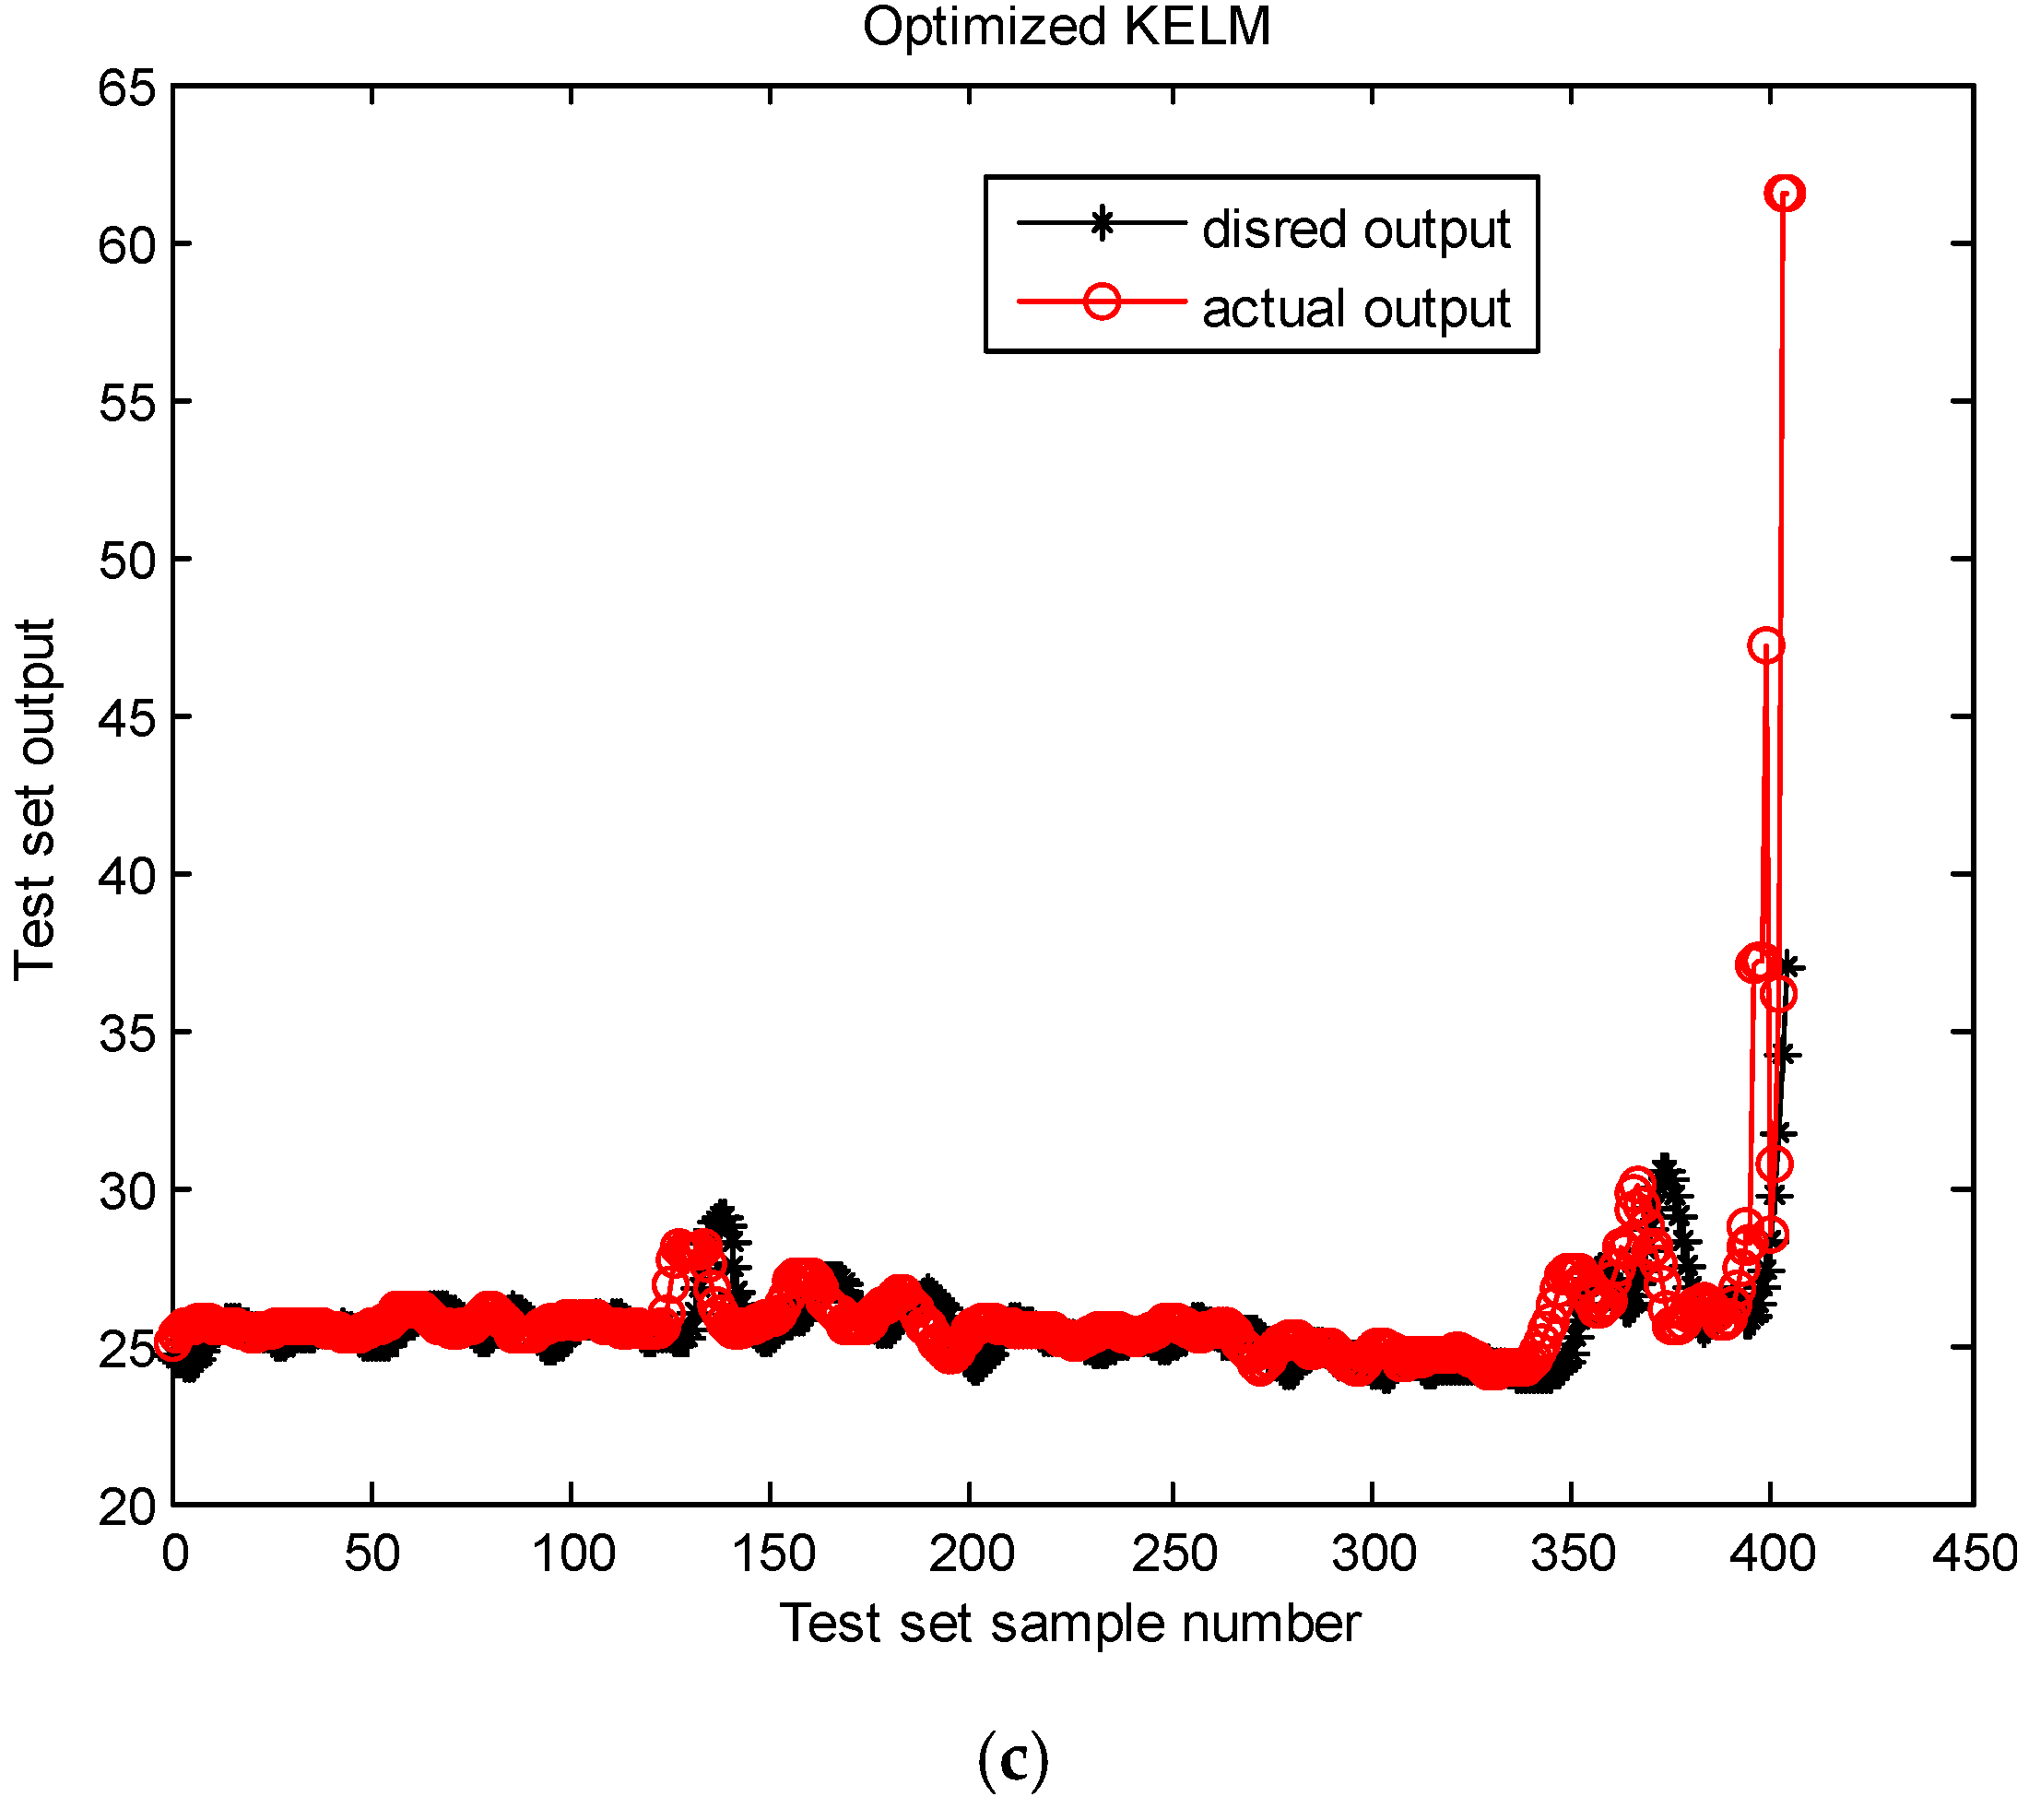
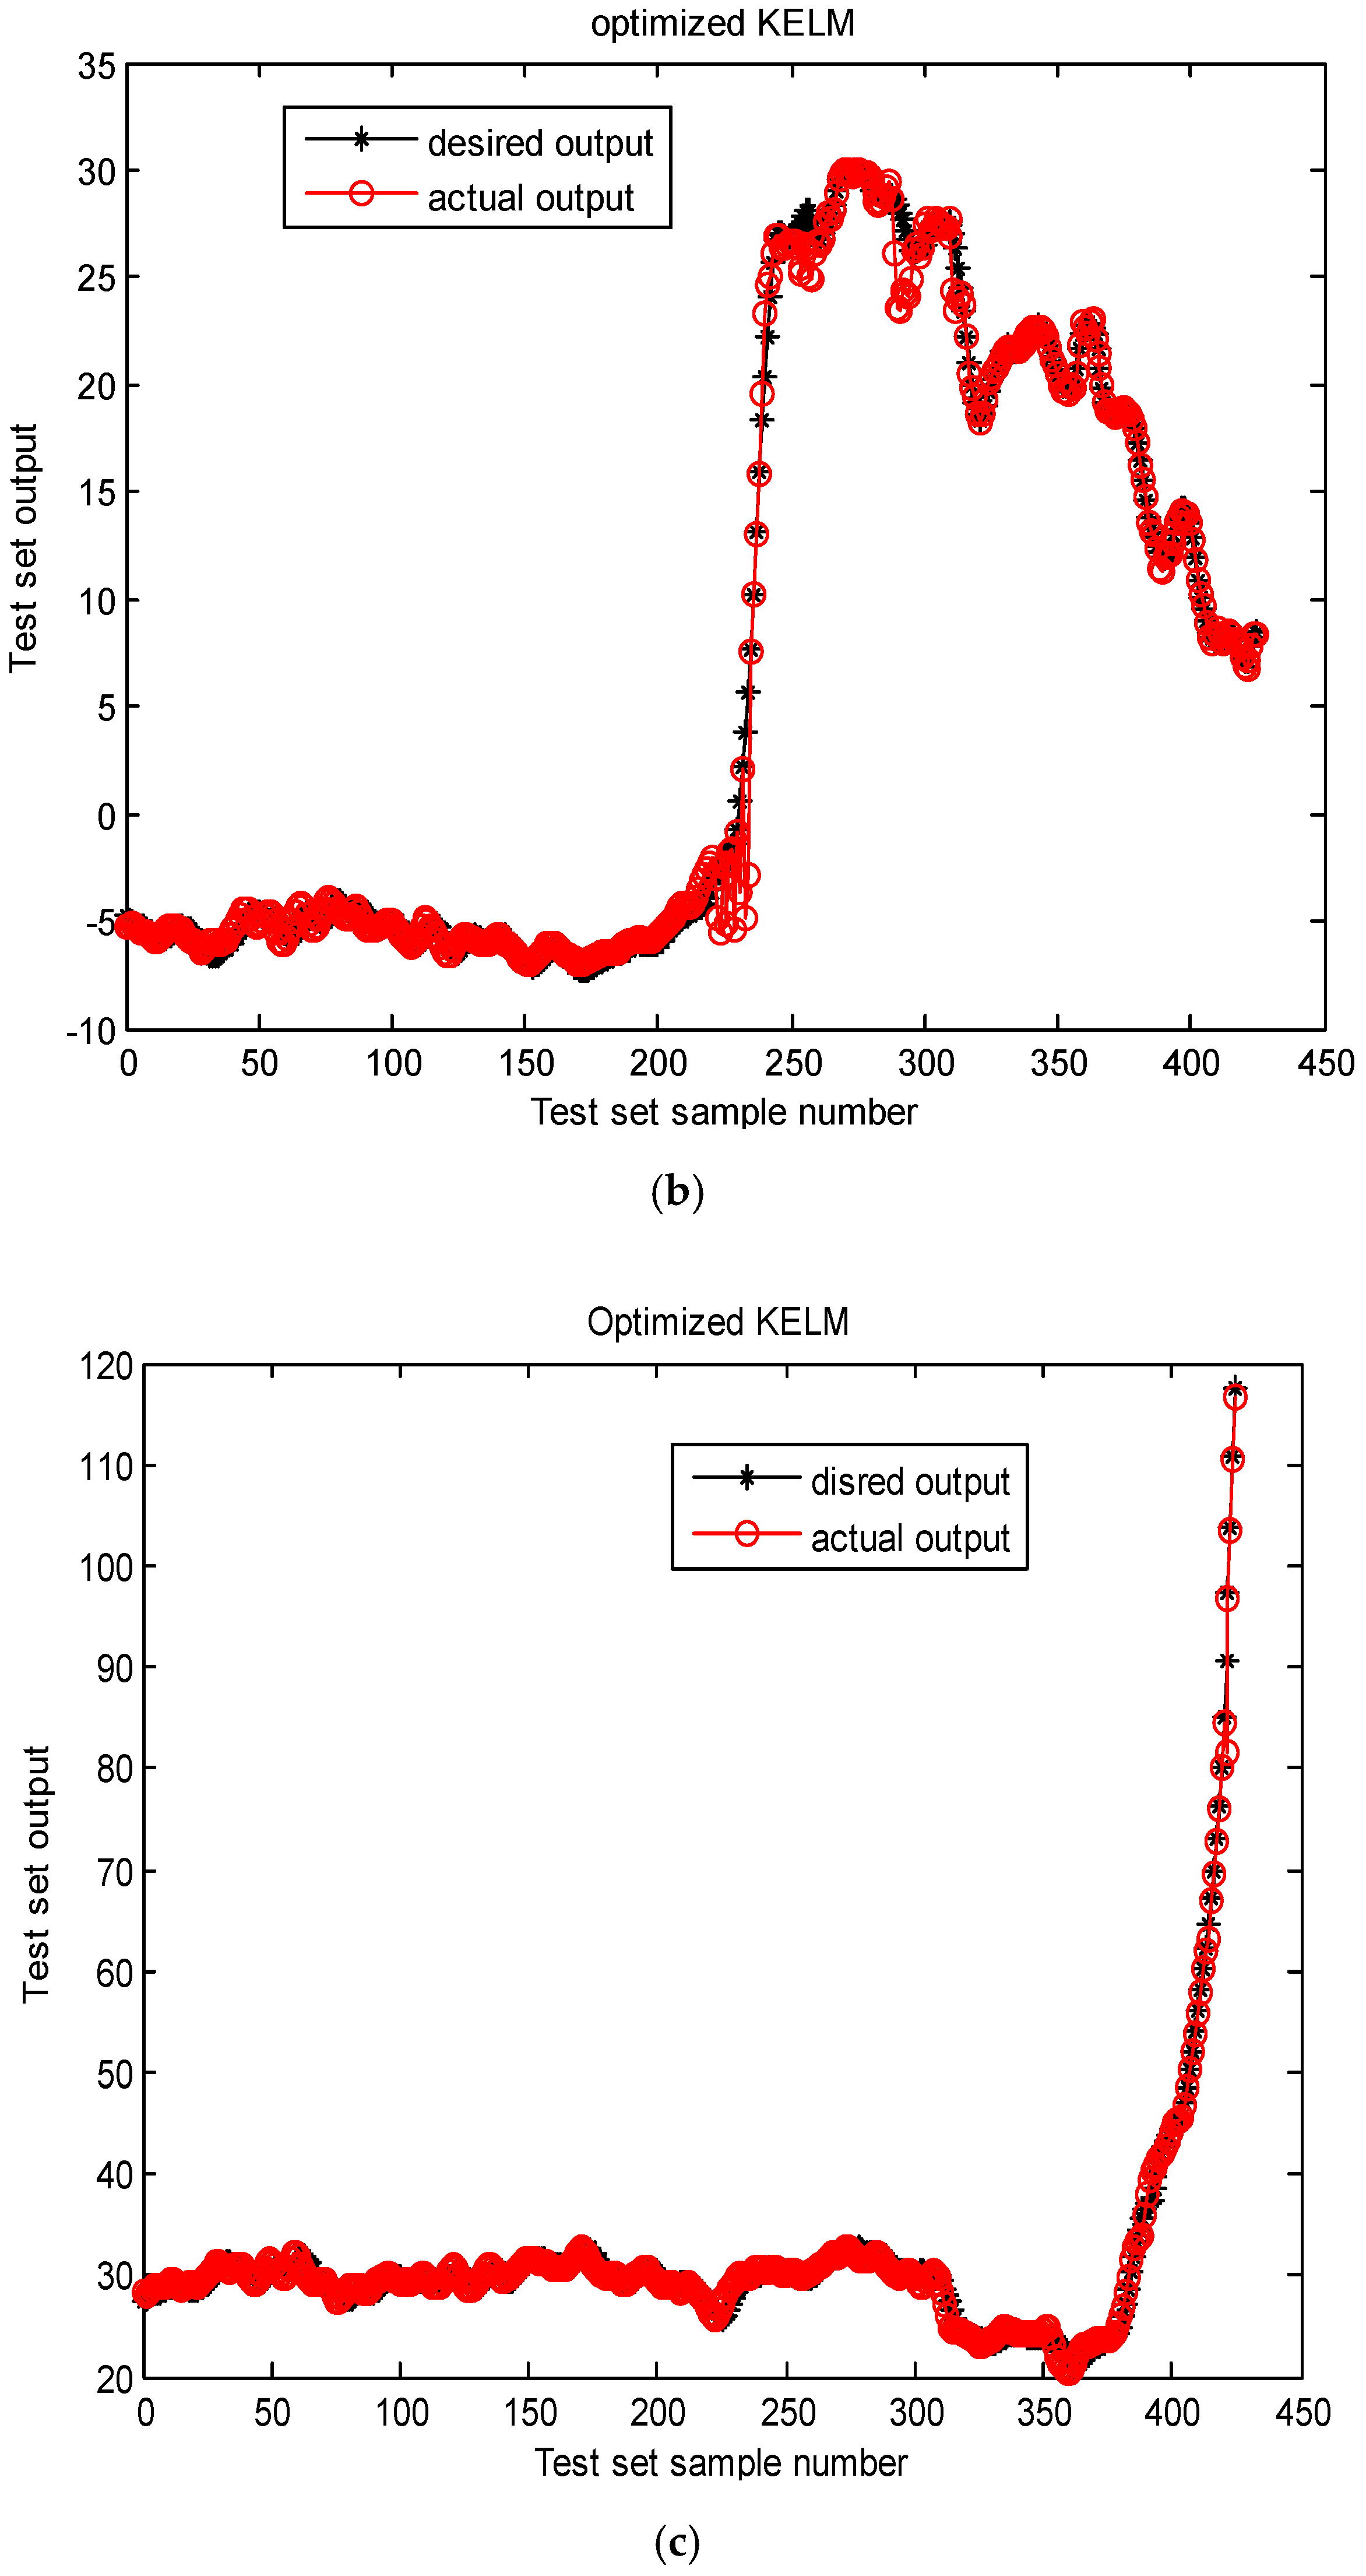
4.2. Result Analysis
5. Conclusions
Author Contributions
Funding
Data Availability Statement
Conflicts of Interest
References
- Cui, H.; Guan, Y.; Chen, H. Rolling element fault diagnosis based on VMD and sensitivity MCKD. IEEE Access 2021, 9, 120297–120308. [Google Scholar] [CrossRef]
- Li, G.; Li, Y.; Chen, H.; Deng, W. Fractional-order controller for course-keeping of underactuated surface vessels based on frequency domain specification and improved particle swarm optimization algorithm. Appl. Sci. 2022, 12, 3139. [Google Scholar] [CrossRef]
- Nandi, S.; Toliyat, H.A.; Li, X. Condition monitoring and fault diagnosis of electrical motors—A Review. IEEE Trans. Power Appar. Syst. 2005, 20, 719–729. [Google Scholar] [CrossRef]
- Zhang, X.; Wang, H.; Du, C.; Fan, X.; Cui, L.; Chen, H.; Deng, F.; Tong, Q.; He, M.; Yang, M.; et al. Custom-molded offloading footwear effectively prevents recurrence and amputation, and lowers mortality rates in high-risk diabetic foot patients: A Multicenter, Prospective Observational Study. Diabetes Metab. Syndr. Obes. Targets Ther. 2022, 15, 103–109. [Google Scholar] [CrossRef]
- Nie, M.; Wang, L. Review of condition monitoring and fault diagnosis technologies for wind turbine gearbox. Procedia CIRP 2013, 11, 287–290. [Google Scholar] [CrossRef] [Green Version]
- Godoy, W.F.; Morinigo-Sotelo, D.; Duque-Perez, O.; Da Silva, I.N.; Goedtel, A.; Palácios, R.H.C. Estimation of bearing fault severity in line-connected and inverter-fed three-phase induction motors. Energies 2020, 13, 3481. [Google Scholar] [CrossRef]
- Shi, X.J.; Wang, G.R.; Si, J.S. Mechanical Fault Diagnosis and Typical Case Analysis, 2nd ed.; Chemical Industry Press: Beijing, China, 2020. [Google Scholar]
- Pecht, M. Prognostics and Health Management; Springer: Berlin/Heidelberg, Germany, 2013; pp. 373–393. [Google Scholar]
- Deng, W.; Zhang, X.; Zhou, Y.; Liu, Y.; Zhou, X.; Chen, H.; Zhao, H. An enhanced fast non-dominated solution sorting genetic algorithm for multi-objective problems. Inf. Sci. 2022, 585, 441–453. [Google Scholar] [CrossRef]
- Si, X.-S.; Wang, W.; Hu, C.-H.; Zhou, D.-H. Remaining useful life estimation—A review on the statistical data driven approaches. Eur. J. Oper. Res. 2011, 213, 1–14. [Google Scholar] [CrossRef]
- Wang, W.; Carr, M.; Xu, W.; Kobbacy, K. A model for residual life prediction based on Brownian motion with an adaptive drift. Microelectron. Reliab. 2010, 51, 285–293. [Google Scholar] [CrossRef]
- Le Son, K.; Fouladirad, M.; Barros, A. Remaining useful life estimation on the non-Homogeous gamma with noise deterioration based on gibbs filtering: A Case Study. In Proceedings of the IEEE International Conference on Prognostics and Health Management, Denver, CO, USA, 18–21 June 2012; pp. 1–6. [Google Scholar]
- Sun, L.; Tang, X.G.; Zhang, X.H. Study of gearbox residual life prediction based on stochastic filtering model. Mech. Transm. 2011, 35, 56–60. [Google Scholar]
- Kang, J.; Zhang, X.; Zhao, J.; Cao, D. Gearbox Fault prognosis based on CHMM and SVM. Quality, Reliability, Risk, Maintenance, and Safety Engineering (ICQR2MSE). In Proceedings of the International Conference on Quality, Reliability, Risk, Maintenance, and Safety Engineering, Chengdu, China, 15–18 June 2012; pp. 703–708. [Google Scholar]
- Wang, T.; Yu, J.; Siegel, D.; Lee, J. A Similarity-based prognostics approach for rul estimation of engineering systems. In Proceedings of the International Conference on Prognostics and Health Management, Denver, CO, USA, 6–9 October 2008; pp. 1–6. [Google Scholar]
- Deng, W.; Liu, H.; Xu, J.; Zhao, H.; Song, Y. An improved quantum-inspired differential evolution algorithm for deep belief network. IEEE Trans. Instrum. Meas. 2020, 69, 7319–7327. [Google Scholar] [CrossRef]
- Zhao, H.; Liu, H.; Xu, J.; Guo, C.; Deng, W. Research on a fault diagnosis method of rolling bearings using variation mode decomposition and deep belief network. J. Mech. Sci. Technol. 2019, 33, 4165–4172. [Google Scholar] [CrossRef]
- Deng, W.; Li, Z.; Li, X.; Chen, H.; Zhao, H. Compound fault diagnosis using optimized MCKD and sparse representation for rolling bearings. IEEE Trans. Instrum. Meas. 2022, 71, 1–9. [Google Scholar] [CrossRef]
- Rosenkranz, A.; Marian, M.; Profito, F.J.; Aragon, N.; Shah, R. The Use of artificial intelligence in tribology—A Perspective. Lubricants 2021, 9, 2. [Google Scholar] [CrossRef]
- Pan, Y.; Chen, J.; Guo, L. Robust bearing performance degradation assessment method based on improved wavelet packet–support vector data description. Mech. Syst. Signal. Process. 2009, 23, 669–681. [Google Scholar] [CrossRef]
- Shaojiang, D. Research on Space Bearing Life Prediction Method Based on Optimized Support Vector Machine; College of Mechanical Engineering of Chongqing University: Chongqin, China, 2012; pp. 47–90. [Google Scholar]
- Dong, S.; Luo, T. Bearing degradation process prediction based on the PCA and optimized LS-SVM model. Measurement 2013, 46, 3143–3152. [Google Scholar] [CrossRef]
- Liao, H.; Zhao, W.; Guo, H. Predicting remaining useful life of an individual unit using proportional hazards model and logistic regression model. In Proceedings of the Reliability and Maintainability Symposium, Newport Beach, CA, USA, 23–26 January 2006; pp. 127–132. [Google Scholar]
- Siegel, D.; Lee, J.; Ly, C. Methodology and framework for predicting rolling element helicopter bearing failure. In Proceedings of the Prognostics and Health Management (PHM), Montreal, QC, Canada, 25–29 September 2011; pp. 1–9. [Google Scholar]
- Galar, D.; Kumar, U.; Lee, J.; Zhao, W. Remaining useful life estimation using time trajectory tracking and support vector machines. J. Phys. Conf. Ser. 2012, 364, 012063. [Google Scholar] [CrossRef] [Green Version]
- Sutrisno, E.; Oh, H.; Vasan, A.S.S.; Pecht, M. Estimation of remaining useful life of ball bearings using data driven methodologies. In Proceedings of the Annual Conference of the Prognostics and Health Management Society, Denver, CO, USA, 23–27 September 2012; pp. 1–7. [Google Scholar]
- Xue, X.H. Evaluation of concrete compressive strength based on an improved PSO-LSSVM model. Comput. Concr. Int. J. 2018, 21, 505–511. [Google Scholar]
- Ishaque, K.; Salam, Z.; Amjad, M.; Mekhilef, S. An improved particle swarm optimization (PSO)–based MPPT for PV with reduced steady-state oscillation. IEEE Trans. Power Electron. 2012, 27, 3627–3638. [Google Scholar] [CrossRef]
- Yang, L.; Xue-Feng, T.; Zhi-Hui, Z. Research on inertia weight control approaches in particle swarm optimization. J. Nanjing Univ. 2011, 47, 364–371. [Google Scholar]
- Shi, Y.; Eberhart, R.C. A modified particle swarm optimizer. In Proceedings of the IEEE Congress on Evolutionary Computation, Anchorage, AK, USA, 4–9 May 1998; pp. 303–308. [Google Scholar]
- Hu, J.; Zeng, J.C. Selection on inertia weight of particle swarm optimization. Comput. Eng. 2007, 33, 193–195. [Google Scholar]
- Patnaik, S.; Li, X. Advances in Intelligent Systems & Computing. In Proceedings of the International Conference on Computer Science and Information Technology, Xi’an, China, 11–13 September 2014; Volume 21, pp. 520–521. [Google Scholar]
- Zhao, H.; Liu, H.; Xu, J.; Deng, W. Performance prediction using high-order differential mathematical morphology gradient spectrum entropy and extreme learning machine. IEEE Trans. Instrum. Meas. 2019, 69, 4165–4172. [Google Scholar] [CrossRef]
- Zhu, M.; Xu, A.Q.; Chen, Q.Q.; Li, R. An improved KELM based online condition prediction method. J. Beijing Univ. Aeronaut. Astronaut. 2019, 045, 1370–1379. (In Chinese) [Google Scholar]
- Nectoux, P.; Gouriveau, R.; Medjaher, K.; Ramasso, E.; Chebel-Morello, B.; Zerhouni, N.; Varnier, C. Pronostia: An experimental platform for bearings accelerated degradation tests. In Proceedings of the IEEE International Conference on Prognostics and Health Management, PHM’12, Denver, CO, USA, 18–21 June 2012; pp. 1–8. [Google Scholar]
- Ran, X.; Zhou, X.; Lei, M.; Tepsan, W.; Deng, W. A novel k-means clustering algorithm with a noise algorithm for capturing urban hotspots. Appl. Sci. 2021, 11, 11202. [Google Scholar] [CrossRef]
- He, Q. Vibration signal classification by wavelet packet energy flow manifold learning. J. Sound Vib. 2013, 332, 1881–1894. [Google Scholar] [CrossRef]
- Qin, N.; Sun, Y.; Gu, P.; Ma, L. Bogie Fault identification based on EEMD information entropy and manifold learning. IFAC-PapersOnLine 2017, 50, 315–318. [Google Scholar] [CrossRef]


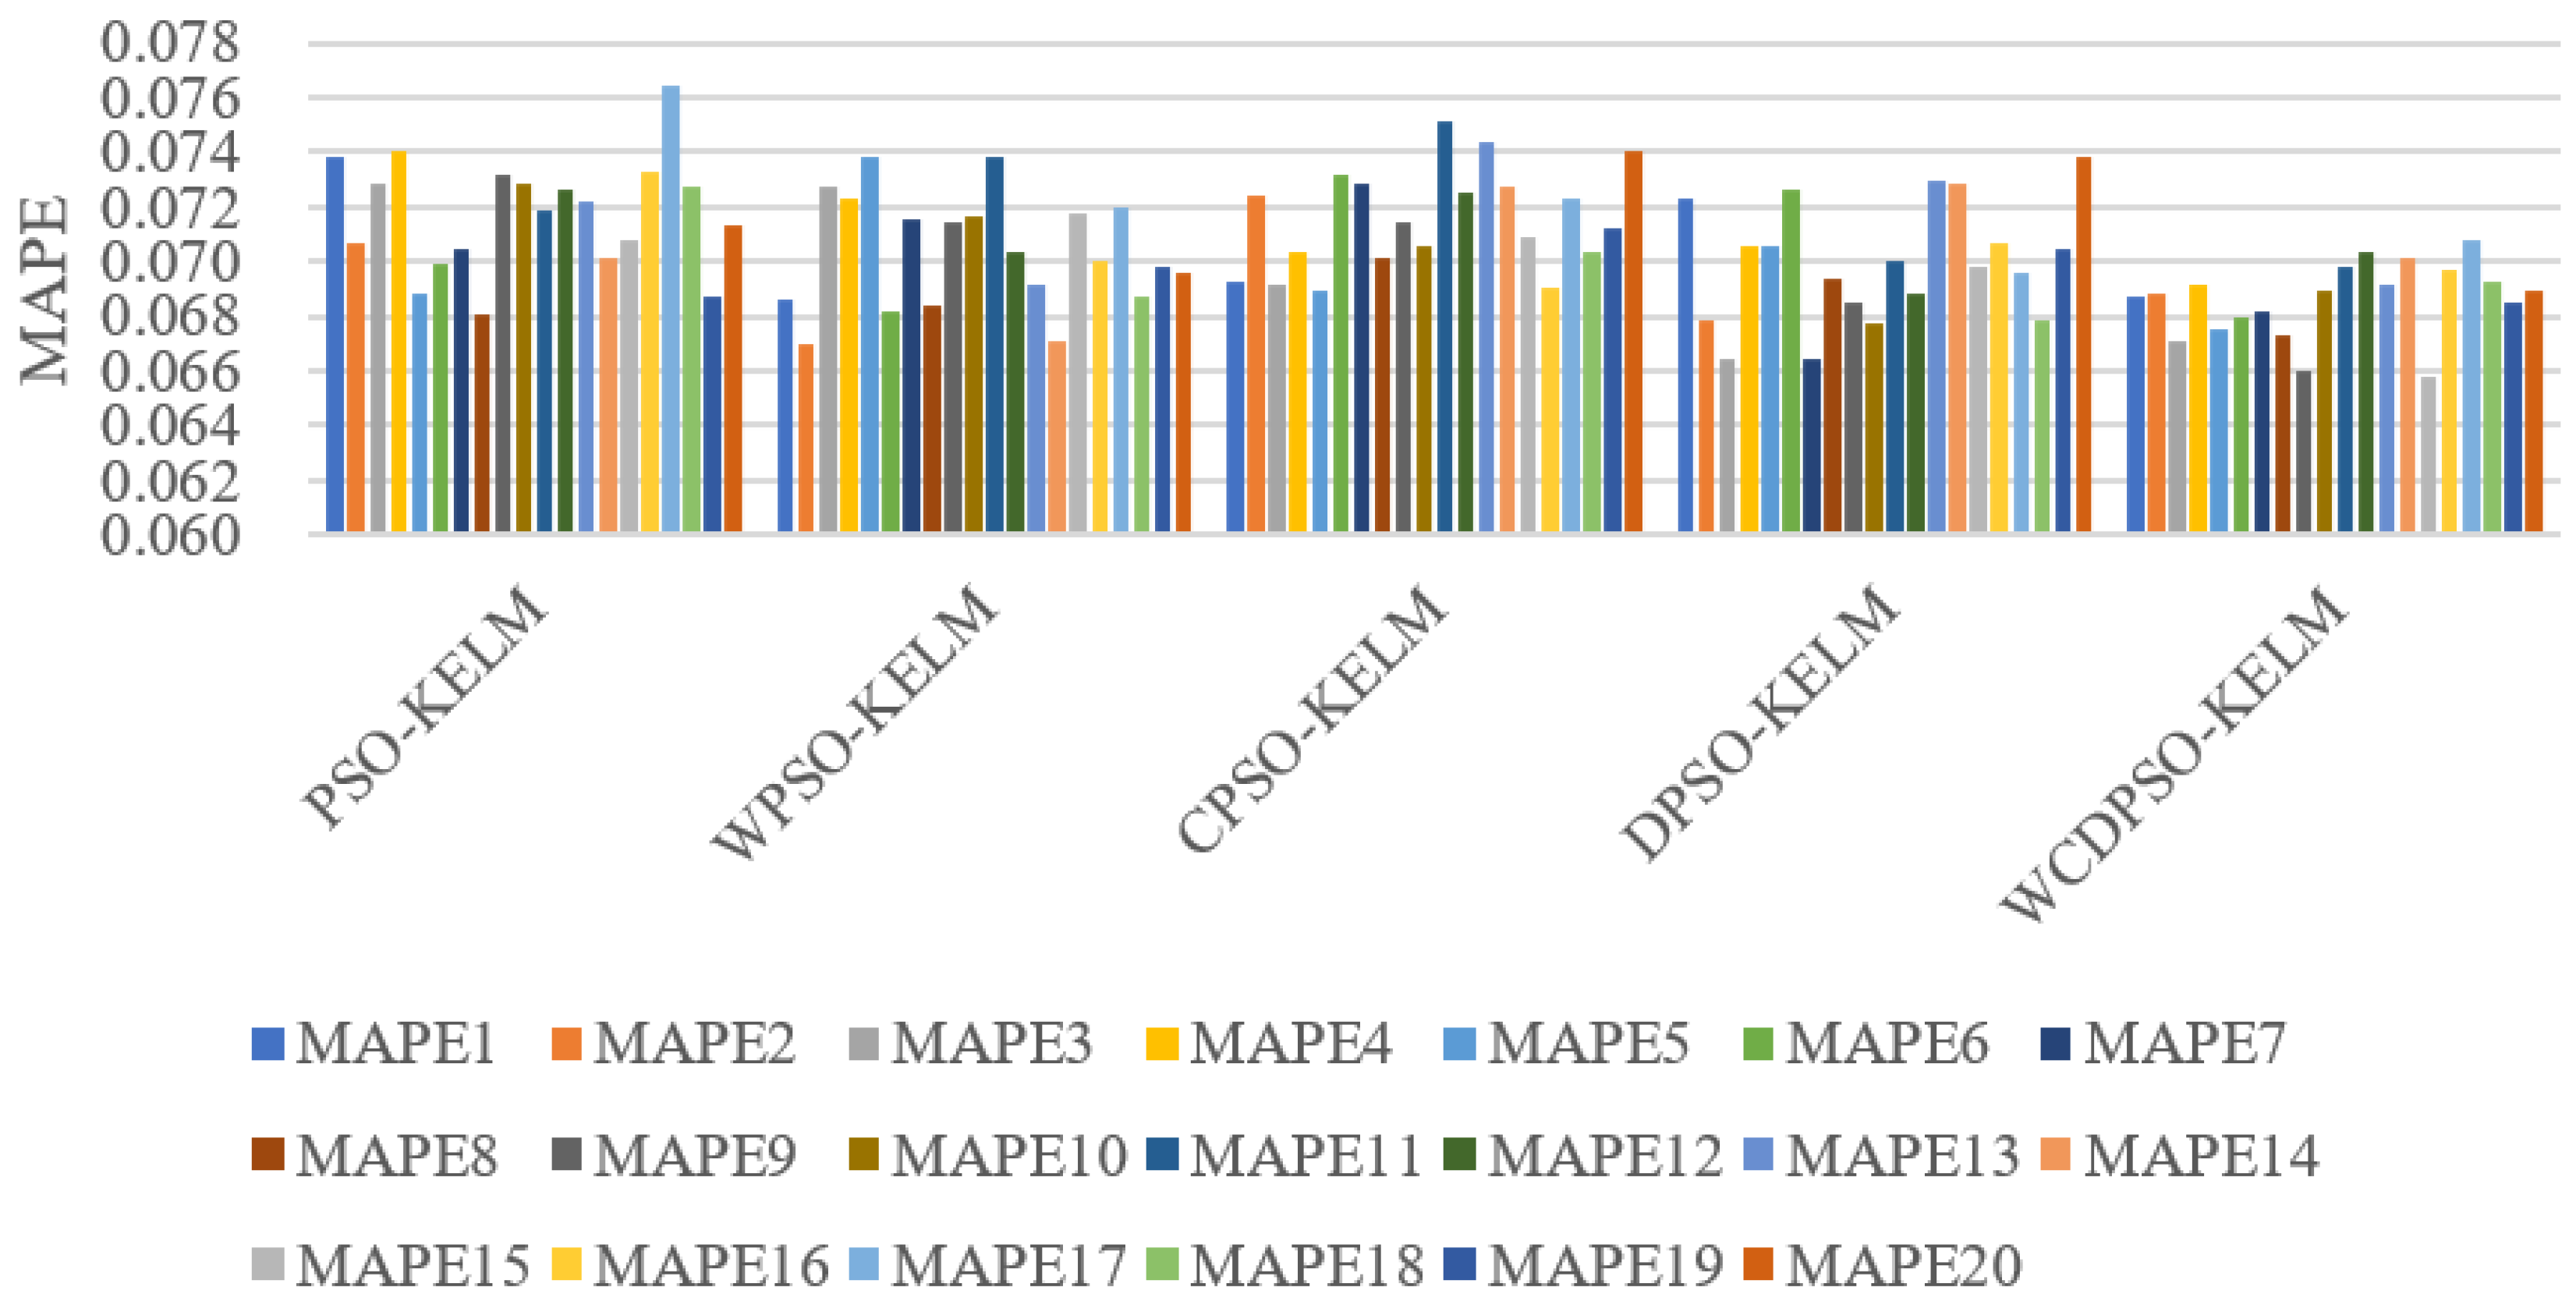
| Model | MAPE | Average | Standard Deviation | |||||||||
|---|---|---|---|---|---|---|---|---|---|---|---|---|
| PSO-KELM | 0.0738 | 0.0707 | 0.0729 | 0.0741 | 0.0688 | 0.0699 | 0.0705 | 0.0681 | 0.0732 | 0.0728 | 0.0717 | 0.0020 |
| 0.0719 | 0.0726 | 0.0722 | 0.0701 | 0.0708 | 0.0733 | 0.0764 | 0.0727 | 0.0687 | 0.0713 | |||
| WPSO-KELM | 0.0686 | 0.0670 | 0.0727 | 0.0723 | 0.0738 | 0.0682 | 0.0715 | 0.0684 | 0.0714 | 0.0717 | 0.0704 | 0.0020 |
| 0.0738 | 0.0703 | 0.0692 | 0.0671 | 0.0718 | 0.0700 | 0.0720 | 0.0687 | 0.0698 | 0.0696 | |||
| CPSO-KELM | 0.0693 | 0.0724 | 0.0692 | 0.0703 | 0.0689 | 0.0732 | 0.0728 | 0.0701 | 0.0714 | 0.0706 | 0.0715 | 0.0018 |
| 0.0751 | 0.0725 | 0.0744 | 0.0727 | 0.0709 | 0.0690 | 0.0723 | 0.0704 | 0.0712 | 0.0741 | |||
| DPSO-KELM | 0.0723 | 0.0679 | 0.0664 | 0.0706 | 0.0706 | 0.0726 | 0.0664 | 0.0694 | 0.0685 | 0.0677 | 0.0699 | 0.0021 |
| 0.0700 | 0.0688 | 0.0730 | 0.0729 | 0.0698 | 0.0707 | 0.0696 | 0.0678 | 0.0705 | 0.0738 | |||
| WCDPSO-KELM | 0.0687 | 0.0688 | 0.0671 | 0.0692 | 0.0675 | 0.0680 | 0.0682 | 0.0673 | 0.0660 | 0.0689 | 0.0686 | 0.0013 |
| 0.0698 | 0.0704 | 0.0691 | 0.0701 | 0.0658 | 0.0697 | 0.0708 | 0.0693 | 0.0685 | 0.0689 | |||
| Working Condition | Speed (Rpm) | Load (N) | Sample Data |
|---|---|---|---|
| 1 | 1800 | 4000 | bearing1_k, k = 1,2,…,7 |
| 2 | 1650 | 4200 | bearing2_k, k = 1,2,…,7 |
| 3 | 1500 | 5000 | bearing3_k, k = 1,2,3 |
| Working Condition | Numbered Sample Data | The Data Dimension |
|---|---|---|
| 1 | bearing1_5 | 2463 × 2560 |
| 2 | bearing2_5 | 2304 × 2560 |
| 3 | bearing3_2 | 1637 × 2560 |
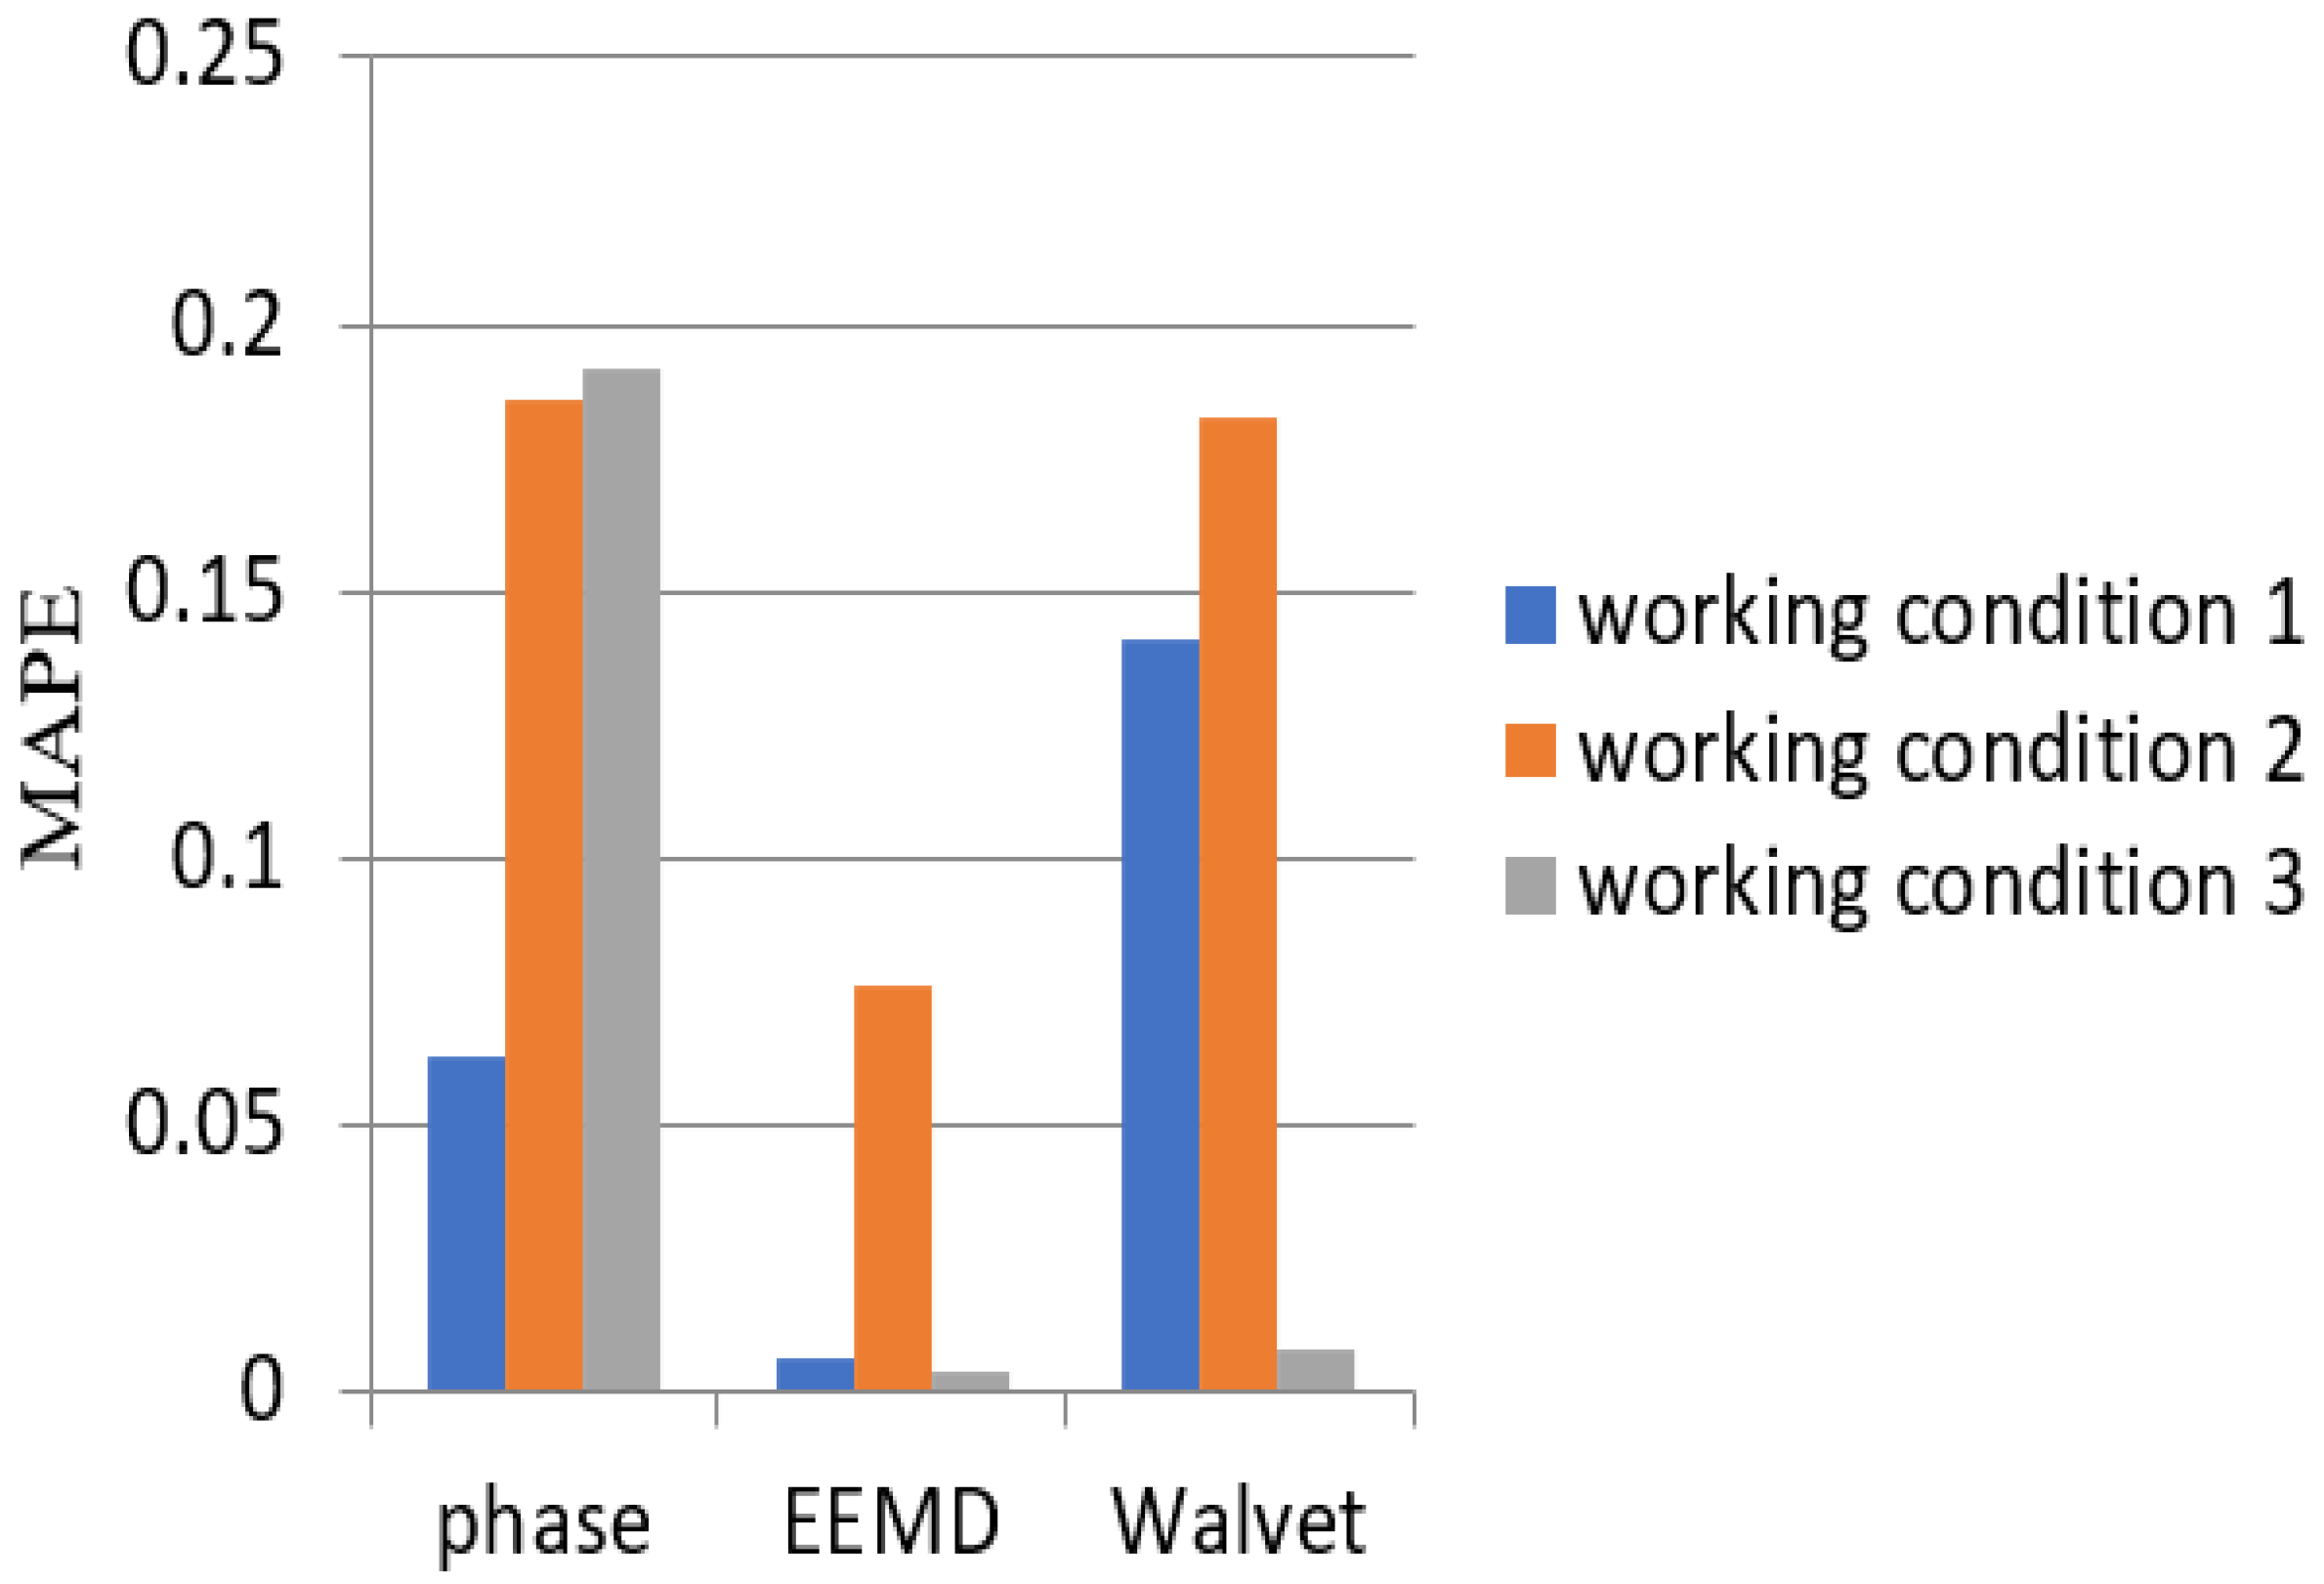
| Working Condition | MAPE | ||
|---|---|---|---|
| phase | EEMD | wavelet | |
| 1 | 0.0629877 | 0.005971 | 0.141041 |
| 2 | 0.1859479 | 0.076398 | 0.182735 |
| 3 | 0.1917164 | 0.003721 | 0.007825 |
Publisher’s Note: MDPI stays neutral with regard to jurisdictional claims in published maps and institutional affiliations. |
© 2022 by the authors. Licensee MDPI, Basel, Switzerland. This article is an open access article distributed under the terms and conditions of the Creative Commons Attribution (CC BY) license (https://creativecommons.org/licenses/by/4.0/).
Share and Cite
Li, X.; Zhao, H. Performance Prediction of Rolling Bearing Using EEMD and WCDPSO-KELM Methods. Appl. Sci. 2022, 12, 4676. https://doi.org/10.3390/app12094676
Li X, Zhao H. Performance Prediction of Rolling Bearing Using EEMD and WCDPSO-KELM Methods. Applied Sciences. 2022; 12(9):4676. https://doi.org/10.3390/app12094676
Chicago/Turabian StyleLi, Xiumei, and Huimin Zhao. 2022. "Performance Prediction of Rolling Bearing Using EEMD and WCDPSO-KELM Methods" Applied Sciences 12, no. 9: 4676. https://doi.org/10.3390/app12094676
APA StyleLi, X., & Zhao, H. (2022). Performance Prediction of Rolling Bearing Using EEMD and WCDPSO-KELM Methods. Applied Sciences, 12(9), 4676. https://doi.org/10.3390/app12094676