Article

Big Data-Driven Measurement of the Service Capacity of Public Toilet Facilities in China

1
Institute of Applied Ecology, Chinese Academy of Sciences, Shenyang 110016, China
2
University of Chinese Academy of Sciences, Beijing 100049, China
3
Key Lab for Environmental Computation and Sustainability of Liaoning Province, Shenyang 110016, China
4
College of Urban and Environmental Sciences, Xuchang University, Xuchang 461000, China
5
Weifang Academy of Modern Agriculture and Ecological Environment, Weifang 261071, China
*
Author to whom correspondence should be addressed.
Appl. Sci. 2022, 12(9), 4659; https://doi.org/10.3390/app12094659
Submission received: 16 February 2022 / Revised: 3 May 2022 / Accepted: 4 May 2022 / Published: 6 May 2022

Abstract

:
Public health facility planning is one of the important contents of national land planning, which needs to balance geospatial equity and service capacity. However, assessment models and data acquisition methods based on a geosystemic analysis perspective have been lacking for a long time. By focusing on urban public toilets and taking the highly urbanized city of Shenyang, China as the study area, this study developed a new data strategy for urban public facilities with points of interests (POI) big data as the main data source, and subsequently corrected the POI data and analyzed the errors through a field survey, and conducted an empirical assessment oriented toward spatial equity and service capacity to discover the development dynamics of urban facilities over the past ten years and the impacting factors. We found that the integrated population and spatial elements could more accurately evaluate the service capacity of public toilets. Meanwhile, POI data have value in the research of public health facilities, but there are some errors in data quality and data access. The study empirically explores the geographic analysis methods of field research data (small data) and POI data (big data) with empirical contributions.

1. Introduction

Public health infrastructure is an important part of the urban infrastructure system, as well as an important prerequisite and necessity for social livelihood and economic development [1]. Public toilets have become the basis for the evaluation of urban public health services because of their proximity to residents’ lives and rapid renewal changes. It also reflects the sanitation and health level of society to a certain extent. Urban public toilet facilities, the collective term of toilet sanitation facilities for urban residents and floating populations, are an essential part of urban environmental sanitation facilities and critical elements of urban tourism facilities and cultural construction. Public toilet facilities play a key and irreplaceable role in maintaining the urban environment and public health [2,3,4,5,6], especially in places where low-income groups live and are densely inhabited districts [7,8]. Historically, one of the leading causes of the Black Death ravaged the European continent was the lack of sanitation facilities such as public toilets, which increased the demand for public toilet facilities [9]. Empirical studies based in India have shown that the increasing usage of toilets has a significant effect on reducing infectious diseases, with a 10% increase in public health spending found to reduce the average mortality rate by 2% [10]. The United Nations Sustainable Development Goal clearly states that “By 2030, achieve access to adequate and equitable sanitation and hygiene for all and end open defecation, paying particular attention to the needs of women and girls and those in vulnerable situations” [11].
The essential characteristic of public toilet facilities is serviceability, mainly reflected in the balanced spatial distribution and the matching of population needs [12]. However, more than 2.4 billion people lack access to basic sanitation. Meanwhile, as of 2011, about one billion people worldwide had no access to a toilet and had to defecate in the open [13]. In many low-income countries and regions, the small number of public toilets is mainly manifested as spatial inequity [14]. At the same time, there is a mismatch between the number of public toilets and the population in densely populated regions of developing countries, manifesting as inequity in demand matching [15]. Meanwhile, with the rapid aging of the population and the increased openness of human socio-economic activities, public toilets’ demand for special groups such as women, children, and the disabled is also growing significantly [16,17,18,19]. Thus, it has become an important measure to reflect urban construction’s sustainability, inclusiveness, and fairness.
For a long time, studies on the fairness and serviceability of public toilets have mainly used statistical data or questionnaires as the primary data source [20]. For example, Donna uncovered the spatial distribution of public toilets in urban parks and recreational areas within the United States, Japan, Australia, and other countries based on statistical data and city map data published on government websites [21]. Nega et al. [22] studied the location of public toilets in Debre Markos Township using survey questionnaires, combined with fieldwork and reporting guide documents, and DEM data provided by SRTM. Xu et al. [23] discussed the differences between public toilets of different service levels and crowd density by traveling crowd density, combined with the location of public toilets. The above studies have played a positive role in enhancing the perception of the service capacity of public toilets, but there are also a series of problems such as incomplete data samples, limited geographical coverage, and lagging data updates.
With the rapid development and widespread application of information technology, especially electronic map technology, data sources represented by POI provide new possibilities for more accurate and real-time cognitive appraisals of facility service capacity [24,25,26,27,28]. For example, Yu et al. [29] employed the full-sample data of POI and car track to identify urban functional areas in Chengdu. Li et al. [30] used the POI data to extract the urban built-up areas with high accuracy. Wu et al. [31] used POI data of different years to study the role of geographical factors in the rise and fall of restaurants in Beijing. For the spatial distribution of public toilets, POI data also play an important role. Han et al. [32] obtained POI data to support scientific planning and decision making of public facilities in tourist destinations. Chen et al. [33] proposed a data-driven approach to tackle the site selection problem of public toilets. Ma et al. [34] proposed a rationality evaluation method of public toilet spatial layout based on POI big data from the perspective of the urban functional area.
As the largest developing country, China’s urbanization rate has increased from 17.92% in 1978 to 63.89% in 2020 (National Bureau of Statistics), and significant progress has been made in urban infrastructure construction. For example, in the field of public toilets, with the government-led “toilet revolution”, local governments have issued standards and policies to promote the renovation and construction of public toilets [35]. The evaluation system of civilized cities in China, issued by the Ministry of Housing and Urban-Rural Development of the People’s Republic of China, has set standards such as the spacing of public toilets. However, the service level of urban public toilet facilities and their service care for particular groups (the disabled, women, infants, etc.) is still under-recognized. This study attempts to construct a service capacity evaluation system based on POI data. Five districts of Shenyang city are selected for empirical application analysis. Based on the field survey data, corrections were made to address the problems in the data quality and acquisition process of the POI data. The balance of public toilets is measured comprehensively from three levels: spatial, population, and spatial-population. The driving factors of the spatial distribution of public toilets were quantitatively analyzed by the geodetector method. The aim of this paper is to explore the availability of POI data in urban sanitation infrastructure and the service capacity level of public toilets in China.

2. Materials and Methods

2.1. Data Source and Methods

For a long time, the reliability and accuracy of studies on the assessment and decision support of urban facility service capacity mainly depended on two aspects: one is the appliable assessment method; the other is the accurate data support [36,37]. They are interlinked and mutually constrained [38] and influenced by the spatial scale, element attributes, and target export at the same time [39]. At the spatial scale above the municipal area, it is more convenient to obtain social statistics. However, it is difficult to obtain geographical location data at large scales due to the lack of data types. On the other hand, it is easy to obtain geographical location data below the street and community spatial scale, but it is not easy to obtain social statistics. In terms of content, geographical location data only contains information such as name and location, lacking more comprehensive attribute information. According to the classification information, public toilet facilities were classified into dependent public toilets and independent public toilets to supplement the attribute information, including sanitary conditions and business hours, and expand the service capacity evaluation data set of public toilet facilities. Correspondingly, for the two target needs of public toilet facilities’ balance and spatial pattern, an evaluation system of the service capacity of public toilet facilities is formed by integrating multiple data sources and analyzing the distribution pattern and model construction. Therefore, with the support of multi-source data, this paper selects the street community-level scale to evaluate the service capacity of public toilet facilities from two target outlets: resource balance and spatial service model.
Based on the support of POI big data, combined with social statistics and survey data, this study constructed a multi-source data correction and fusion system for facility service capacity evaluation. The POI data of public toilets in 2008 and 2018 were obtained from the AMap platform (https://ditu.amap.com/ (accessed on 1 December 2018), following the AMap API POI classification rules. AMap company (Beijing, China) is a leading provider of digital map content, navigation, and location services in China. By applying the key to the company’s platform, crawler technology can be used to obtain a certain amount of POI data provided by AMap. The data type codes were 200,300–200,304, with the type of “public facility—public toilet—public restroom; public facility—public toilet—men’s restroom; public facility—public restroom—female restroom; public facility—public restroom—disabled restroom/accessible restroom; public facility—public restroom—baby care room/lactation room”. The POI data of public toilets include name, latitude and longitude, address, and administrative unit code. After data pre-processing such as coordinate conversion, data cleaning, and cross-checking, one hundred and sixty-five POI data of public toilets in 2008 and one thousand six hundred and fifty-five POI data in 2018 were obtained. Regarding resource balance measurement, the data of population and area at the scale of street and community level administrative units were obtained from the social statistical yearbook. For the dependent public toilets, the POI address information contains a large building as the basis, combined with the time of data acquisition and the existing state of the survey site, eliminating some survey sites, due to bankruptcy, decoration, and other factors, the final list of shopping malls in the city where survey data can be obtained. For independent public toilets, considering the amount of data and the distribution range, we selected 10 parks with the highest concentration of independent public toilets as the actual survey sites based on the regional aggregation. Moreover, the study area is divided into different grids based on road and community information. The survey data included field visits to thirty public toilets attached to the interior of large buildings, ten independent public toilets in parks, and seventy-six road grid units with e-map public toilet facilities. The POI public toilet data were corrected quantitatively based on survey data and types of dependent public toilets and independent public toilets and the revised public toilet facility data were constructed. The three types of data together constitute a collection of data sources for the service evaluation system of public toilet facilities, which provides more accurate data support for the service capacity evaluation system of public toilet facilities.
Based on the modified fusion data set of facility service capacity evaluation, this study evaluates the service capacity of public toilet facilities from the resource allocation balance measure and service spatial pattern measure. Finally, the evaluation system of service capacity of public toilet facilities was constructed (Table 1). In terms of data quality, we used the number of stars to indicate the quality of data. More stars mean better data quality. Specifically, field survey data have high accuracy, statistical data have good accuracy, and POI data have certain errors due to the large amount of data. The fusion of multi-source data can ensure better quality. When there is less variety of data, the data quality will be affected. The resource equilibrium measure uses kernel density estimation, the number of public toilets per ten thousand people, and public toilet density index indicators to visualize the equilibrium of public toilets in the main urban area of Shenyang from 2008 to 2018, and assesses it from three index layers from space, population, and spatial-population. The spatial pattern of service measurement was analyzed by standard deviation ellipse and buffer analysis methods. According to the survey on the purpose of going out for the traveling crowd, going to work, going home, dining and leisure become the main purpose of traveling. Based on the purpose of travel, we identified the types of driving factors for the distribution of public toilets [40]. The geodetector model was used to quantify the driving forces of seven types of factors on the spatial pattern distribution of public toilets. The factors include scenic spots, transportation facilities, shopping service, catering service, business residence, science and education, and accommodation services.

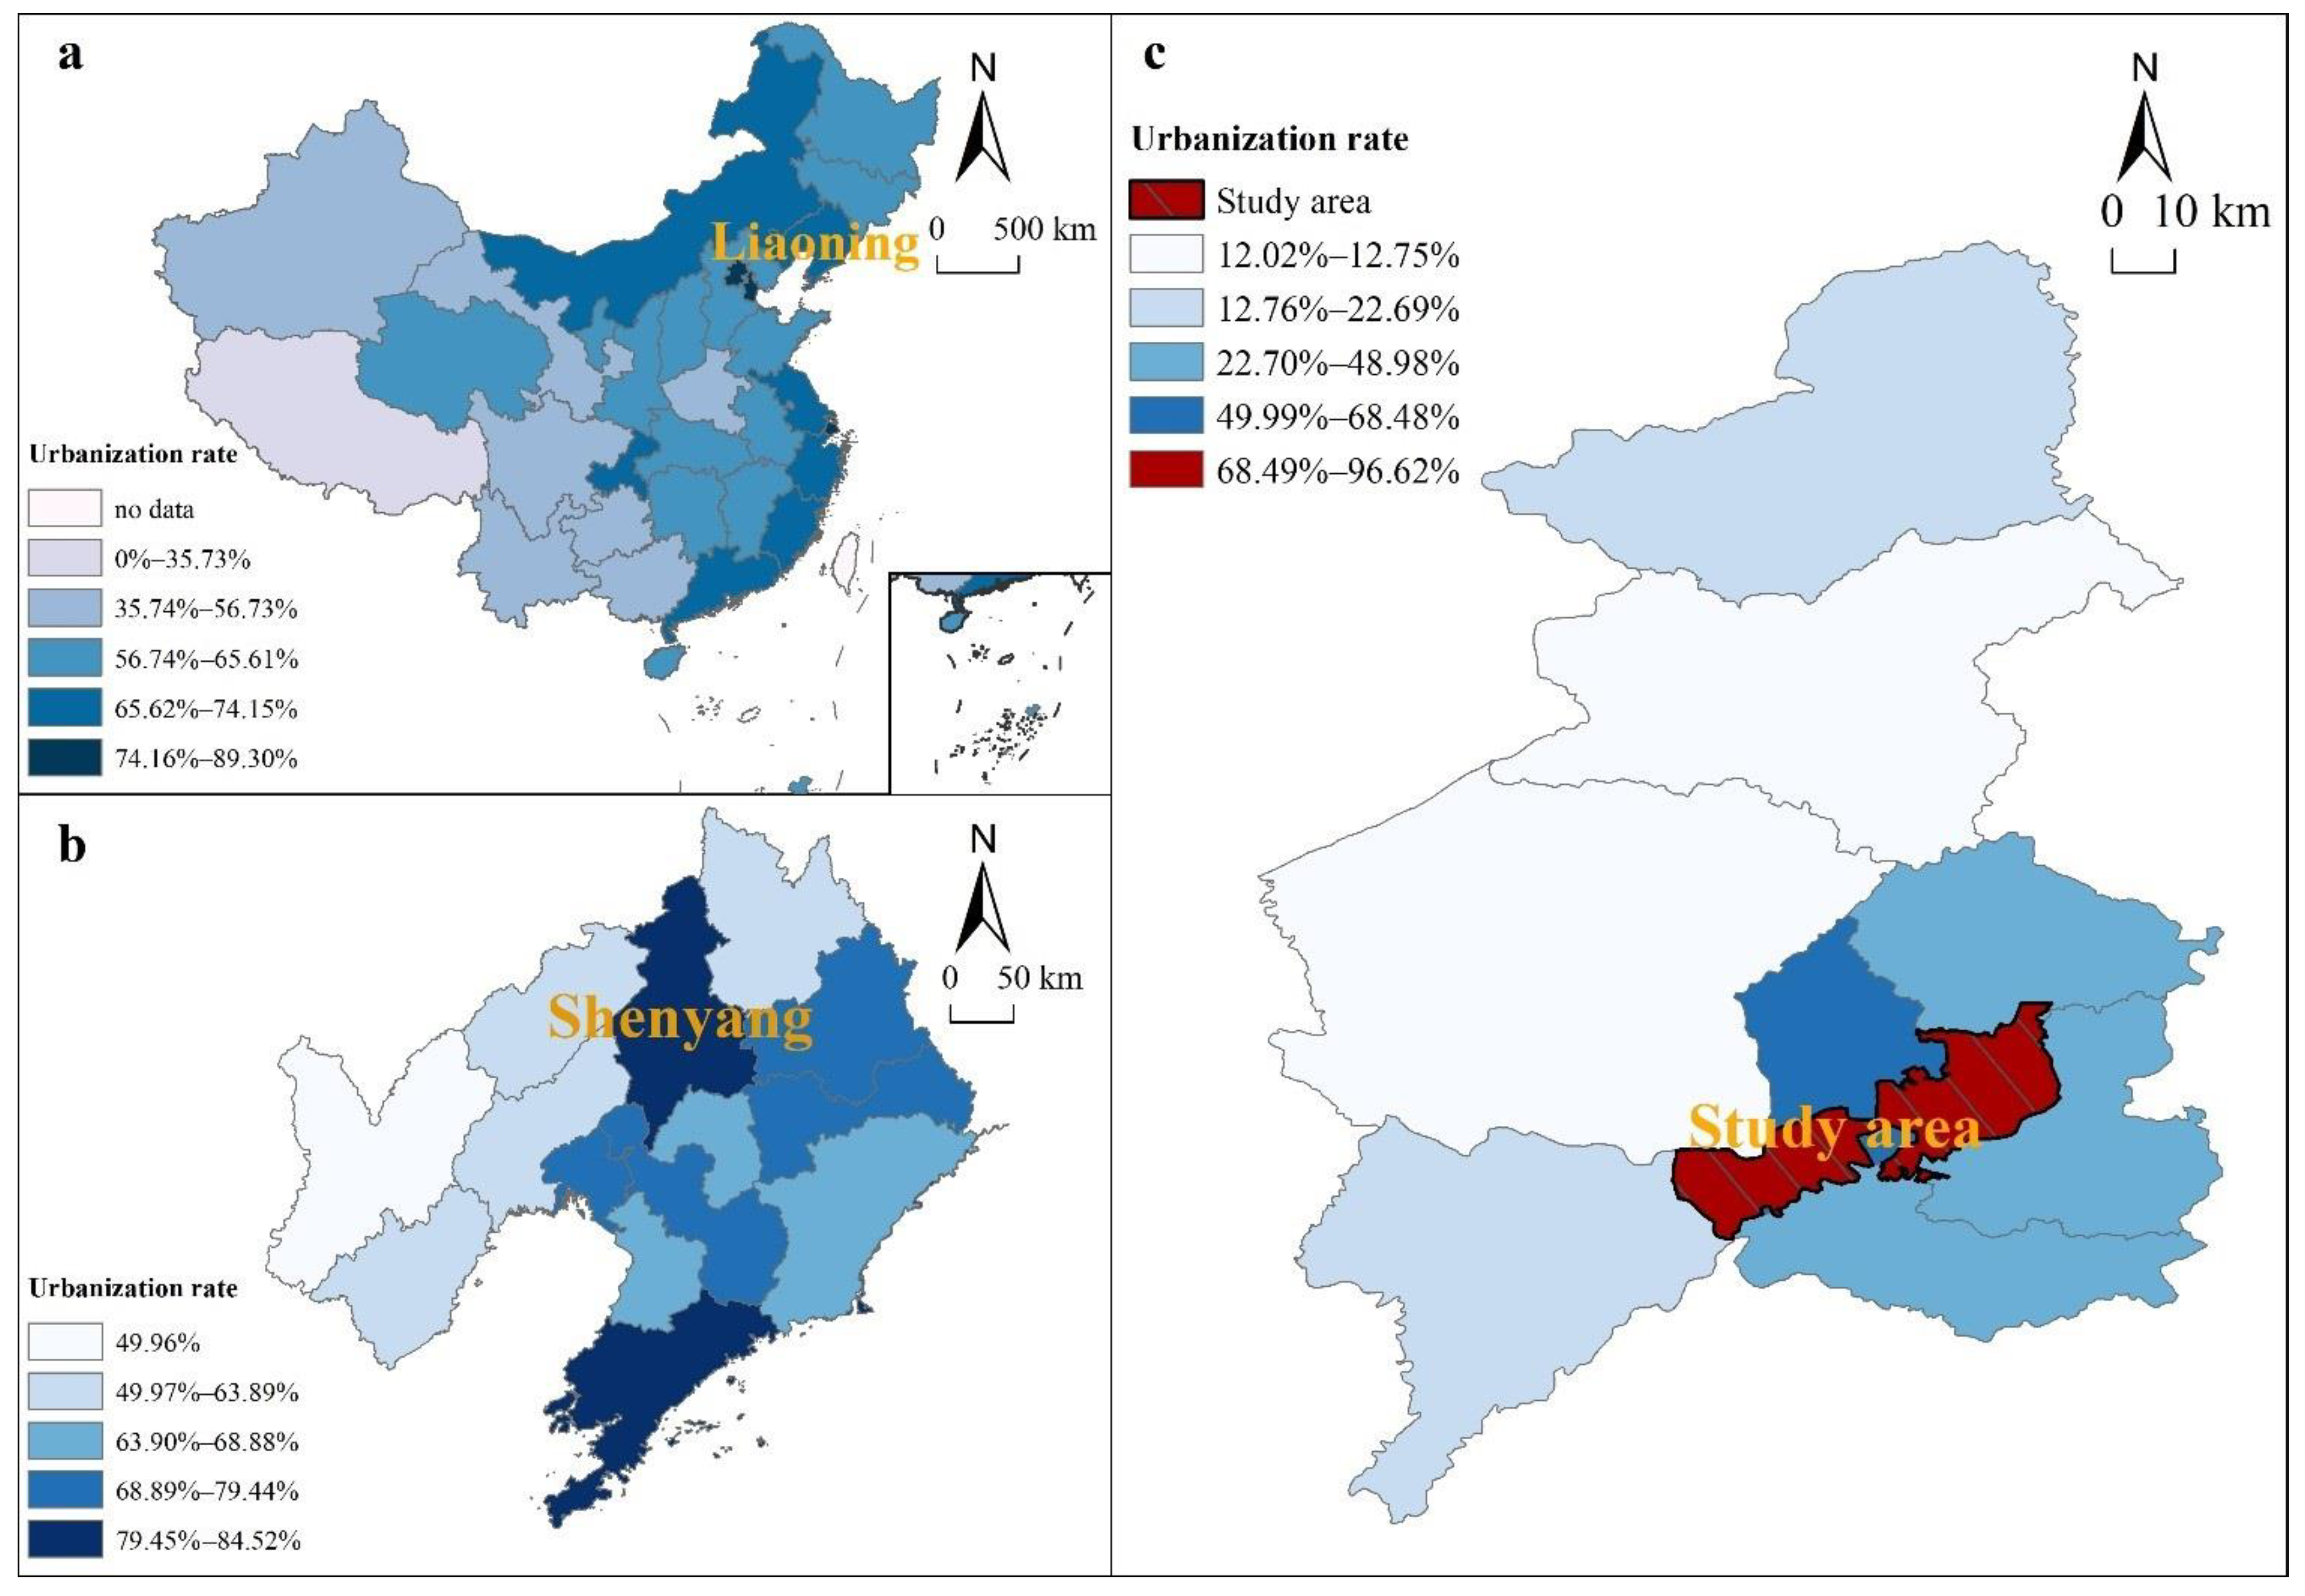
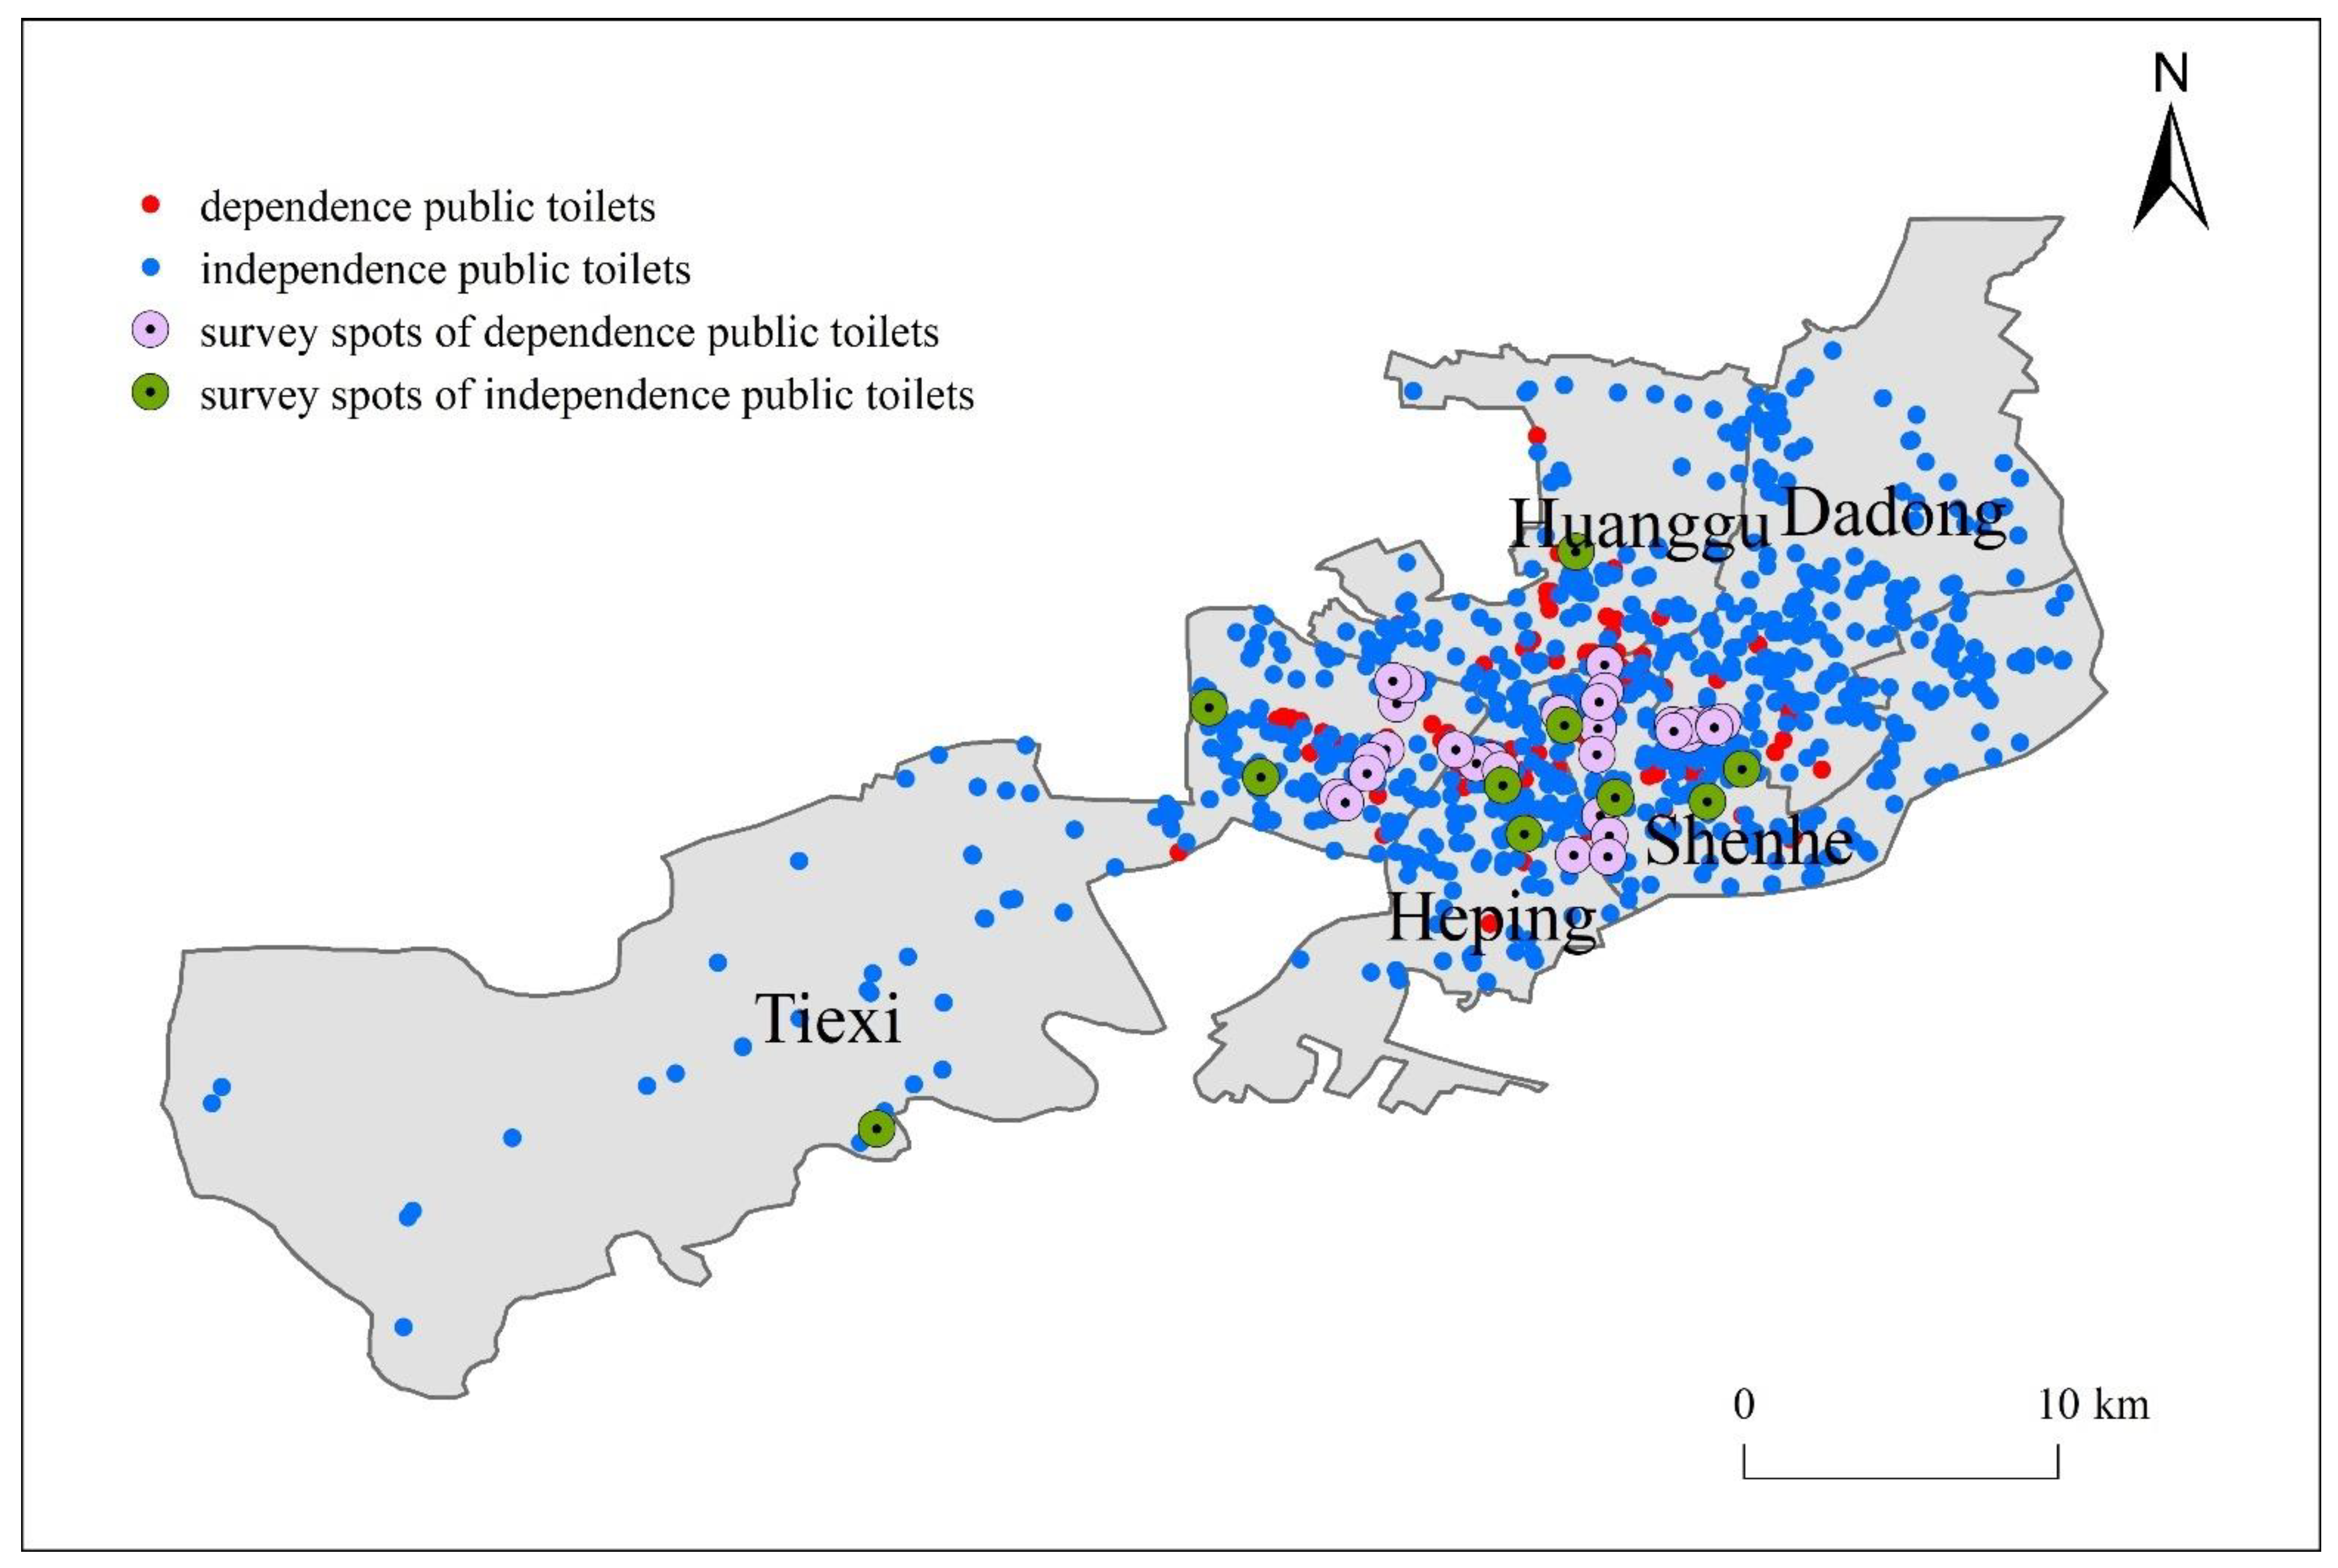
2.2. Overview of the Study Area

Shenyang, an industrialized city with a long history in China, is the capital city of Liaoning Province, with an urbanization rate of 84.52%. The study was conducted in five districts in Shenyang, including: Heping district, Shenhe district, Huanggu district, Dadong district, and Tiexi district (excluding Shenyang Economic and Technological Development Zone), with a total area of 618 square kilometers (Figure 1), to examine the capacity and level of public health infrastructure services in the urbanization process.

2.3. Research Methods

2.3.1. Resource Balance Measure

Measurement of Spatial Balance

Spatial aggregation and dispersion of public facilities can express the equilibrium of spatial distribution at a certain level. In this paper, kernel density estimation is used to assess the spatial equilibrium of public restrooms. Kernel density estimation is often used to reflect the degree of concentration of point elements in spatial distribution, and the degree of aggregation of spatial point elements is estimated with the help of a regular moving sample square [41,42]. The calculation formula is as follows.
f ( x ) = 1 n h i = 1 n k ( x c i h )  
where f(x) is the kernel density estimation function at spatial location x, h is the distance decay threshold, k is the spatial weight function, and n is the number of points whose distance from location x is less than or equal to h.

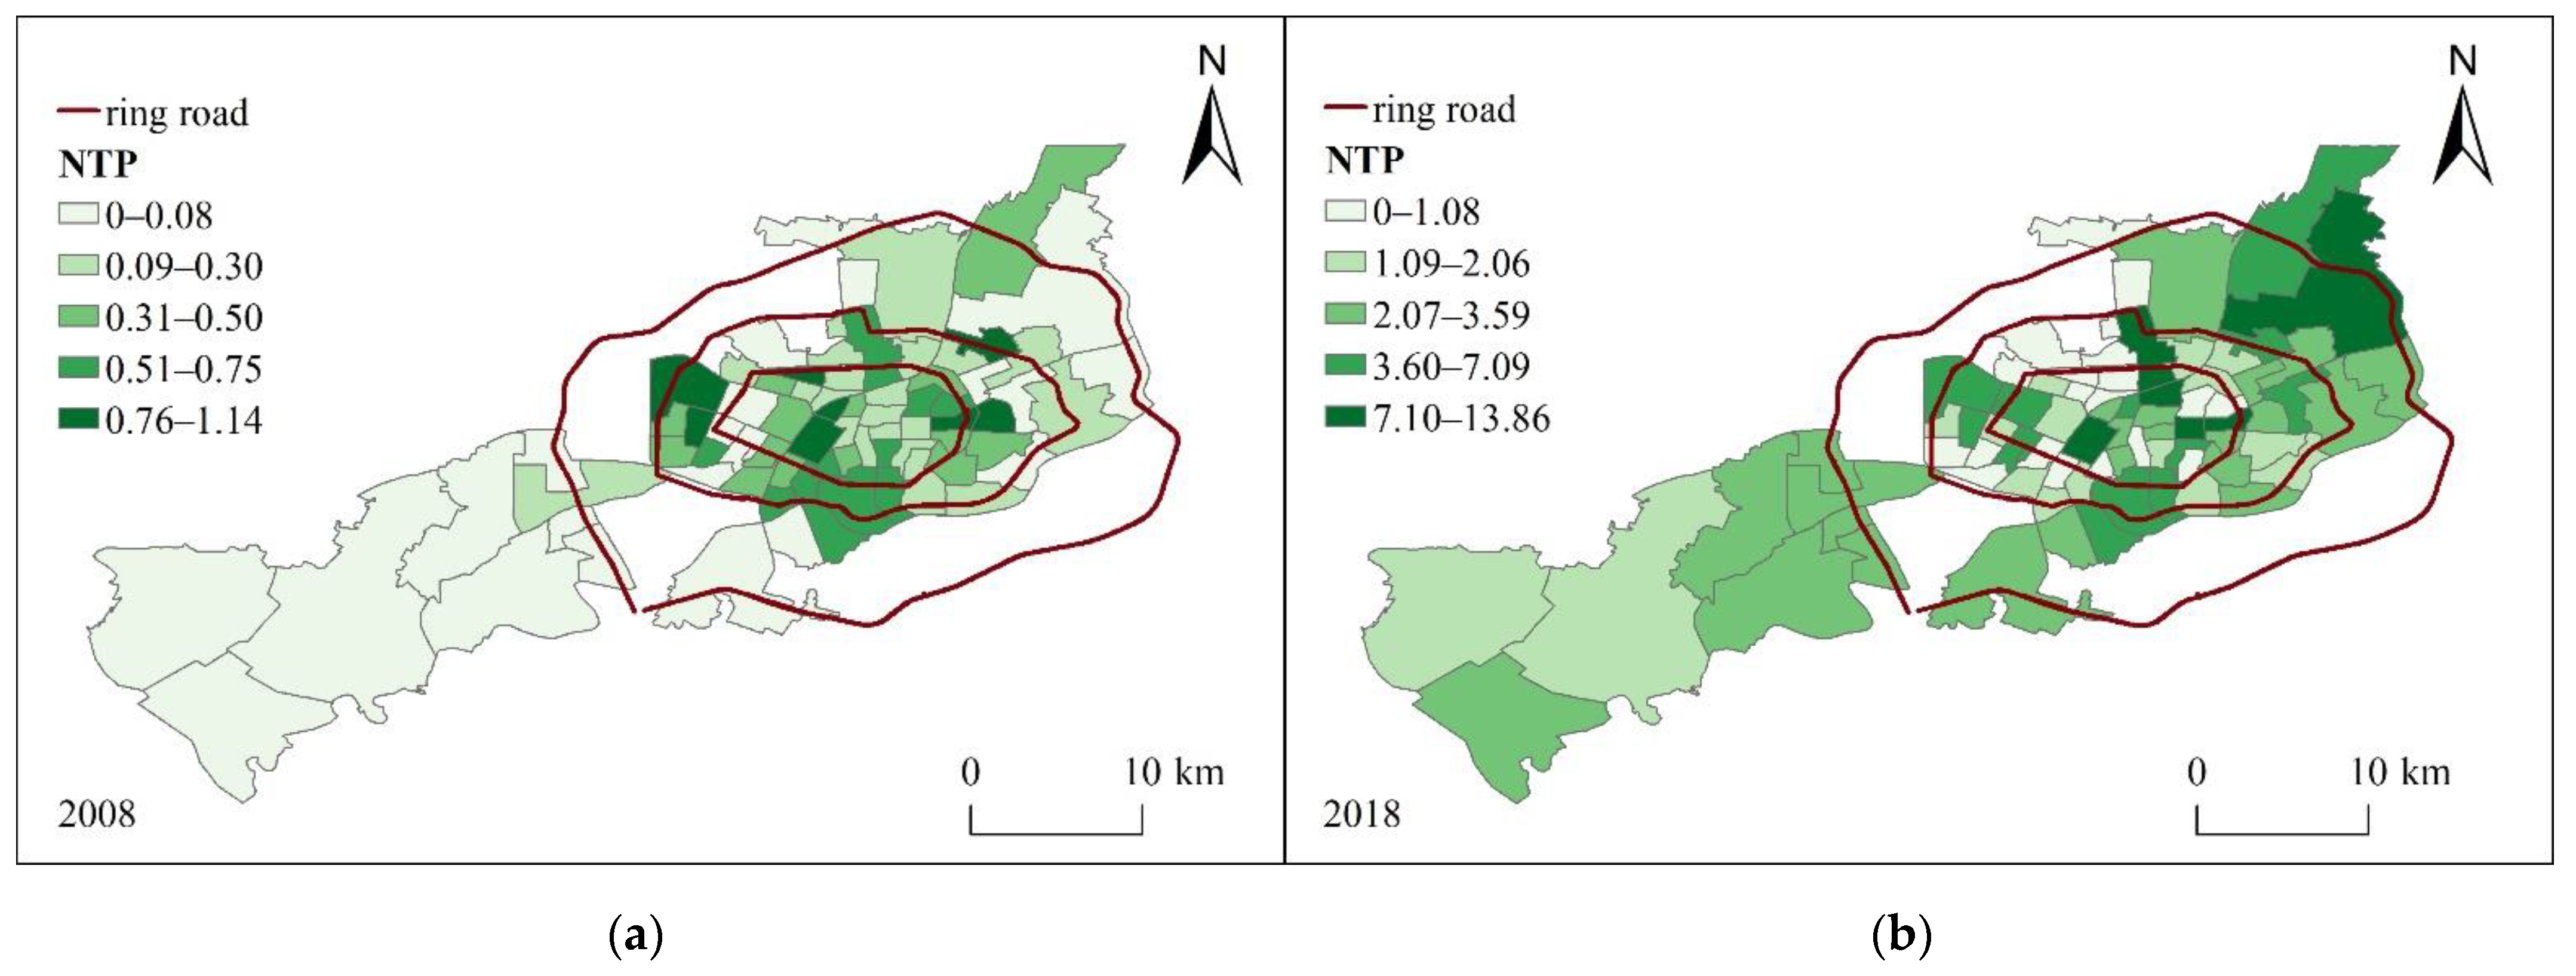
Measurement of Population Balance

The visual representation of the parity of public facility services per resident between regions can reveal the distribution pattern of parity at a certain level. In this study, the accessibility of public toilets was assessed by the number of toilets per 10,000 people (NTP). The calculation formula is as follows.
N T P i = T i P i
where N T P i denotes the number of public toilets per ten thousand people in the ith study unit, T i denotes the number of public toilets within the ith study unit, P i denotes the number of people within the ith study unit. i = 1, 2, 3, …, n, and n is the number of study units.

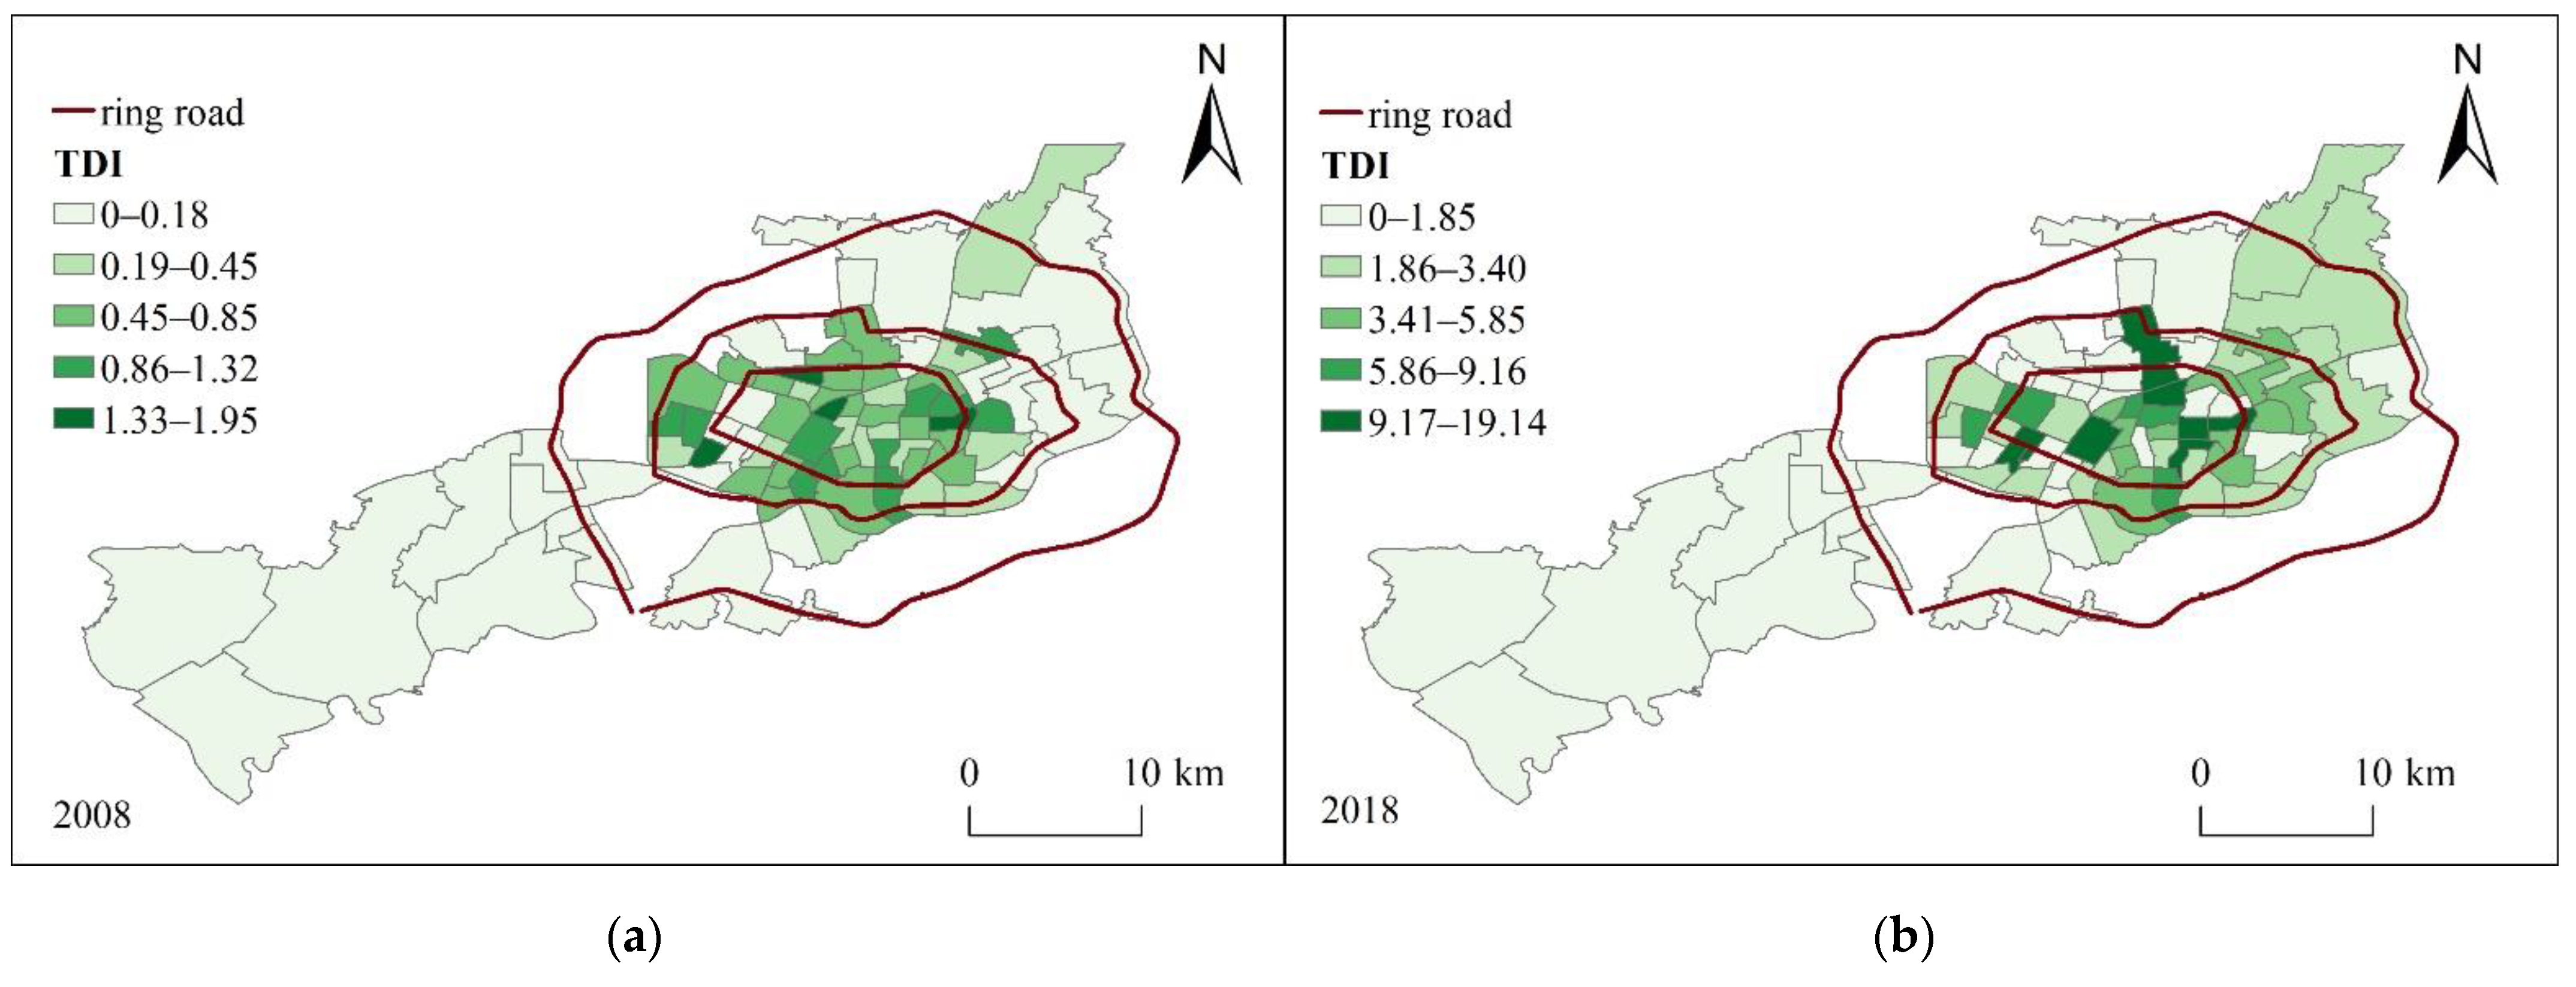
Measurement of Spatial-Population Balance

The balance of the spatial distribution of public toilets is mainly measured by the density index. The sanitation resource density index is used as the basis for constructing the public facility resource density index to reflect the balanced allocation of public resources in terms of population and area [43]. The spatial allocation of public facilities needs to balance the spatial and population. The public resource density index is constructed to measure the public toilet density index (TDI). The calculation formula is as follows.
T D I i = N i T P i · A i
where T D I i is the density index of public toilets in the ith study unit, N i is the number of public toilets within the ith study unit, T P i is the population of the ith study unit (unit: thousand people), and A i is the area of study unit i (unit: kilometer).

2.3.2. Spatial Pattern Measurement of Public Toilet Services

The spatial pattern of service orientation characteristics of public toilets is analyzed by the standard deviation ellipse. It is used to analyze the distribution directional characteristics of spatially discrete data sets. The ellipse’s major axis represents the main trend direction of point elements in space, and the minor axis represents the secondary trend direction of point elements. The difference between the major and minor axis indicates the difference in the distribution direction of point elements. The larger the difference, the more obvious directionality of the spatial pattern of public toilet service. The calculation formula is as follows.
S D E x = i = 1 n ( x i X ¯ ) 2 n
S D E y = i = 1 n ( y i Y ¯ ) 2 n
where xi and yi are the coordinates of element i, respectively; X ¯ and Y ¯ denote the mean centers of the elements, and n is the total number of elements.
The service area coverage characteristics of the service space pattern of public toilets are analyzed by the buffer zone analysis method. The buffer zone analysis takes point, line, and surface elements as objects, and buffer zone polygons of a certain range are built outward. In this paper, the public toilet point data is used as the center of the circle, and the 500 m distance is used as the service radius to construct a circular buffer zone. The spatial pattern range distribution of public toilet service is constructed by overlaying different circular buffer zones.
The factors influencing the spatial heterogeneity of the spatial service pattern of public toilets are mainly studied by the method of geodetector. It is a method to reveal the driving forces behind the spatially stratified heterogeneity among elements by detecting them. It mainly includes four functional modules: factor detector, risk detector, interaction detector, and ecological detector. It has advantages such as immunity to co-linearity of independent variables and few assumption conditions [44]. The method is mainly applied to the study of influence factor identification and the mechanism of action of spatial differentiation [45]. The influencing factors of the geographic detector method often use categorical variables, and the explanatory power of the independent variable on the dependent variable is measured by calculating the q-value. The calculation formula is as follows.
q = 1 h = 1 L N h σ h 2 N σ 2 = 1 S S W S S T
S S W = h = 1 L N h σ h 2 ,   S S T = N σ 2
where h is the layering of variable Y or factor and the range of h is [1, L]; Nh and N are the layer h and the number of units in the whole area; σ h 2 and σ h 2 are the layer h and variance of the Y vale for the entire region, respectively. SSW (within sum of squares) is the sum of the variances within the stratum; SST (total sum squares) is the total variance of the entire region. The range of q is [0, 1]. The larger the value of q, the greater the impact of the factor on the affected index. The dominant factor in the formation of the spatial pattern of public toilet services is discerned according to the magnitude of q. The number of public toilets in the formula is a value modified for POI data based on a field survey, to ensure the accuracy of the study.

2.3.3. Research Limitations

During the development of POI data, the data acquisition methods are more scientific, the larger the amount of data, the richer the information contained. However, the volume of POI data acquired in the early stage is small and the attribute information is missing. These issues limit the comparison of POI data between different years in the study. In addition, the field survey data and POI data are mainly quantitative information, there are certain deficiencies in the service quality of public toilets. It also limits the expansion of attribute information.

3. Results

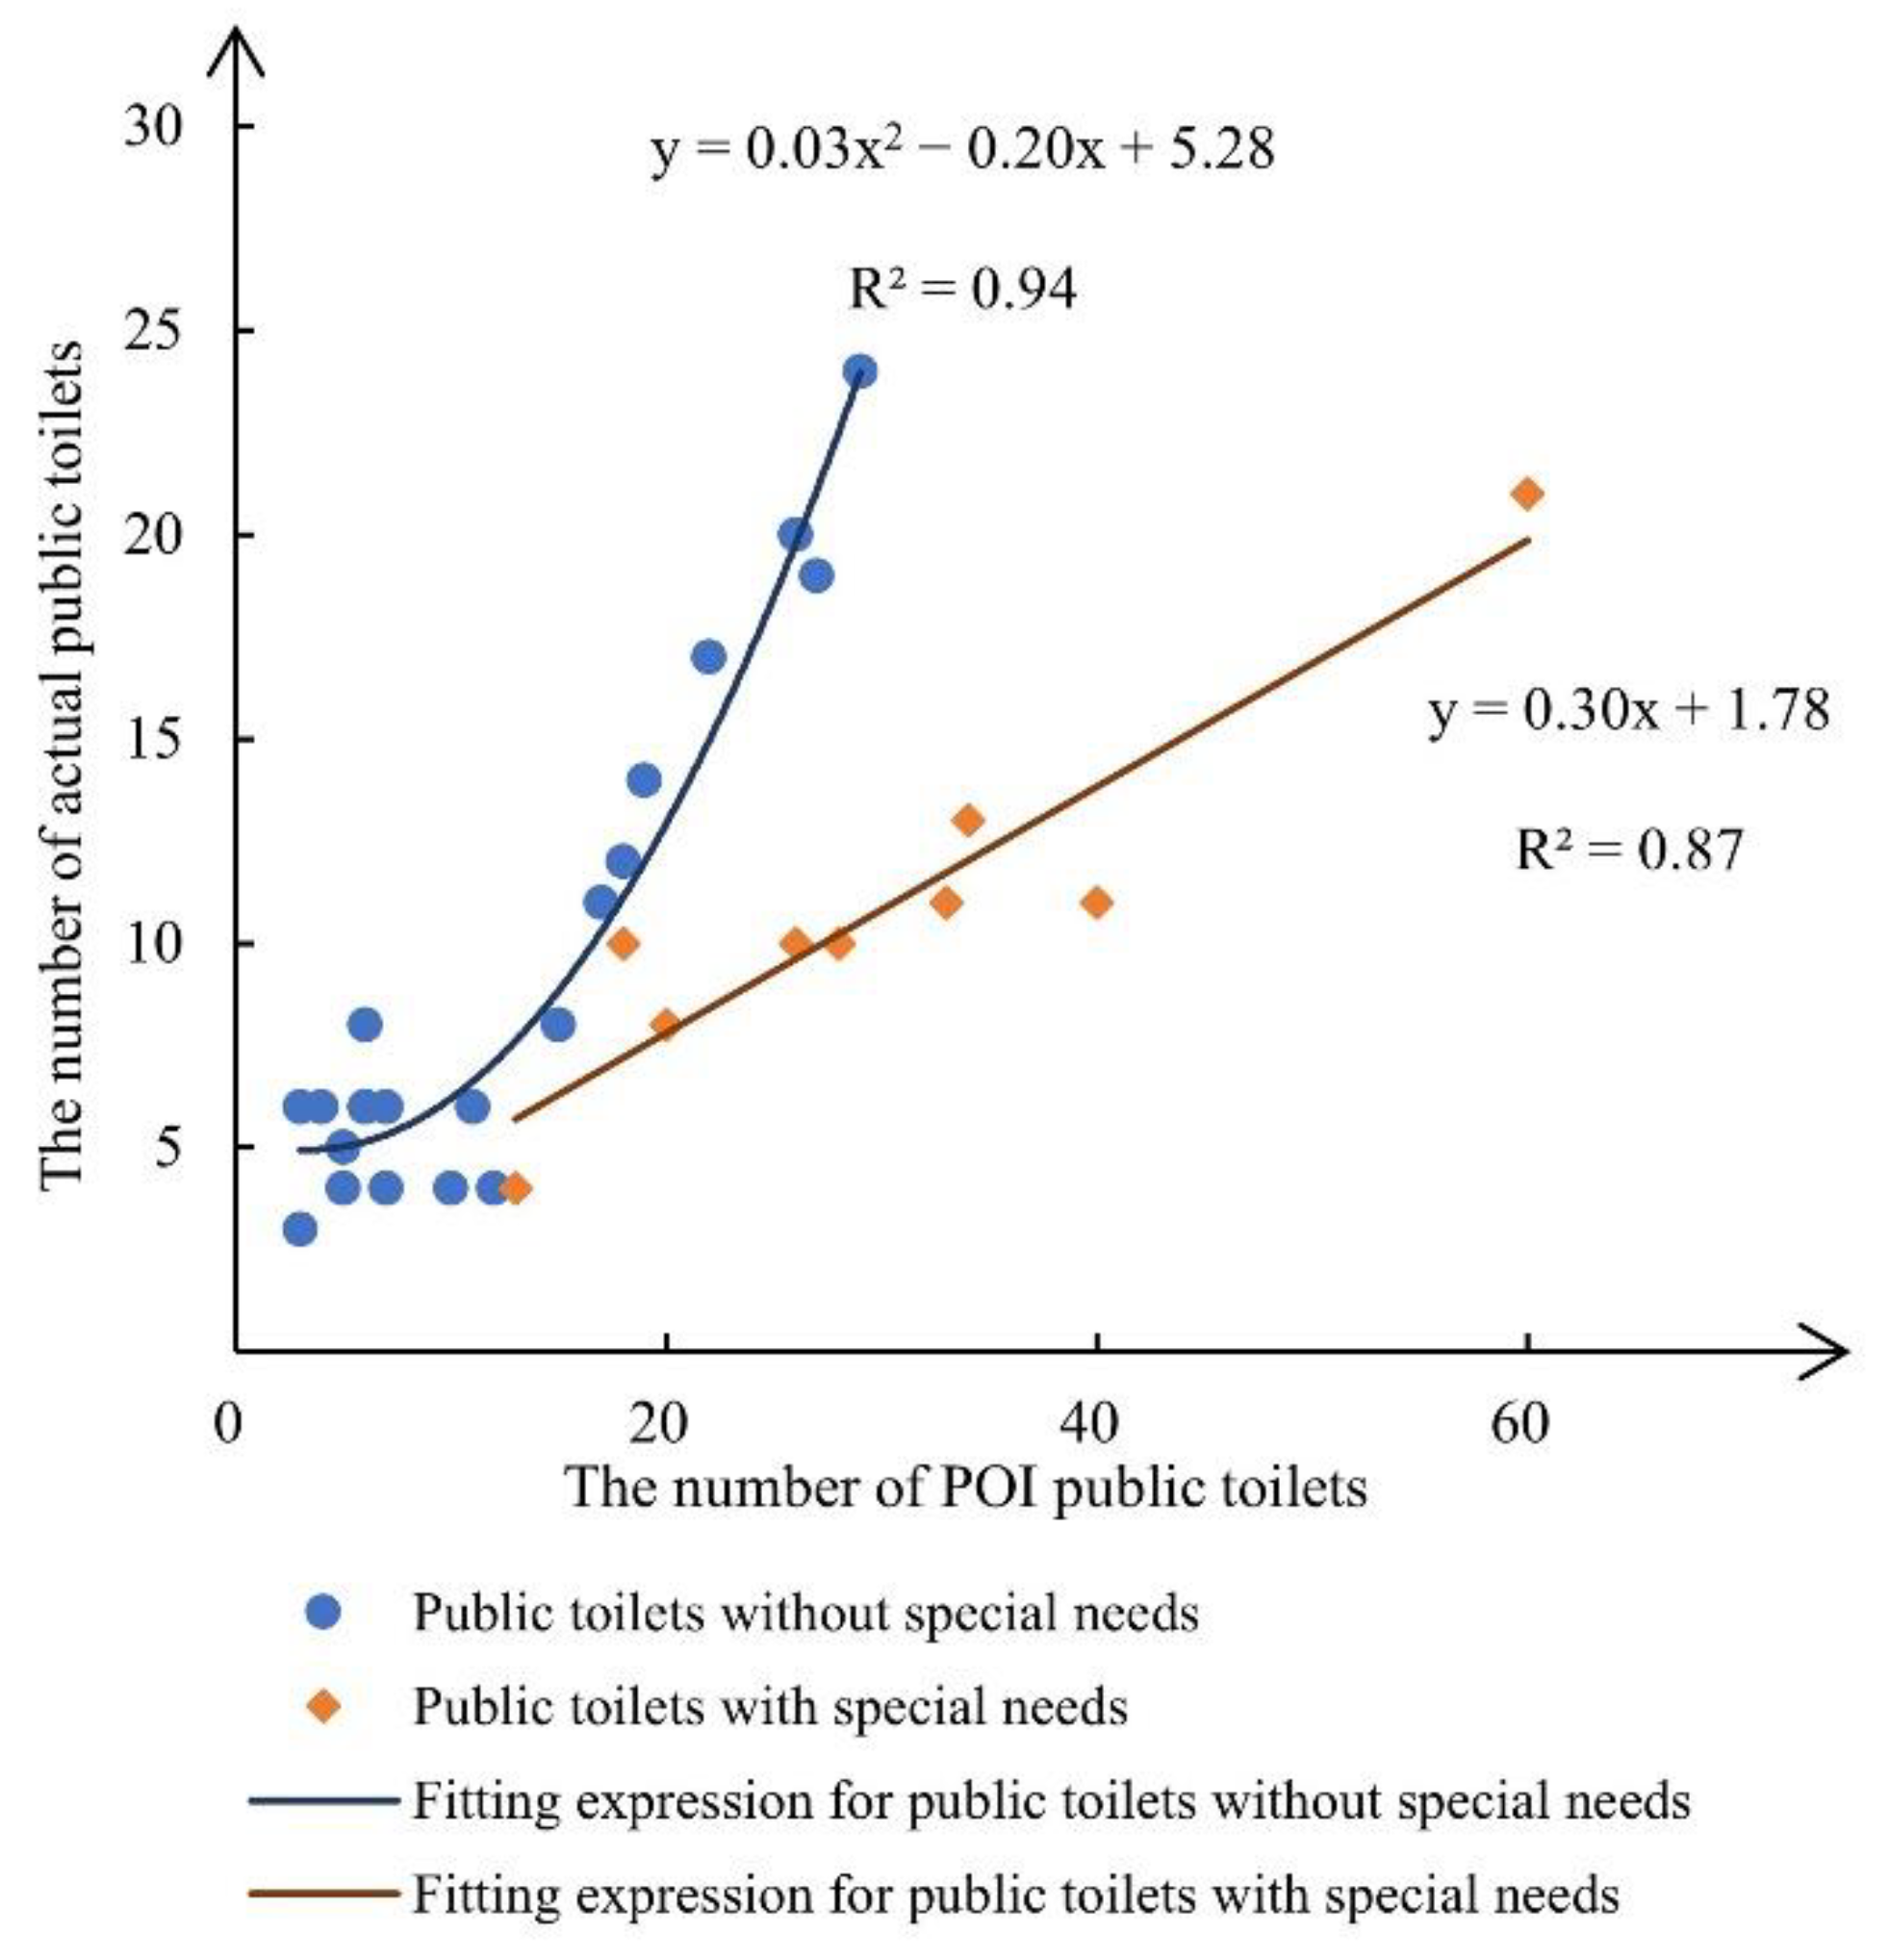
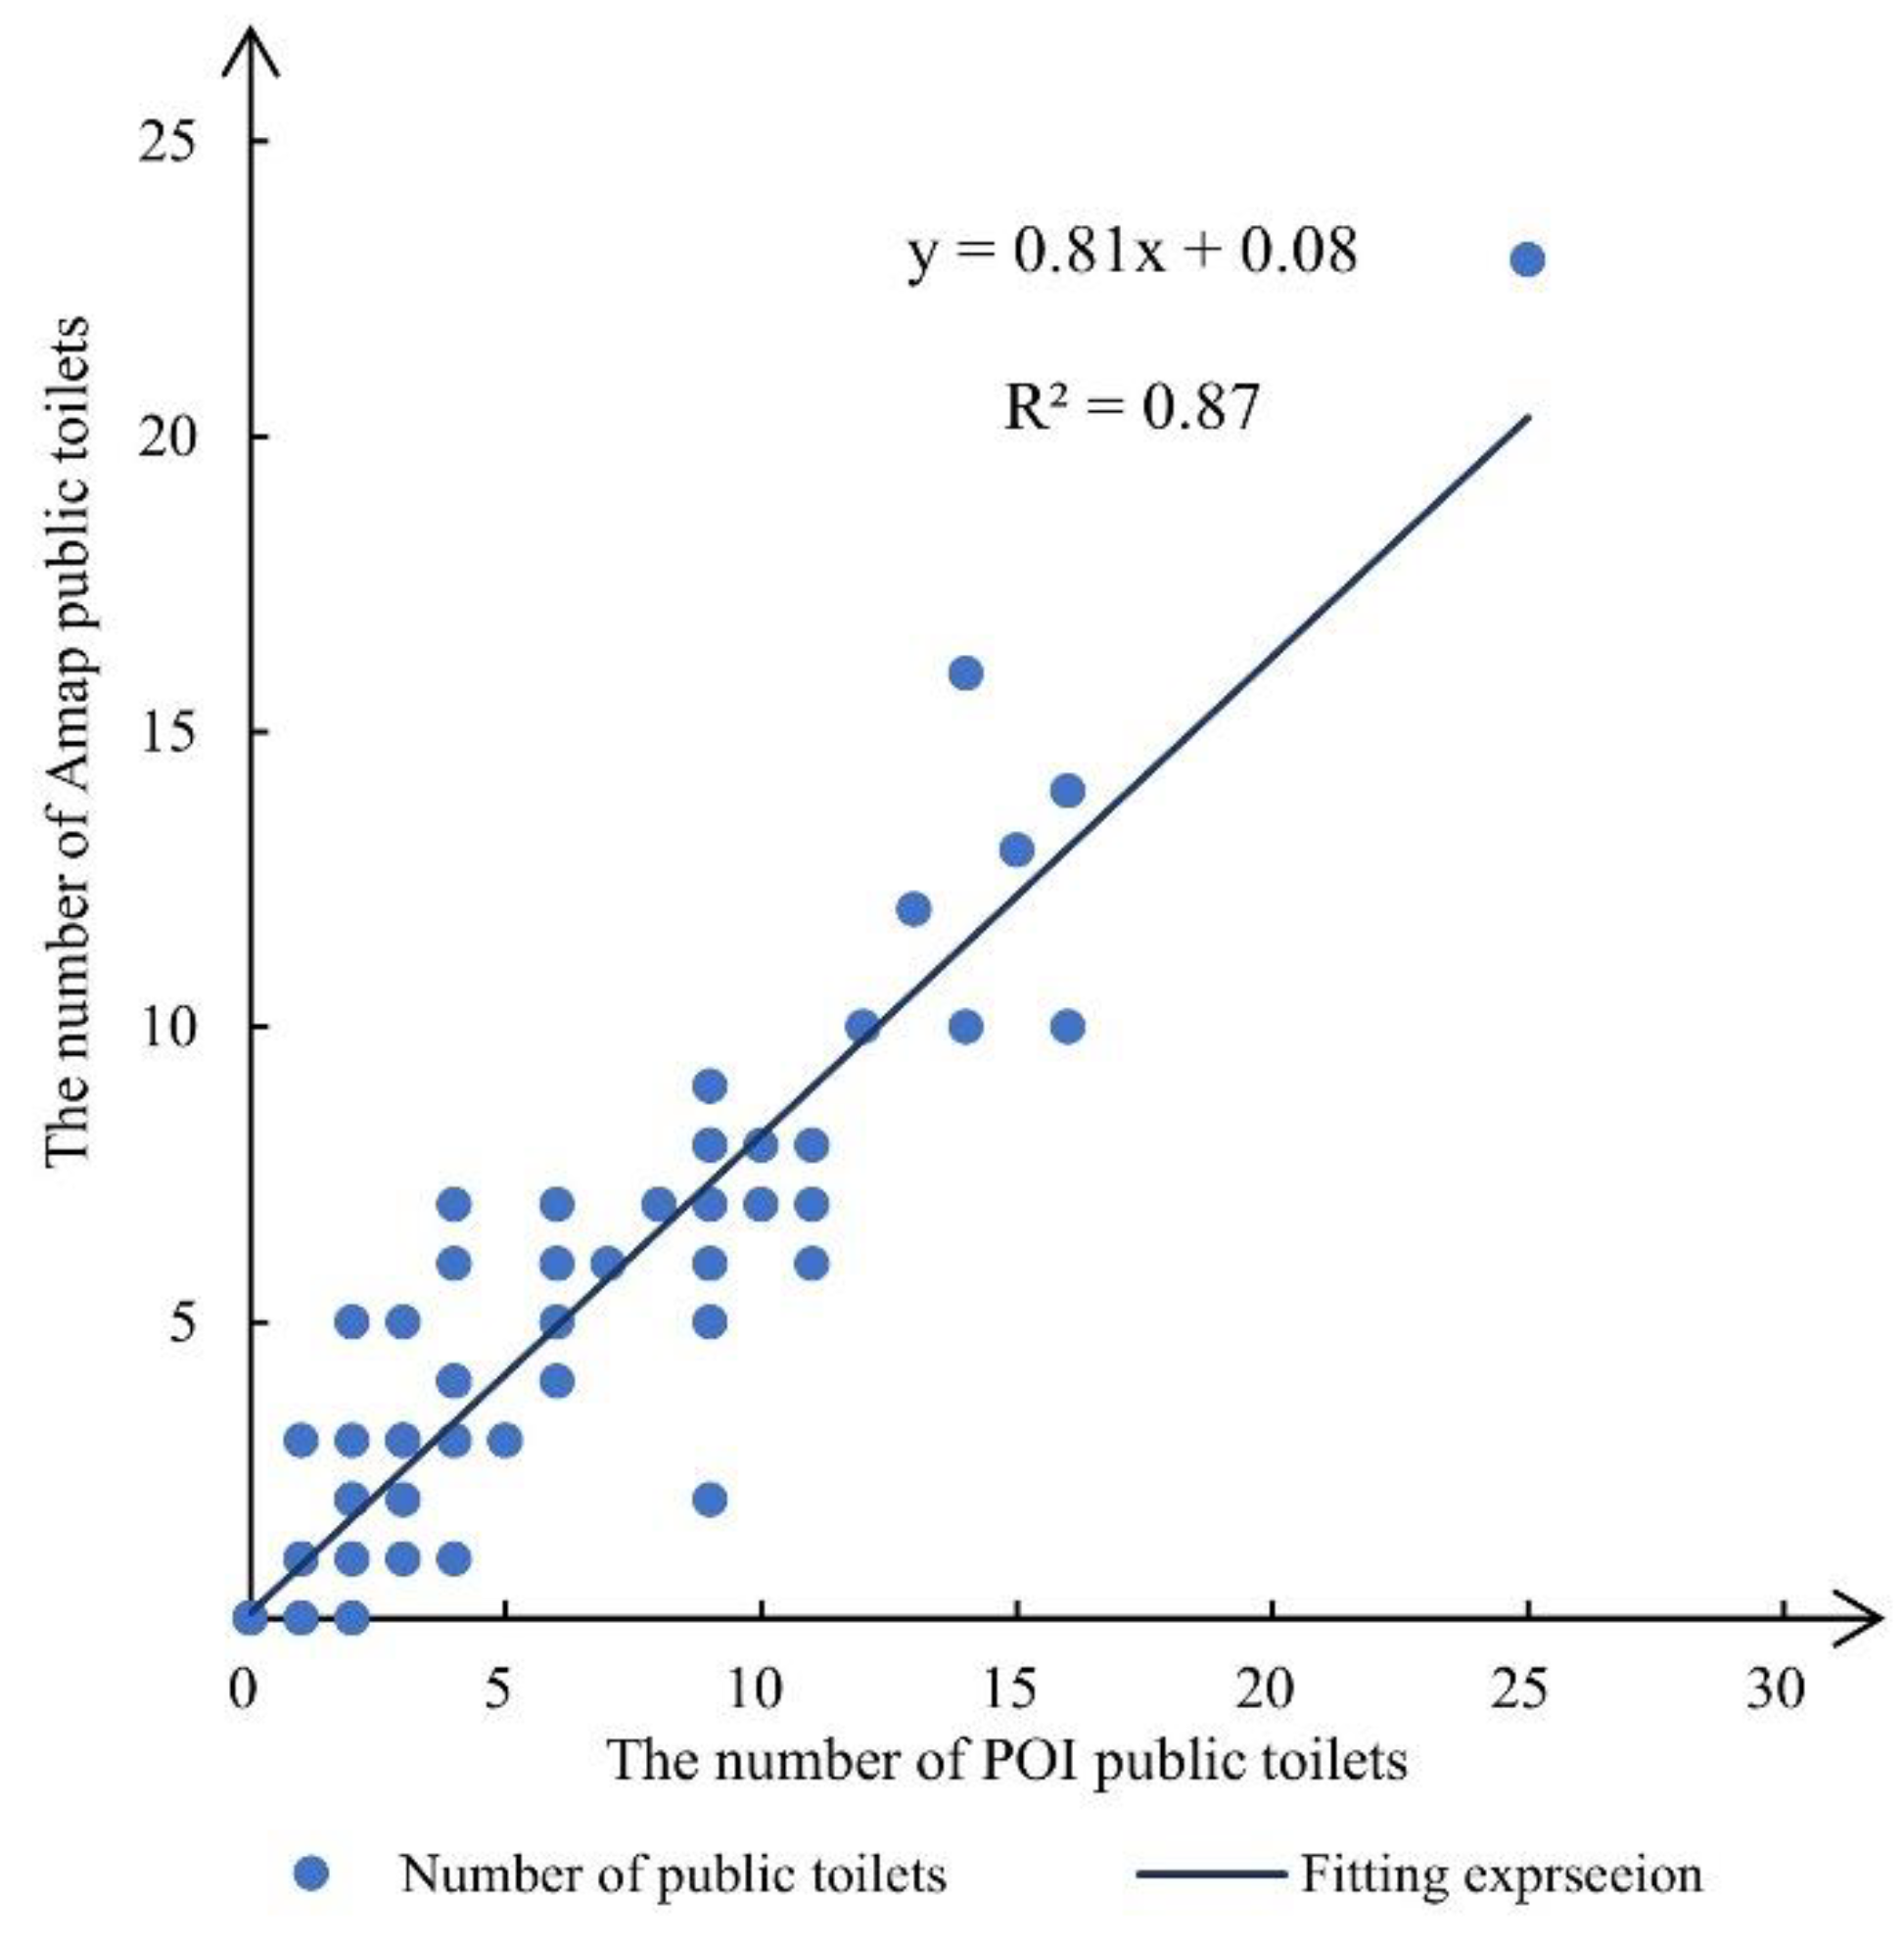
3.1. Data Measurement and Amendment

POI data have the problem of overlapping classification and repeated counting in terms of the number of public toilets, resulting in large errors in POI data records in some areas. In this paper, the public toilets inside large buildings such as shopping malls, hotels and motels, fast food restaurants, railway stations, and hospitals are classified as dependent public toilets. Other public toilets in single buildings on both sides of green parks, schools, scenic spots, and roads are classified as independent public toilets. For the quantitative correction of POI public toilet data, this paper will be conducted separately from dependent public toilets and independent public toilets. Of which thirty dependent public toilets inside large buildings and ten independent public toilets inside parks are selected for investigation (Figure 2). Due to the small amount of POI data information in 2008, this paper only modified the POI public toilet data in 2018. Considering the spatial autocorrelation of the data, the Global Moran’s I index was used for validation. The Moran’s I index is an important indicator of spatial autocorrelation [46]. The Moran’s I values of POI data for public toilets in 2008 and 2018 were 0.013 and −0.008. There was no significant spatial autocorrelation between the data.
There is a significant error in the number of public toilets counted. A counting unit of public toilets should contain two essential components: men’s toilets and women’s toilets. Some of them include special toilets used by the disabled, maternal, and infants, and all three constitute a quantity unit of public toilets. The point information of dependent public toilets in the POI database is men’s, women’s, maternal, and infant, and the accessible toilets separately. Therefore, the quantity information of subsidiary public toilets in the POI data needs to be modified to ensure the accuracy of the balance analysis. Among one thousand six hundred and fifty-five POI data, there are seven hundred and ninety-four dependent public toilets, covering six hundred and seventy-five public toilets in shopping malls and railway stations and one hundred and nineteen public toilets in hotels and fast-food restaurants. Among them, the number of public toilets in shopping malls and shopping centers is the largest, and the density is the greatest. Therefore, the POI data have a large error. This paper takes six hundred and seventy-five POI-dependent public toilets of shopping malls and railway stations as the basis for address information, excluding samples that could not be investigated in the field due to closure and renovation. The thirty large building samples cover twenty-eight shopping malls and two railway stations. Among them, nine shopping malls and two railway stations did not cover public toilets with special needs, such as maternal and infant rooms and disabled toilets.
A comprehensive field survey was conducted on thirty data samples to obtain information on the number of public toilets, the availability of public toilets for special needs, sanitation and cleaning facilities, and the number of people accommodated. The number of POI data in the thirty samples was used as the independent variable. The number of public toilets from the field survey data was used as the dependent variable for data fitting. The actual number of public toilets for the nine samples of special needs public toilets was slightly larger than one-third of the number of POI public toilets. After the constructed exponential, logarithmic, linear, and polynomial fits, the linear fit gave the best results with a goodness of fit R2 of 0.87 and a range of residuals of [−2.79, 2.83]. The actual number of public toilets in the twenty-one samples without special needs is much larger than one-half of the number of POI public toilets. The constructed fitting expression obtained the best polynomial fit result with a goodness of fit R² of 0.94 and a range of residuals of [−2.84, 2.75] (Figure 3). The number of POI public toilet data was amended by the fitting results of the dependent public toilets, and finally, five hundred and eighty-nine dependent public toilet data were obtained.
The correction of the number of independent public toilets as independent buildings consists of two main parts: the error correction between POI data and electronic map data; the error correction between electronic map and real scene data. The study area is segmented into closed polygonal sample areas by means of an urban main road. In this study, seventy-six polygonal samples were selected after segmentation, and the minimum value of the number of independent public toilets was zero and the maximum value was twenty-five. The road data and POI data were unified in coordinates, and the number of POI points of independent public toilets was compared with the Amap (Figure 4). The range of errors for seventy samples was [−3, 3], and six samples outside the error range had duplicate POI data points, resulting in overlapping points and superimposed quantities.
The parks and independent public toilets on both sides of the road were selected as the investigation points for comparison of an electronic map and real scene data. For example, there are more than two public toilets within 30 m of the parks in the electronic map, but in the field survey, only one is an independent public toilet, and the rest are non-public toilets such as sanitation workers’ restrooms and warehouses. For the two major problems of duplicate POI data acquisition and inaccurate electronic map data, this paper amended the independent public toilet data in the POI public toilet data as follows. For the duplicate acquisition of electronic map data by POI, the nearest distance between eight hundred and sixty-one independent public toilets is computed by the nearest point calculation method. With the longitude and latitude information of the point data as the auxiliary discriminating condition, one hundred and sixty-two points with the nearest distance of zero were screened out and eighty-one repeated POI points were deleted. For the phenomenon of inaccurate information of independent public toilets in electronic maps, this paper has not found the existence of more than two independent public toilets within 30 m during the field survey. Therefore, for the phenomenon of inaccurate acquisition of electronic map information, this paper combines the point data of the nearest neighboring distance less than or equal to 30 m with the address information of POI data and removes forty POI data with the same address information. After data correction, we obtained seven hundred and forty independent public toilet data and retained a total of one thousand three hundred and twenty-nine data from the POI data of public toilets in 2018.

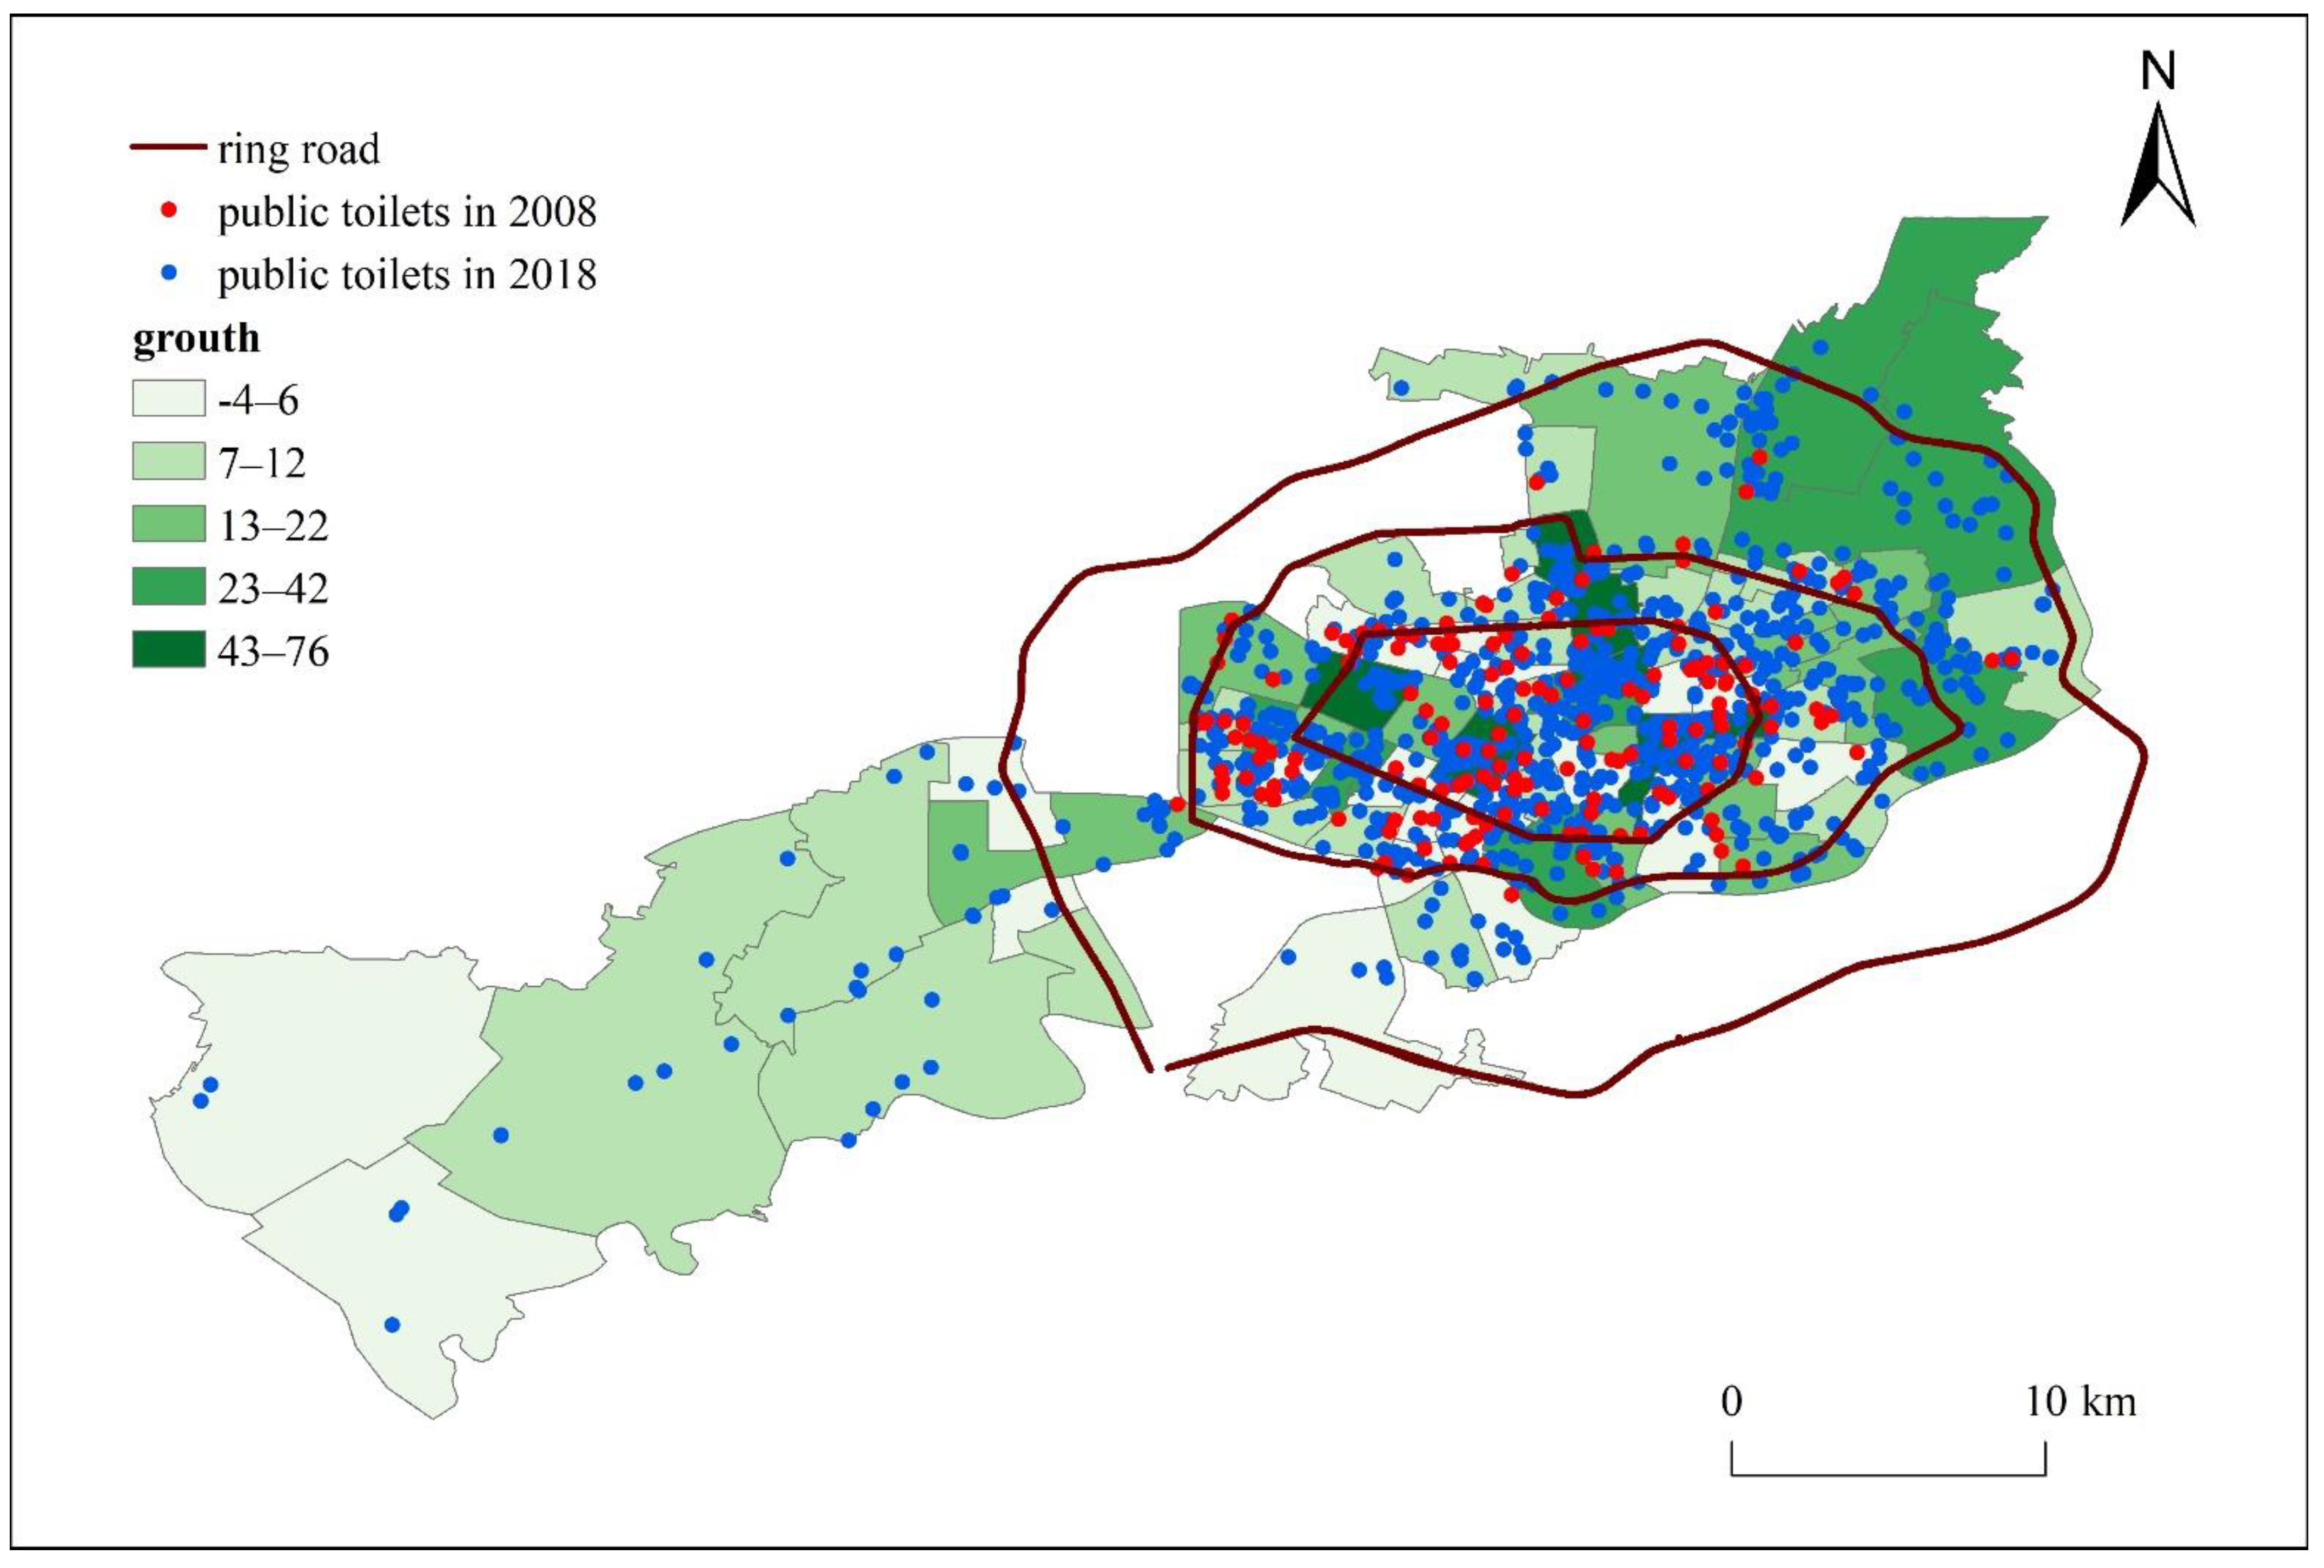
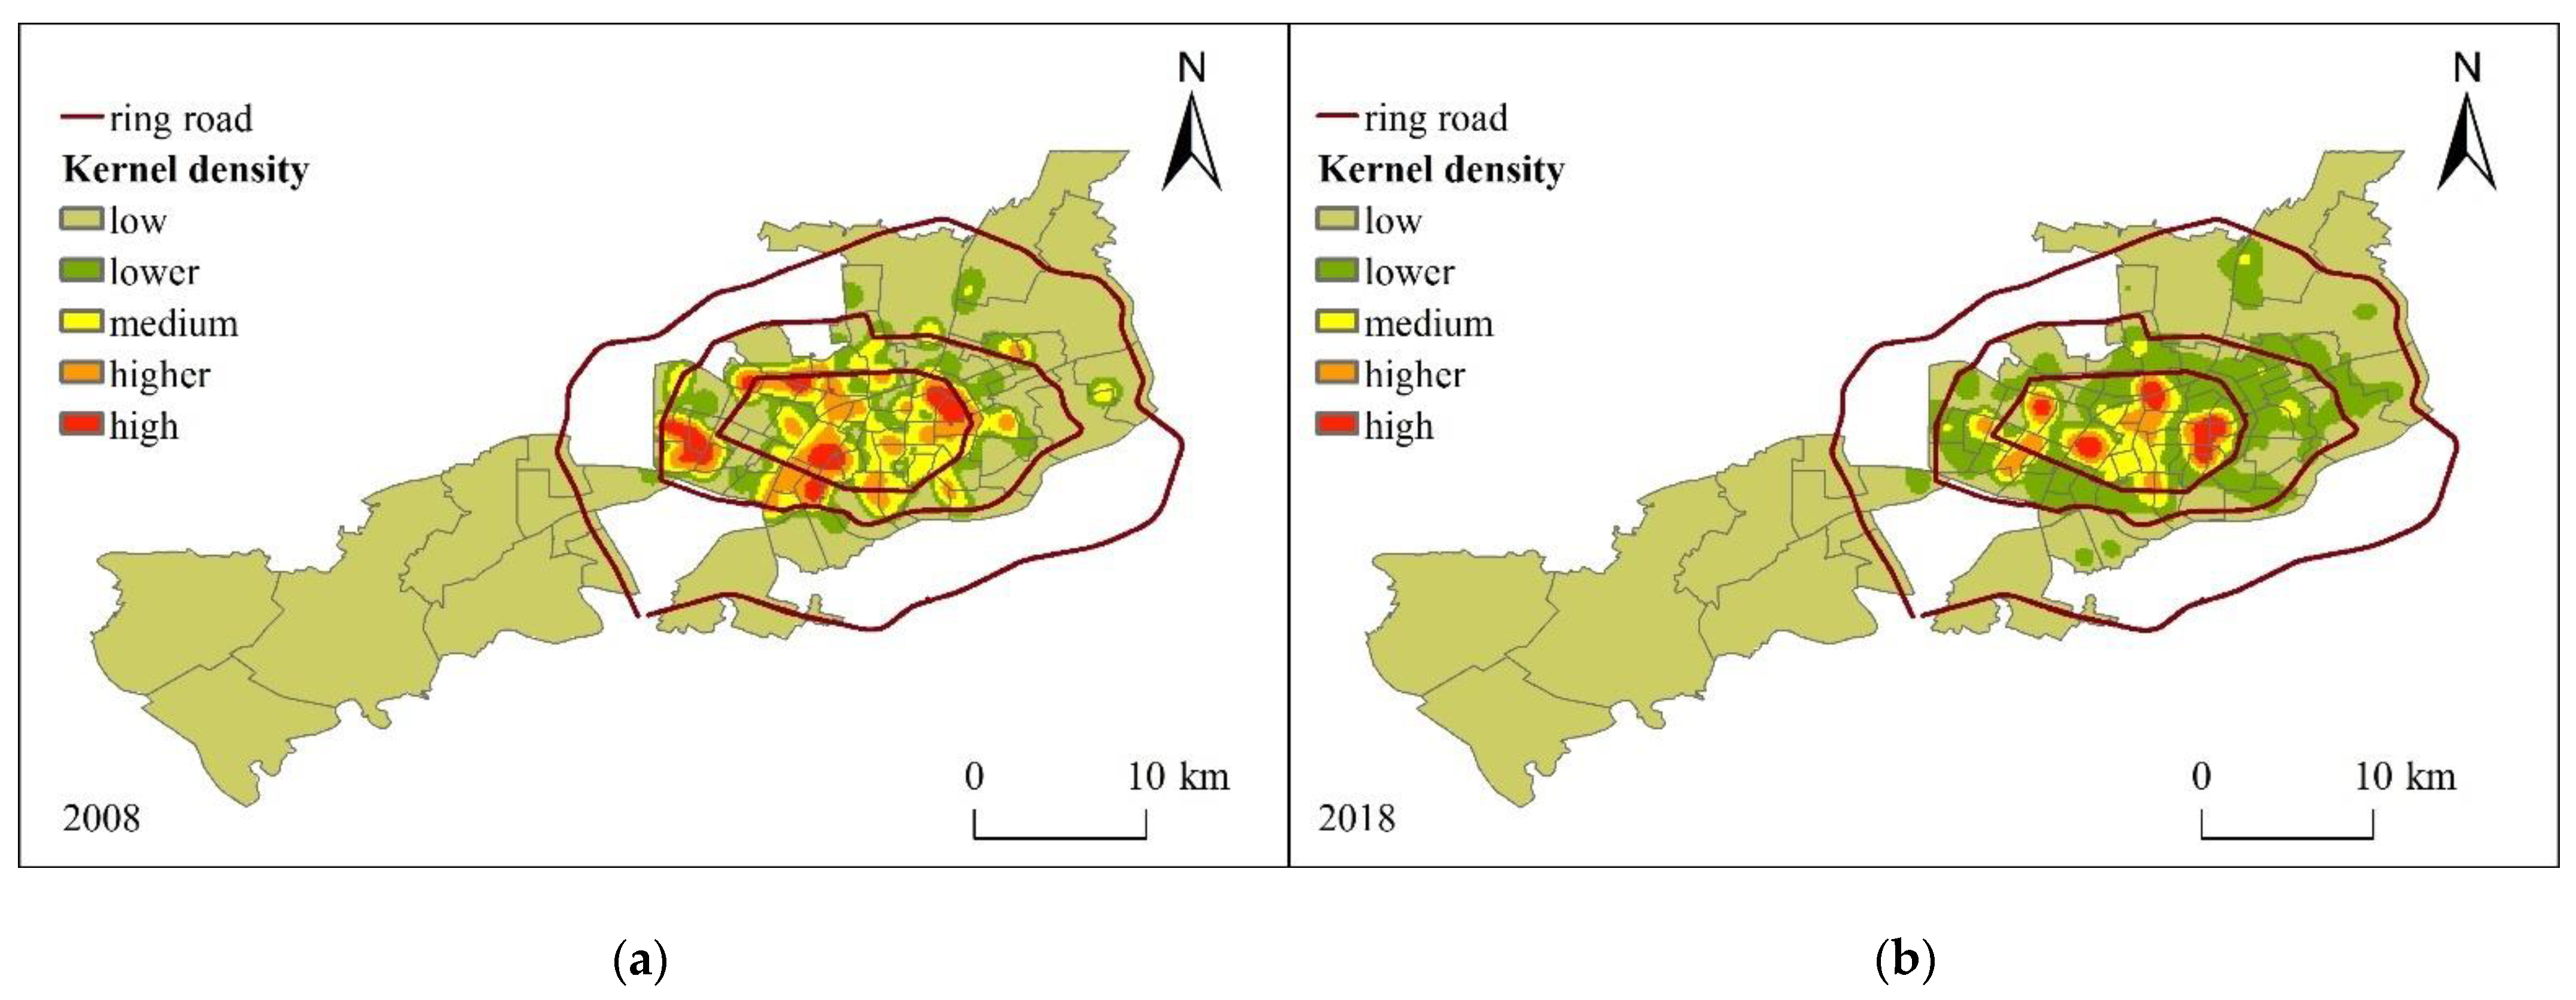
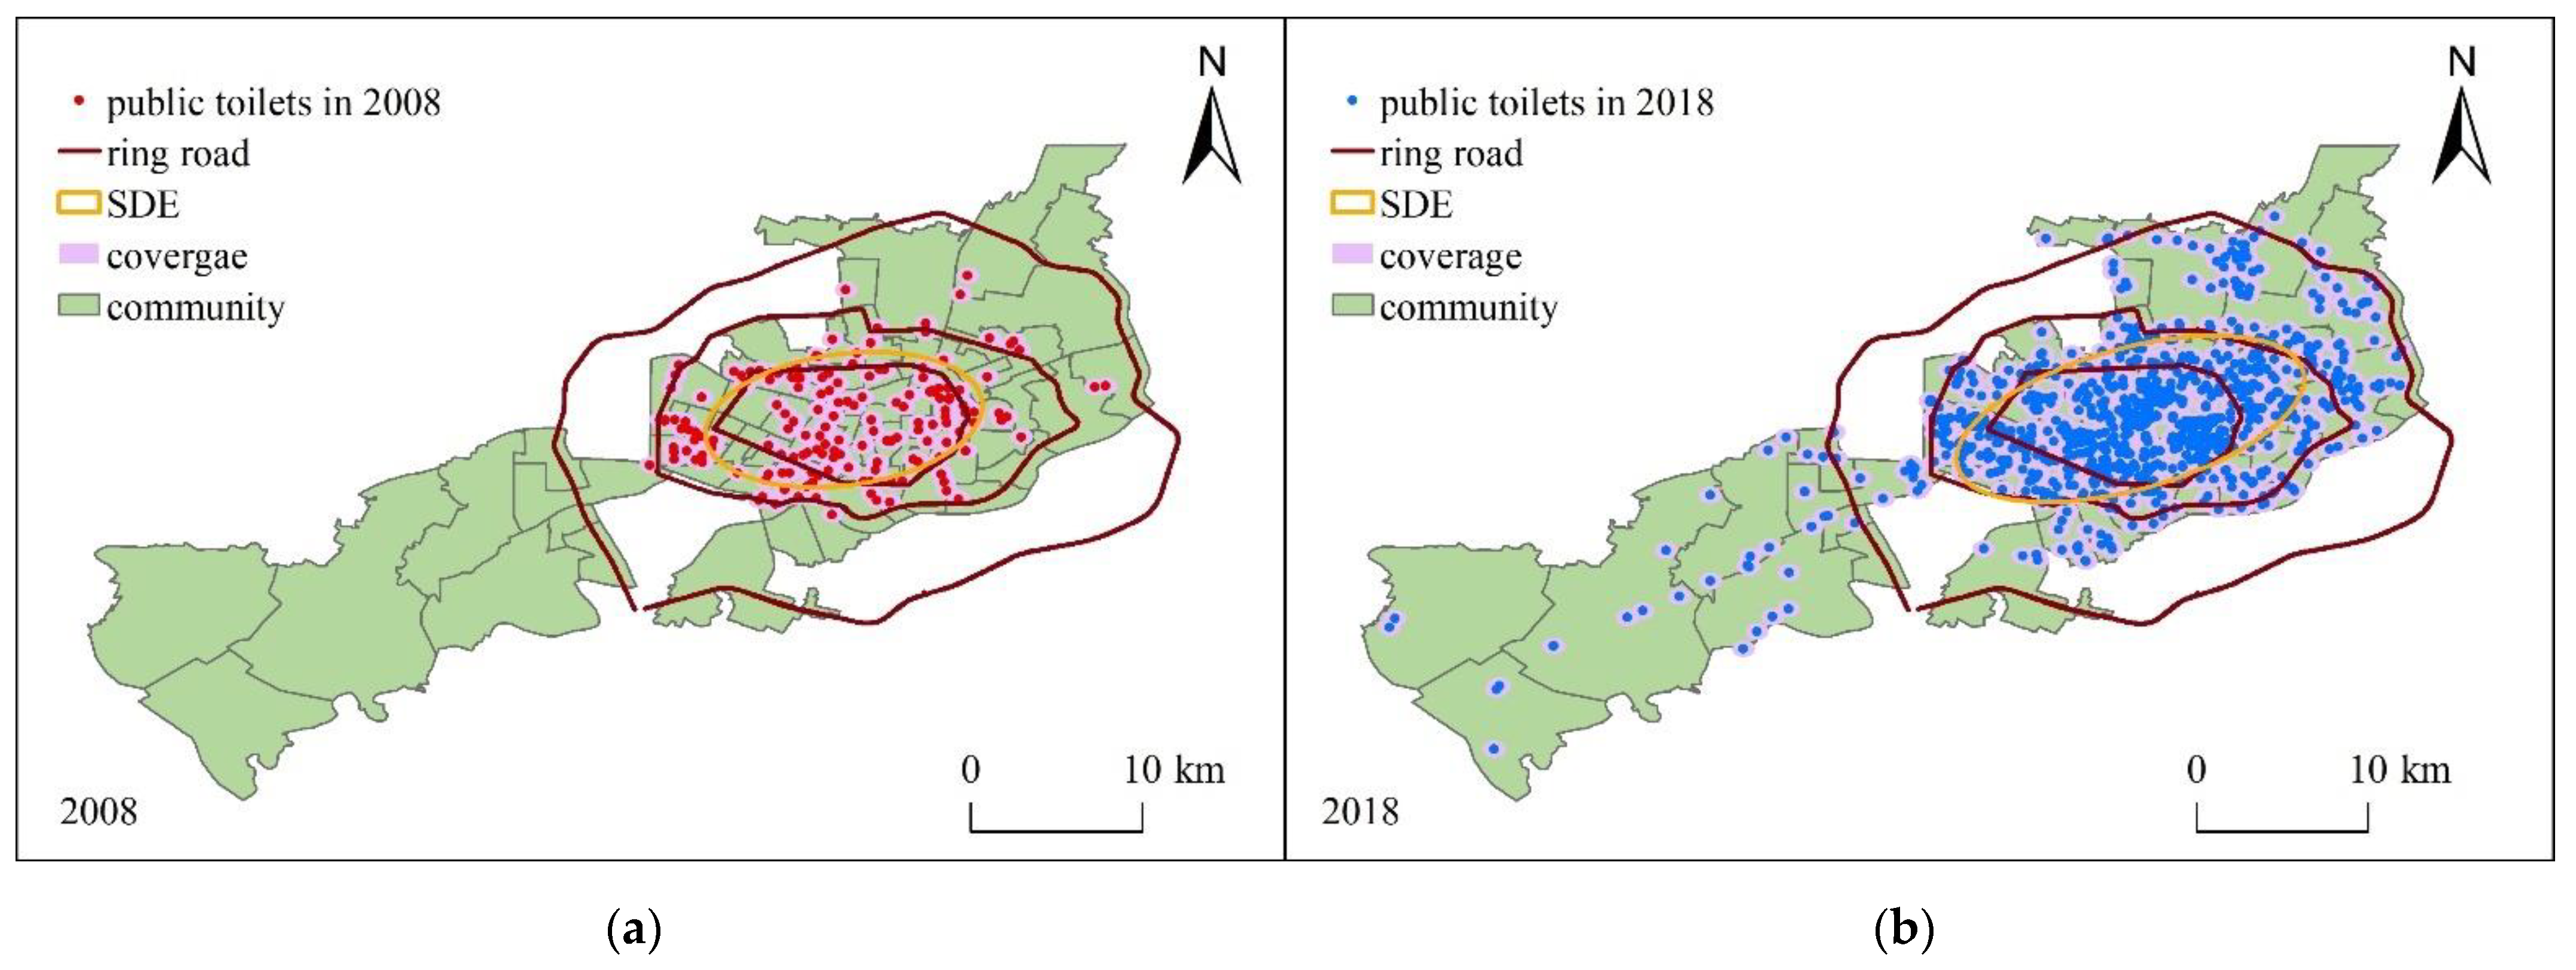
3.2. Spatial and Temporal Distribution Patterns and Characteristics

From 2008 to 2018, the total number of public toilets in the main urban areas of Shenyang increased from 165 to 1329, and the growth in the scale of community units was divided into six levels by the Jenks method. The number of public toilets in seventy-two out of seventy-four street community units showed an increasing trend, including eighteen communities with an increase of more than twenty, accounting for 24% of the total number of community units, of which seventy-six were the largest for Taiyuan Street sub-district. There are thirty-seven community units with less than ten growths, accounting for 50% of the total number of community units. The minimum growth of public toilets is −4 for Ta Wan sub-district, which is the only community unit with negative growth. The growth in the total number of public toilets mainly benefited from the continuous economic development and improvement of urban public facilities and is inextricably linked to the vigorous implementation of the toilet revolution. Within urban community streets, the overall increase in the number of public toilets varied greatly, with an uneven spatial distribution. The growth of the number of public toilets in 69% of street community units is lower than the average. Among them, the community streets with an increase of more than thirty are concentrated in large shopping centers such as Taiyuan Street, Centre Street, The Mixc, the transportation hub area of Shenyangbei Railway Station, and scenic spots such as Nanhu Park and Beiling Park (Figure 5). These areas are densely populated and have a large floating population. Consequently, there is a large demand for public toilets, resulting in a significant increase in the number of POI public toilets. Slower-growing communities lack large buildings such as large shopping malls and transportation hubs. As a result, there is a lack of dependent public toilets, most of which are independent public toilets, and their number increases slowly.
In terms of resource balance, three levels of spatial, population, and spatial population were assessed. The natural break method was applied at the spatial level to classify the kernel density according to five levels: low, lower, medium, higher, and high. The results show that public toilets are mainly distributed within the second ring road of Shenyang, showing multiple high-density distribution centers. In the overall spatial distribution of public toilets in 2008, medium and higher grades are distributed inside the second ring road, with six high-grade regions. Higher-grade and medium-grade regions are distributed around the high-value center to the periphery. In 2018, medium and higher grades were mainly distributed inside the first ring road, and the spatial distribution showed a shrinking trend toward the central city. There are four high-grade regions, including two major shopping centers of Centre Street and Taiyuan Street, and two major transportation hub centers of Shenyang Railway Station and Shenyangbei Railway Station. From the time series development trend analysis, public toilets gradually developed from scattered multi-center distribution to aggregated distribution mode with transportation and shopping as the four major centers (Figure 6). This reflects Shenyang’s focus on upgrading the traffic hubs and shopping centers, and gradually expanding the gap with other regions.
At the population level, from 2008 to 2018, the number of public toilets per 10,000 people (NTP) in the main urban area of Shenyang grew from 0.34 to 3.02. It is higher than the average of 2.77 in China and 1.84 in Liaoning Province. According to the number of public toilets per ten thousand people in 2008, the number of public toilets in the main urban areas of Shenyang was divided into five levels according to the natural break method, including 0 public toilets per ten thousand people in 18 community units, and the maximum number in Ertaizi sub-district of Dadong district, at 1.13. In 2018, the minimum number of public toilets per ten thousand people was 0.46 in Minglian sub-district of Huanggu district, and the maximum was 13.86 in Xinbeizhan sub-district of Shenhe district, with a significant increase in the number of public toilets per capita. Among seventy-four community units, seventy-three showed an increasing trend. The average increase was 2.69, among which Xinbeizhan sub-district in Shenhe district had the largest increase of 13.59, and Tawan sub-district in Huanggu district had the smallest increase of −0.50. In terms of distribution, the areas with a high value of public toilets for ten thousand people in 2008 were all concentrated inside the Second Ring Road, and the number of the lowest grade and lower grade areas was forty, accounting for 54%. The number of public toilets in eighteen community units was zero, causing the value of public toilets for ten thousand people to be zero. The reason is that the POI data acquisition system in 2008 was imperfect, and the POI data were concentrated inside the second ring road, with less data distribution outside the ring road, causing errors in the calculation of the index system. In 2018, higher-grade and higher-grade regions began to expand outside the second ring road, and gradually expanded to the third ring road region. Low-grade regions appear within the first ring line because of the robust and high coverage of POI data in 2008, resulting in less growth of POI data in 2018 and a small rate of population growth than the central area; thus causing some regions to change from high ratings to low ratings. From the overall time series, the number of public toilets owned by ten thousand people has increased greatly. Due to the robust POI data acquisition system, the community units with a small number of public toilets per capita had the most significant increase in the number of public toilets owned by ten thousand people in 2008 (Figure 7). Compared with the spatial level, the level of public toilets in community units outside the Second Ring Road of Dadong district increased in 2018, mainly because of the uneven distribution of population around the Second Ring Road. This led to the difference between the distribution results and the spatial kernel density of public toilets.
At the spatial-population level, the two scales of population and space were constructed as the public toilet density index (TDI) to comprehensively measure the balanced allocation of public toilet resources. The TDI index was divided into five levels according to the natural break method. The eighteen community units had a TDI value of zero in 2008, of which the maximum value was 1.95 in Xita sub-district, Heping district, with an average value of 0.51. The minimum value in 2018 was 0.231 in Gaohua sub-district, Tiexi district, and the maximum value was 19.14 in Xinbeizhan sub-district, Shenhe district, with an average of 4.09. In the development trend of time series, the average of TDI increased by 3.58, and the highest value, the lowest value, and the range increased. Higher-rated and high-rated areas are distributed within the second ring road, and the regions with higher ratings in 2008 still maintain a high level in 2018 (Figure 8). This indicates that the TDI index integrates both spatial and population factors. It can be a comprehensive measure of the overall distribution of public toilets, which is closer to the actual demand situation of public toilets.

3.3. Space Service Capability Assessment

In terms of the spatial service pattern, according to the “Urban Environmental Sanitation Facilities Planning Code”, considering the walking speed of pedestrians and the actual demand for public toilets, a buffer zone is set according to the 500 m service range of public toilets [47,48], and the service range of public toilets is shown in Figure 9. In 2008, the service range of public toilets was 91.61 km², mainly concentrated inside the second ring road, and some regions inside the ring road were still not covered. The service area of public toilets in 2018 is 252.88 km², mainly concentrated inside the second ring road, basically covering all regions. Because the population density inside the second ring road is high, there is a high demand for shopping places and transportation facilities with many public toilets, so a large number of shopping centers and large buildings have been built, meaning to increase the number of dependent public toilets. Simultaneously, with the further promotion and development of the toilet revolution, many new independent public toilets have been added in regions such as scenic spots, which improve the coverage of public toilets to a certain extent, enhance the service capacity of public toilets, and alleviate the tight demand for public toilets within urban regions. In terms of the overall directional distribution, one standard deviation is used to construct an ellipse, which covers 68% of the POI data of public toilets. The area covered by the standard deviation ellipse in 2008 was 79.36 km² with a perimeter of 34.93 km. The area covered by the standard deviation ellipse in 2018 was 109.64 km² with a perimeter of 43.21 km. The overall distribution range of public toilets shows an expansion trend from northeast to southwest. The oblateness of the ellipse increases and the directionality of the distribution of public toilets becomes more obvious.
The main service object of public toilets is the floating population and traveling residents [49,50]. Considering the main gathering places and the main travel destination of the floating population, seven main factors affecting the floating population from the POI data in 2018 were input into the geodetector model. The seven main factors include scenic spots, transportation facilities, shopping services, catering services, business residences, science and education, and accommodation services. The specific types contained in the POI data are shown in Table 2.
The spatially driven factor variables of the geo-detector need to be discretized to ensure the accuracy of interpretation. According to the natural break method of five to ten classes, scenic pots were classified into eight classes, transport facilities into ten classes, shopping service into five classes, catering service into five classes, business residence into seven classes, science and education is divided into eight classes, and accommodation services are divided into eight classes. Through the calculation of the geo-detector model, the driving force values of the seven influence factors on the spatial distribution of public toilets, dependent public toilets, and independent public toilets are shown in the table. Among the seven influence factors, scenic spots had the strongest driving effect, and accommodation services had the weakest effect. They passed the significance test. For the overall distribution of public toilets, scenic spots, transport facilities, shopping service, and accommodation service passed the 5% significance level test, and catering service passed the 1% significance level test. Among them, scenic spots had the greatest influence on the overall layout of public toilets, transport facilities, shopping service, and catering service had some influence on the overall layout of public toilets, and the difference in the degree of influence was not significant. Accommodation services had less influence on the overall layout of public toilets. Business residence science and education did not pass the significance level test and had small impacts on it. The overall spatial distribution of public toilets, scenic spots, shopping service, catering service, and accommodation service passed the 1% significance level test and science and education passed the 5% significance level test. The influence of scenic spots on the overall spatial distribution of public toilets was the greatest, and the influence of shopping services and catering services on the spatial distribution of public toilets was slightly smaller than that of scenic spots. The influence of both factors was the same. The main reason is that catering service and shopping were highly overlapped in space and correlated. The influence of business residence is only significant at a 90% confidence level and had little effect. Transportation facilities did not pass the significance test. For the overall spatial distribution of independent public toilets, all seven influencing factors failed the significance test and had little influence, indicating that the overall distribution of independent public toilets is more random and there’s no correlation between them (Table 3).

4. Discussion

Public toilets have developed from basic public sanitation facilities into important carriers and symbols with multiple values of urban culture and economy. For example, Germany has turned public toilets into creative advertising spaces to attract tourists to learn about German public sanitation and toilet culture through “toilet tours” [51]. In recent years, with the popularity of the sharing concept, shared public toilets have provided a new way to alleviate the tension of public toilets under the policy call [52,53]. The big data method represented by POI data provides more comprehensive data source information for the service capacity evaluation of public toilets. However, the accuracy of the data needs to be further verified for the new data with the massive amount of data. POI data have certain deficiencies in data collection, acquisition, and management. Due to the unique attribute of their composition, public service facilities represented by public toilets, point data was collected separately for men’s toilets, women’s toilets, and special toilets, resulting in overall duplicate counting. Therefore, when using POI big data as a data source for analysis and evaluation, the quantity information should be modified to ensure the accuracy of the later analysis results. By using data from public survey questionnaires, social media check-ins, and intelligent transportation, the accuracy of POI data information is corrected, and the accuracy of POI data is improved to a certain extent [54,55,56]. Meanwhile, by using multi-source data as the information carrier, POI data are expanded in terms of attribute information, then reclassified and analyzed to build a more comprehensive POI data sample [57,58]. In this study, the acquired public toilet point data were corrected separately according to dependent public toilets and independent public toilets to improve the reliability of public toilet service capacity evaluation.
The service capacity of public toilets needs to balance space and population. The balanced evaluation of the public toilet density index as an index system considers both space and population factors. Due to the incomplete attribute information of POI data [59], individual differences among different public toilets cannot be fully considered. The fusion of survey data with POI data can improve the accuracy of POI data in terms of the number of public toilets. However, there is still a certain lack in the quality of public toilets. In future research, field survey needs to focus more on the quality of public toilets and expand the information of public toilets using questionnaires and social media data. During the field investigation, we obtained many photos of public toilets (Figure 10). Among the thirty survey samples of dependent public toilets, only eighteen were equipped with cleaning facilities such as hand sanitizer and dryer. The utilization rate of cleaning facilities in independent public toilets was significantly lower than that in dependent public toilets. Eighty percent of the public toilets require QR code scanning to obtain a certain amount of toilet paper, and independent toilets are charged. Among the samples of dependent public toilets, nine have toilets for caring groups but are occupied by cleaning tools, renovation, and locking doors, which can be used at a lower rate. Most of them are set up in separate compartments for caring group use. In addition, due to the limitation of opening hours, the service capacity in the dependent public toilets differs from that of independent public toilets in the park. Therefore, attribute information is needed to supplement individual differences in the service capacity of public toilets. In addition, we need more cases in future studies to discuss the accuracy of POI data. Whether there is a correlation between city size and the service quality of public toilets needs to be studied more deeply. Meanwhile, long time series of POI information comparison is also worth studying.

5. Conclusions

As an essential part of urban sanitation public service facilities, the balance of resource allocation and spatial distribution pattern can further improve the service capacity of urban public sanitation facilities. With the method of POI geospatial big data of digital maps, the data of public toilets are corrected through field surveys and data comparison. The corrected POI data can more accurately reflect the number of public toilets. However, due to the limitation of POI data in 2008, the POI data of different years were not corrected. The paper studied the balanced allocation of the public toilets at three levels: spatial, population, and spatial-population, and quantitatively measured seven types of influencing factors of the spatial layout by using the geographic detector model for driving forces. Public toilet facilities possess both hygienic, cultural, and economic values. There are problems such as low coverage rate and difficulty for disabled people, maternal and infants in using public toilets. The POI data of the digital map can provide the spatial location and attribute information of each public toilet. The real-time and efficient data acquisition method improves the accessibility of public toilet data, which can improve the evaluation level of urban sanitation public service facilities and play a positive role in improving the service capacity of urban public sanitation service facilities. Selecting samples for field surveys and correcting the data of different public toilets can improve the accuracy of subsequent calculations and increase credibility. In the field survey, it was found that there were large variances in the service capacity of individuals in different public toilets. Among the driving factors of the spatial distribution pattern, the scenic spots category has a more significant influence on the overall distribution of public toilets. There is no significant difference in the impact effects of transportation facilities and shopping services, and other driving factors have little effect.

Author Contributions

J.L. conceptualization and supervision; B.F. writing—original draft; B.F. and X.X. investigation, formal analysis, and visualization; J.L. writing—review and editing. All authors have read and agreed to the published version of the manuscript.

Funding

This work was supported by the National Natural Science Foundation of China (41971166), Shandong Taishan Scholar Program (tsqn202103159), and Shenyang S&T Program (20-206-4-12).

Institutional Review Board Statement

Not applicable.

Informed Consent Statement

Not applicable.

Data Availability Statement

All data are available from the author.

Acknowledgments

The authors thank all reviewers for their great help in this article.

Conflicts of Interest

The authors declare no conflict of interest.

References

  1. Kub, J.E.; Kulbok, P.A.; Miner, S.; Merrill, J.A. Increasing the capacity of public health nursing to strengthen the public health infrastructure and to promote and protect the health of communities and populations. Nurs. Outlook 2017, 65, 661–664. [Google Scholar] [CrossRef] [PubMed] [Green Version]
  2. Sun, K.S.; Tai, P.L.; Tang, W.S.; Chan, H.Y.; Ho, P.L. Improving public toilet environment and hygiene practices in an Asian city: Voices from Hong Kong residents. Asia Pac. J. Public Health 2021, 33, 378–387. [Google Scholar] [CrossRef] [PubMed]
  3. Wilson, N.; Thomson, G. Deficient handwashing amenities in public toilets in the time of the COVID-19 pandemic: A multi-regional survey. N. Z. Med. J. 2021, 134, 18–27. [Google Scholar] [CrossRef] [PubMed]
  4. Vardoulakis, S.; Oyarce, D.A.E.; Donner, E. Transmission of COVID-19 and other infectious diseases in public washrooms: A Systematic Review. Sci. Total Environ. 2022, 803, 1–22. [Google Scholar] [CrossRef] [PubMed]
  5. Wath, S.B. A mechanical automatic urinal-toilet flusher for Swach Bharat mission. Proc. Environ. Sci. 2016, 35, 185–192. [Google Scholar] [CrossRef]
  6. O’Reilly, K.; Dhanju, R.; Goel, A. Exploring “The Remote” and “The Rural”: Open defecation and latrine use in Uttarakhand, India. World Dev. 2017, 93, 193–205. [Google Scholar] [CrossRef]
  7. Maroko, A.R.; Hopper, K.; Gruer, C.; Jaffe, M.; Zhen, E.; Sommer, M. Public restrooms, periods, and people experiencing homelessness: An assessment of public toilets in high needs areas of Manhattan, New York. PLoS ONE 2021, 16, 1–20. [Google Scholar] [CrossRef]
  8. Greed, C. The role of the public toilet: Pathogen transmitter or health facilitator. Build Serv. Eng. Res. Technol. 2006, 27, 127–139. [Google Scholar] [CrossRef]
  9. Christakos, G.; Olea, R.A.; Yu, H.L. Recent results on the spatiotemporal modelling and comparative analysis of Black Death and bubonic plague epidemics. Public Health 2007, 121, 700–720. [Google Scholar] [CrossRef]
  10. Farahani, M.; Subramanian, S.V.; Canning, D. Effects of state-level public spending on health on the mortality probability in India. Health Econ. 2010, 19, 1361–1376. [Google Scholar] [CrossRef] [Green Version]
  11. U.N.D.P. Sustainable Development Goals. United Nations Development Program. Available online: http://www.globalgoals.org/zh (accessed on 13 February 2022).
  12. Afacan, Y.; Gurel, M.O. Public Toilets: An exploratory study on the demands, needs, and expectations in Turkey. Environ. Plan. 2015, 42, 242–262. [Google Scholar] [CrossRef]
  13. W.H.O.; U.N.I.C.E.F. Progress on Sanitation and Drinking-Water 2013 Update. World Health Organization and United Nations International Children’s Emergency Fund. Available online: https://www.who.int/news/item/13-05-2013-2-4-billion-people-will-lack-improved-sanitation-in-2015 (accessed on 13 February 2022).
  14. Welie, V.; Mara, J.; Romijn, H.A. NGOs fostering transitions towards sustainable urban sanitation in low-income countries: Insights from transition management and development studies. Environ. Sci. Policy 2018, 84, 250–260. [Google Scholar] [CrossRef]
  15. Gebremariam, B.; Hagos, G.; Abay, M. Assessment of community led total sanitation and hygiene approach on improvement of latrine utilization in Laelay Maichew District, North Ethiopia. A comparative cross-sectional study. PLoS ONE 2018, 13, 1–11. [Google Scholar] [CrossRef] [PubMed]
  16. Siu, K.; Wong, M. Promotion of a healthy public living environment: Participatory design of public toilets with visually impaired persons. Public Health 2013, 127, 629–636. [Google Scholar] [CrossRef] [PubMed]
  17. O’Reilly, K. From toilet insecurity to toilet security: Creating safe sanitation for women and girls. Wiley Interdiscip. Rev. Water 2016, 3, 19–24. [Google Scholar] [CrossRef]
  18. Palmer, M.H.; Newman, D.K. Women’s toileting behaviors: An online survey of female advanced practice providers. Int. J. Clin. Prac. 2015, 69, 429–435. [Google Scholar] [CrossRef]
  19. Khanna, T.; Das, M. Why gender matters in the solution towards safe sanitation? Reflections from rural India. Glob. Public Health 2016, 11, 1185–1201. [Google Scholar] [CrossRef]
  20. Mariwah, S.; Hampshire, K.; Owusu-Antwi, C. Getting a foot on the sanitation ladder: User satisfaction and willingness to pay for improved public toilets in Accra, Ghana. J. Water Sanit. Hygiene Dev. 2017, 7, 528–534. [Google Scholar] [CrossRef] [Green Version]
  21. Bliss, D.Z.; Park, Y.S. Public toilets in parklands or open spaces in international cities using geographic information systems. Int. Urogynecol. J. 2020, 31, 939–945. [Google Scholar] [CrossRef]
  22. Nega, W.; Hunie, Y.; Tenaw, M.; Dires, T.; Kassaw, S.; Mansberger, R. Demand-Driven suitable sites for public toilets: A case study for GIS-Based site selection in Debre Markos Town, Ethiopia. GeoJournal 2021, 2, 1–14. [Google Scholar] [CrossRef]
  23. Xu, Z.H.; Lin, Q.; Zheng, W.B.; Fan, H.C.; Wang, J.Q.; Chen, S.W. Layout analysis and optimization of public toilets in Majiang Area, Mawei based on GIS. Eng. Surv. Mapp. 2015, 7, 24–28. [Google Scholar] [CrossRef]
  24. Bichard, J. Improving public services through open data: Public toilets. Proc. Inst. Civil Eng.—Munic. Eng. 2012, 165, 157–165. [Google Scholar] [CrossRef] [Green Version]
  25. Langer, S.; Car, A. GIS-based decision support for public toilet site selection: A case study of South Batinah Region in Oman. Verlag Der 0sterreichischen Akad. Wiss. 2014, 1, 135–139. [Google Scholar] [CrossRef] [Green Version]
  26. Hu, S.; He, Z.; Wu, L.; Yin, L.; Cui, H. A framework for extracting urban functional regions based on multiprototype word embeddings using points-of-interest data. Comput. Environ. Urban Syst. 2020, 80, 1–15. [Google Scholar] [CrossRef]
  27. Xue, B.; Xiao, X.; Li, J.Z.; Xie, X. POI-based analysis on retail’s spatial hot blocks at a city level: A case study of Shenyang, China. Econ. Geogr. 2018, 38, 36–43. [Google Scholar] [CrossRef]
  28. Xue, B.; Xiao, X.; Li, J.Z.; Xie, X.; Ren, W.X. POI-based spatial correlation of the residences and retail industry in Shenyang City. Sci. Geogr. Sin. 2018, 39, 442–449. [Google Scholar] [CrossRef]
  29. Yu, B.; Wang, Z.; Mu, H.; Sun, L.; Hu, L. Identification of urban functional regions based on floating car track data and POI data. Sustainability 2019, 11, 6541. [Google Scholar] [CrossRef] [Green Version]
  30. Li, F.; Yan, Q.; Bian, Z.; Liu, B.; Wu, Z. A POI and LST adjusted NTL urban index for urban built-up area extraction. Sensors 2020, 20, 2918. [Google Scholar] [CrossRef]
  31. Wu, M.; Pei, T.; Wang, W.; Guo, S.; Song, C.; Chen, J. Roles of locational factors in the rise and fall of restaurants: A case study of Beijing with POI data. Cities 2021, 113, 103185. [Google Scholar] [CrossRef]
  32. Han, L.; Cheng, Y.; Cui, Z.; Xi, G. Optimal layout of tourist toilets using resilience theory: An empirical study on Dunhua City in ethnic region of China. PLoS ONE 2021, 16, e0251696. [Google Scholar] [CrossRef]
  33. Chen, C.; Liu, Y.; Liao, C.; Chen, C.; Feng, L.; Wang, Z. Where to build new public toilets? Multi-source urban data tell the truth. In Proceedings of the 2019 IEEE SmartWorld, Ubiquitous Intelligence & Computing, Advanced & Trusted Computing, Scalable Computing & Communications, Cloud & Big Data Computing, Internet of People and Smart City Innovation, Leicester, UK, 19–23 August 2020; pp. 1162–1169. [Google Scholar] [CrossRef]
  34. Ma, Q.; Wang, L.; Gong, X.; Li, K. Research on the rationality of public toilets spatial layout based on the POI data from the perspective of urban functional area. J. Geo-Inf. Sci. 2022, 24, 50–62. [Google Scholar] [CrossRef]
  35. Cheng, S.; Li, Z.; Uddin, S.; Mang, H.P.; Zhang, L. Toilet revolution in China. J. Environ. Manag. 2018, 216, 347–356. [Google Scholar] [CrossRef] [PubMed]
  36. Li, J.Z.; Xie, X.; Zhao, B.Y.; Xiao, X.; Ren, W.X. Identification of urban functional area by using multisource geographic data: A case study of Zhengzhou, China. Complexity 2021, 6, 1–10. [Google Scholar] [CrossRef]
  37. Xue, B.; Xiao, X.; Li, J.Z. Identification method and empirical study of urban industrial spatial relationship based on POI big data: A case of Shenyang City, China. Geogr. Sustain. 2020, 1, 152–162. [Google Scholar] [CrossRef]
  38. Zhang, X.; Sun, Y.; Chan, T.O. Exploring impact of surrounding service facilities on urban vibrancy using Tencent location-aware data: A case of Guangzhou. Sustainability 2021, 13, 444. [Google Scholar] [CrossRef]
  39. O’Sullivan, D. Exploring spatial scale in geography. Int. J. Geogr. Inf. Sci. 2015, 29, 1932–1933. [Google Scholar] [CrossRef]
  40. Li, J. The Study of Theories and Practice in Urban Residents Travel Survey; Chang’an University: Xi’an, China, 2011. [Google Scholar]
  41. Xie, Z.; Yan, J. Kernel density estimation of traffic accidents in a network space. Comput. Environ. Urban Syst. 2008, 32, 396–406. [Google Scholar] [CrossRef] [Green Version]
  42. Xie, Z.; Yan, J. Detecting traffic accident clusters with network kernel density estimation and local spatial statistics: An integrated approach. J. Trans. Geogr. 2013, 31, 64–71. [Google Scholar] [CrossRef]
  43. Li, Q.; Wei, J.; Jiang, F.; Zhou, G.; Hu, W. Equity and efficiency of health care resource allocation in Jiangsu province, China. Int. J. Equity Health 2020, 19, 1–14. [Google Scholar] [CrossRef]
  44. Wang, J.; Xu, C. Geodetector: Principle and prospective. Acta Geogr. Sin. 2017, 72, 116–134. [Google Scholar] [CrossRef]
  45. Li, J.; Lu, D.; Xu, C. Spatial heterogeneity and its changes of population on the two sides of Hu Line. Acta Geogr. Sin. 2017, 72, 148–160. [Google Scholar] [CrossRef]
  46. Nguyen, T.; Vu, T. Identification of multivariate geochemical anomalies using spatial autocorrelation analysis and robust statistics. Ore Geol. Rev. 2019, 111, 102985. [Google Scholar] [CrossRef]
  47. Yin, J.; Feng, N.; Wang, Z.; Li, Q. Study on site selection and layout planning of public toilets in urban comprehensive park: Taking Xuanwu Lake Park in Nanjing as an example. In IOP Conference Series: Earth and Environmental Science; IOP Publishing: Bristol, UK, 2020; pp. 1–14. [Google Scholar] [CrossRef]
  48. Kadi, S.; Abdullah, A.; Bachok, S. The evaluation of pedestrian facilities on Hajj crowd between Arafat and Muzdalifah pedestrian street. Plan. Malays. 2021, 19, 169–179. [Google Scholar] [CrossRef]
  49. Xie, B. Research of environmental governance in Beijing’s urban-rural district. In Proceedings of the 2010 International Conference on Management and Service Science, Wuhan, China, 24–26 August 2010; pp. 1–4. [Google Scholar] [CrossRef]
  50. Li, Y.; Guo, F.; Bi, J.; Peng, Y.; Yu, S. Research on optimization design of ecological toilet in rural revitalization. In 2nd International Conference on Contemporary Education, Social Sciences and Ecological Studies; Atlantis Press: Amsterdam, The Netherlands, 2019; pp. 1035–1040. [Google Scholar] [CrossRef] [Green Version]
  51. Hyde, F. When Nature Calls: Public Toilets in Germany. Available online: http://www.german-way.com/when-nature-calls-public-toilets-in-germany-toilette-wc (accessed on 13 February 2022).
  52. Petrie, C. Emergent collectives redux: The sharing economy. IEEE Int. Comput. 2016, 20, 84–86. [Google Scholar] [CrossRef]
  53. Barile, S.; Ciasullo, M.V.; Iandolo, F.; Landi, G.C. The city role in the sharing economy: Toward an integrated framework of practices and governance models. Cities 2021, 119, 103409. [Google Scholar] [CrossRef]
  54. Hu, Y.; Gao, S.; Janowicz, K.; Yu, B.; Li, W.; Prasad, S. Extracting and understanding urban areas of interest using geotagged photos. Comput. Environ. Urban Syst. 2015, 54, 240–254. [Google Scholar] [CrossRef]
  55. Gao, S.; Janowicz, K.; Couclelis, H. Extracting urban functional regions from points of interest and human activities on location-based social networks. Trans. GIS 2017, 21, 446–467. [Google Scholar] [CrossRef]
  56. Gong, Y.; Lin, Y.; Duan, Z. Exploring the spatiotemporal structure of dynamic urban space using metro smart card records. Comput. Environ. Urban Syst. 2017, 64, 169–183. [Google Scholar] [CrossRef]
  57. Chao, W.; Ye, X.; Fu, R.; Du, Q. Check-in behaviour and spatio-temporal vibrancy: An exploratory analysis in Shenzhen, China. Cities 2018, 77, 104–116. [Google Scholar] [CrossRef]
  58. An, D.; Tong, X.; Liu, K.; Chan, E.H.W. Understanding the impact of built environment on metro ridership using open source in Shanghai. Cities 2019, 93, 177–187. [Google Scholar] [CrossRef]
  59. Tran, C.; Vu, D.D.; Shin, W.Y. An improved approach for estimating social POI boundaries with textual attributes on social media. Knowl.-Based Syst. 2020, 213, 106710. [Google Scholar] [CrossRef]
Figure 1. Schematic diagram of the study area: (a) the urbanization rate of China’s provinces; (b) the urbanization rate of cities in Liaoning Province; (c) the urbanization rate of districts of Shenyang.
Applsci 12 04659 g001
Figure 2. Distribution map of public toilets survey spots.
Applsci 12 04659 g002
Figure 3. Fitting diagram of POI data and actual survey data.
Applsci 12 04659 g003
Figure 4. Fitting diagram of POI data and Amap data.
Applsci 12 04659 g004
Figure 5. Distribution of public toilets POI increase in Shenyang.
Applsci 12 04659 g005
Figure 6. Kernel density of public toilets in Shenyang: (a) distribution of Kernel density in 2008; (b) distribution of Kernel density in 2018.
Applsci 12 04659 g006
Figure 7. NTP of public toilets in Shenyang: (a) distribution of NTP in 2008; (b) distribution of NTP in 2008.
Applsci 12 04659 g007
Figure 8. TDI of public toilets in Shenyang: (a) distribution of TDI in 2008; (b) distribution of TDI in 2008.
Applsci 12 04659 g008
Figure 9. Distribution of standard deviation ellipse and 500 m coverage of public toilets: (a) distribution of SDE and 500 m coverage in 2008; (b) distribution of SDE and 500 m coverage in 2018.
Applsci 12 04659 g009
Figure 10. Field photos of public toilets: (a) Mother room and children restroom; (b) the interior of the dependent public toilets; (c) the station for sanitation workers; (d) the independent public toilets.
Applsci 12 04659 g010
Table 1. Evaluation system of service capacity of urban public toilet facilities.
Target LevelIndex LevelMethod LevelData LevelData Quality
Resource balanceSpatial equilibriumKernel density estimationPOI data;
survey data
☆☆☆☆
Population equilibriumThe number of toilets per 10,000 people (NTP)statistical data;
POI data.
survey data
☆☆☆☆☆
Spatial-population equilibriumToilet density index (TDI)statistical data;
POI data.
survey data
☆☆☆☆☆
Service space
pattern
Distribution characteristicsStandard deviational ellipse (SDE);
buffer zone
POI data.
survey data
☆☆☆☆
Analysis of influencing factorsGeodetectorPOI data☆☆☆
Table 2. Detailed list of POI data for seven categories.
CategoryQuantitySpecific Classification
Scenic spots1219Scenic spots (national attractions, provincial attractions); scenic spots related (tourist attractions, memorials, churches, temples and Taoist temples); parks and squares (parks, zoos, botanical gardens, aquariums, city squares)
Transportation facilities2121Subway stations (entrances and exits); bus stations (bus station related); train stations (train stations, freight train stations, exits, entrances/checkpoints, ticketing related, platforms); airports (waiting rooms, airport related)
Shopping service825Hypermarket; shopping malls (general malls, shopping centers); shopping streets (special shopping streets, pedestrian streets); integrated markets
Catering services50,581Dining-related (tea house cake store, coffee shop, cafeteria, cold drink store, dessert store) foreign restaurants; Chinese restaurants; casual dining places (seafood restaurants, hot pot, halal restaurants, special flavor restaurants, local flavor restaurants, comprehensive restaurants)
Business residence9449Industrial parks (business office buildings, commercial and residential buildings, business residential related); residential areas (villas, dormitories, neighborhood unit, residential communities)
Science
and
education
9175Science and education venues (museums, libraries, exhibition halls, cultural palaces, exhibition centers, science and technology museums, scientific research institutions, training institutions, cultural and art groups); schools (schools, vocational and technical schools, adult education, higher education institutions, secondary schools, elementary school, kindergartens)
Accommodation services5765Accommodation service related (hotels, economic chain hotels, star hotels, guest houses)
Table 3. Detection results of the factors influencing the spatial distribution of public toilets.
Scenic
Spots
Transport
Facilities
Shopping
Service
Catering ServiceBusiness ResidenceScience and EducationAccommodation Service
Public toilets0.480
(0.013)
0.334
(0.041)
0.354
(0.040)
0.391
(0.004)
0.152
(0.205)
0.242
(0.136)
0.187
(0.050)
Dependence public toilets0.480
(0.004)
0.250
(0.130)
0.400
(0.004)
0.400
(0.000)
0.182
(0.097)
0.300
(0.026)
0.274
(0.003)
Independence public toilets0.259
(0.198)
0.224
(0.274)
0.134
(0.401)
0.183
(0.217)
0.019
(0.981)
0.085
(0.756)
0.045
(0.808)
Note: p-value in parentheses.
Publisher’s Note: MDPI stays neutral with regard to jurisdictional claims in published maps and institutional affiliations.

