Article

Biogas Production Enhancement through Chicken Manure Co-Digestion with Pig Fat

by
Egidijus Buivydas
1,*,
Kęstutis Navickas
2,
Kęstutis Venslauskas
1,2,
Bronius Žalys
1,
Vidmantas Župerka
2 and
Mantas Rubežius
2
1
Lithuanian Energy Institute, Breslaujos g. 3, LT-44403 Kaunas, Lithuania
2
Agriculture Academy, Vytautas Magnus University, K. Donelaičio g. 58, LT-44248 Kaunas, Lithuania
*
Author to whom correspondence should be addressed.
Appl. Sci. 2022, 12(9), 4652; https://doi.org/10.3390/app12094652
Submission received: 7 April 2022 / Revised: 29 April 2022 / Accepted: 3 May 2022 / Published: 6 May 2022

Abstract

:
Chicken manure and pig fat are found abundantly around the globe, and there is a challenge to get rid of them. This waste has considerable energy potential to be recovered into fuel, but extracting this energy from some by-products, especially fat, isn’t an easy task. When anaerobic digestion technology stepped to the level of anaerobic co-digestion, the utilisation of hardly degradable waste became feasible. Our research was conducted on anaerobic co-digestion of chicken manure as the primary substrate with pig fat as a fat reach supplement in a semi-continuous mode at different organic load rates. The influence of fat waste on the process of biogas production from chicken manure and the composition of the obtained products was determined using an organic load rate of 3.0–4.5 kg VS·(m3·day)−1. A sturdy and continuously growing biogas production was observed at all organic load rates, implying the synergetic effect on chicken manure and pig fat co-digestion. The highest specific methane yield, 441.3 ± 7.6 L·kg VS−1, was observed at an organic load rate of 4.5 kg VS·(m3·day)−1. The research results showed that co-digestion of chicken manure with pig fat is an appropriate measure for fat utilisation and contributes to the increase in biogas yield, methane concentration, and overall methane yield at investigated organic load rates.

1. Introduction

Nowadays population around the globe continues to grow and has reached almost 8 billion by the end of 2021, according to Daniela Palacios-Lopez et al. [1], and the projected human population of 9.8 billion is anticipated by 2050 [2]. This growing number of people will require an increase in global crop production to fulfil food demand, leading agricultural lands or productivity (croplands and animal productivity) to increase [3]. According to the statistic source [4], the worldwide number of animals and chickens is rising every year, satisfying a share of the food demand of the growing world population [2]. The number of chicken birds only hikes year on year and has increased more than three times in the last 20 years. Meat production and consumption have increased worldwide in recent years too, and it is expected to grow up to 366 × 106 tonnes by 2029 [5]. If we take for instance the pork industry in the European Union (EU) only, the number of slaughtered pigs reached 256 × 106 in 2019 [5]. The animal amount that remains after processing and is unfit for human consumption can reach 25–50% wet animal basis [6,7]. These residues are known as animal by-products and consist mainly of wastes of cattle, sheep, pigs, goats, chickens, turkeys, and a few other animal wastes [8]. We can use a part of these by-products as a source for pets’ feed and other purposes, but bones and fats remain in significant amounts unused.
All the mentioned waste (manure and by-products) can be transformed into energy in the so-called “waste-to-energy” (WtE) method, because this way leads us to clean and safe energy production, contributing to the mitigation of the harmful environmental impact created by fossil fuel usage [9]. Since livestock manure has been processed in various ways, its detrimental effect on the environment has been mitigated [10,11]. However, utilisation of some waste and by-products is a problem, which involves scientists finding different energy production approaches from such waste materials. Still, it remains a challenging task of recognising a better WtE technological solution [8,12]. Through the WtE method, the demand for renewable energy rises every year because many countries signed the Paris agreement [13] and have decided to reduce greenhouse gas (GHG) emissions in favour of more clean and sustainable energy sources. This movement is promising, as it will address the environmental issues and energy shortage more efficiently for future generations [14]. It is obviously predicted that agricultural production, contributing to many other sectors, will grow by almost 50% by 2050 when compared to 2012 to meet this rising demand for food, fibre, and energy [15]. For this reason, agriculture is also considered one of the largest sectors that can produce a high amount of biomass, which as a source is an important input for the circular bioeconomic [16].
While the agricultural sector plays a strategic role in improving the availability of food [17], on the other hand, it is among the most significant drivers of global environmen-tal change in the Anthropocene and a substantial emitter of greenhouse gases [3]. Recent research [18] showed that farming was responsible for approximately 16–27% of all an-thropogenic emissions. Agriculture more or less emits waste at every stage of production. Emission starts from seed preparation and occurs in storage, processing and production distribution [18], generating an abundance of agricultural waste: crop residue, livestock by-products, agro-industrial and aqua-culture waste [16]. So, agriculture’s relation with other sectors is significant and requires different research approaches from several sides and an appropriate waste management system.
The main objective of the waste management systems is dealing with energy and material recovery and the discarding of residues. It is also a quest for a regulatory arrangement on conserving the environment in the area of concern and selecting decent technology for waste handling with all the essential standards for effective operation. So far, there are many available techniques for degradable waste transformation to energy, which we could assort into groups according to the standard method of technology: the group of thermal conversion (incineration, gasification, pyrolysis, etc.), the group of biochemical conversion (anaerobic digestion (AD), ethanol fermentation, etc.), the group of chemical and mechanical treatment, and the group of new trends of WtE technologies [9]. What exact technology we choose depends on our needs, the possibility of implementing that technology, local regulations for that technology, and WtE conversion’s effectiveness.
So far, processed fat could be used as a renewable fuel [8], but burning that kind of matter does not help to meet the Green energy targets of the European Union [19] and Paris agreement [13] because flue gas contaminates the environment with nitrogen oxides and solid particles. According to the literature [20,21], livestock by-products, mainly generated from the meat processing industry, are sustainable feedstock for the synthesis of biodiesel production [20,21]. Other authors [22] also have noted that biodiesel could be made from broadly available animal fat wastes (also called lipid-rich wastes [22]) instead of vegetable oils. This way is a more promising and sustainable method, allowing elimination of the need for crops in the debate of food vs. fuel simultaneously. Still, in the EU, there is a gap between the centralised and industry-level facilities targeting lipid-rich wastes. As a consequence, these substrates are often disposed of uncontrolled instead of being re-used for WtE conversion to biogas under anaerobic digestion. It should be emphasised that the production of biogas from lipids is increasing in popularity among anaerobic digestion studies, and biogas production could be considered as the appropriate way for producing bioenergy from anaerobic digestion in the frame of modern bioeconomy, too [23].
So far, AD is a well-known technology and an effective method for dealing with animal manure. This technology is a good measure for organic waste utilisation, pollution and greenhouse gas emission reduction, renewable energy production, and digestate as valuable fertiliser used in agriculture [24]. As was mentioned, the fermentation of animal and chicken manure is considered an appropriate option for the management of such waste. However, the high organic nitrogen content (30 g·kg−1 fresh weight) and low carbon-to-nitrogen (C/N) ratio (7:1) [25] is a major drawback that inhibits the anaerobic process. In such cases, even at a low organic load, the ammonia concentration can exceed the inhibition threshold and cause process interruption [25]. In this case, improving the C/N ratio with carbon-rich additives can help to optimise co-digestion. The latest studies show that animal manure can be well co-digested with other biodegradable organic materials such as fat waste, producing renewable fuel–biogas and the organic fertiliser–digestate. It is predicted that adding other materials can increase the total solids’ (TS) concentration, causing difficulties in pumping and mixing the digester substrates [26]. Depending on the TS content of the feedstock, anaerobic digestion can be categorised into wet anaerobic digestion with a TS content <10%, semi-dry anaerobic digestion with a TS content ranging from 10 to 20%, and dry anaerobic digestion with a TS content ≥20% [24].
The quality of feedstock conversion to biogas characterises the efficiency of AD conversion systems. According to the literature [27], the AD conversion efficiency is generally high at low organic loads (OLRs), because microorganisms access nutrients well. Still, too low OLR can cause low activity of microorganisms due to inadequate provision of nutrients for their metabolism, and conversion efficiency drops. On the other hand, the conversion efficiency can also drop at high OLR because of microbial inhibition and nutrient washout. According to the same literature [27], the AD system registers the highest specific biogas potential vs. consumption at critical OLR, where the substrate conversion efficiency reaches 75%. Any OLR value that suppresses efficiencies below 70% is regarded as sub-optimal. In those cases, OLRs are either too high or too low [27,28].
The main task of this study was to investigate the possibility of fat waste usage for biogas production enhancement throughout the anaerobic co-digestion with manure. Relying on co-digestion synergy, which can be possible between the primary substrate and supplements added, the biogas was produced from chicken manure in co-digestion with pig fat, determining the changes in biogas production parameters at different OLRs.

2. Materials and Methods

The research was performed in an anaerobic continuous feeding bioreactor with controlled environmental conditions to treat chicken manure and pig fat at the biogas laboratory of Vytautas Magnus University, Agriculture Academy. Anaerobic co-digestion opportunities and challenges associated with this substrate and supplements were identified by analysing factors that affect digestate composition, digestion process, biogas and methane yield, and methane concentration in biogas. The biogas production efficiency of the anaerobic process was evaluated relating to the reactor OLR.

2.1. Material Preparation for Experiments

Experimental materials were composed of chicken manure (RM) and thermally processed pig fat (FAT). The chicken manure (droppings only) was collected from a large-scale ecological farm. The required amounts of manure for the entire research were collected at once, packed into 400 g tight plastic boxes, and stored in a freezer at −18 °C until the experiment ended. Pig fat was taken away from a fat trap of a meat processing company for the entire research at once. The material obtained was thermally processed, obtaining a liquid fraction of fatty matter. The liquid fraction of melted fat was separated by a sieve, poured into a 3 kg plastic container, and stored in a refrigerator at +5 °C. The solid remain of melted fat was left at the slaughterhouse. The inoculum for anaerobic digestion was obtained from a local wastewater treatment plant (WWTP) and, while it was fresh, poured into the laboratory reactor.
The composed feeding material (FM) is given in Table 1. The first feeding material of experiment OLR3.0 was prepared from chicken manure, diluting manure with tap water. This feeding material corresponded to the initial OLR of 3.0 kg VS·(m3·day)−1. Every following feeding material of experiments OLR3.5, OLR4.0, and OLR4.5 was prepared with the fat added to the initial feeding material of 3.0 kg VS·(m3·day)−1 by increasing the OLR in steps 0.5 kg VS·(m3·day)−1.
Every single dose of feeding mass for the reactor was prepared one day before the reactor feeding time and kept in a refrigerator until feeding. The needed amount of chicken manure at a temperature of about 5 °C was weighed on laboratory scales, diluted with hot tap water of about 45 °C to obtain appropriate dry matter for digestion and a temperature of 30–35 °C of the substance. Just before feeding the reactor, the substance was agitated and poured into the reactor. The feeding material dose was added once a day to the bioreactor. The digestate was removed before feeding the reactor. The reactor was fed with diluted chicken manure substance for 30 days for obtaining the chicken manure-based digestate. At the end of this stage, the digestate was analysed for the chemical composition and physical features. The chicken manure co-digestion with pig fat was started after stabilised digester performance for 10 days. Additionally needed amount of the fat at a temperature of about 5 °C was weighed, added into the prepared chicken manure substance, and agitated, obtaining melted fat and a homogeneous substance for the reactor feeding.

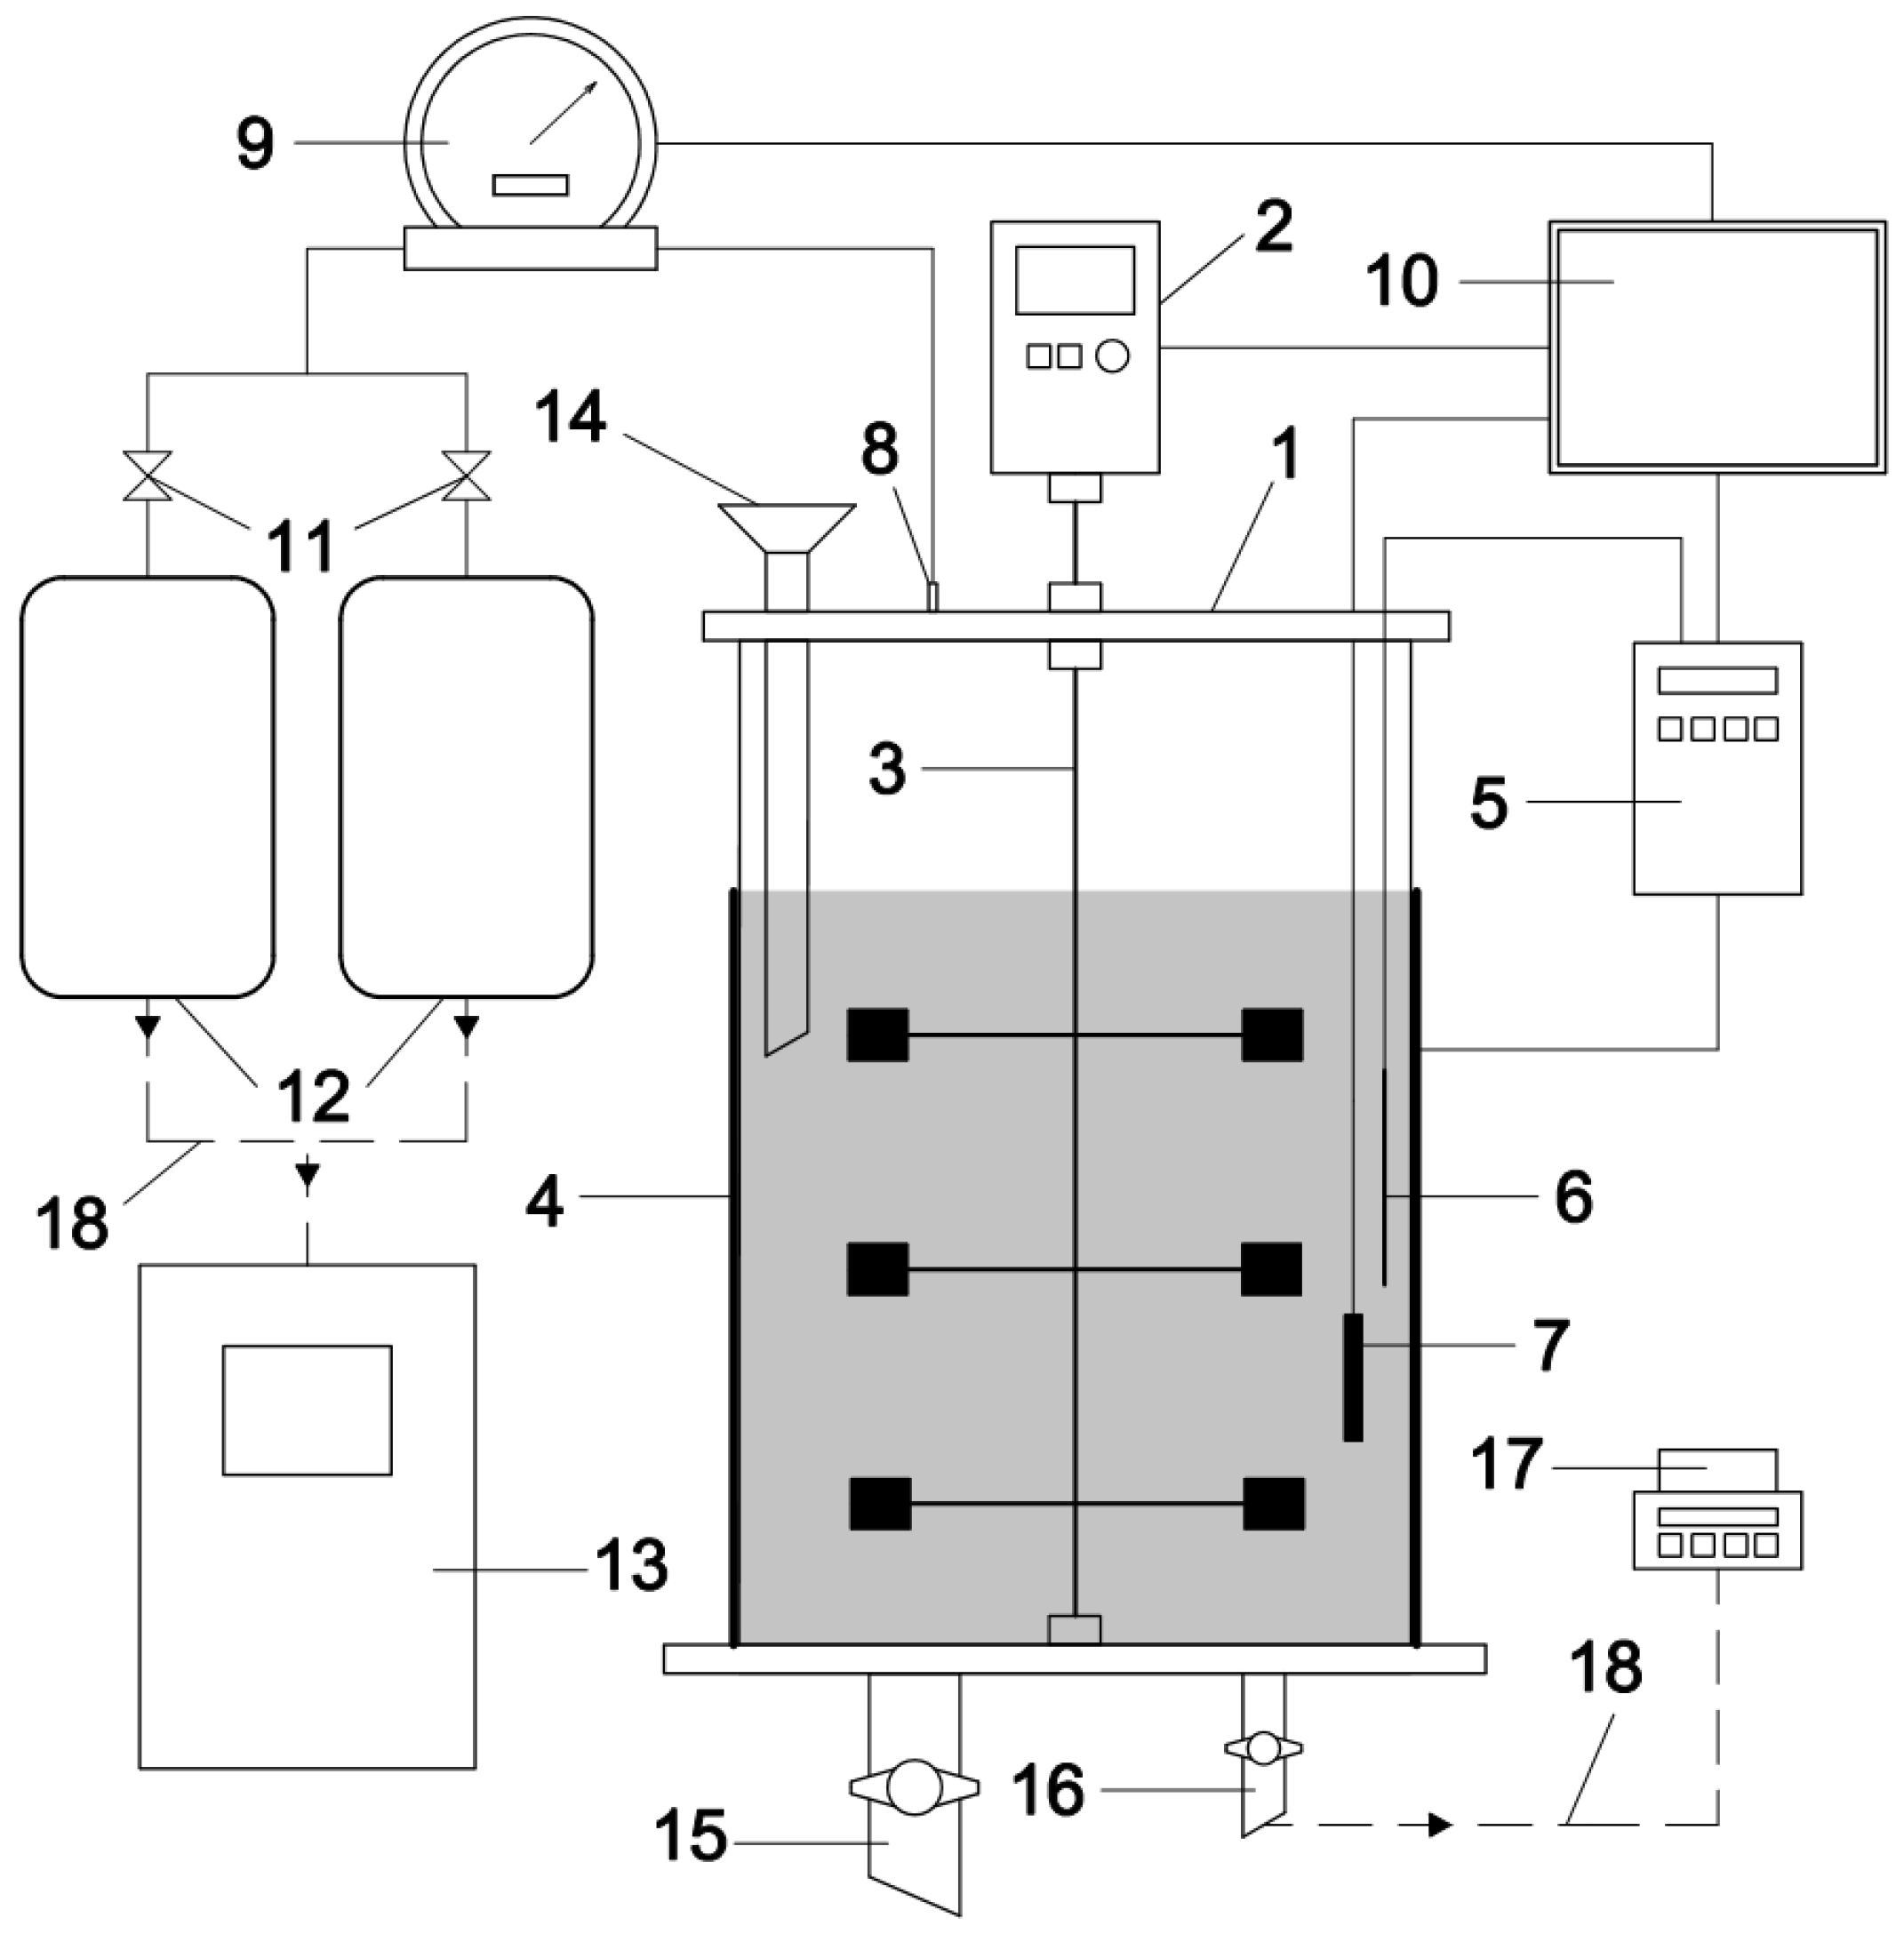
2.2. Laboratory Equipment and Instruments

The biogas production experiment took place in the continuous feeding BTP-2 laboratory biogas pilot reactor (Umwelt- und Ingenieurtechnik GmbH, Dresden, Germany) (Figure 1). The airtight reactor construction fully ensured anaerobic conditions, and the heating controller ensured the reactor operation under the mesophilic temperature of 37.0 ± 0.5 °C. Entire biogas production lasted 90 days, including a ten-day run-up of the digestion process. A similar run-up duration was observed in the study [29], with semi-continuous anaerobic co-digestion of food waste with chicken manure. The semi-automated laboratory bioreactor system consisted of a 15-L glass vertical reactor (a reactional volume of 14 L) with electrical heating, an electric mixer, a biogas volume meter, and a biogas storage tank. The mixing cycle and temperature of the biogas reactor substrate were controlled automatically by the heating controller. The temperature and pH of the substrate and biogas yield data were recorded by a reactor programmable logic controller and stored in the internal database. The produced biogas was continuously counted with the RITTER TG 0.5 PLASTIC (Dr.-Ing. RITTER Apparatebau GmbH & Co. KG, Bochum, Germany, measurement accuracy ±0.5%) drum-type volumetric biogas flowmeter and continuously collected in a 25 L RESTEK (Restek Corporation, Bellefonte, PA, USA) bag of 25 L volume.
The collected biogas once a day was manually disconnected from the reactor and analysed with an AwiFlex biogas analyser (Awite Bioenergie GmbH, Langenbach, Germany, measurement: CH4 0–100%, ±0.2%; CO2 0–100%, ±0.2%; O2 0–25%, ±0.2%; H2S 0–10,000 ppm, ±5 ppm; H2 0–40,000 ppm, ±5 ppm). The spare bag was instead connected. Samples of the reactor feeding materials were weighted manually on electronic scales KERN EG4200-2NM (Kern & Shon GmbH, Balingen, Germany, accuracy ±0.02%). The pH of the raw material and the digested substrate was determined during each loading with a Hanna PH213 m (Hanna Instruments Ltd., Woonsocket, RI, USA, measurement accuracy ±0.01). Manure, fat, and digestate samples were sent to the accredited Agrochemical Research Laboratory of the Lithuanian Research Centre for Agriculture and Forestry for detailed composition analysis.

2.3. Biogas Production at Different OLRs

Biogas production at different OLRs was performed in four experiments (OLR3.0, OLR3.5, OLR4.0, and OLR4.5). Each experiment has been named as a stage (Stage I, Stage II, Stage III, and Stage IV) of the entire research. The first research stage was dedicated to digestate preparation, starting the digestion process and biogas production from raw, diluted chicken manure. The further three stages were dedicated to biogas production from raw, diluted chicken manure co-digestion with pig fat. In the first research stage, the reactor was fed with chicken manure at an OLR of 3.0 kg VS·(m3·day)−1. This OLR value was selected based on results and suggestions of an earlier study reported in [27,30]. In this case, the daily feeding input of the reactor consisted of 158.7 g of chicken manure and 240.7 g of hot tap water, setting up the total solods of feeding material of 10.5% and ensuring efficient substrate mixing and the appropriate distribution of organic matter inside the digester. The fat was used and added to the reactor in the further stages. The research with fat addition was conducted at three organic load rates: 3.5, 4.0, and 4.5 kg VS·(m3·day)−1. When biogas production had been stable for ten days, as suggested by [31], the composition of drained digestate was analysed for total solids (TS) and volatile solids (VS) determination. Such measurements of VS and TS allowed finding the OLR value when the increase of biogas production stopped [27], and further increasing of OLR would be less effective.

2.4. Analytical Objects

The entire anaerobic digestion process consists of many different parameters [27,32]. At first, the chemical composition and physical properties of raw material, feeding material, and drained digestate were analysed. Several essential parameters of biogas were used to indicate the biogas production process and to calculate the biogas production efficiency parameters. The chosen process indicatory parameters for biogas were: volumetric raw biogas production per day (Bdt), methane concentration in the raw biogas (Cm), and hydrogen sulphide concentration in the raw biogas (Cs). The methane yield (Mfm) obtained from the feeding material mass—L·kgFM−1, the specific methane yield (Mts) obtained from the feeding material total solids—L·kgTS−1, and the specific methane yield (Mvs) obtained from the feeding material volatile solids—L·kg VS−1 were calculated for comparative analysis of the results by the modified equations [25]:
Mfm = Cm·100−1·Bdt·m−1
Mts = Cm·100−1·Bdt·mts−1
Mvs = Cm·100−1·Bdt·mvs−1
where Bdt—the volume of biogas produced during the time interval (dt), in litres; m—the feeding material mass, kg; mts—the mass of total solids of the feeding material, in kilograms; mvs—the mass of volatile solids of the feeding material, in kilograms; Cm—the methane concentration in biogas, as a percentage.
The methane yield Mfm is an important parameter for calculations of the efficiency of biogas plant production. The specific methane yield Mts obtained from total solids allows the comparison of the same material containing different amounts of water. The specific methane yield Mvs is the most important parameter for comparing any feeding materials because Mvs indicates the possible extent of biodegradable material and shows how much material will degrade, depending on specific material chemical composition and physical features.
Basically, the biogas energy is determined by methane concentration in biogas. In our research, the methane energy value obtained from biomass biological conversion under anaerobic conditions EBG was calculated using ISO6976:2016 standard [33] to determine the parameters of a gas mix by formula:
EBG = Ʃ(En·Cn·100−1)
where En—the energy value of single gas presented in the biogas under standard conditions, MJ·(m3)−1; Cn—the concentration of single gas presented in the biogas, as a percentage.
According to ISO6976:2016, the calculation of natural gas energy evaluates the influence of any single gas presented in the natural gas mixture (biogas belongs to the gas mix). Every single gas has different properties, and each single gas influences the value of gas mix energy. In commercial gas (natural gas, biomethane, and biogas, too), the important parameter is Wobbe Index, which is not in a linear expression, thus it significantly changes, depending on carbon dioxide concentration especially. However, the high and low energy values of gas mixture depend less on other gases of the mixture and biogas energy usually is calculated by a simplified formula with an expression of methane energy multiplied by methane concentration in biogas only. The difference of such energy calculation is low when compared to ISO6976:2016 standard (less than 0.15%), and it is possible to calculate by the simplified formula [25].
The normality of the distribution and the differences between the variables were found from a sequence of the following measurement at the same OLR. After a change of OLR, the process stabilises within several days, and the biogas was produced with some deviations. In our experiment, we calculated the average value of the variable and the standard deviation at each OLR.

3. Results and Discussion

3.1. Raw Materials’ Characteristics

The main characteristics of materials used for anaerobic digestion and also found in similar studies [3,26,34,35,36] prescribe a content of total solids (TS), volatile (VS), carbon and nitrogen ratio (C/N), total ammonium nitrogen (TAN), total sulphur (S), and others, depending on study objectives. The composition of chicken manure (RM) and pig fat (FAT) exposed with anaerobic digestion in our experiments are given in Table 2. The features of the material investigated in our study were: TS and vs. content, total carbon, total nitrogen, total sulphur, and pH value. The TS content of the chicken manure we took away from a farm and investigated was 37.75% of raw material mass basis (RM); the VS Content—26.46% of RM; the total carbon—26.80% of RM; the total nitrogen—2.36% of RM; the TAN—0.55% of RM. According to the literature, chicken manure contains a high nitrogen concentration contributing to further TAN formation in a digested substrate [35,37,38]. Subsequently, the increase of TAN in digestate can inhibit biogas production. Sometimes, this inhibition leads to a complete stop of biogas production, as described in studies where nitrogen-rich materials were used [35,39,40]. The pH of RM was 7.80, indicating a slight move to alkaline substances. It is predictable because the higher TAN in the material influences its pH [38,41]. The chemical element of total sulphur was 0.39% of RM. Sulphur contributes to unwanted and harmful pollutant formation in biogas production—hydrogen sulphur (H2S). In our case, the total sulphur wasn’t as high as in the cases where protein-rich materials were used for biogas production [42]. Pig fat mainly consisted of VS content (99.96% of RM), which was constituted by high carbon amount (86.0% of RM). Such a high number of VS concentrations allowed us to use pig fat in low amounts for OLR increases. Furthermore, the high amount of carbon helps to improve the C/N ratio; thus, biogas production increases [24,26,27,43]. The analysis of fat properties shows that fat consists of two times more sulphur than the chicken manure we used, but such an amount of sulphur slightly changes the overall sulphur percentage in the feeding dose because of a small fraction of fat added.

3.2. Biogas Production at Different OLRs

Biogas production was carried out in anaerobic digestion under mesophilic conditions. This digestion process involves a metabolism hierarchy between microbial populations, where the hydrolysing bacteria, acetogens, acidogens, and methanogens are the leading players. All microbes differ in morphology, optimum growth conditions, final product formation, sensitivity to changing microenvironments, and require personal conditions to survive. All those conditions are widely described in scientific literature, but authors continue new findings in relations between microbes and investigate obstacles in their lives [44,45,46,47]. Therefore, the monitoring and controlling of essential biogas production parameters ensures a healthy balance between microbial populations responsible for different processes. The task of achieving a steady, effective, and productive anaerobic digestion process is a driver in finding improvements for biogas production in both our and other studies [48,49,50].
The first and highly important parameter of biogas production is the biogas yield at any biogas production scale. Figure 2 depicts the daily raw biogas production rate throughout the entire experiment. The four stages presented in the diagram of clustered columns indicate the biogas production change at different OLRs. In the first experiment stage, the biogas production started at OLR 3.0 kg VS·(m3·day)−1 on the basis of a WWTP inoculum, adding diluted chicken manure.
On the first day of the experiment, the biogas production rate was the lowest, but increased within the following days. However, the growth was not steep, and the biogas production range reached the highest value of 491.2 L/kg VS on the seventh day of the experiment. This slower growth of biogas yield can be explained due to the change of organic matter of feeding material from WWTP sewage to chicken manure. When the feeding material changes, the microbe population needs time to adapt to new organic structures and for the new population development, as reported by literature [34,35]. After a run-up of ten days, the biogas production rate stabilised at the average value of 434.2 ± 34.7 L·kg VS−1, which became a reference for further experiments. In the second stage, when OLR was increased to 3.5 kg VS·(m3·day)−1 by fat addition, biogas production started slowly to grow and reached the highest value of 557.2 L·kg VS−1, but finally settled on an average biogas production rate of 494.4 ± 42.2 L·kg VS−1. This slow growth of biogas production rate can be explained due to the change of organic matter of feeding material after fat addition. The microbe population needs time to adapt to new organic structures and time for the new population to be developed because microbe populations differ in different environments, as reported by [51]. Some studies reported this phenomenon [38,52,53] too, and according to the authors, there is a lag in the biological activity of microorganisms living on certain digestion products in the biogas reactor [43,51,54].
In the two following stages of the experiment, when OLR was increased to 4.0 and 4.5 kg VS·(m3·day)−1, the increase in biogas production rate was steeper at the beginning of OLR change than in the previous stages of the experiment. The duration of reaching the highest biogas production rate value was shorter and lasted five days in the third stage and three days in the fourth stage. This greater performance of biogas production can be explained by relying on the same literature mentioned above. In these cases of the third and fourth stages, the organic composition of feeding matter was the same as in the second stage, with only one exclusion of fat concentration, which had been changing because of the increasing of OLR. In the third and fourth stages, germs did not need to adapt to new organic matter but had to adjust to the new OLR of the feeding material only. Every OLR increase with fat addition contributed and corresponded to a biogas yield increase at all OLRs. The average biogas production at an OLR of 4.0 and 4.5 kg VS·(m3·day)−1 was 629.1 ± 29.9 and 708.4 ± 14.5 L·kg VS−1, respectively. A pick of biogas yield rate was obtained at the OLR of 4.5 kg VS·(m3·day)−1, reaching 733.8 L·kg VS−1.

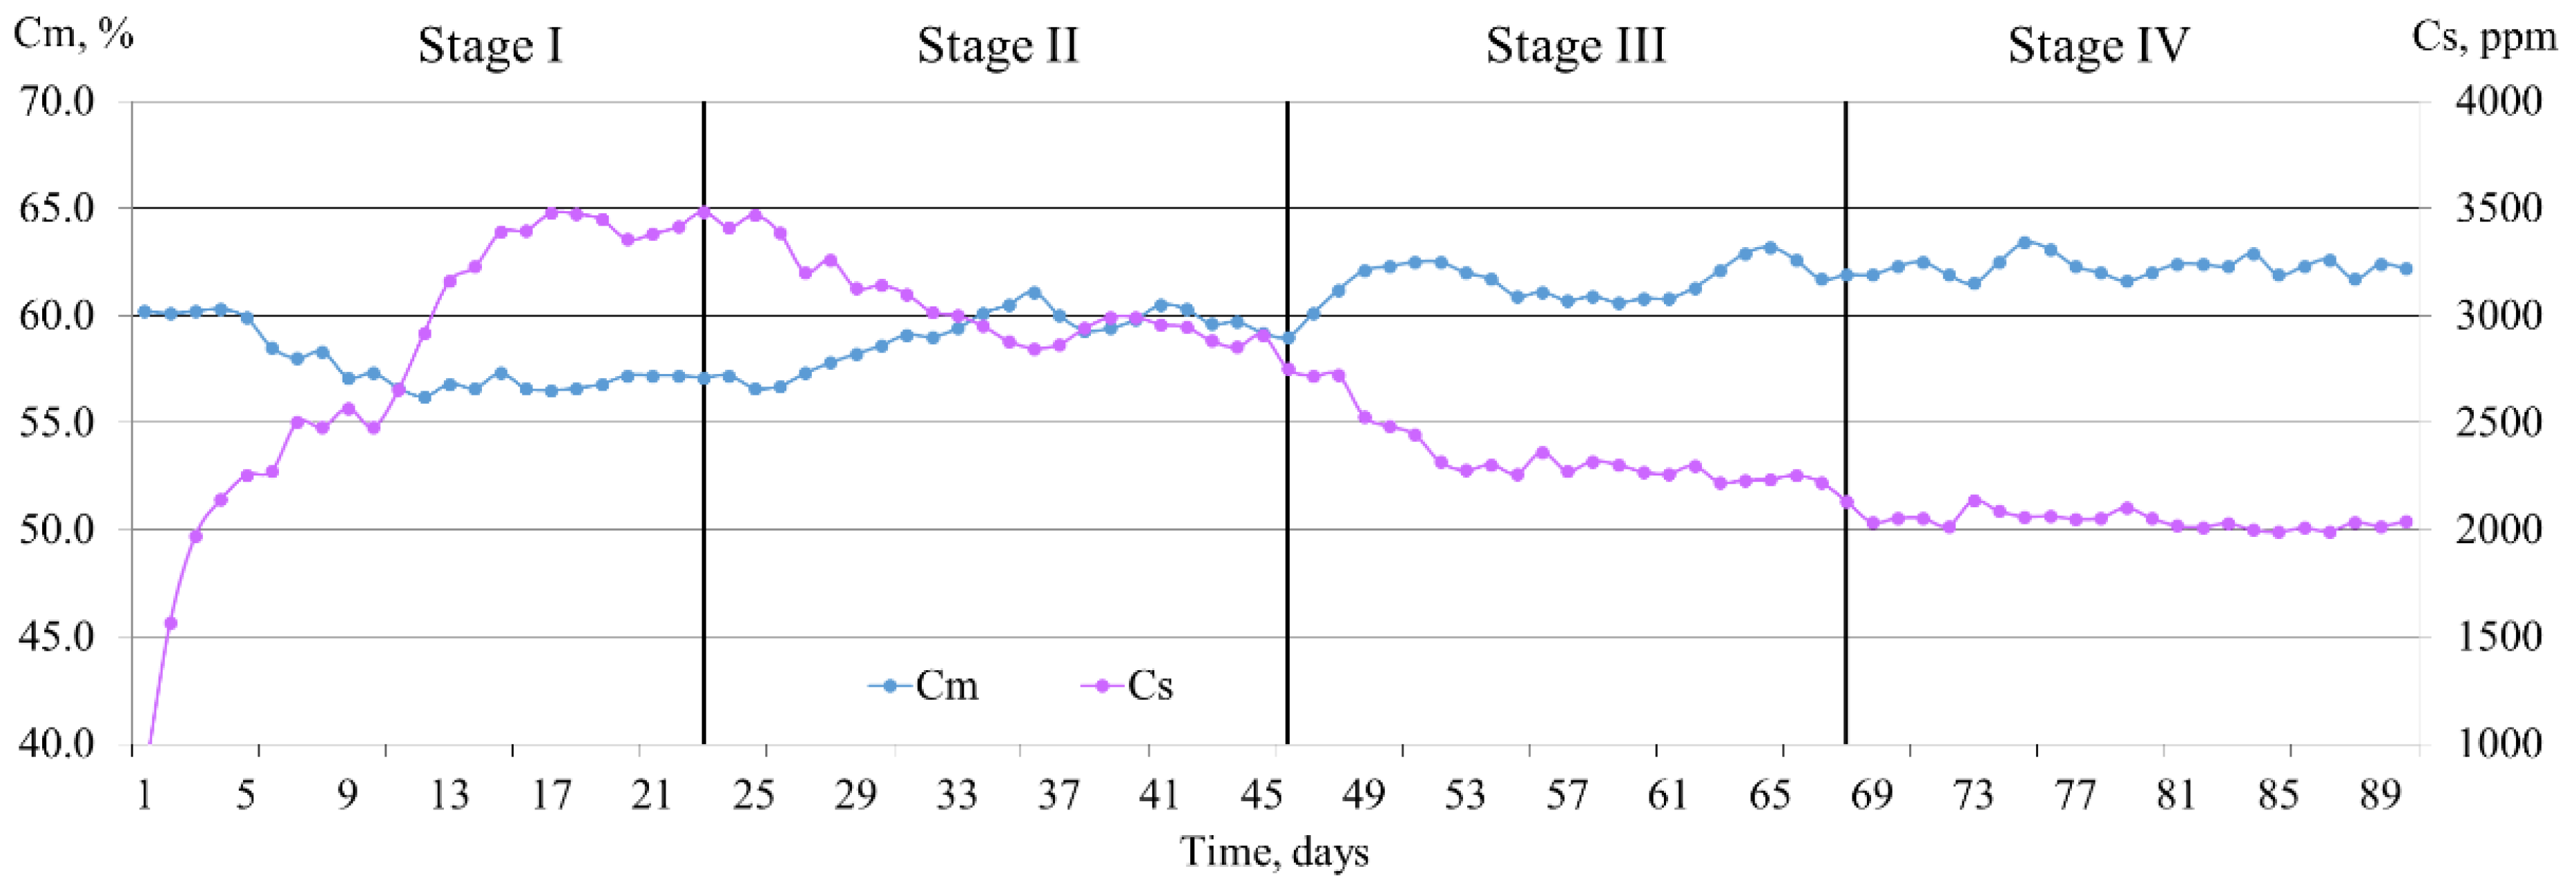
3.3. Main Changes in Biogas Composition

The methane concentration in biogas is undoubtedly the second important parameter of biogas production. However, any single gas in biogas composition plays a role when biogas is used either for burning, purification, or other purposes. Almost in all further use of biogas, because it is treated as a substitute for natural gas, biogas contaminants such as hydrogen sulphide (H2S) and water vapour have to be always removed. According to the literature [49], in conventional continuously fed biogas reactors or biogas plants under anaerobic conditions, the methane concentration usually varies between 55% and 65%. In some cases, the methane concentration can reach up to 70% [55], depending on feeding material composition, digestion conditions, and activity of the microbiological community [56,57,58]. In a review [59], we can even find numbers of methane concentrations reaching up to 80%.
The CH4 and H2S concentrations (Cm and Cs) of daily biogas produced have changed throughout the research (Figure 3). In the stage of OLR 3.0 kg VS·(m3·day)−1, the Cm was the highest at the beginning of the experiment, when we started feeding the rector with diluted chicken manure only, but within several days this slightly dropped, and the value settled on an average of 57.8 ± 1.4%. This value of Cm, such as biogas production rate, was used as a reference for the following experiments. The drop of Cm value can be explained due to the change of organic matter of feeding material [34,35], such as the run-up of biogas production rate was explained. In the second stage, when we added fat to the feeding material for an OLR increase to 3.5 kg VS·(m3·day)−1, the Cm value lifted and, after reaching the highest level of 61.1%, settled on an average level of 59.0 ± 1.3%. The ramping up of Cm value at the beginning of the stage was longer than in other stages, indicating the bacterial community change, referring to the publications [60,61]. In the third stage, after OLR increased, the Cm value lifted too and reached the highest level of 63.2%. The lowest Cm value was reached at a level of 59.0%, and the average-level of 61.5 ± 1.0%. In the fourth stage of the experiment, at OLR of 4.5 kg VS·(m3·day)−1, we observed the highest average Cm value of 62.3 ± 0.5%.
Meanwhile, the Cs value in biogas had reversed curve character when compared to the Cm value curve. The H2S always presents in biogas because sulphur presents in feeding material in more or fewer amounts [35,38,49,62,63]. Even a low concentration of H2S is toxic to methanogens, and researchers are still trying to find techniques that could mitigate the sulphur impact on biogas production [62,64]. This means that biogas production requires the constant monitoring of H2S concentration and finding control measures to avoid inhibition of the digestion process. Fat addition did not increase H2S concentration in biogas, and we did not need additional measures to be applied for H2S reduction. If the Cm value rose at any OLR increase, the Cs value dropped with every OLR increase in all our experiments. This decrease in Cs can be explained because the sulphur percentage in feeding material mass did not change after fat addition. The sulphur formation rate was left at the same level while the CH4 and CO2 production in biogas increased. This increased amount of biogas diluted H2S gas and diminished H2S concentration. The second parameter influencing the H2S concentration in biogas is the pH of the substrate, because the pH of the substrate determines gaseous H2S and ionic HS relations in the substrate [65]. In our experiment, the H2S change strongly corresponded to the reverse of the Cm change (p < 0.05). The authors of another study [35] claim similar results. In the first stage of our research, the Cs value was the highest, but during the experiments almost halved. The pick of the Cs value 3479 ppm was spotted in the first stage, when digesting diluted chicken manure only, but the Cs dropped after each OLR increase. At the end of the research, the lowest Cs value was observed. It reached 2045 ± 39 ppm on average when chicken manure was co-digested with pig fat at OLR of 4.5 kg VS·(m3·day)−1. Such a constant drop of H2S in biogas showed that pig fat addition augmented biogas quality, and less treatment expenditure of biogas would be needed in further biogas usage.

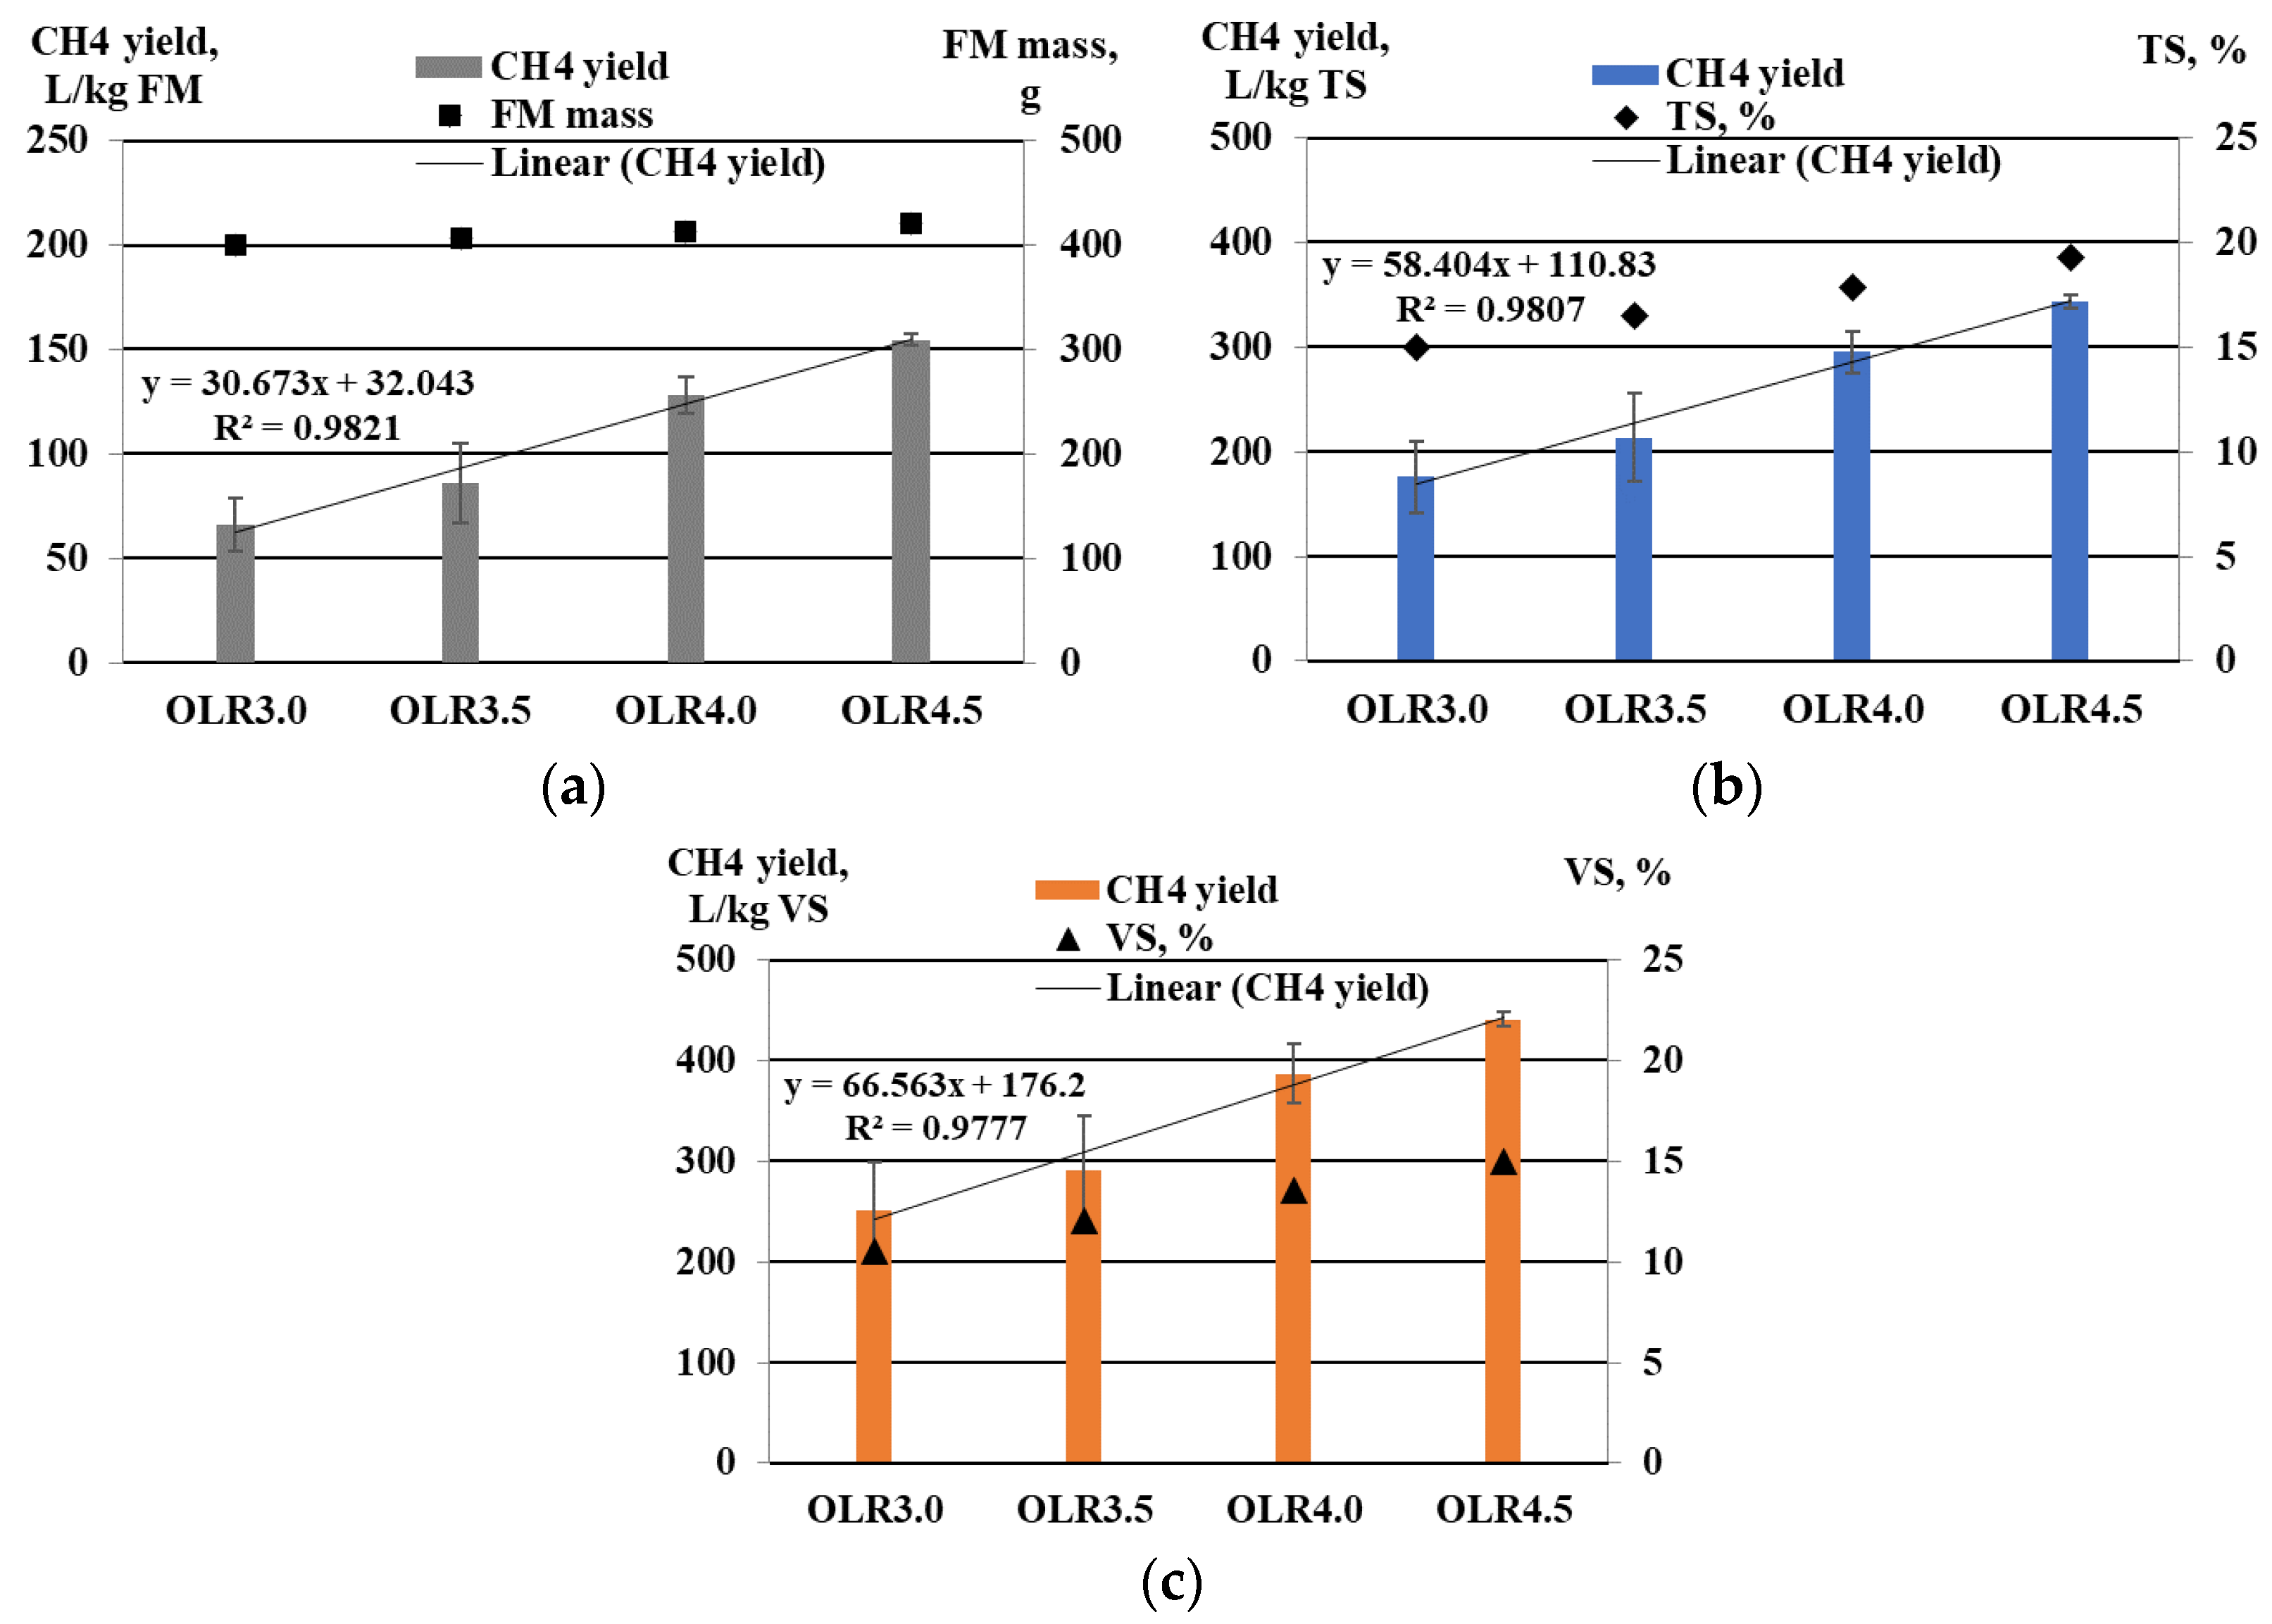
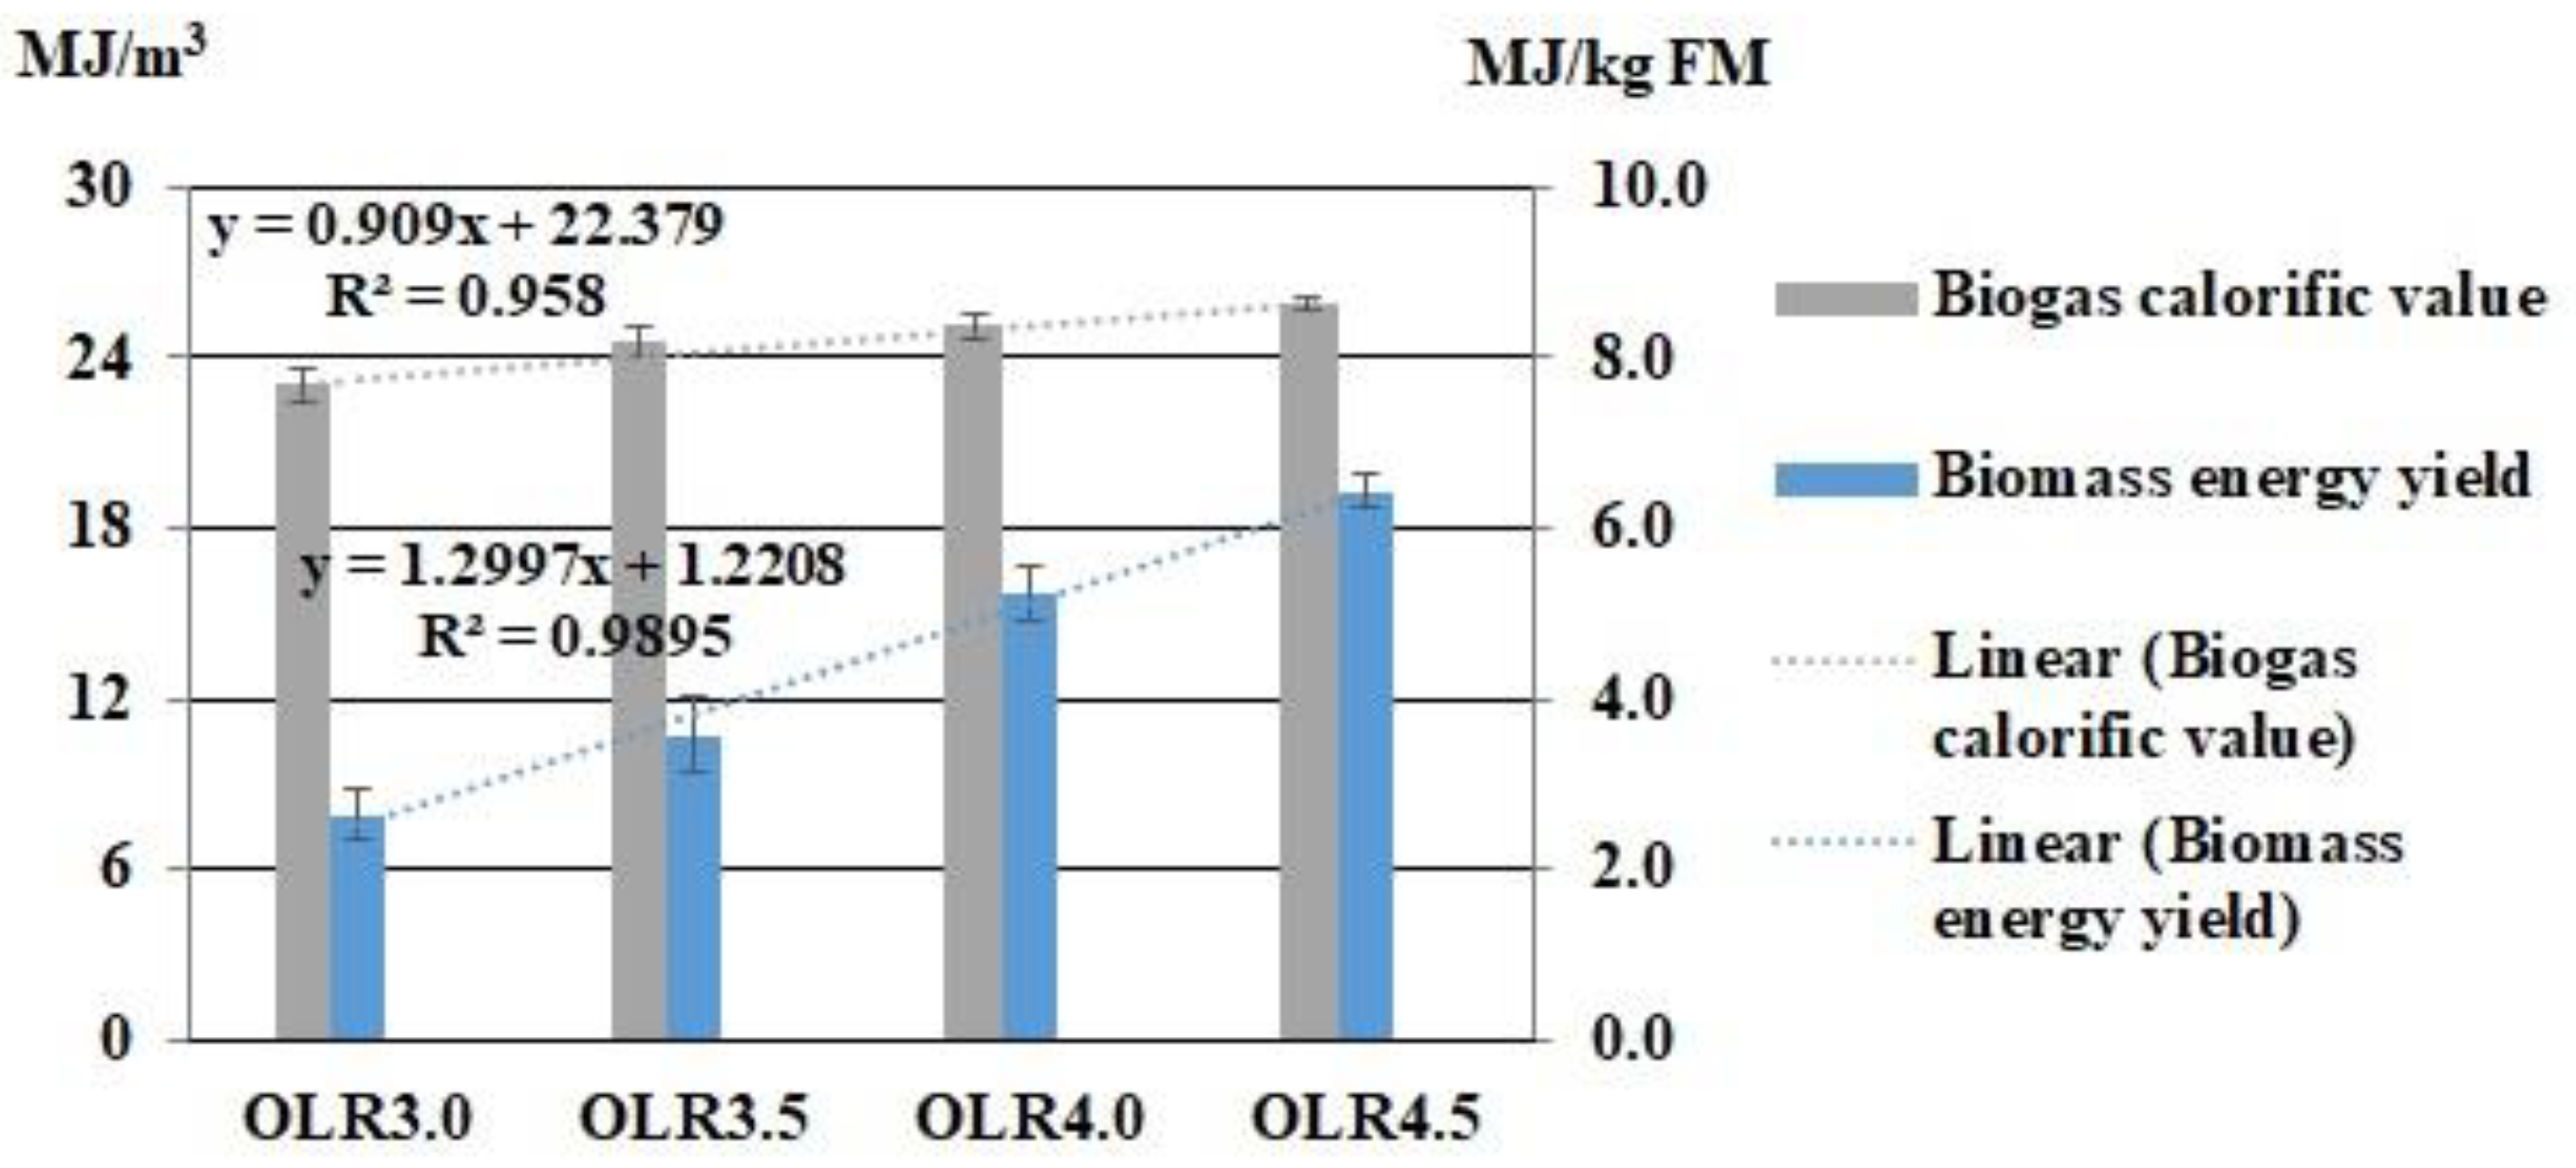
3.4. Biogas Production Indicators

The change of the methane yield Mfm, specific methane yield Mts, and Mvs on an average daily biogas basis at different OLRs is given in Figure 4. In our study, the methane yield Mfm (Figure 4a), the methane yield Mts (Figure 4b), and the methane yield Mvs (Figure 4c) increased at every OLR after fat addition. The highest methane yield obtained from the daily biogas basis corresponded to the highest OLR of 4.5 kg VS·(m3·day)−1. At this OLR, the Mfm, Mts, and Mvs were on average 154.6 ± 3.1 L·kg FM−1, 343.2 ± 6.8 L·kg TS−1 and 441 ± 7.1 L·kg VS−1, respectively. However, the change of FM mass (biomass) at this OLR was comparatively low because the added fat increased the FM mass by 5.26% only.
The experiment results also showed that the methane production curve resembled the biogas production curve. This similarity was due to the counting of methane yield by Formula (4), where two essential components (biogas yield and methane concentration) played a role and determined methane yield. Biogas yield increased more considerable than methane concentration, and the methane yield curve repeated the curve character of biogas yield. Although methane concentration increased too, its increase was too weak to remarkably influence methane yield curve character.
According to the studies reviewed [66,67,68,69], carbon-rich material addition to the digested substance significantly affected the methane concentration increase, but we could not increase methane concentration in our experiment as expected. From our point of view, the Cm is a very important parameter if biogas is used in biogas upgrading and biomethane is produced. As much methane raw biogas consists of less energy and other expenditures, we will need further methane purification technologies. Despite the fact that we had a low increase of Cm, overall, the methane yield increase met our expectations.
Figure 5 illustrates the average energy value of biogas obtained, Eb, and the average energy value obtained from feeding material Efm at different OLRs was investigated. In evaluating the energy potential of biogas produced, the experiment showed that the energy of one cubic meter of biogas increased at every OLR. The result was the best at the highest OLR of 4.5 kg·(m3·day)−1, reaching 25.9 ± 0.2 MJ·(m3)−1. The highest biomass energy value obtained from one kilogram of feeding material was 6.43 ± 0.05 MJ·kgFM−1 at the same OLR of 4.5 kg·(m3·day)−1. The reference energy values were obtained in the first stage at OLR 3.0 kg·(m3·day)−1; 23.1 ± 0.6 MJ·(m3)−1, and 2.63 ± 0.07 MJ·kgFM−1, respectively. In our study, the energy of biogas increased at every OLR. This increase was not proportional to the rise of fat addition, showing a synergistic relationship between the primary feeding material and added supplement. The other studies also describe a similar synergetic phenomenon [70,71].
Basically, fat addition to chicken manure improved biogas production, and an increase in many parameters were observed (Table 3). According to the methodology of this study, the increase (in percent) of OLR and the feeding material mass directly depended on added fat quantity. Still, the specific methane yield Mvs was not proportional to OLR increase. At OLR 3.5 kg·(m3·day)−1, the Mvs and OLR ratio was around 3:2, but at the OLR 4.5 kg·(m3·day)−1, this ratio became much higher and reached more than 4:2. So, this change to a higher ratio at higher OLR implied the synergistic relationship between primary feeding material and added supplement.

3.5. Fat Influence on Digestated Substrate Changes

Biogas production depends on many digested substrate features and digestion process conditions in anaerobic digestion. We can monitor and instantly control some process factors, such as substrate flow, temperature, or agitation. However, monitoring and controlling the digestion process depending on the change in substrate features and bacteria behaviour is not easy. The analysis of substrate features and parameters is needed to follow digestion process performance and stability factors. The most analysed parameters for that purpose are the TS, VS, pH, and TAN.

3.5.1. Digestate pH and TAN

While the composition of the digested substrate impacts microbe population growth and nourishment for biogas production, the pH of the digestate supports acclimatization of the bacteria population and facilitates the uptake of specific nutrients for organisms. Furthermore, the pH of the anaerobic digester affects the mass transfer rate, thus impacting digestion performance. The carbohydrates, lipids, and proteins supply nutrients to microorganisms, maintaining a carbon-to-nitrogen ratio (C/N). The proteins are the primary source of nitrogen upon degradation into ammonia. The free ammonia (NH3) and ammonium ions (NH4+) are the degradation end-products of the protein: amino acids and urea. For example, a high level of proteins can come from meat products, leading to a lower C/N ratio and process instability. In the substrates containing a high concentration of ammoniacal nitrogen, pH determines the free ammonia (NH3) and ionized ammonia (NH4+) ratio [72] and free hydrogen sulphide (H2S) and ionized sulphide (HS) ratio as well. When pH goes down, the inhibition of H2S can occur; when it goes up, the inhibition of NH3 can occur. H2S plays a role in digestate and biogas. Ammoniacal nitrogen (N-NH4+), as total ammoniacal nitrogen (TAN), acts in digestate. In the biogas, the gaseous NH3 presents only in low concentrations [25]. Such concentrations do not make an essential impact on biogas quality and do not restrict biogas from being used. Additionally, TAN does not change significantly even at higher OLRs and can remain relatively stable throughout the entire biogas production period.
According to a study [73], the anaerobic digestion process can proceed well around TAN of 6000 mg·L−1, but it is also reported in another study [74] that TAN concentration can increase to 8000 mg·L−1 because methanogens are able to acclimatize to increasing TAN with time. In our experiments, TAN was at the level of 3500–4600 mg·L−1 and did not play any role in inhibiting the digestion process. Some literature [65] suggested a pH of 6.8–7.5 as suitable for the methanogen population in manure co-digestion. However, through our experiment, the pH value was in the range of 7.8–8.0, and the digestion process seemed to be stable with no inhibitions. The highest pH value of 8.0 ± 0.1 on average was observed in the fourth stage at the highest OLR when biogas yield rate and Cm value were the highest too. The pH value of 7.8 ± 0.1 on average was the same in the first three stages.

3.5.2. TS Reduction and VS Consumption

The TS reduction and VS consumption in the digested substrate after being drained from the reactor are given in Figure 6. The best performance of TS reduction and VS consumption was observed in the stage of 4.0 kg VS·(m3·day)−1. The TS reduction and the VS consumption were the greatest and reached 70.3 and 74.7%, respectively. However, the worst performance of TS reduction and VS consumption was observed in the stage of 4.5 kg VS·(m3·day)−1. At this OLR, we expected to get much better TS reduction and VS consumption because biogas yield reached the highest level of the entire experiment. However, in our experiments, we found the VS consumption at OLR of 4.5 kg VS·(m3·day)−1 less effective than at organic load rates of 3.5 kg and 4.0 kg VS·(m3·day)−1. The TS reduction and the VS consumption at OLR 4.5 kg VS·(m3·day)−1 reached 63.1 and 66.4%, respectively. It was even below what was observed at the lowest OLR of 3.0 kg VS·(m3·day)−1 when only diluted chicken manure was digested. This indication of worse digestion stopped us from going to higher OLR, avoiding reactor overload. Overload of the reactor with further OLR increases can lead to decreased biogas production. Other authors [49,50,75,76] described such reactor overloading processes in their studies. In our study, the best performance of TS reduction and VS consumption was at the OLR of 4.0 kg VS·(m3·day)−1.
The changes in the TS and VS concentration at the end of each research experiment are given in Table 4. Both parameters indicate around the same values in the first three experiments (OLR3.0, OLR3.5, and OLR4.0): TS reduction is around 5.43%, and VS consumption is about 3.70%. In the last experiment at OLR of 4.5 kg VS·(m3·day)−1, TS reduction and VS consumption became significantly worse at 7.11 and 5.03, respectively. However, the biogas production was still increasing, but a further increase in TS and VS concentration in the digestate could impact biogas production.
The similar change in the tendency and character of TS and VS justifies that TS and VS are relevant parameters. The results of TS measurement we can obtain within a few hours after the digestate is drained, the instruments for TS evaluation are pretty simple, not expensive, and every biogas plant and laboratory can afford to have them on hand. However, the VS measurement results are more complicated, requiring costly instruments, and obtaining the results after a few days. Many biogas plants and even some academic laboratories cannot afford VS analysers and buy outsourcing services from larger-scale laboratories instead. Obtaining analysis this way extends VS measurement time and does not allow the making of any rapid corrections to the digestion process if VS analysis indicates the bad performance of the digestion process. Relying on our experiment and following other authors [76], we recommend monitoring TS reduction constantly or regularly as often as possible in real-scale biogas plants as a measure for reactor overload prevention.

4. Conclusions

Though fat is a biodegradable organic material, it decomposes very slowly, and anaerobic digestion of single fat is impossible. However, the research results showed that pure pig fat used in co-digestion with chicken manure was feasible, justifying fat waste utilisation possibility through anaerobic co-digestion.
Pig fat as a supplement for primary substrate increased organic load rate in the biogas reactor and significantly enhanced biogas production, contributing to biogas yield, methane concentration, and overall methane yield increase in the biogas at all organic load rates investigated. In our case, fat addition directly and significantly impacted the rise of biomass energy obtained. The highest biogas yield of 246.9 ± 5.8 L·kg VS−1, the highest methane concentration of 62.3 ± 0.5%, and the highest biomass energy of 6.43 ± 0.05 MJ·kg FM−1 obtained corresponded to the highest OLR of 4.5 kg VS·(m3·day)−1. However, the increase in the biogas calorific value was weak because fat addition did not change the methane concentration significantly.
The inhibitory indicators such as hydrogen sulphide concentration in biogas and total ammonia nitrogen in the digestate were presented in low concentrations and did not play an essential role in biogas production quality. The pH of digestate being on a stable level (varied in the range of 7.8–8.0) also justified that fat addition did not show any signs of possible process inhibition.
Despite overall biogas production increase at each OLR investigated, the TS reduction and VS consumption were the greatest at an OLR of 4.0 kg VS·(m3·day)−1, reaching 70.3 and 74.7%, respectively. However, the TS reduction and the VS consumption dropped at OLR of 4.5 kg VS·(m3·day)−1 to the lowest level of the entire research, reaching 63.1 and 66.4% only. This drop implied further OLR increases, with such pig fat addition approaches to limit the effective digestion process and, subsequently, biogas production. According to our research results, the TS reduction and VS consumption could be highlighted as the monitoring indicators for biogas production performance as an additional measure for predicting the efficiency of substrate co-digestion. Optimising costs of expensive substrate material analysis, TS only can be analysed by controlling digestion process efficiency instead of both (TS and VS) because TS and VS changes in the digestate have the same tendencies and are related parameters.
In our work, waste management problems, the demand for renewable energy, and the lack of appropriate utilisation technology of fats still exist. The extensive literature on the so-called FOG (fat, oil, grease) utilisation issues shows that scientists are still searching for new, sustainable, and effective ways to solve such global problems. Our research targeted the implementation of anaerobic co-digestion in existing and new-built chicken manure driven biogas plants. The results of our work provide new knowledge about the process investigated, revealed parameters to be controlled for obtaining additional value in a commercial scale, and environmental benefits in having a new option to solve the FOG utilisation problem.

Author Contributions

Conceptualization, K.N. and E.B.; methodology, E.B. and B.Ž.; investigation, M.R.; resources, E.B. and V.Ž.; writing—original draft preparation, E.B.; writing—review and editing, K.V. All authors have read and agreed to the published version of the manuscript.

Funding

This research received no external funding.

Institutional Review Board Statement

Not applicable.

Informed Consent Statement

Not applicable.

Data Availability Statement

Not applicable.

Acknowledgments

The authors acknowledged the support received from Vytautas Magnus University, Agriculture Academy.

Conflicts of Interest

The authors declare no conflict of interest.

References

  1. Palacios-Lopez, D.; Bachofer, F.; Esch, T.; Heldens, W.; Hirner, A.; Marconcini, M.; Sorichetta, A.; Zeidler, J.; Kuenzer, C.; Dech, S.; et al. New Perspectives for Mapping Global Population Distribution Using World Settlement Footprint Products. Sustainability 2019, 11, 6056. [Google Scholar] [CrossRef] [Green Version]
  2. Gu, D.; Andreev, K.E.; Dupre, M. Major Trends in Population Growth Around the World. China CDC Wkly. 2021, 3, 604–613. [Google Scholar] [CrossRef]
  3. Delabre, I.; Rodriguez, L.O.; Smallwood, J.M.; Scharlemann, J.P.W.; Alcamo, J.; Antonarakis, A.S.; Rowhani, P.; Hazell, R.J.; Aksnes, D.L.; Balvanera, P.; et al. Actions on Sustainable Food Production and Consumption for the Post-2020 Global Biodiversity Framework. Sci. Adv. 2021, 7, eabc8259. [Google Scholar] [CrossRef]
  4. Shahbandeh, M. Number of Chickens Worldwide from 1990 to 2020. Statista, Online Resource. 2022. Available online: https://www.statista.com/statistics/263962/number-of-chickens-worldwide-since-1990/ (accessed on 6 April 2022).
  5. Otero, A.; Mendoza, M.; Carreras, R.; Fernández, B. Biogas Production from Slaughterhouse Waste: Effect of Blood Content and Fat Saponification. Waste Manag. 2021, 133, 119–126. [Google Scholar] [CrossRef]
  6. European Commission. Best Available Techniques (BAT) Reference Document for the Slaughterhouses, Animal By-Products and Edible Co-Products Industries. Industrial Emissions Directive 2010/75/EU. 2021. Available online: https://eippcb.jrc.ec.europa.eu/sites/default/files/2021-06/SA-BREF-20210629.pdf (accessed on 6 April 2022).
  7. European Commission. Best Available Techniques in the Slaughterhouses and Animal By-Products Industries. Reference Document. 2005. Available online: https://eippcb.jrc.ec.europa.eu/reference/slaughterhouses-and-animals-products-industries (accessed on 6 April 2022).
  8. Toldrá-Reig, F.; Mora, L.; Toldrá, F. Trends in Biodiesel Production from Animal Fat Waste. Appl. Sci. 2020, 10, 3644. [Google Scholar] [CrossRef]
  9. Rasheed, T.; Anwar, M.T.; Ahmad, N.; Sher, F.; Khan, S.U.-D.; Ahmad, A.; Khan, R.; Wazeer, I. Valorisation and Emerging Perspective of Biomass Based Waste-to-Energy Technologies and Their Socio-Environmental Impact: A Review. J. Environ. Manag. 2021, 287, 112257. [Google Scholar] [CrossRef] [PubMed]
  10. Esteves, E.M.M.; Herrera, A.M.N.; Esteves, V.P.P.; Morgado, C.d.R.V. Life Cycle Assessment of Manure Biogas Production: A Review. J. Clean. Prod. 2019, 219, 411–423. [Google Scholar] [CrossRef]
  11. Baral, K.R.; Jégo, G.; Amon, B.; Bol, R.; Chantigny, M.H.; Olesen, J.E.; Petersen, S.O. Greenhouse Gas Emissions during Storage of Manure and Digestates: Key Role of Methane for Prediction and Mitigation. Agric. Syst. 2018, 166, 26–35. [Google Scholar] [CrossRef]
  12. Ali, J.; Rasheed, T.; Afreen, M.; Anwar, M.T.; Nawaz, Z.; Anwar, H.; Rizwan, K. Modalities for Conversion of Waste to Energy—Challenges and Perspectives. Sci. Total Environ. 2020, 727, 138610. [Google Scholar] [CrossRef] [PubMed]
  13. United Nations. Paris Agreement. Document. 2015. Available online: https://unfccc.int/process-and-meetings/the-paris-agreement/the-paris-agreement (accessed on 6 April 2022).
  14. Anaya Menacho, W.; Mazid, A.M.; Das, N. Modelling and Analysis for Biogas Production Process Simulation of Food Waste Using Aspen Plus. Fuel 2022, 309, 122058. [Google Scholar] [CrossRef]
  15. Mekonnen, M.M.; Gerbens-Leenes, W. The Water Footprint of Global Food Production. Water 2020, 12, 2696. [Google Scholar] [CrossRef]
  16. Koul, B.; Yakoob, M.; Shah, M.P. Agricultural Waste Management Strategies for Environmental Sustainability. Environ. Res. 2022, 206, 112285. [Google Scholar] [CrossRef]
  17. Pawlak, K.; Kołodziejczak, M. The Role of Agriculture in Ensuring Food Security in Developing Countries: Considerations in the Context of the Problem of Sustainable Food Production. Sustainability 2020, 12, 5488. [Google Scholar] [CrossRef]
  18. Gołasa, P.; Wysokiński, M.; Bieńkowska-Gołasa, W.; Gradziuk, P.; Golonko, M.; Gradziuk, B.; Siedlecka, A.; Gromada, A. Sources of Greenhouse Gas Emissions in Agriculture, with Particular Emphasis on Emissions from Energy Used. Energies 2021, 14, 3784. [Google Scholar] [CrossRef]
  19. European Commission. Proposal for Amending Directive (EU) 2018/2001 of the European Parliament and of the Council, Regulation (EU) 2018/1999 of the European Parliament and of the Council and Directive 98/70/EC of the European Parliament and of the Council as Regards the Promotion of Energy from Renewable Sources, and Repealing Council Directive (EU) 2015/652. Document. 2021. Available online: https://eur-lex.europa.eu/resource.html?uri=cellar:dbb7eb9c-e575-11eb-a1a5-01aa75ed71a1.0001.02/DOC_1&format=PDF (accessed on 6 April 2022).
  20. Cheng, D.; Liu, Y.; Ngo, H.H.; Guo, W.; Chang, S.W.; Nguyen, D.D.; Zhang, S.; Luo, G.; Bui, X.T. Sustainable Enzymatic Technologies in Waste Animal Fat and Protein Management. J. Environ. Manag. 2021, 284, 112040. [Google Scholar] [CrossRef]
  21. Hafid, H.S.; Omar, F.N.; Abdul Rahman, N.; Wakisaka, M. Innovative Conversion of Food Waste into Biofuel in Integrated Waste Management System. Crit. Rev. Environ. Sci. Technol. 2021. [Google Scholar] [CrossRef]
  22. Zieniuk, B.; Mazurczak-Zieniuk, P.; Fabiszewska, A. Exploring the Impact of Lipid-Rich Food Industry Waste Carbon Sources on the Growth of Candida Cylindracea DSM 2031. Fermentation 2020, 6, 122. [Google Scholar] [CrossRef]
  23. Diamantis, V.; Eftaxias, A.; Stamatelatou, K.; Noutsopoulos, C.; Vlachokostas, C.; Aivasidis, A. Bioenergy in the Era of Circular Economy: Anaerobic Digestion Technological Solutions to Produce Biogas from Lipid-Rich Wastes. Renew. Energy 2021, 168, 438–447. [Google Scholar] [CrossRef]
  24. Liu, M.; Wei, Y.; Leng, X. Improving Biogas Production Using Additives in Anaerobic Digestion: A Review. J. Clean. Prod. 2021, 297, 126666. [Google Scholar] [CrossRef]
  25. Rubežius, M.; Venslauskas, K.; Navickas, K.; Bleizgys, R. Influence of Aerobic Pretreatment of Poultry Manure on the Biogas Production Process. Processes 2020, 8, 1109. [Google Scholar] [CrossRef]
  26. Zhang, W.; Kong, T.; Xing, W.; Li, R.; Yang, T.; Yao, N.; Lv, D. Links between Carbon/Nitrogen Ratio, Synergy and Microbial Characteristics of Long-Term Semi-Continuous Anaerobic Co-Digestion of Food Waste, Cattle Manure and Corn Straw. Bioresour. Technol. 2022, 343, 126094. [Google Scholar] [CrossRef]
  27. Nkuna, R.; Roopnarain, A.; Rashama, C.; Adeleke, R. Insights into Organic Loading Rates of Anaerobic Digestion for Biogas Production: A Review. Crit. Rev. Biotechnol. 2021, 1–21. [Google Scholar] [CrossRef]
  28. Ao, T.; Chen, L.; Chen, Y.; Liu, X.; Wan, L.; Li, D. The Screening of Early Warning Indicators and Microbial Community of Chicken Manure Thermophilic Digestion at High Organic Loading Rate. Energy 2021, 224, 120201. [Google Scholar] [CrossRef]
  29. Wang, M.; Sun, X.; Li, P.; Yin, L.; Liu, D.; Zhang, Y.; Li, W.; Zheng, G. A Novel Alternate Feeding Mode for Semi-Continuous Anaerobic Co-Digestion of Food Waste with Chicken Manure. Bioresour. Technol. 2014, 164, 309–314. [Google Scholar] [CrossRef]
  30. Arriagada, C.B.; Sanhueza, P.F.; Guzmán-Fierro, V.G.; Medina, T.I.; Fernández, K.F.; Roeckel, M.D. Efficient Poultry Manure Management: Anaerobic Digestion with Short Hydraulic Retention Time to Achieve High Methane Production. Poult. Sci. 2019, 98, 6636–6643. [Google Scholar] [CrossRef]
  31. Hu, Y.; Ma, H.; Shi, C.; Kobayashi, T.; Xu, K.-Q. Nutrient Augmentation Enhances Biogas Production from Sorghum Mono-Digestion. Waste Manag. 2021, 119, 63–71. [Google Scholar] [CrossRef]
  32. Wu, D.; Peng, X.; Li, L.; Yang, P.; Peng, Y.; Liu, H.; Wang, X. Commercial Biogas Plants: Review on Operational Parameters and Guide for Performance Optimization. Fuel 2021, 303, 121282. [Google Scholar] [CrossRef]
  33. International Organization for Standardization. Natural Gas—Calculation of Calorific Values, Density, Relative Density and Wobbe Indices from Composition. Standard ISO 6976:2016. 2016. Available online: https://www.iso.org/standard/55842.html (accessed on 6 April 2022).
  34. Almeida, P.V.; Rodrigues, R.P.; Teixeira, L.M.; Santos, A.F.; Martins, R.C.; Quina, M.J. Bioenergy Production through Mono and Co-Digestion of Tomato Residues. Energies 2021, 14, 5563. [Google Scholar] [CrossRef]
  35. Rubežius, M.; Bleizgys, R.; Venslauskas, K.; Navickas, K. Influence of Biological Pretreatment of Poultry Manure on Biochemical Methane Potential and Ammonia Emission. Biomass Bioenergy 2020, 142, 105815. [Google Scholar] [CrossRef]
  36. Song, L.; Li, D.; Cao, X.; Tang, Y.; Liu, R.; Niu, Q.; Li, Y.-Y. Optimizing Biomethane Production of Mesophilic Chicken Manure and Sheep Manure Digestion: Mono-Digestion and Co-Digestion Kinetic Investigation, Autofluorescence Analysis and Microbial Community Assessment. J. Environ. Manag. 2019, 237, 103–113. [Google Scholar] [CrossRef]
  37. Rizzo, P.F.; Bres, P.A.; Young, B.J.; Zubillaga, M.S.; Riera, N.I.; Beily, M.E.; Argüello, A.; Crespo, D.C.; Sánchez, A.; Komilis, D. Temporal Variation of Physico-Chemical, Microbiological, and Parasitological Properties of Poultry Manure from Two Egg Production Systems. J. Mater Cycles Waste Manag. 2020, 22, 1140–1151. [Google Scholar] [CrossRef]
  38. Yu, Q.; Sun, C.; Liu, R.; Yellezuome, D.; Zhu, X.; Bai, R.; Liu, M.; Sun, M. Anaerobic Co-Digestion of Corn Stover and Chicken Manure Using Continuous Stirred Tank Reactor: The Effect of Biochar Addition and Urea Pretreatment. Bioresour. Technol. 2021, 319, 124197. [Google Scholar] [CrossRef] [PubMed]
  39. Molaey, R.; Bayrakdar, A.; Sürmeli, R.Ö.; Çalli, B. Anaerobic Digestion of Chicken Manure: Mitigating Process Inhibition at High Ammonia Concentrations by Selenium Supplementation. Biomass Bioenergy 2018, 108, 439–446. [Google Scholar] [CrossRef]
  40. Bi, S.; Qiao, W.; Xiong, L.; Mahdy, A.; Wandera, S.M.; Yin, D.; Dong, R. Improved High Solid Anaerobic Digestion of Chicken Manure by Moderate in Situ Ammonia Stripping and Its Relation to Metabolic Pathway. Renew. Energy 2020, 146, 2380–2389. [Google Scholar] [CrossRef]
  41. Cremonez, P.A.; Teleken, J.G.; Weiser Meier, T.R.; Alves, H.J. Two-Stage Anaerobic Digestion in Agroindustrial Waste Treatment: A Review. J. Environ. Manag. 2021, 281, 111854. [Google Scholar] [CrossRef] [PubMed]
  42. Slaný, O.; Klempová, T.; Shapaval, V.; Zimmermann, B.; Kohler, A.; Čertík, M. Biotransformation of Animal Fat-By Products into ARA-Enriched Fermented Bioproducts by Solid-State Fermentation of Mortierella Alpina. JoF 2020, 6, 236. [Google Scholar] [CrossRef]
  43. Rawoof, S.A.A.; Kumar, P.S.; Vo, D.-V.N.; Subramanian, S. Sequential Production of Hydrogen and Methane by Anaerobic Digestion of Organic Wastes: A Review. Environ. Chem. Lett. 2021, 19, 1043–1063. [Google Scholar] [CrossRef]
  44. Menzel, T.; Neubauer, P.; Junne, S. Role of Microbial Hydrolysis in Anaerobic Digestion. Energies 2020, 13, 5555. [Google Scholar] [CrossRef]
  45. Wu, Y.; Wang, S.; Liang, D.; Li, N. Conductive Materials in Anaerobic Digestion: From Mechanism to Application. Bioresour. Technol. 2020, 298, 122403. [Google Scholar] [CrossRef]
  46. Liu, C.; Ren, L.; Yan, B.; Luo, L.; Zhang, J.; Awasthi, M.K. Electron Transfer and Mechanism of Energy Production among Syntrophic Bacteria during Acidogenic Fermentation: A Review. Bioresour. Technol. 2021, 323, 124637. [Google Scholar] [CrossRef]
  47. Cai, Y.; Zheng, Z.; Wang, X. Obstacles Faced by Methanogenic Archaea Originating from Substrate-Driven Toxicants in Anaerobic Digestion. J. Hazard. Mater. 2021, 403, 123938. [Google Scholar] [CrossRef]
  48. Srivastava, S.K. Advancement in Biogas Production from the Solid Waste by Optimizing the Anaerobic Digestion. Waste Dispos. Sustain. Energy 2020, 2, 85–103. [Google Scholar] [CrossRef] [Green Version]
  49. Hegde, S.; Trabold, T.A. Anaerobic Digestion of Food Waste with Unconventional Co-Substrates for Stable Biogas Production at High Organic Loading Rates. Sustainability 2019, 11, 3875. [Google Scholar] [CrossRef] [Green Version]
  50. Jiang, J.; He, S.; Kang, X.; Sun, Y.; Yuan, Z.; Xing, T.; Guo, Y.; Li, L. Effect of Organic Loading Rate and Temperature on the Anaerobic Digestion of Municipal Solid Waste: Process Performance and Energy Recovery. Front. Energy Res. 2020, 8, 89. [Google Scholar] [CrossRef]
  51. Usman, M.; Salama, E.-S.; Arif, M.; Jeon, B.-H.; Li, X. Determination of the Inhibitory Concentration Level of Fat, Oil, and Grease (FOG) towards Bacterial and Archaeal Communities in Anaerobic Digestion. Renew. Sustain. Energy Rev. 2020, 131, 110032. [Google Scholar] [CrossRef]
  52. Rahman, M.A.; Shahazi, R.; Nova, S.N.B.; Uddin, M.R.; Hossain, M.S.; Yousuf, A. Biogas Production from Anaerobic Co-Digestion Using Kitchen Waste and Poultry Manure as Substrate—Part 1: Substrate Ratio and Effect of Temperature. Biomass Conv. Bioref. 2021. [Google Scholar] [CrossRef]
  53. Jurgutis, L.; Slepetiene, A.; Volungevicius, J.; Amaleviciute-Volunge, K. Biogas Production from Chicken Manure at Different Organic Loading Rates in a Mesophilic Full Scale Anaerobic Digestion Plant. Biomass Bioenergy 2020, 141, 105693. [Google Scholar] [CrossRef]
  54. Tao, Y.; Ersahin, M.E.; Ghasimi, D.S.M.; Ozgun, H.; Wang, H.; Zhang, X.; Guo, M.; Yang, Y.; Stuckey, D.C.; van Lier, J.B. Biogas Productivity of Anaerobic Digestion Process Is Governed by a Core Bacterial Microbiota. Chem. Eng. J. 2020, 380, 122425. [Google Scholar] [CrossRef] [Green Version]
  55. Abd Allah, W.E.; Tawfik, M.A.; Sagade, A.A.; Gorjian, S.; Metwally, K.A.; El-Shal, H. Methane Production Enhancement of a Family-Scale Biogas Digester Using Cattle Manure and Corn Stover under Cold Climates. Sustain. Energy Technol. Assess. 2021, 45, 101163. [Google Scholar] [CrossRef]
  56. Rabii, A.; Aldin, S.; Dahman, Y.; Elbeshbishy, E. A Review on Anaerobic Co-Digestion with a Focus on the Microbial Populations and the Effect of Multi-Stage Digester Configuration. Energies 2019, 12, 1106. [Google Scholar] [CrossRef] [Green Version]
  57. Kazimierowicz, J.; Dzienis, L.; Dębowski, M.; Zieliński, M. Optimisation of Methane Fermentation as a Valorisation Method for Food Waste Products. Biomass Bioenergy 2021, 144, 105913. [Google Scholar] [CrossRef]
  58. Dębowski, M.; Zieliński, M.; Kisielewska, M.; Kazimierowicz, J. Evaluation of Anaerobic Digestion of Dairy Wastewater in an Innovative Multi-Section Horizontal Flow Reactor. Energies 2020, 13, 2392. [Google Scholar] [CrossRef]
  59. Kasinath, A.; Fudala-Ksiazek, S.; Szopinska, M.; Bylinski, H.; Artichowicz, W.; Remiszewska-Skwarek, A.; Luczkiewicz, A. Biomass in Biogas Production: Pretreatment and Codigestion. Renew. Sustain. Energy Rev. 2021, 150, 111509. [Google Scholar] [CrossRef]
  60. Schwan, B.; Abendroth, C.; Latorre-Pérez, A.; Porcar, M.; Vilanova, C.; Dornack, C. Chemically Stressed Bacterial Communities in Anaerobic Digesters Exhibit Resilience and Ecological Flexibility. Front. Microbiol. 2020, 11, 867. [Google Scholar] [CrossRef]
  61. Stiborova, H.; Strejcek, M.; Musilova, L.; Demnerova, K.; Uhlik, O. Diversity and Phylogenetic Composition of Bacterial Communities and Their Association with Anthropogenic Pollutants in Sewage Sludge. Chemosphere 2020, 238, 124629. [Google Scholar] [CrossRef]
  62. Forouzanmehr, F.; Solon, K.; Maisonnave, V.; Daniel, O.; Volcke, E.I.P.; Gillot, S.; Buffiere, P. Sulfur Transformations during Two-Stage Anaerobic Digestion and Intermediate Thermal Hydrolysis. Sci. Total Environ. 2022, 810, 151247. [Google Scholar] [CrossRef]
  63. Marin-Batista, J.D.; Villamil, J.A.; Qaramaleki, S.V.; Coronella, C.J.; Mohedano, A.F.; de la Rubia, M.A. Energy Valorization of Cow Manure by Hydrothermal Carbonization and Anaerobic Digestion. Renew. Energy 2020, 160, 623–632. [Google Scholar] [CrossRef]
  64. Mahdy, A.; Song, Y.; Salama, A.; Qiao, W.; Dong, R. Simultaneous H2S Mitigation and Methanization Enhancement of Chicken Manure through the Introduction of the Micro-Aeration Approach. Chemosphere 2020, 253, 126687. [Google Scholar] [CrossRef]
  65. Ma, G.; Ndegwa, P.; Harrison, J.H.; Chen, Y. Methane Yields during Anaerobic Co-Digestion of Animal Manure with Other Feedstocks: A Meta-Analysis. Sci. Total Environ. 2020, 728, 138224. [Google Scholar] [CrossRef]
  66. Guo, H.; Zhao, S.; Xia, D.; Zhao, W.; Li, Q.; Liu, X.; Lv, J. The Biochemical Mechanism of Enhancing the Conversion of Chicken Manure to Biogenic Methane Using Coal Slime as Additive. Bioresour. Technol. 2022, 344, 126226. [Google Scholar] [CrossRef]
  67. Weiland, P. Biogas Production: Current State and Perspectives. Appl. Microbiol. Biotechnol. 2010, 85, 849–860. [Google Scholar] [CrossRef] [PubMed]
  68. Rasapoor, M.; Young, B.; Brar, R.; Sarmah, A.; Zhuang, W.-Q.; Baroutian, S. Recognizing the Challenges of Anaerobic Digestion: Critical Steps toward Improving Biogas Generation. Fuel 2020, 261, 116497. [Google Scholar] [CrossRef]
  69. Koniuszewska, I.; Korzeniewska, E.; Harnisz, M.; Czatzkowska, M. Intensification of Biogas Production Using Various Technologies: A Review. Int. J. Energy Res. 2020, 44, 6240–6258. [Google Scholar] [CrossRef]
  70. Muratçobanoğlu, H.; Gökçek, Ö.B.; Mert, R.A.; Zan, R.; Demirel, S. Simultaneous Synergistic Effects of Graphite Addition and Co-Digestion of Food Waste and Cow Manure: Biogas Production and Microbial Community. Bioresour. Technol. 2020, 309, 123365. [Google Scholar] [CrossRef] [PubMed]
  71. Guo, Z.; Usman, M.; Alsareii, S.A.; Harraz, F.A.; Al-Assiri, M.S.; Jalalah, M.; Li, X.; Salama, E.-S. Synergistic Ammonia and Fatty Acids Inhibition of Microbial Communities during Slaughterhouse Waste Digestion for Biogas Production. Bioresour. Technol. 2021, 337, 125383. [Google Scholar] [CrossRef] [PubMed]
  72. Cheng, Q.; Huang, W.; Jiang, M.; Xu, C.; Fan, G.; Yan, J.; Chai, B.; Zhang, Y.; Zhang, Y.; Zhang, S.; et al. Challenges of Anaerobic Digestion in China. Int. J. Environ. Sci. Technol. 2021, 18, 3685–3696. [Google Scholar] [CrossRef]
  73. Mahdy, A.; Bi, S.; Song, Y.; Qiao, W.; Dong, R. Overcome Inhibition of Anaerobic Digestion of Chicken Manure under Ammonia-Stressed Condition by Lowering the Organic Loading Rate. Bioresour. Technol. Rep. 2020, 9, 100359. [Google Scholar] [CrossRef]
  74. Yan, M.; Fotidis, I.A.; Tian, H.; Khoshnevisan, B.; Treu, L.; Tsapekos, P.; Angelidaki, I. Acclimatization Contributes to Stable Anaerobic Digestion of Organic Fraction of Municipal Solid Waste under Extreme Ammonia Levels: Focusing on Microbial Community Dynamics. Bioresour. Technol. 2019, 286, 121376. [Google Scholar] [CrossRef]
  75. Musa, M.; Idrus, S.; Hasfalina, C.; Daud, N. Effect of Organic Loading Rate on Anaerobic Digestion Performance of Mesophilic (UASB) Reactor Using Cattle Slaughterhouse Wastewater as Substrate. IJERPH 2018, 15, 2220. [Google Scholar] [CrossRef] [Green Version]
  76. Ghofrani-Isfahani, P.; Valverde-Pérez, B.; Alvarado-Morales, M.; Shahrokhi, M.; Vossoughi, M.; Angelidaki, I. Supervisory Control of an Anaerobic Digester Subject to Drastic Substrate Changes. Chem. Eng. J. 2020, 391, 123502. [Google Scholar] [CrossRef]
Figure 1. Research diagram: 1—Biogas reactor; 2—Stirrer drive; 3—Stirrer; 4—Electric heating pad with insulation; 5—Heating controller; 6—Temperature sensor; 7—pH electrode; 8—Biogas output port, 9—Gas volume meter; 10—Monitor and computer; 11—Biogas valves; 12—Two gas bags; 13—Biogas analyser; 14—Feeding port; 15—Substrate drain valve; 16—Digestate sampling port; 17—Moister meter; 18—Manual operation (biogas and digestate convey to analysis).
Applsci 12 04652 g001
Figure 2. Daily biogas production at different OLRs.
Applsci 12 04652 g002
Figure 3. Changes of Cm and Cs values during experiments.
Applsci 12 04652 g003
Figure 4. Methane yield: (a) CH4 yield from FM; (b) specific CH4 yield from TS; (c) specific CH4 yield from VS.
Applsci 12 04652 g004
Figure 5. Biogas calorific value and biomass energy yield.
Applsci 12 04652 g005
Figure 6. TS reduction and VS consumption.
Applsci 12 04652 g006
Table 1. Feeding material composition.
ExperimentFM DescriptionOLR, kg VS·(m3·Day)−1FM Mass, g
OLR3.0RM + water3.00399.4
OLR3.5RM + water + fat 7 g3.50406.4
OLR4.0RM + water + fat 14 g4.00413.4
OLR4.5RM + water + fat 21 g4.50420.4
Table 2. Physical and chemical parameters of raw material (wet matter basis).
Parameter DescriptionMaterial Analysed
RMFAT
Total solids (TS), %37.76 ± 0.6299.98 ± 0.01
Volatile solids (VS), %26.45 ± 0.2799.96 ± 0.02
Total carbon (C), %26.8 ± 0.386.0 ± 0.1
Total nitrogen (N), %2.36 ± 0.120.93 ± 0.10
C/N ratio11:193:1
Total sulphur (S), %0.39 ± 0.283.16 ± 0.15
Ammoniacal nitrogen (TAN), %0.55 ± 0.15n/d
pH7.80 ± 0.03n/d
n/d—Not determined.
Table 3. Indicators of biogas production.
ParameterExperiment
OLR3.0OLR3.5OLR4.0OLR4.5
OLR increase, %n/a16.728.637.5
FM increase, %n/a1.753.515.26
Cm increase, %n/a5.207.969.57
Mvs increase, %n/a25.155.877.3
n/a—The parameter is not available.
Table 4. Digestate TS and VS concentration.
ParameterExperiment
OLR3.0OLR3.5OLR4.0OLR4.5
TS, %5.28 ± 0.465.68 ± 0.315.32 ± 0.217.11 ± 0.59
VS, %3.95 ± 0.283.72 ± 0.193.42 ± 0.125.03 ± 0.22
Publisher’s Note: MDPI stays neutral with regard to jurisdictional claims in published maps and institutional affiliations.

