Article

Object Detection-Based Video Compression

Department of Computer Engineering, Sejong University, Seoul 05006, Korea
*
Author to whom correspondence should be addressed.
Appl. Sci. 2022, 12(9), 4525; https://doi.org/10.3390/app12094525
Submission received: 22 March 2022 / Revised: 22 April 2022 / Accepted: 26 April 2022 / Published: 29 April 2022
(This article belongs to the Special Issue Advances in Signal, Image and Video Processing)

Abstract

:
Video compression is designed to provide good subjective image quality, even at a high-compression ratio. In addition, video quality metrics have been used to show the results can maintain a high Peak Signal-to-Noise Ratio (PSNR), even at high compression. However, there are many difficulties in object recognition on the decoder side due to the low image quality caused by high compression. Accordingly, providing good image quality for the detected objects is necessary for the given total bitrate for utilizing object detection in a video decoder. In this paper, object detection-based video compression by the encoder and decoder is proposed that allocates lower quantization parameters to the detected-object regions and higher quantization parameters to the background. Therefore, better image quality is obtained for the detected objects on the decoder side. Object detection-based video compression consists of two types: Versatile Video Coding (VVC) and object detection. In this paper, the decoder performs the decompression process by receiving the bitstreams in the object-detection decoder and the VVC decoder. In the proposed method, the VVC encoder and decoder are processed based on the information obtained from object detection. In a random access (RA) configuration, the average Bjøntegaard Delta (BD)-rates of Y, Cb, and Cr increased by 2.33%, 2.67%, and 2.78%, respectively. In an All Intra (AI) configuration, the average BD-rates of Y, Cb, and Cr increased by 0.59%, 1.66%, and 1.42%, respectively. In an RA configuration, the averages of ΔY-PSNR, ΔCb-PSNR, and ΔCr-PSNR for the object-detected areas improved to 0.17%, 0.23%, and 0.04%, respectively. In an AI configuration, the averages of ΔY-PSNR, ΔCb-PSNR, and ΔCr-PSNR for the object-detected areas improved to 0.71%, 0.30%, and 0.30%, respectively. Subjective image quality was also improved in the object-detected areas.

1. Introduction

Video compression is a key technology for immersive media uses. More than 80% of global Internet traffic consists of video contents [1]. As the video content traffic continues to soar, higher video compression is increasingly required. The next-generation video coding standard, Versatile Video Coding (VVC) [2], was introduced in July 2020. It was jointly developed by the International Telecommunication Union-Telecommunication (ITU-T) WP3/16 Video Coding Experts Group (VCEG) and the ISO/IEC JCT 1/SC 29/ WG 11 Moving Picture Expert Group (MPEG). VVC was developed based on High Efficiency Video Coding (HEVC/H265) [3,4], which was developed in 2013, and Advanced Video Coding (AVC/H264) [5,6], which was developed in 2003. In VVC, a picture is divided into one or more tile rows and one or more tile columns. A tile is a sequence of coding tree units (CTUs) that covers a rectangular region of the picture. A slice consists of an integer number of complete tiles or an integer number of consecutive complete CTU rows within a tile of a picture. Figure 1 shows an example of a picture partitioned into tiles and slices [7]. The basic mechanism of the video coding standards is a block-based structure. In VVC, CTU, which is the basic coding unit, is recursively partitioned into quad, triple, and binary trees, and these partitioned units are called coding unit (CUs). The picture is divided into a sequence of CTUs. The CTU concept is same as that of HEVC [3,4]. For a picture that has three sample arrays, a CTU consists of an N × N (height × width) block of luma samples together with two corresponding blocks of chroma samples. The maximum allowed size of the luma block in the CTU is specified to be 128 × 128 [7]. The CTU can be recursively partitioned to 4 × 4 CUs in terms of rate-distortion (RD) cost. This process is called rate-distortion optimization (RDO). The RDO process is the measurement of finding the lowest RD cost for every CU, consisting of the CTU in which the CUs having the lowest RD cost in the CTU are the best coding units. While the CUs are recursively partitioned, the main coding tools of VVC, such as intra prediction [8], inter prediction [9], transform, quantization, inverse transform, and dequantization [10], are used in the compression. After all the CTUs are coded in the picture, some of the tools, including the deblocking filter [11], Sample Adaptive Offset (SAO) [12], and Adaptive Loop Filter (ALF) [13], enhance the subjective quality of video sequences. Finally, Context Adaptive Binary Arithmetic Coding (CABAC) is used to generate a bitstream in the encoder to send to the decoder. Some of tools in VVC show dominant high coding efficiency compared with the previous video coding standards, HEVC and AVC. The dominant coding tools are listed as follows: diversification of block partitioning, Cross-Component Linear Model (CCLM), affine motion model, Adaptive Motion Vector Resolution (AMVR), Multiple Transform Selection (MTS), dependent quantization, and ALF. Through these coding tools, VVC has about 40% greater coding efficiency than HEVC for UHD sequences in terms of BD-rate, which is the objective quality measure [14,15].
The new-generation video coding, with its high compression rate, needs to embrace broad areas of video contents. In the areas of object detection and recognition, deep learning has shown a significant influence. Learning based on given features has led to a remarkable breakthrough in this field. Object-detection tools are diversified according to the types of networks, such as You Only Look Once (YOLO) [16], Feature Pyramid Networks (FPNs) [17], and Regions with Convolutional Neural Networks (R-CNNs) [18]. As a result of the rapid evolution in object detection, the combination of deep learning and video coding is now also necessary. Therefore, Video Coding for Machines (VCM), which is founded on ISO/IEC JTC1/SC29/WG11, will standardize a bitstream format [19]. As the features are extracted from deep learning or object-detection tools, the extracted features can be used in applications supporting smart cities, intelligent industries, surveillance video, etc. Due to the rise of the Internet of Things (IoT), the aforementioned applications will be used in many specific applications, such as traffic monitoring, density detection and prediction, traffic flow prediction, and resource allocation.
As a result, a method that combines video coding with object detection is proposed in this paper. The proposed method combines the VVC Test Model version 8.2 (VTM-8.2) with YOLO version 3 (YOLOv3), which showed high-speed object detection with the same accuracy as that of other algorithms [20]. The objects are detected from videos, and the information from these objects is encoded and used to generate a feature bitstream. In the proposed method, the information of objects, such as the object’s name, position, width, and height, is contained in the feature bitstream. The extracted features are used by the quantization parameter (QP) control in VTM-8.2 to compress the areas in which objects are included or not; that is, the object detection-based video compression uses a low QP in the detected objects and a high QP in the background.
This paper is organized as follows. Section 2 discusses the related works, Section 3 presents the proposed method, Section 4 presents and analyzes the experimental results, Section 5 presents our conclusions, and Section 6 introduces future works.

2. Related Works

As a result of the evolution of IoT, object detection, and AI technologies, MPEG is attempting to create a standard through VCM by merging those technologies with video coding technology. Therefore, VCM architectures are being conceived through collaboration of these technologies. In addition, experiments are conducted through calls for evidence (CfEs) within VCM, and efforts are being made to verify the effectiveness of the technology. In VCM, a CfE was conducted in October 2020, and a draft call for proposal (CfP) was published in January 2022. It is expected that VCM will proceed in the form of adding new encoding technologies based on the adopted proposal.
VCM intends to provide services to technologies such as surveillance video, intelligent transportation, smart cities, intelligent industries, and intelligent content. Some common requirements for these services are as follows [19,21]:
  • Efficient compression of bitstreams: It should have a higher compression rate than VVC-compressed bitstreams with similar performance.
  • Varying degrees of performance should be supported: The goal is to support different optimizations for scenarios supporting single and multiple missions.
  • Both machine-only and hybrid machine and human applications should be supported.
Several VCM pipelines are shown as examples. In Figure 2, (a) shows the pipeline for video coding, (b) shows the pipeline for feature coding, and (c) shows the pipeline for hybrid coding. Figure 2a shows video encoding, video decoding, and then a machine analysis process performed after the video decoding. Thus, no additional procedure is required in the video encoder and decoder to support numerous machine-vision tasks because the reconstructed video after the video decoding is used as input for the machine analysis. Figure 2b shows a method to compress both the traditional video plus feature information after the feature conversion using the video encoder, where features are obtained from machine analysis. Since the video codec is a compression method optimized for the characteristics of image data, it is necessary to consider whether it is an efficient method. In Figure 2c, feature maps after machine analysis on the encoder side are compressed by the feature encoder, and the video encoder and decoder do not utilize the feature information in the encoding and decoding processes in order to use the existing video coding standard, in which the machine analysis in the decoder infers object detection, object segmentation, object tracking, event recognition, etc., from the decoded feature maps.
Along with VCM, a large number of related studies are in progress. For example, Yang et al. [23] mentioned the need for targeting collaborative optimization of compressing and transmitting multiple tasks in VCM. Currently, video compression is targeted only for human vision, rather than machine vision. Therefore, joint optimization of the VVC and feature streams is necessary. The relationship between human vision and machine vision also requires study. Fischer et al. [24] proposed a method combining human vision and machine vision. As the video coding achieves improved performance using the RDO process, Fischer et al. designed a feature-based RDO to achieve better compression performance from the machine point of view. Duan et al. [25] proposed a key module that shows the combination of a pretrained model, learned feature extractor, neural network, and multiple tasks. In VCM, multiple tasks need to be applied in a variety of technologies, such as surveillance video, intelligent transportation, smart cities, intelligent industries, and intelligent content. In addition to collaboration between human vision and machine vision, the complexity of encoder and decoder is a significant issue that should not be overlooked, as compared with the VVC encoder and decoder.

3. Proposed Methods

3.1. Object Detection-Based Video Compression

The current block-based video coding applies the same quantization for the whole picture because it does not consider detected-object regions. Here, we propose object detection-based video compression by the encoder and decoder, which allocates lower quantization parameters to the detected-object regions and higher quantization parameters to the background. Therefore, better image quality is obtained for the detected objects on the decoder side compared with the existing video coding standard. The combined method of the VVC codec and the YOLO object detection algorithm is designed to control QPs in VVC. The decoder block diagram of the proposed object detection-based video compression is shown in Figure 3. The object information, such as the center (x, y) coordinate of each object, the width and height of each object, and the name of each object (object index), are obtained from the object detection. In the Object Detection Decoder, the Feature Decoder holds the object information and Machine Analysis module infers the results. The object information obtained by the Feature Decoder is used in the VVC Decoder. Using the Object Detection Decoder and VVC Decoder, an object detection-based compression method is proposed to modify the QP of the corresponding CU by transmitting the object information (features) in the picture. In this paper, the object information obtained by the Feature Decoder is applied to both the VVC Decoder and Machine Analysis modules.
Table 1 and Table 2 show the object indices that are used to classify the name of objects [20], where voc.data in Table 1 and coco.data in Table 2 have a maximum of 20 and 80 objects, respectively. The small PSNR gain in the detected object areas is meaningful in the object detection-based video coding using the VVC standard because any machine analysis techniques on the decoder side can be applied to the PSNR-improved detected object areas for further processing, such as face recognition, segmentation, and shape extraction.
Figure 4 shows the performance of YOLO, which detects objects in the common test condition (CTC) original sequence. The names of objects defined differently from those in Table 1 and Table 2 can be used in the proposed method. In the following subsections, the proposed method that uses the object information to control the QP values in the coding blocks is explained in detail.

3.2. CU-Based QP-Control

A CTU is the basis unit of a coding tree, and is separated into a quad tree, triple tree, or binary tree according to the RDO process, which consists of the optimal CU partitions. Figure 4 shows the object-detection results detected by the bounding boxes in the 186th picture of the 832 × 480 BQMall sequence, where six people and three handbags were detected. In the proposed CU-based QP-control method, the index, or flag, of the detected object is embedded in each CU. When the CUs are encoded, the QP values are controlled by whether an object is included in the CU. In this case, a lower QP value is allocated to the detected objects, and a higher QP value is allocated to the background to improve PSNR values of the detected objects. The CU partitioning results of the CU-based QP control corresponding to the detected objects in the 186th picture of the BQMall sequence are shown in Figure 5. The CUs allocating low QP values are highlighted with red color blocks, and the CUs allocating high QP value are highlighted with white color blocks in the BQMall sequence, where the CU is determined to be encoded with a low QP when the CU partially includes an object. Even if an object occupies only a part of a CU, the CU is recognized as including the object in the proposed method. As an example, the upper left and upper right large binary CUs over the hat of the woman on the left with the handbag are compressed by a low QP in the picture because the detected woman (object) takes up a large area in Figure 4. In addition, when the accuracy of object recognition is low in YOLO, it is determined that there is no object in the CUs in the proposed method. In Figure 4 and Figure 5, the accuracy of object recognition is low for the person in the center of the image in the bakery, so the person is determined to be part of the background in YOLO, as shown in Figure 5. In the proposed method, the modification of QPs are defined in Equation (1) as follows:
i f i s O b j e c t D e t e c t e d   Q P C U = Q P S l i c e Q P O f f s e t ;   / /   low   QP e l s e   Q P C U = Q P S l i c e + Q P O f f s e t ;   / /   high   QP
In Equation (1), IsObjectDetected is a flag that defines whether an object is included or not in the CU, where QPCU is the QP value of the CU, QPSlice is the QP value of the current slice, and QPOffset is a constant value used to modify the QP value in the CU, in which QPOffset is set to 4 in the experiments. In this method, the object information, including the number of detected objects, the starting (x, y) coordinate of each object, the width and height of each object, and the object index, is sent from the feature encoder of the proposed object detection-based encoder that makes the feature and VVC bitstreams. Once the object information is collected by YOLO in the object detection-based encoder, the encoder starts to compress each CU with reference to the CU coordinates containing each object in the picture. For the object detection-based encoder and decoder, all the CUs are encoded and decoded while investigating whether the object contains CUs.

4. Experimental Results

4.1. Experimental Conditions

The proposed methods were implemented on top of the VVC reference software, VTM-8.2, according to the VVC common test conditions (CTC) [26]. Table 3 shows the test sequences where the sequences of the classes A1/A2, B, C, and D comprise the resolutions of 4K, 1080p, 832 × 480, and 416 × 240, respectively, and the proposed method was applied when the QP values were 22, 27, 32, and 37, respectively. In the experiments, Class D was excluded because it is not mandatory in the RA configuration and had too-low resolution. The AI configuration used I (Intra) picture coding for compression. The RA configuration had hierarchical B pictures (IPBBB…BB), which have a group of pictures (GOP) size of 16, where P is a predictive picture. The pictures for 5-GOP (80 frames) were compressed for the Class A1 and A2 sequences to speed up the experiments, and the total number of pictures was compressed for Classes B and C. An Intel Xeon(R) CPU [email protected] with 64.0GB RAM was used for the experiments. For the condition of YOLOv3, yolov3.weights and coco.data were used.

4.2. Experimental Results

After applying the QP modification indicated by Equation (1) to each CU, the Peak Signal-to-Noise Ratio (PSNR) was measured with only the object-detected areas in the AI and RA configurations. In the proposed method, PSNR was not measured for the areas not including objects to evaluate the accurate image quality of the proposed method for the areas including objects. The ΔPSNR increase in each picture was calculated using Equations (2)–(6) by the ratio of the proposed method to the anchor as follows:
Δ P S N R = P S N R p m P S N R a n c / P S N R a n c ,
P S N R a n c = 10 · log 10 M A X I 2 M S E a n c o b j ,   M A X I = 255 ,     f o r   8 b i t   p i x e l   d e p t h 1023 ,     f o r   10 b i t   p i x e l   d e p t h
P S N R p m = 10 · log 10 M A X I 2 M S E p m o b j ,
M S E a n c o b j = i M A X _ o b j 1 e x i s x i e y i s y i k = s x i e x i k = s y i e y i a n c k , l o r g k , l 2
M S E p m o b j = i M A X _ o b j 1 e x i s x i e y i s y i k = s x i e x i k = s y i e y i p r o p k , l o r g k , l 2
where M S E p m o b j is the Mean Squared Error (MSE) between the proposed method represented by the subscript pm and the original sequence for the areas including the detected objects represented by the superscript obj. M S E a n c o b j is the MSE between the VTM-8.2 anchor represented by the subscript anc and the original sequence for the areas including the detected objects. In Equations (5) and (6), s x i and s y i are the start (xi,yi) coordinates (left-top) of the detected object i,  e x i and e y i are the end (xi,yi) coordinates (right-bottom) of the detected object i, MAX_obj is the number of objects, and anc(k,l), prop(k,l), and org(k,l) are the VTM-8.2 (anchor) decoded picture, the proposed object detection-based decoded picture, and the original picture, respectively, where (k,l) represents the (x,y) coordinate of picture. In Equations (3) and (4), PSNR is measured using the anchor and the proposed method, respectively. MAXI represents the max value 255 or 1023, according to the sequences that are of 8-bit pixel depth or 10-bit pixel depth. ΔY-PSNR, ΔCb-PSNR, and ΔCr-PSNR are the PSNR increments of Y, Cb, and Cr of the proposed method compared with those of VTM-8.2, respectively, in each picture, where Y is a luma component and Cb and Cr are chroma components. The small PSNR gain in the detected object areas is meaningful in the object detection-based video coding using the VVC standard because any machine analysis techniques on the decoder side can be applied to the PSNR-improved detected object areas for further processing, such as face recognition, segmentation, and shape extraction.
In Table 4, ΔY-PSNR that is higher than 0% indicates that the proposed method increases the ΔY-PSNR value compared with the VTM-8.2 anchor for the object-detected areas, providing better image quality of Y-PSNR in the proposed method than in the anchor. In the RA configuration, the average ΔY-PSNR was improved to 0.18%, but the averages of ΔCb-PSNR and ΔCr-PSNR were slightly decreased by 0.11% and 0.04%, respectively, for all the test sequences in Table 4. In the AI configuration, the averages of ΔY-PSNR, ΔCb-PSNR, and ΔCr-PSNR improved to 0.71%, 0.30%, and 0.30%, respectively, for all the test sequences. Therefore, the overall performances were improved in the object-detected Y, Cb, and Cr areas. The sequence in which the proposed method showed the high average ΔY-PSNR value of 2.25% was the BQTerrace sequence in class B, where the QP value was 22 in the AI configuration. The sequence in which the proposed method showed the lowest average ΔY-PSNR value (−0.53%) was the MarketPlace sequence in class B, where the QP value was 37 in the RA configuration.
Figure 6 shows the example of objects detected (226th, 235th, 240th, and 246th pictures) in the MarketPlace sequence in class B, which show low average ΔY-PSNR values. In the MarketPlace sequence, the object-detection algorithm does not work well, as there are fast-moving people, which require the camera to quickly zoom in and out. Therefore, object detections are difficult in the MarketPlace sequence. The person standing on the far left disappears after a few pictures in Figure 6a and the size of the square box of the object detected in the picture changes continuously in Figure 6a–d. Because of these reasons, the PSNR quality of the reconstructed video worsens, as confirmed by the RA data in Table 4, which led to a decrease in the average ΔY-PSNR value by −0.53% at the QP value of 37. However, in the AI configuration, the average ΔY-PSNR value increased because the compression was I (Intra) picture coding, which does not use the P (Predictive) and B (Bi-directional predictive) reference pictures.
Figure 7 shows the example of the object-detected 501st picture in the 1920 × 1080 BQTerrace sequence in class B. Many vehicles and people are detected in the BQTerrace sequence, where the vehicles and people have relatively steady and slow motion compared with the MarketPlace sequence in Figure 6. As the object detection is successful, the prediction performance using the reference P and B pictures is also accurate, so that the average ΔY-PSNR improved to 2.25% at the QP value of 22. The results derived from Figure 6 and Figure 7 confirm that the quality of reference pictures including objects that have slow and steady motion significantly affects the results of PSNR in the proposed method.
Figure 8 shows the example of the object-detected 13th picture in the 3840 × 2160 DaylightRoad2 sequence of class A2, where DaylightRoad2 consists of vehicles and traffic-related objects. Since it is a video sequence, specialized for object detection, the detection accuracy was quite high. The width and height of object detection between pictures were constant, which favorably affects the quality of reference pictures. Therefore, performance improvement of the proposed method is observed in DaylightRoad2. The average ΔY-PSNR, 0.73% at the QP value of 22, in the AI configuration shows better performance than the 0.23% at the QP value of 22 in the RA configuration. It can be inferred that the B- or P-picture in the RA configuration had a poor PSNR result due to low PSNR results on the reference pictures. In other words, as the video compression proceeded in the RA configuration, ΔPSNR of the image decreased due to the poor quality of reference pictures. Moreover, the object detection (which sometimes fails to detect the objects that should be detected) did not accurately predict all objects. Therefore, when the false-alarm object regions are compressed with a high QP, and those regions are used as a reference picture, the ΔPSNR result is low because of the low quality of the reference picture. In common with the AI and RA configurations, it seems that the lower the QP, the better the performance.
Figure 9, Figure 10 and Figure 11 show the images of the cropped pictures in which (a) is the original cropped image, (b) is the cropped image decompressed with the VTM-8.2 anchor, and (c) is the cropped image decompressed with the proposed method. Referring to Table 3, Figure 9, Figure 10 and Figure 11 are UHD videos and have a size of 1920 × 1080. In Figure 9, Figure 10 and Figure 11, the videos were compressed under the RA configuration.
Figure 9a–c shows the cropped 501st pictures of the BQTerrace sequence where the starting point (x, y) of the cropped image is (1480, 470) and (width, height) is (140, 125). Figure 9a is the original cropped image. In Figure 9b, compressed with QP = 32 in the RA configuration, image noise is observed around the head of the person in the yellow box. However, in Figure 9c, when the proposed compression is performed, image quality is improved, which reduces the noise around the head in the yellow boundary box. This is because the proposed method provides better image quality by modifying the QP values.
Figure 10a–c shows the cropped 100th pictures of the BasketballDrive sequence, where the start (x, y) coordinate of the cropped image is (1525, 800) and (width, height) is (180, 215). The shoelace in the yellow box is clearly visible in the original cropped image in Figure 10a, but the shoelace is less visible in Figure 10b, which is compressed by VTM-8.2 with the QP value of 27 in the RA configuration. It seems that a large amount of quantization noise is visible in the yellow box. In Figure 10c, since the shoelace is included in the object-detection area, the cropped image was compressed with a QP value less than 27, so the shoelace is clearly visible in Figure 10c due to less quantization noise.
Figure 11a–c shows the cropped 5th pictures of the BasketballDrive sequence, where the start (x, y) coordinate of the cropped image is (1080, 400) and (width, height) is (170, 185). In Figure 11b, compressed by VTM-8.2 with the QP value of 37 in the RA configuration, blocking artifacts and ringing artifacts are visible on the basketball, compared with the original cropped image in Figure 11a. However, in Figure 11c, blocking artifacts disappear from the ball. Since the proposed method detects the basketball and basketball player as objects, it was compressed with a QP value less than 37. Since the VTM-8.2 anchor compresses the whole picture with a high QP value 37, the overall video quality is not sufficient compared with the original picture. However, since the objects that are detected by the proposed method are compressed at a lower QP value, the objects in the proposed method are shown with better quality than those in Figure 11b. In the experiments, the QP value difference QPOffset in Equation (1) was set to 4.
The BD-rate indicates the bitrate reduction ratio over the anchor (VTM-8.2) in the same PSNR. For example, a positive BD-rate value means that the coding efficiency is decreased. The BD-rates for the Y, Cb, and Cr components were calculated, with “Average BD-rate” meaning the average BD-rate for each component for all class sequences. Table 5 shows the experimental results for BD-rate in all sequences. In the RA configuration, the BD-rates of Y, Cb, and Cr decreased to 2.33%, 2.67%, and 2.78%, respectively. In the AI configuration, the BD-rates of Y, Cb, and Cr decreased to 0.59%, 1.66%, and 1.42%, respectively. When object detection-based video encoding was performed, the BD-rate of video sequences dropped compared with the VVC standard because:
  • Even if the PSNR is high in the object-detected areas, background areas that do not include object areas usually take up more area than the detected object areas in a picture, so the PSNR decreased due to a high QP value in the background areas, and the bitrates increased to compensate for the distortion.
  • In the case of intra prediction, the already-decoded reference samples with a high QP value that were used to encode the current block had relatively higher quantization errors than those samples decoded with a low QP value, so that the coding efficiency dropped due to the high intra prediction error.
  • In the case of inter prediction using the P (Predictive) and B (Bi-directional predictive) pictures, the background areas in the previous reference pictures were decoded with a high QP value, which was used to predict that each block in the current picture would have relatively higher quantization errors than those areas decoded with a low QP value; thus, the coding efficiency dropped due to the high inter prediction error, i.e., when the proposed object detection-based video coding was applied, the PSNRs of the previously decoded pictures were lower than those of the previously decoded pictures in VVC.
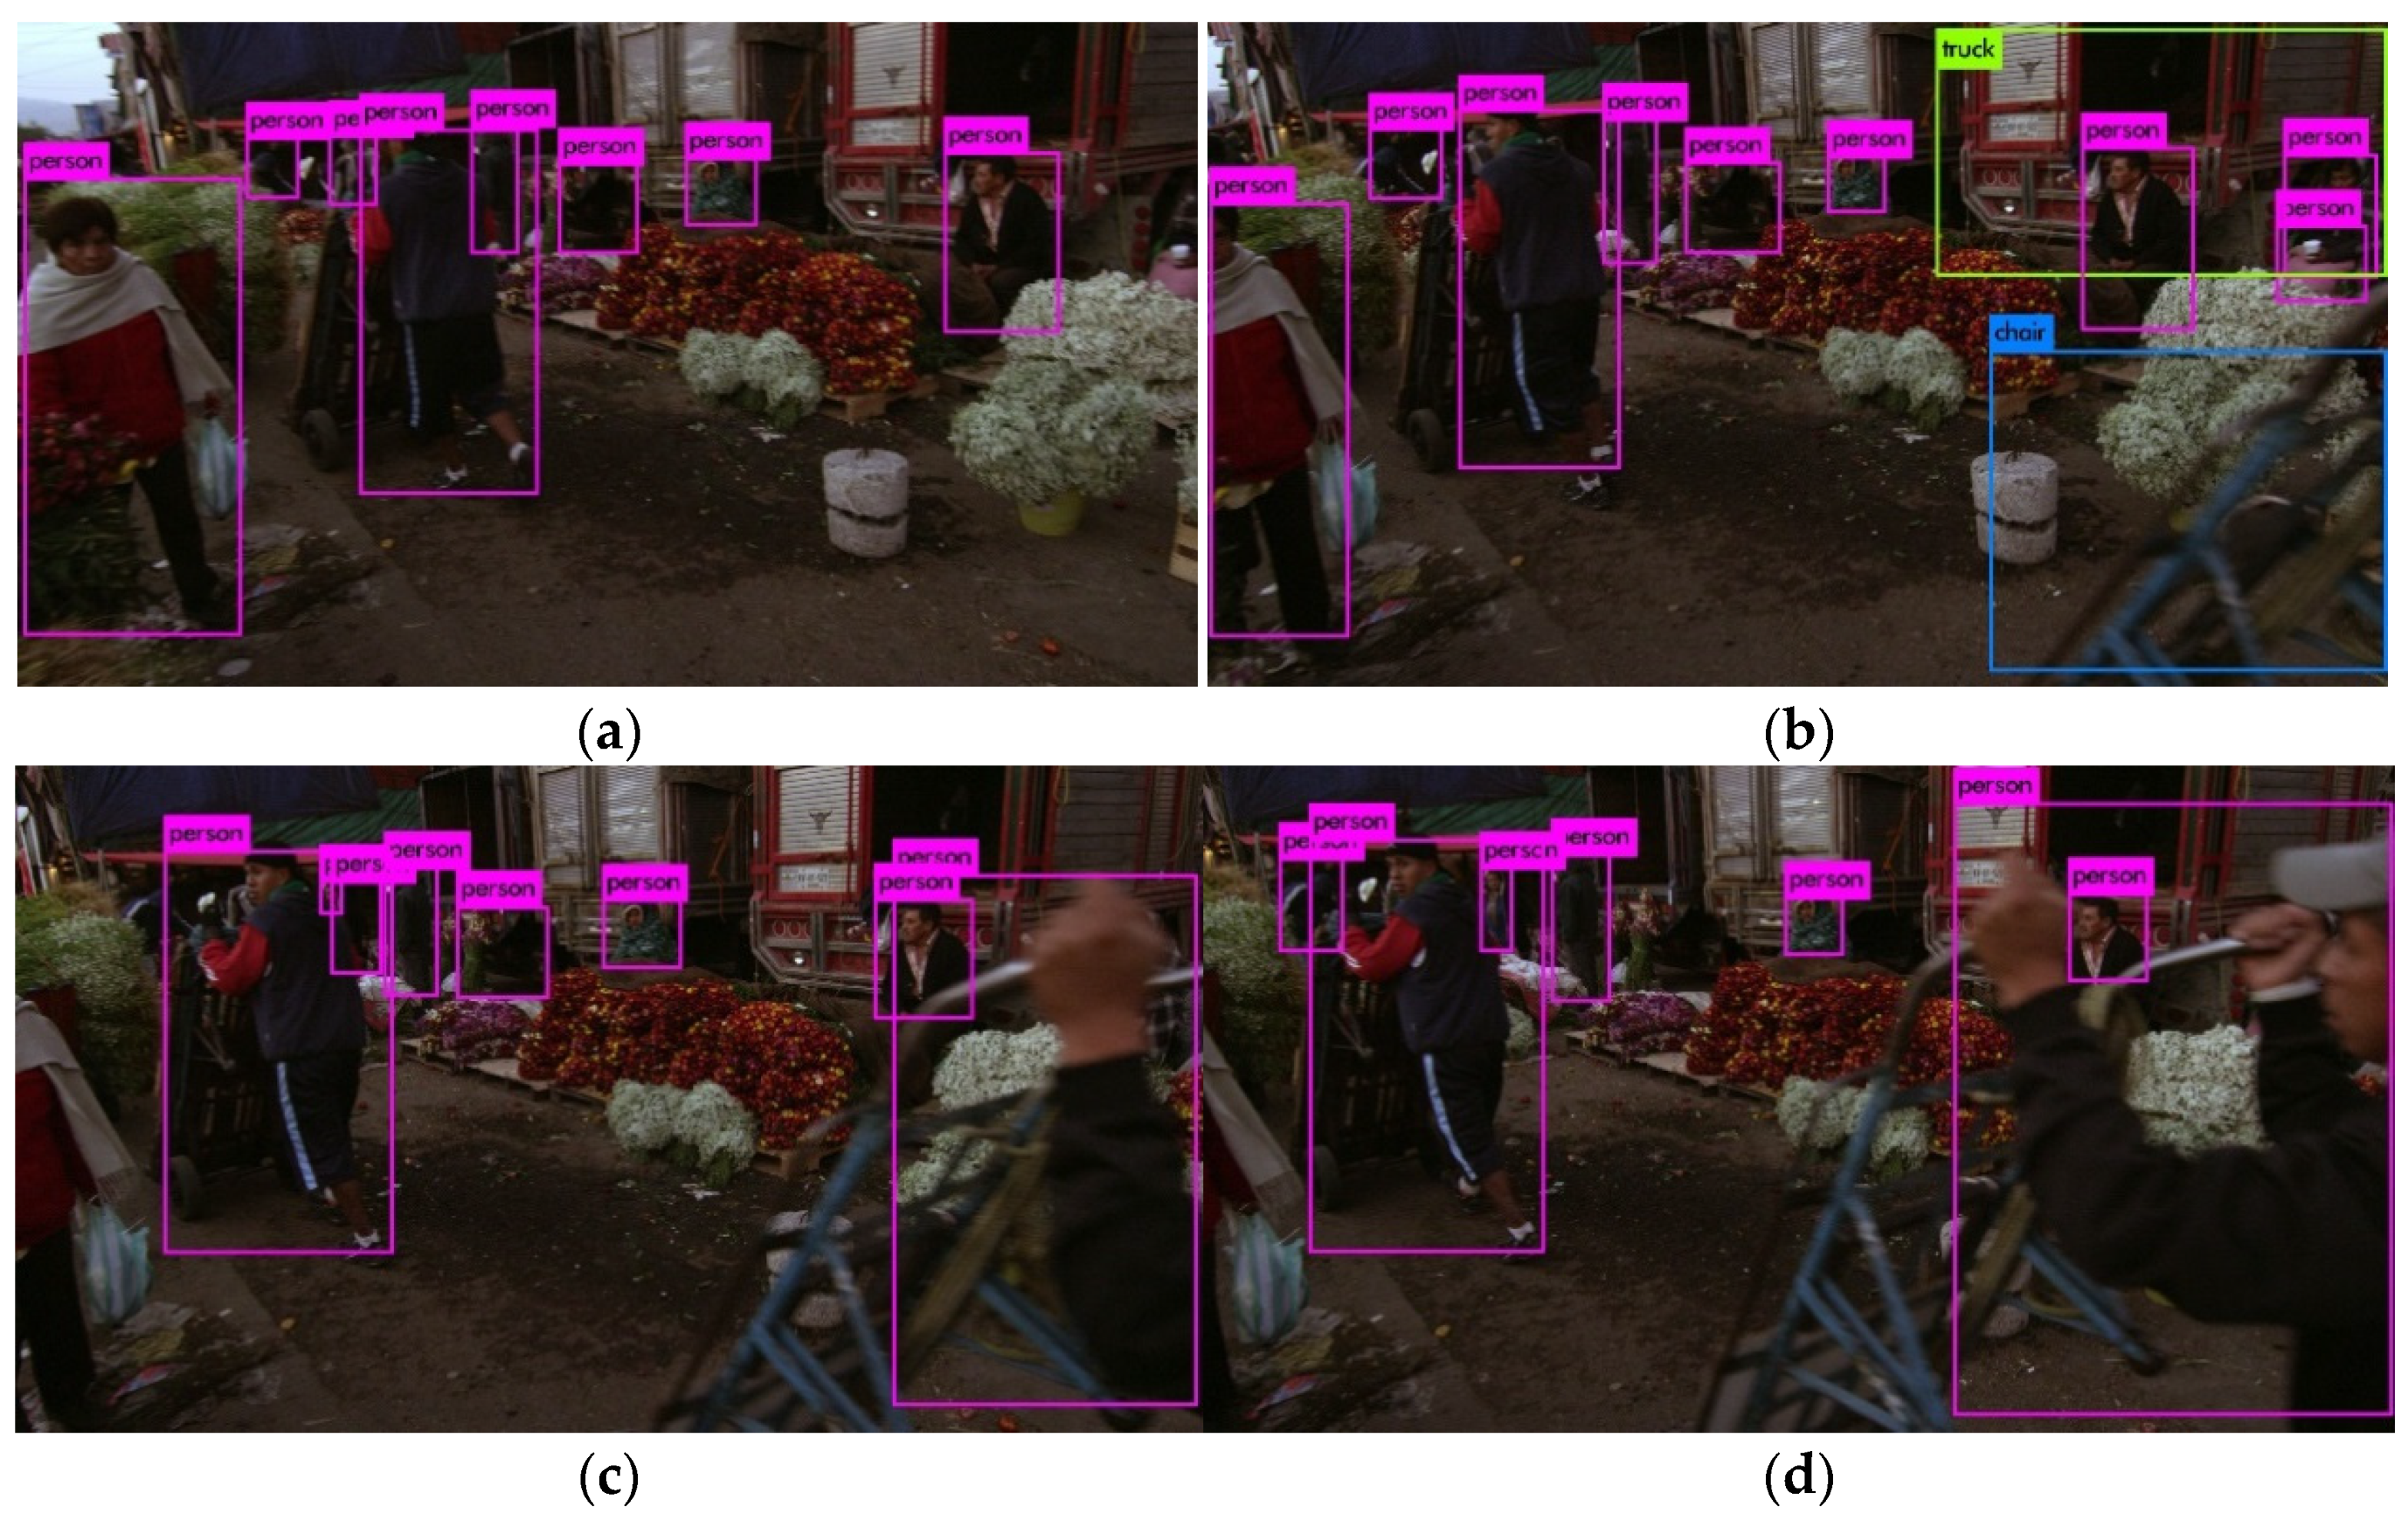
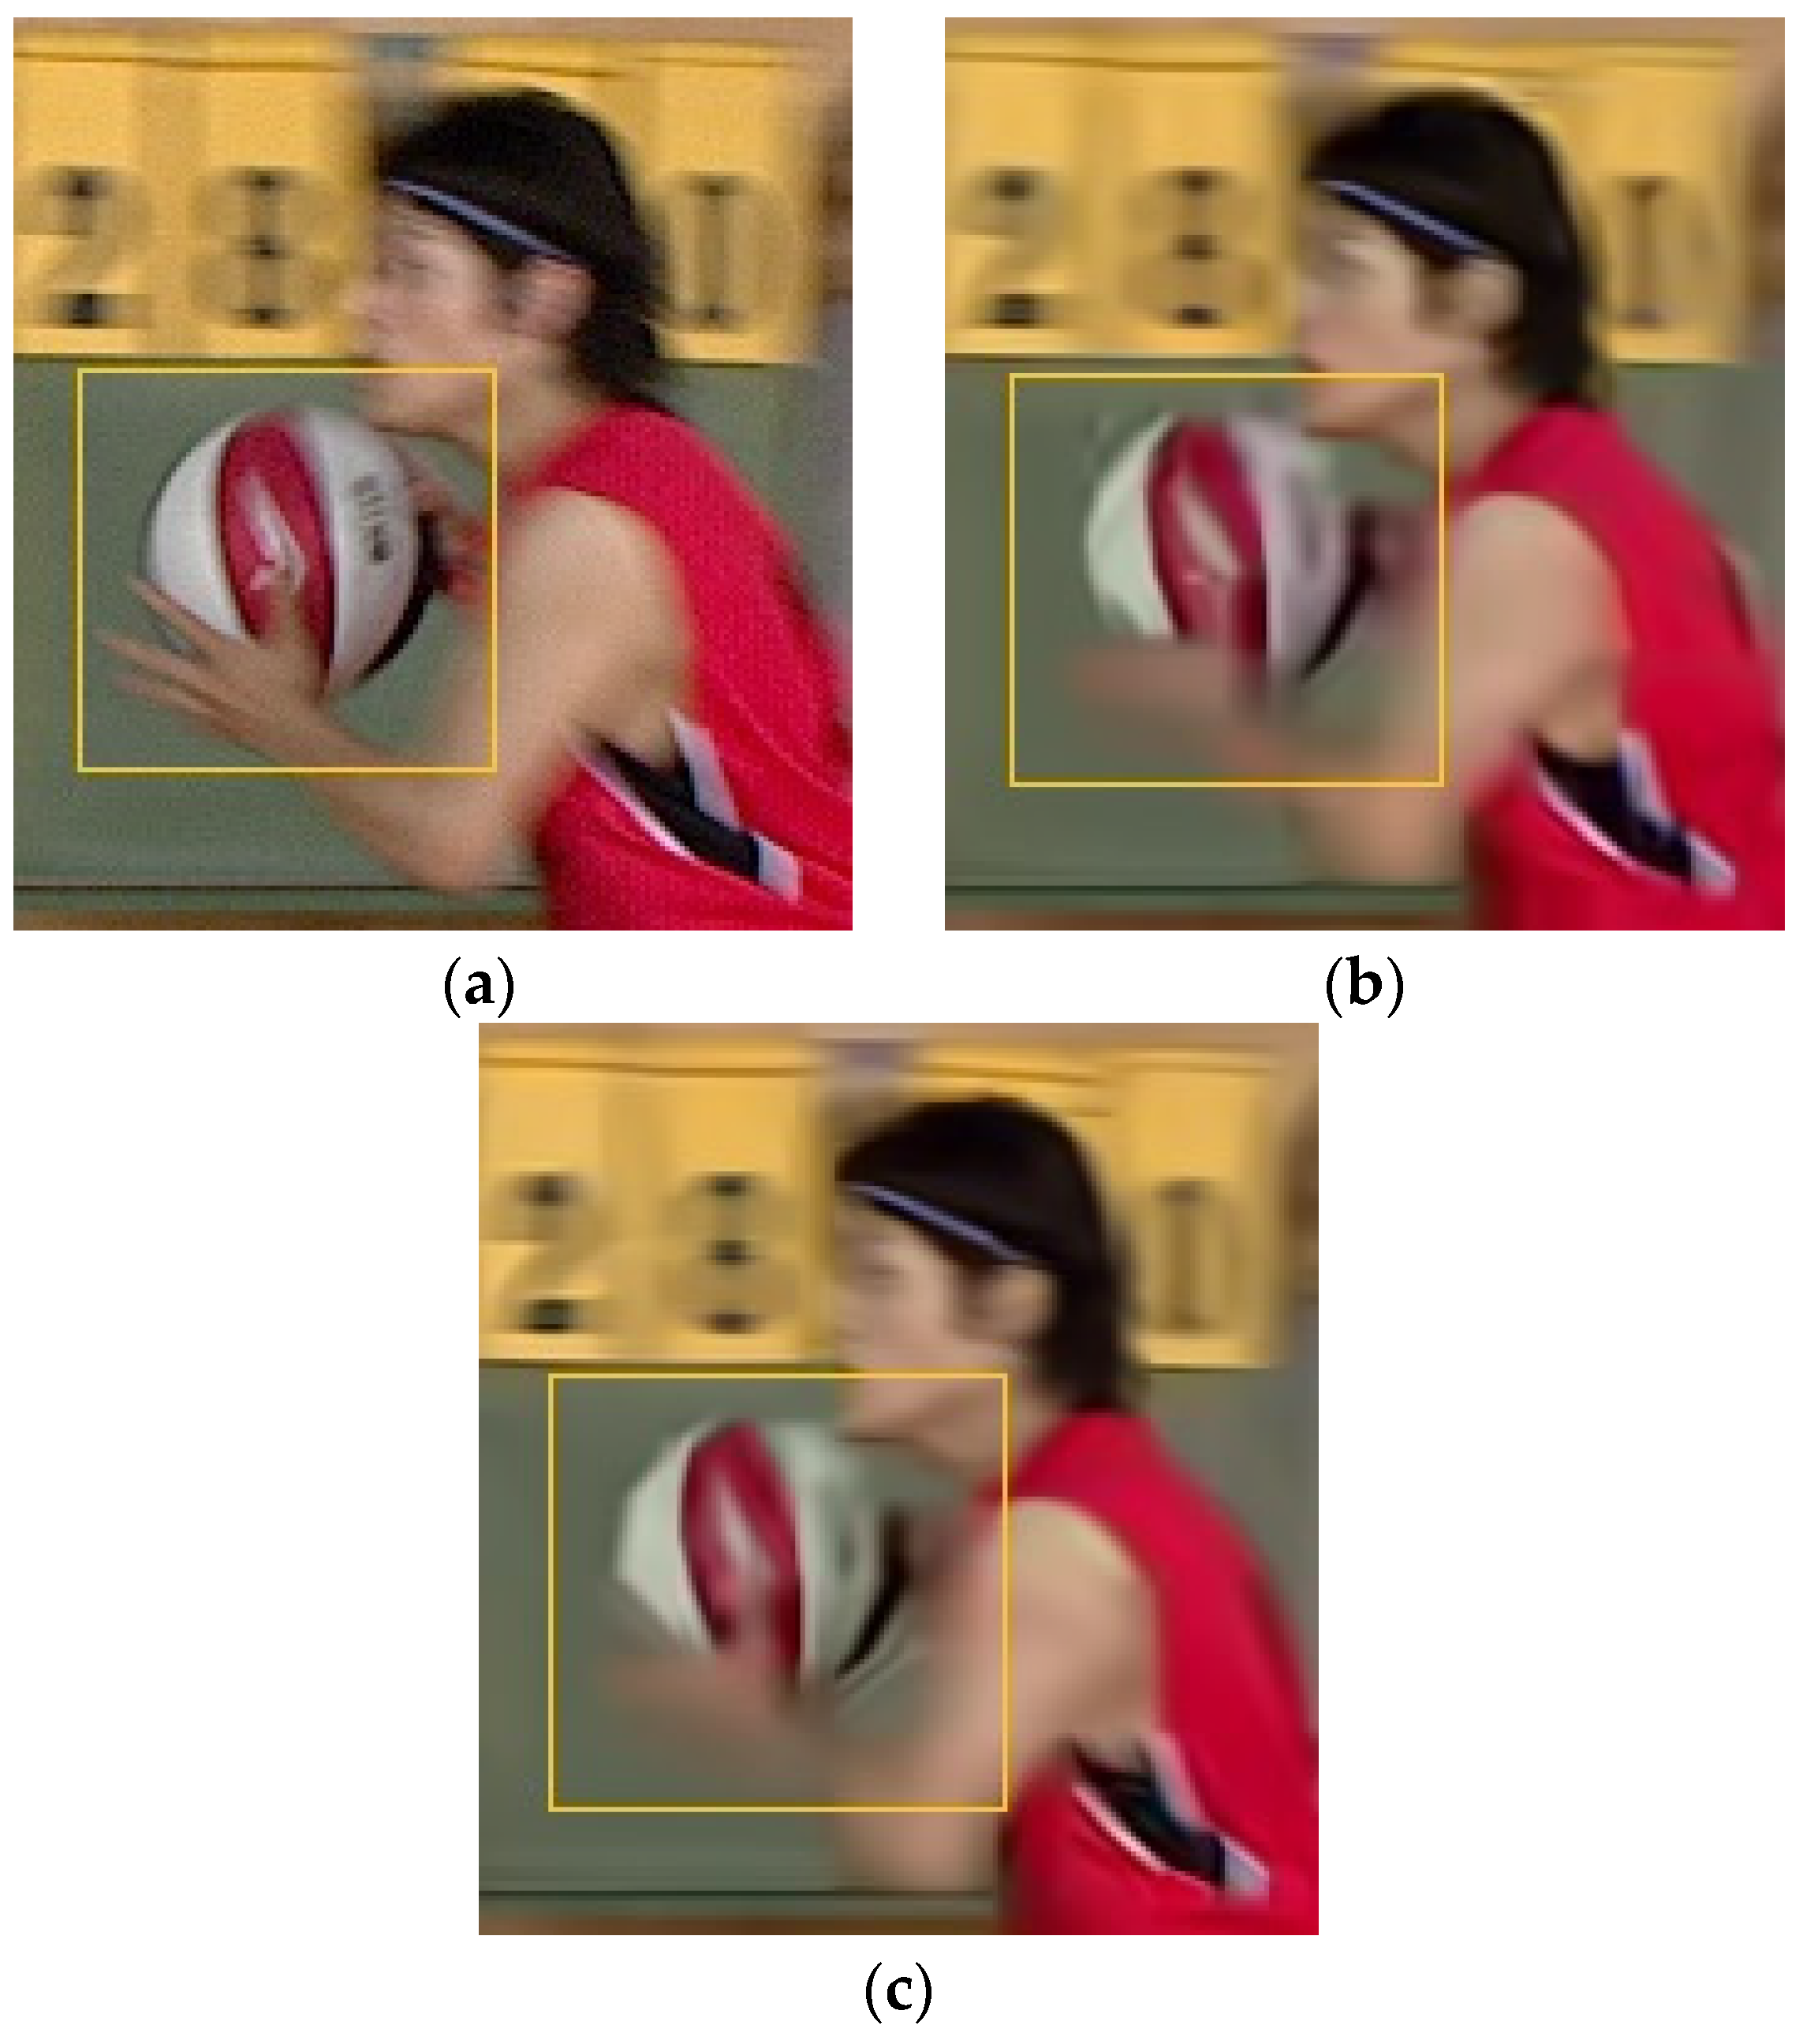
  • The object detection algorithm, YOLOv3, sometimes fails to detect objects that should be detected; fast motion and rapid zooming in and out of the camera are the main issues that lower the detection accuracy. When the size and shape of objects change quickly, the object detection algorithm has difficulty detecting objects properly. These issues result in a false-alarm area, where the object should be accurately detected but is not. High quantization error occurs in the false-alarm area due to the high QP value. For this reason, high inter prediction errors occur due to the low quality of the false alarm areas to be used as the reference picture. Therefore, the PSNR and BD-rate performance in the RA configuration that uses inter and intra predictions are worse than those in the AI configuration that use only intra prediction. In particular, the average Y BD-rates decreased to 4.10%, 3.54%, and 3.74%, respectively, in the BasketballDrill, BasketballDrive, and BQMall sequences, due to their fast object movements.
  • In Table 5, the BD-rates of the DaylightRoad2 and BQMall sequences in the AI configuration show improvement despite the poor PSNR quality in the background areas.

5. Conclusions

In this paper, we proposed a method for incorporating video compression with an object-detection algorithm. The QP was adjusted in a CU-unit, and the CUs containing objects provide better video quality in the detected-object areas than the background based on a lower QP. By comparison, the CUs without the detected-object areas had low subjective quality based on a higher QP. The averages of ΔY-PSNR, ΔCb-PSNR, and ΔCr-PSNR were better for the areas where objects were detected. The average ΔPSNR in the AI configuration was better than that in the RA configuration because the quality of the reference pictures to be used for inter predictions was worse. The overall BD-rate performance in the AI and RA configurations was poor due to the PSNR drop in the background areas. However, the subjective image quality improved when the proposed object detection-based coding was applied. Therefore, the detected objects showed better picture quality. As the objects were not precisely detected in the boundaries of objects, it was not easy to clearly divide and encode the object boundaries using the block-based VVC standard. Although the proposed object detection-based video coding increased the BD-rate, as shown in Table 5, it has many application fields, such as traffic monitoring, density detection and prediction, traffic flow prediction, and resource allocation, in which it is necessary to display only a specific object with high quality without background areas, display all detected objects without background areas, recognize a specific object, obtain security information, etc. Our proposed method is provided with executable code and two batch files in [27]. This consists of two batch files that process the encoder and decoder.

6. Future Works

Video compression using Supplemental Enhancement Information (SEI) messages may replace the proposed method. Object information is transmitted through an SEI message, but the SEI message should not change the decoder syntax. Therefore, unlike the proposed method, a process such as post-processing is required. That is, since the CU-based QP-control using the SEI message cannot directly be applied to the VTM-8.2 encoder and decoder, the reconstruction block obtained by the VTM-8.2 encoder and that obtained by the CU-based QP-control using the VTM-8.2 encoder are subtracted, and the subtracted (residual) sample values are transmitted by the SEI message for post-processing in the VTM-8.2 decoder. Figure 12 shows the block diagram of the video compression using the SEI message in the decoder. The VTM-8.2 decoder is used to create the reconstruction video and the object information in the SEI message shown in Figure 12 is used in the post-processing. The CU-based QP-control using the SEI message increases the complexity due to the VVC encoder having to perform twice as many times. Since the SEI message is not allowed to change the VTM-8.2 bitstream syntax, it needs twice the encoding: the VTM-8.2 encoding and the CU-based QP-control encoding, which is similar to the method proposed in Section 3.2. Since the CU-based QP-control method using the SEI message encodes all the residual samples between the VTM-8.2 reconstruction samples and the CU-based QP-control reconstruction samples to transmit the message in the SEI bitstream, the bitstream size is increased. However, the proposed method encodes the object information once in the feature bitstream. Therefore, the proposed method only has to send information such as the center (x, y) coordinate of each object, the width and height of each object, and the name of each object (object index) obtained from the object detection. In conclusion, the CU-based QP-control using an SEI message may be used in an object-detection algorithm, but the complexity and bitstream size are currently too high.

Author Contributions

M.-J.K. and Y.-L.L. conceived and designed the experiments; M.-J.K. implemented software and performed the experiments; Y.-L.L. supervised the algorithm; and Y.-L.L. and M.-J.K. wrote the paper. All authors have read and agreed to the published version of the manuscript.

Funding

This research was in part supported by the National Research Foundation of Korea (NRF) grant funded by the Korea government (NRF-2018R1D1A1B07045156).

Acknowledgments

This research was in part supported by Basic Science Research Program through the National Research Foundation of Korea (NRF) funded by the Ministry of Education (No. NRF-2018R1D1A1B07045156).

Conflicts of Interest

The authors declare no conflict of interest.

References

  1. Cisco Annual Internet Report. Cisco Annual Internet Report (2018–2023) White Paper. 2020. Available online: https://www.cisco.com/c/en/us/solutions/collateral/executive-perspectives/annual-internet-report/white-paper-c11-741490.html (accessed on 28 September 2020).
  2. Bross, B.; Chen, J.; Liu, S.; Wang, Y.-K. Versatile Video Coding (Draft 10), document JVET-S2001 of Joint Video Experts Team (JVET) of ITU-T SG 16 WP 3 and ISO/IEC JTC 1/SC 29/WG 11. In Proceedings of the 19th JVET Meeting, Geneva, Switzerland, 22 June–1 July 2020. [Google Scholar]
  3. High Efficient Video Coding (HEVC), Standard ITU-T Recommendation H.265 and ISO/IEC 23008-2. April 2013. Available online: https://www.itu.int/rec/T-REC-H.265 (accessed on 28 April 2022).
  4. Sullivan, G.J.; Ohm, J.; Han, W.; Wiegand, T. Overview of the High Efficiency Video Coding (HEVC) Standard. IEEE Trans. Circuits Syst. Video Technol. 2012, 22, 1649–1668. [Google Scholar] [CrossRef]
  5. Advanced Video Coding (AVC), Standard ITU-T Recommendation H.264 and ISO/IEC 14496-10. May 2003. Available online: https://www.itu.int/rec/T-REC-H.264 (accessed on 20 April 2022).
  6. Wiegand, T.; Sullivan, G.J.; Bjontegaard, G.; Luthra, A. Overview of the H.264/AVC video coding standard. IEEE Trans. Circuits Syst. Video Technol. 2003, 13, 560–576. [Google Scholar] [CrossRef] [Green Version]
  7. Chen, J.; Ye, Y.; Kim, S.H. Algorithm description for Versatile Video Coding and Test Model 10 (VTM 10), document JVET-S2001 of Joint Video Experts Team (JVET) of ITU-T SG 16 WP 3 and ISO/IEC JTC 1/SC 29/WG 11. In Proceedings of the 19th JVET Meeting, Geneva, Switzerland, 22 June–1 July 2020. [Google Scholar]
  8. Lainema, J.; Bossen, F.; Han, W.-J.; Min, J.; Ugur, K. Intra Coding of the HEVC Standard. IEEE Trans. Circuits Syst. Video Technol. 2012, 22, 1792–1801. [Google Scholar] [CrossRef]
  9. Flierl, M.; Wiegand, T.; Girod, B. Rate-constrained multihypothesis prediction for motion-compensated video compression. IEEE Trans. Circuits Syst. Video Technol. 2002, 12, 957–969. [Google Scholar] [CrossRef]
  10. Sole, J.; Joshi, R.; Nguyen, N.; Ji, T.; Karczewicz, M.; Clare, G.; Henry, F.; Duenas, A. Transform Coefficient Coding in HEVC. IEEE Trans. Circuits Syst. Video Technol. 2012, 22, 1765–1777. [Google Scholar] [CrossRef]
  11. Norkin, A.; Bjontegaard, G.; Fuldseth, A.; Narroschke, M.; Ikeda, M.; Andersson, K.; van der Auwera, G. HEVC Deblocking Filter. IEEE Trans. Circuits Syst. Video Technol. 2012, 22, 1746–1754. [Google Scholar] [CrossRef]
  12. Fu, C.-M.; Alshina, E.; Alshin, A.; Huang, Y.-W.; Chen, C.-Y.; Tsai, C.-Y.; Hsu, C.-W.; Lei, S.-M.; Park, J.-H.; Han, W.-J. Sample Adaptive Offset in the HEVC Standard. IEEE Trans. Circuits Syst. Video Technol. 2012, 22, 1755–1764. [Google Scholar] [CrossRef]
  13. Tsai, C.-Y.; Chen, C.-Y.; Yamakage, T.; Chong, I.S.; Huang, Y.-W.; Fu, C.-M.; Itoh, T.; Watanabe, T.; Chujoh, T.; Karczewicz, M.; et al. Adaptive Loop Filtering for Video Coding. IEEE J. Sel. Top. Signal Process. 2013, 7, 934–945. [Google Scholar] [CrossRef]
  14. Bjøntegaard, G. Calculation of Average PSNR Differences between RD-Curves, document VCEG-M33, ITU-T SG 16 Q 6 Video Coding Experts Group (VCEG). In Proceedings of the 13th VCEG Meeting, Austin, TX, USA, 2–4 April 2001. [Google Scholar]
  15. Bjøntegaard, G. Improvements of the BD-PSNR Model, document VCEG-AI11, ITU-T SG 16 Q 6 Video Coding Experts Group (VCEG). In Proceedings of the 35th VCEG Meeting, Berlin, Germany, 16–18 July 2008. [Google Scholar]
  16. Redmon, J.; Divvala, S.; Girshick, R.; Farhadi, A. You only Look Once: Unified, Real-time Object Detection. In Proceedings of the IEEE Conference on Computer Vision and Pattern Recognition, Las Vegas, NV, USA, 27–30 June 2016; pp. 779–788. [Google Scholar] [CrossRef] [Green Version]
  17. Lin, T.-Y.; Dollar, P.; Girshick, R.; He, K.; Hariharan, B.; Belongie, S. Feature Pyramid Networks for Object Detection. In Proceedings of the IEEE Conference on Computer Vision and Pattern Recognition (CVPR), Honolulu, HI, USA, 21–26 July 2017. [Google Scholar]
  18. Ren, S.; He, K.; Girshick, R.; Sun, J. Faster R-CNN: Towards real-time object detection with region proposal networks. arXiv 2015, arXiv:1506.01497. [Google Scholar] [CrossRef] [Green Version]
  19. Zhang, Y.; Yu, L.; Lee, J.; Rafie, M.; Liu, S. Draft use cases and requirements for Video Coding for Machines, document N133 of ISO/IEC JTC 1/SC 29/WG 2. In Proceedings of the 136th MPEG Meeting, Online, 11–15 October 2021. [Google Scholar]
  20. YOLO: Real-Time Object Detection. YOLO Website. Available online: https://pjreddie.com/darknet/yolo/ (accessed on 1 July 2020).
  21. Gao, W.; Liu, S.; Xu, X.; Rafie, M.; Zhang, Y.; Curcio, I. Recent Standard Development Activities on Video Coding for Machines. arXiv 2021, arXiv:2105.12653. [Google Scholar]
  22. Rafie, M.; Zhang, Y.; Liu, S. Evaluation Framework for Video Coding for Machines, document N134 of ISO/IEC JTC 1/SC 29/WG 2. In Proceedings of the 136th MPEG Meeting, Online, 11–15 October 2021. [Google Scholar]
  23. Yang, W.; Huang, H.; Hu, Y.; Duan, L.-Y.; Liu, J. Video Coding for Machine: Compact Visual Representation Compression for Intelligent Collaborative Analytics. arXiv 2021, arXiv:2110.09241. [Google Scholar]
  24. Fischer, K.; Brand, F.; Herglotz, C.; Kaup, A. Video Coding for Machines with Feature-Based Rate-Distortion Optimization. In Proceedings of the 2020 IEEE 22nd International Workshop on Multimedia Signal Processing, Tampere, Finland, 21–24 September 2020. [Google Scholar]
  25. Duan, L.-Y.; Liu, J.; Yang, W.; Huang, T.; Gao, W. Video Coding for Machines: A Paradigm of Collaborative Compression and Intelligent Analytics. arXiv 2020, arXiv:2001.03569v2. [Google Scholar] [CrossRef]
  26. Bossen, F.; Boyce, J.; Li, X.; Seregin, V.; Sühring, K. JVET common test conditions and software reference configurations for SDR video, document N1010 of Joint Video Experts Team (JVET) of ITU-T SG 16 WP 3 and ISO/IEC JTC 1/SC 29/WG 11. In Proceedings of the 14th JVET Meeting, Geneva, Switzerland, 19–27 March 2019. [Google Scholar]
  27. Sejong University, Digital Media System Laboratory. DMS Website. Available online: https://dms.sejong.ac.kr/research.htm (accessed on 22 April 2022).
Figure 1. Example of a picture partitioned into tiles and slices [7].
Applsci 12 04525 g001
Figure 2. Examples of VCM pipelines: (a) video coding, (b) feature coding, and (c) hybrid coding, in which Video Encoder and Video Decoder represent the VVC encoder and decoder, respectively. [22].
Applsci 12 04525 g002
Figure 3. Block diagram of the proposed object detection-based video compression in the decoder. (object information from the Feature Decoder: number of detected objects and, for each object index, starting (x, y) coordinate, width and height of objects, etc.).
Applsci 12 04525 g003
Figure 4. Example of the object-detected 186th picture in the 832 × 480 BQMall sequence.
Applsci 12 04525 g004
Figure 5. CU partitioning results for the 186th picture in the BQMall with QP = 32 (red outlined blocks: object-detected areas; white outlined blocks: no-object detected areas).
Applsci 12 04525 g005
Figure 6. Example of the object-detected pictures in the 1920 × 1080 MarketPlace sequence: (a) 226th picture, (b) 234th picture, (c) 240th picture, and (d) 246th picture. (purple colored block: person; green colored block: truck; blue colored block: chair).
Applsci 12 04525 g006
Figure 7. Example of the object-detected 501st picture in the 1920 × 1080 BQTerrace sequence.
Applsci 12 04525 g007
Figure 8. Example of the object-detected 13th picture in the 3840 × 2160 DaylightRoad2 sequence of class A2.
Applsci 12 04525 g008
Figure 9. Experimental results in the cropped 501st picture of the BQTerrace sequence, where the start (x, y) coordinate of the cropped image is (1480, 470) and (width, height) is (140, 125): (a) original sequence, (b) anchor (VTM-8.2) compressed with QP = 32 in the RA configuration, and (c) proposed method in the RA configuration.
Applsci 12 04525 g009
Figure 10. Experimental results in the cropped 100th picture of the BasketballDrive sequence, where the start (x, y) coordinate of the cropped image is (1525, 800) and (width, height) is (180, 215): (a) original sequence, (b) anchor (VTM-8.2) compressed with QP = 27 in the RA configuration, and (c) proposed method in the RA configuration.
Applsci 12 04525 g010
Figure 11. Experimental results in the cropped 5th picture of the BasketballDrive sequence, where the start (x, y) coordinate of the cropped image is (1080, 400) and (width, height) is (170, 185): (a) original sequence, (b) anchor (VTM-8.2) compressed with QP = 37 in the RA configuration, and (c) proposed method in the RA configuration.
Applsci 12 04525 g011
Figure 12. Block diagram of the proposed video compression using SEI messages in the decoder. (object information from the Feature Decoder: the center (x, y) coordinate of each object, the width and height of each object, and the name of each object (object index)).
Applsci 12 04525 g012
Table 1. Name of objects and object index in voc.data.
IndexName of ObjectIndexName of Object
0airplane10table
1bicycle11dog
2bird12horse
4bottle14person
8chair18train
9cow19monitor
Table 2. Name of objects and object index in coco.data.
IndexName of ObjectIndexName of Object
0person60table
1bicycle61toilet
2car62monitor
3motorbike63laptop
18sheep78hair drier
19cow79toothbrush
Table 3. Information on video sequence for each class.
ClassSequence NamePicture SizeNumber of PictureFrame RateBit Depth
A1Tango2 3840 × 2160 294 60 10
FoodMarket4 3840 × 2160 300 60 10
Campfire 3840 × 2160 300 30 10
A2CatRobot1 3840 × 2160 300 60 10
DaylightRoad2 3840 × 2160 300 60 10
ParkRunning3 3840 × 2160 300 50 10
BMarketPlace 1920 × 1080 600 60 10
RitualDance 1920 × 1080 600 60 10
Cactus 1920 × 1080 500 50 8
BasketballDrive 1920 × 1080 500 50 8
BQTerrace 1920 × 1080 600 60 8
CRaceHorses 832 × 480 300 30 8
BQMall 832 × 480 600 60 8
PartyScene 832 × 480 500 50 8
BasketballDrill 832 × 480 500 50 8
DRaceHorses 416 × 240 300 30 8
BQSquare 416 × 240 600 60 8
BlowingBubbles 416 × 240 500 50 8
BasketballPass416 × 240 500 50 8
Table 4. Experimental results of the average ΔY-PSNR, the average ΔCb-PSNR, and the average ΔCr-PSNR for class (A1 to C) sequences.
Random Access (RA)All Intra (AI)
ClassSequenceQPAverage Δ-PSNRAverage ΔCb-PSNRAverage ΔCr-PSNRAverage ΔY-PSNRAverage ΔCb-PSNRAverage ΔCr-PSNR
Class A1 4KTango2220.05%−0.04%0.07%0.23%0.04%0.10%
270.03%0.01%0.09%0.08%−0.02%0.07%
320.08%0.13%0.08%0.10%−0.03%0.01%
370.12%0.30%0.12%0.13%0.02%0.10%
FoodMarket4220.54%0.57%0.42%0.08%0.08%0.08%
270.61%0.58%0.46%0.08%0.10%0.14%
320.70%0.69%0.60%0.13%0.10%0.15%
370.79%0.70%0.55%0.22%0.17%0.22%
Campfire22−1.22%2.43%−0.65%0.65%0.32%0.10%
27−0.95%3.78%0.14%0.22%0.22%0.12%
32−0.18%4.74%0.65%0.08%0.15%0.04%
370.80%5.13%0.94%0.12%0.06%0.16%
Class A2 4KCatRobot1220.19%0.11%0.18%0.45%0.07%0.19%
270.14%0.09%0.16%0.17%0.05%0.17%
320.17%0.07%0.21%0.23%0.03%0.10%
370.21%0.01%0.19%0.29%0.09%0.18%
DaylightRoad2220.23%0.08%0.08%0.73%0.07%0.10%
270.08%0.10%0.07%0.10%0.06%0.09%
320.09%0.11%0.06%0.13%0.04%0.07%
370.09%0.23%0.13%0.19%0.06%0.07%
ParkRunning3220.68%0.60%0.53%0.73%0.51%0.39%
270.51%0.35%0.27%0.68%0.43%0.28%
320.37%0.25%0.17%0.60%0.26%0.16%
370.26%0.18%0.07%0.49%0.17%0.11%
Class B 1080pMarketPlace22−0.45%−1.90%−1.15%0.44%0.14%0.14%
27−0.47%−1.98%−1.16%0.36%0.13%0.14%
32−0.49%−2.11%−1.16%0.40%0.10%0.10%
37−0.53%−2.39%−1.17%0.40%0.14%0.15%
RitualDance22−0.25%−1.23%−1.01%0.54%0.16%0.18%
27−0.29%−1.29%−1.09%0.53%0.20%0.21%
32−0.35%−1.33%−1.12%0.45%0.19%0.12%
37−0.39%−1.24%−1.13%0.39%0.16%0.22%
Cactus220.24%0.09%0.10%0.85%0.17%0.25%
270.22%0.08%0.09%0.50%0.14%0.27%
320.21%0.06%0.10%0.56%0.12%0.19%
370.21%0.03%0.00%0.57%0.17%0.21%
BasketballDrive220.33%0.12%0.22%0.94%0.23%0.38%
270.20%0.11%0.21%0.49%0.26%0.42%
320.18%0.13%0.18%0.39%0.21%0.30%
370.15%0.12%0.14%0.42%0.31%0.36%
BQTerrace220.36%0.14%0.15%2.25%0.38%0.31%
270.21%0.15%0.14%0.97%0.29%0.22%
320.22%0.13%0.13%0.79%0.20%0.15%
370.26%0.12%0.05%0.71%0.20%0.16%
Class C WVGABasketballDrill220.49%0.37%0.47%1.01%0.66%0.77%
270.33%0.26%0.28%0.78%0.66%0.77%
320.24%0.30%0.27%0.64%0.54%0.46%
370.13%0.23%0.14%0.54%0.50%0.51%
BQMall220.41%0.25%0.27%1.17%0.40%0.43%
270.34%0.18%0.18%0.93%0.39%0.43%
320.28%0.24%0.22%0.74%0.27%0.27%
370.22%0.25%0.24%0.66%0.41%0.37%
PartyScene220.78%0.59%0.58%2.37%0.86%0.77%
270.64%0.44%0.36%1.72%0.79%0.67%
320.51%0.41%0.31%1.16%0.52%0.43%
370.38%0.29%0.24%0.75%0.47%0.40%
RaceHorses220.57%0.23%0.20%1.38%0.72%0.49%
270.34%0.18%0.14%1.06%0.59%0.45%
320.29%0.16%0.15%0.93%0.37%0.35%
370.23%0.20%0.18%0.66%0.44%0.48%
Class A10.11%1.58%0.29%0.18%0.10%0.11%
Class A20.25%0.18%0.18%0.40%0.15%0.16%
Class B−0.02%−0.61%−0.37%0.65%0.20%0.22%
Class C0.39%0.29%0.26%1.03%0.54%0.50%
All0.18%−0.11%−0.02%0.71%0.30%0.30%
Table 5. Experimental result of the BD-rate increments for class (A1 to C) sequences.
Random Access (RA)All Intra (AI)
ClassSequenceAverage Y BD-RateAverage Cb BD-RateAverage Cr BD-RateAverage Y BD-RateAverage Cb BD-RateAverage Cr BD-Rate
Class A1 4KTango22.84%3.14%3.51%0.73%5.47%3.44%
FoodMarket43.72%4.92%5.63%0.83%1.60%1.50%
Campfire1.27%1.21%1.38%0.69%0.19%1.10%
Class A2 4KCatRobot11.49%1.67%1.32%1.01%2.32%1.19%
DaylightRoad20.48%0.74%1.14%−0.17%0.06%−0.15%
ParkRunning30.91%1.14%1.15%0.24%0.90%0.95%
Class B 1080pMarketPlace0.61%1.16%0.96%−0.01%1.69%1.14%
RitualDance3.82%4.41%5.20%0.07%0.87%1.37%
Cactus1.77%2.71%2.92%0.95%2.54%2.12%
BasketballDrive3.54%3.96%3.39%1.07%1.34%0.84%
Class C
WVGA
BQTerrace0.88%1.08%0.49%0.07%0.33%0.26%
BasketballDrill4.10%3.09%3.32%1.01%0.00%−0.08%
BQMall3.74%3.84%4.13%−0.55%1.21%1.33%
PartyScene2.41%2.27%2.65%1.13%1.68%2.16%
AverageClass A12.61%3.09%3.50%0.75%2.42%2.01%
Class A20.96%1.18%1.21%0.36%1.09%0.66%
Class B2.12%2.66%2.59%0.43%1.35%1.14%
Class C3.40%3.46%3.67%0.83%1.92%1.90%
All2.33%2.67%2.78%0.59%1.66%1.42%
Publisher’s Note: MDPI stays neutral with regard to jurisdictional claims in published maps and institutional affiliations.

