
Solar Charging of Electric Vehicles: Experimental Results

Abstract
:1. Introduction
2. Context of the Experiments
2.1. R&D Center of Cadarache
2.2. EVCI
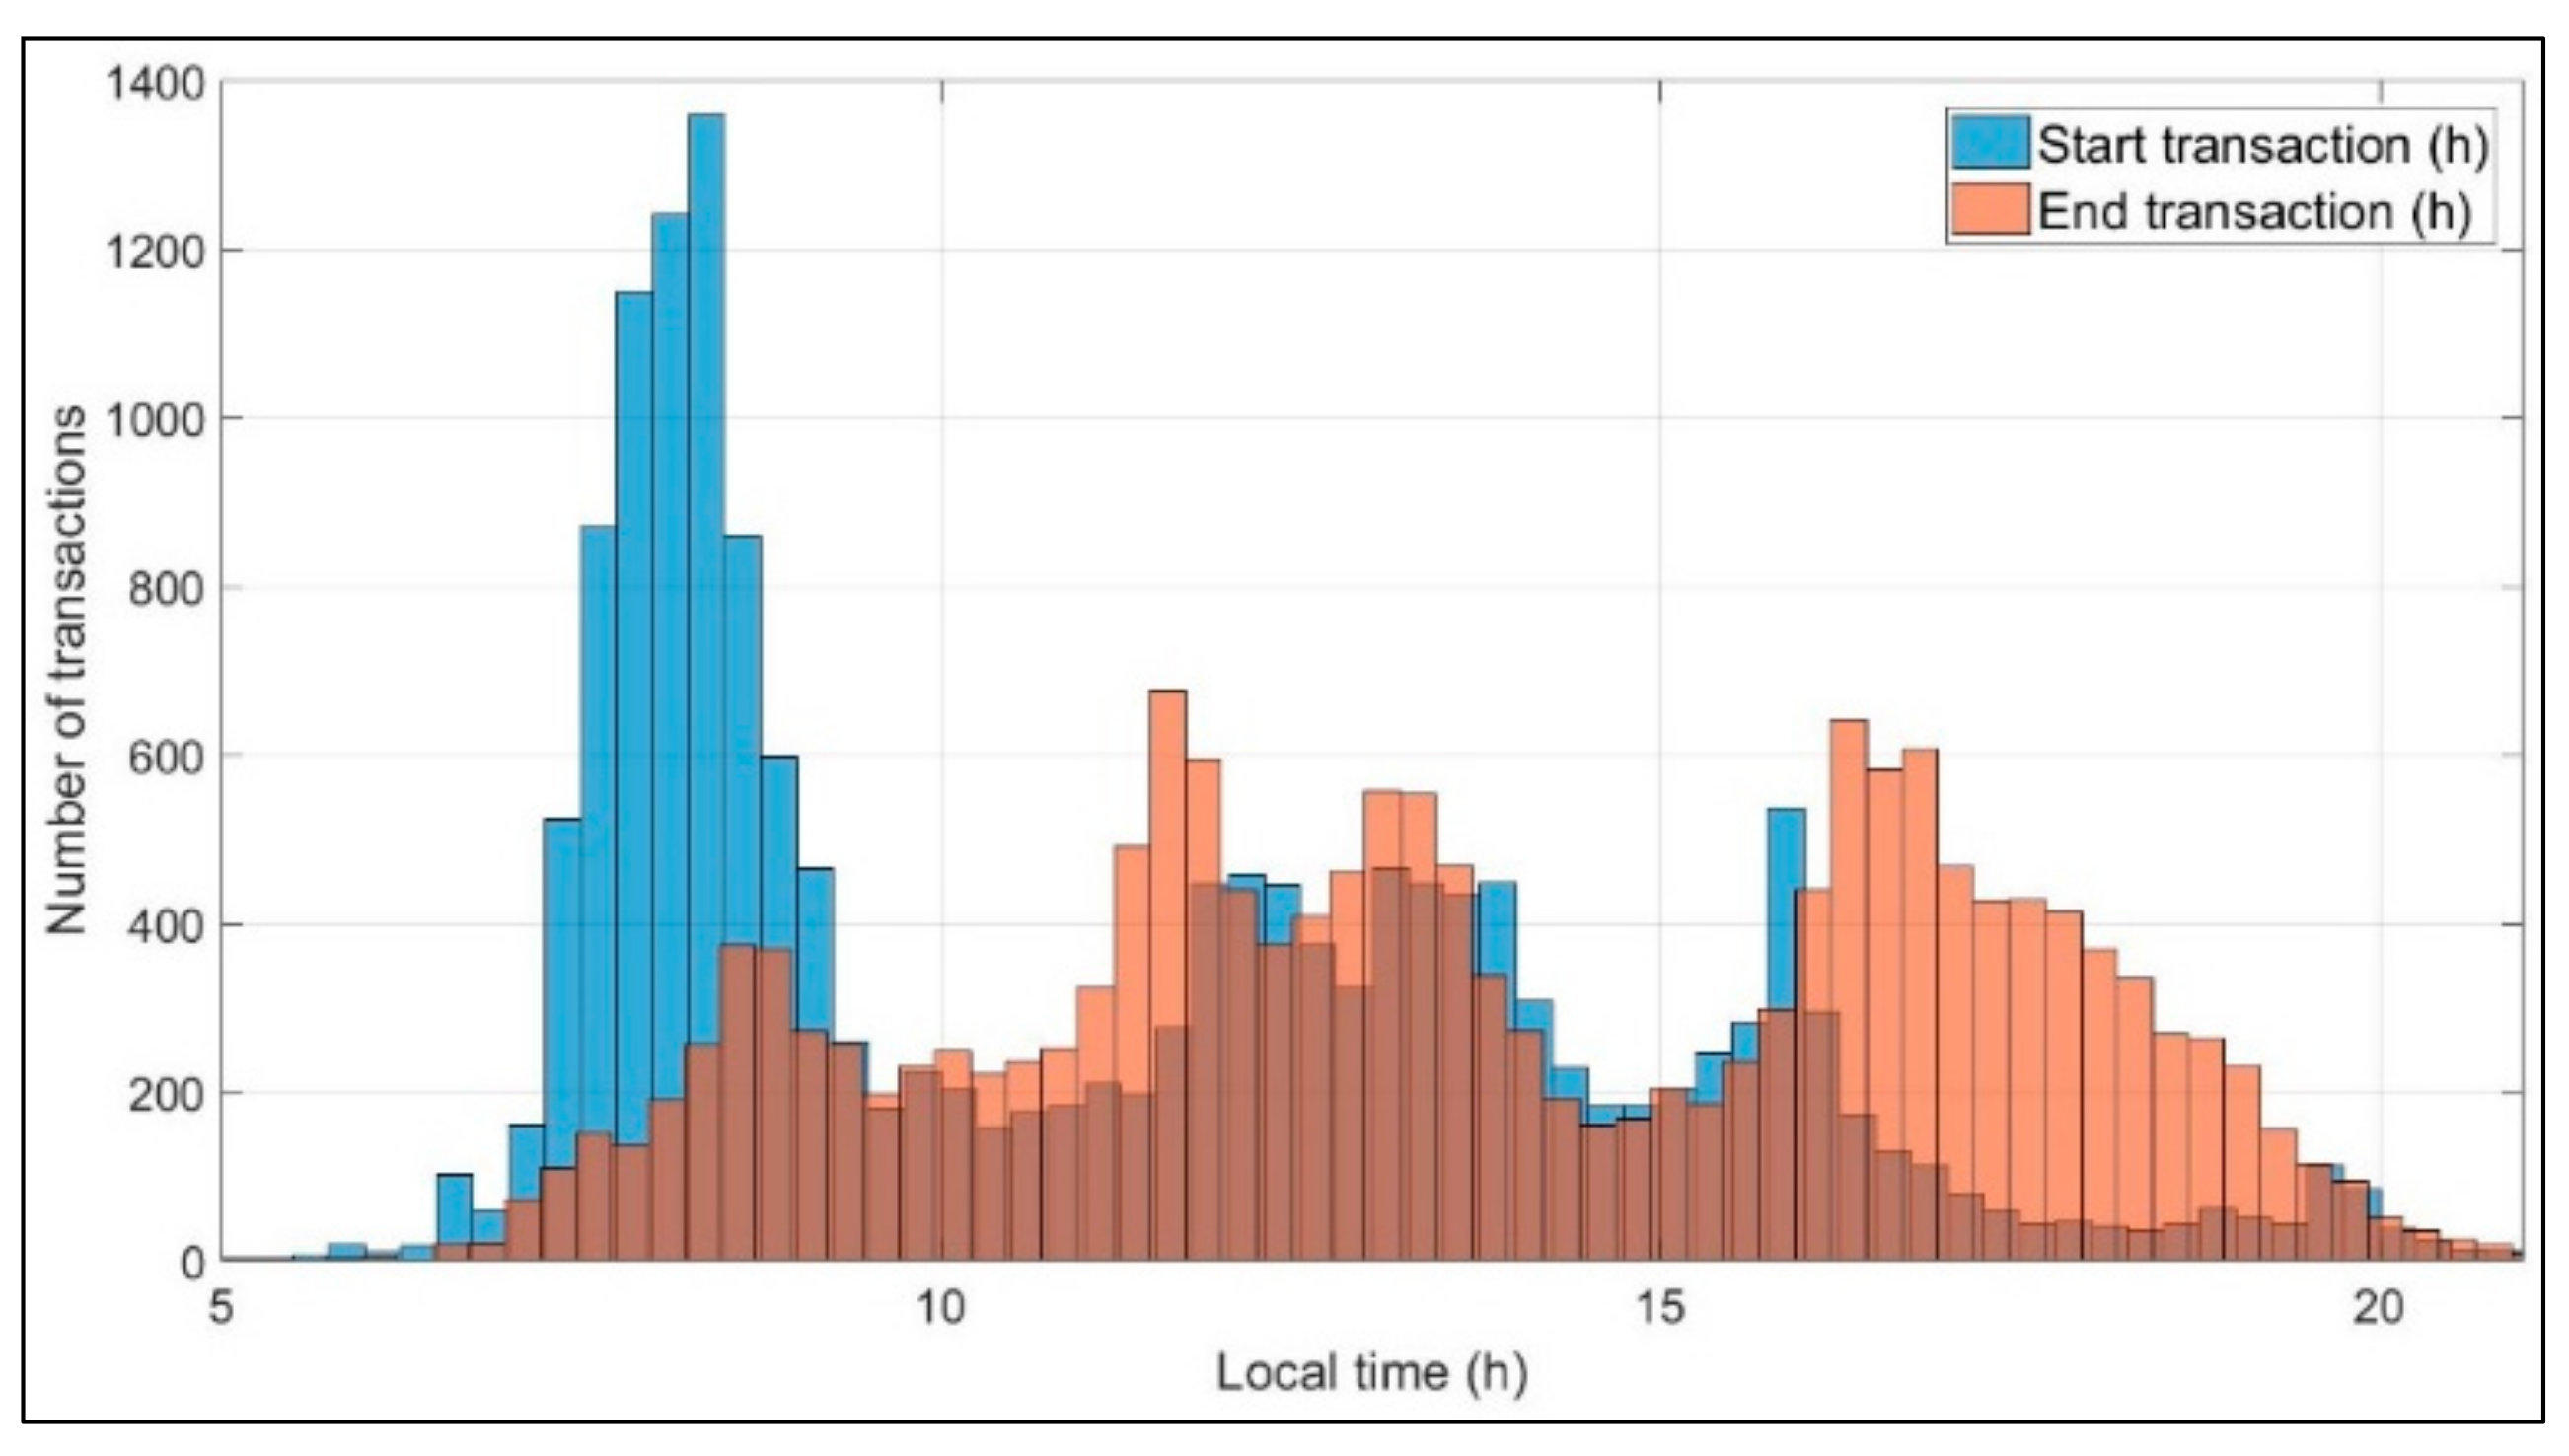
2.3. EVCI Charging History
2.4. EVCI Users
- Seventy-five EV owners (i.e.,about 78% of the volunteer experimenters) agree to give us control over the charging power of their charging sessions. They have also consented to send information about the State of Charge (SOC) of their battery and their forecast departure time. They also provide details on their car’s features (capacity of the battery and maximum power of the onboard charger). The set of these cars is further called “PControlled”.
- Twenty-one employees have not given us control over the charge of their car, but have agreed to send us information about their SOC and their forecast departure time. They also give us details on their car. The set of these cars is further called “PUncontrolled”.
- The other users do not participate to the experiments. They are named ”Others”.
2.5. OCPP Supervisor
2.6. SIGE for the Managers of the EVCI and for the EV Users
2.7. Control Algorithm
2.7.1. Objectives
2.7.2. Charging Power Models
2.7.3. Control Principle
- The available power values are calculated, as detailed in Section 2.7.4.
- These values are allocated amongst the cars that are connected and that are waiting to be charged (i.e., their SOC estimate is lower than 100%). The allocating process is based on a basic scheduling mechanism, i.e., “earliest deadline first” [20], which was adapted to achieve our objectives. In our context, we consider that the “deadline” of a car, also called “lead-time”, is the difference between the time before departure (tdep) and the time needed to recharge the battery without a charging control (tend). The computation of this lead-time is detailed in Section 2.7.6. Then, the planning algorithm estimates the lead-time of all the EVs. The available power is first allocated to the EVs that are not under control (i.e., EVs in set “Uncontrolled”) and to the cars that have a negative lead-time. The maximum charging power is allocated to each of these cars. Then, the remaining power is distributed in the inverse order of the lead-time. The maximum charging power is allocated to the cars that have the smallest lead-time. If there is not enough available power for the cars that have the highest lead-time, they do not recharge during this time step but they will be charged during the next ones. The powers allocated to each EV, for each time step, are the SetPoints that are sent over the 3G network to the charging points.
- The car may either stop charging because it is full prematurely (i.e., before 1 h 50 of charge). SIGE has underestimated the real SOC. It may happen when the real initial SOC is greater than 25%. In that case, the set points are null power values and the charging power is allocated to another car.
- Or it may continue to charge even after 1 h 50 of charge. SIGE has overestimated the real SOC. It may happen when the real initial SOC is less than 25%. In that case, the set points do not change until the charge stops.
2.7.4. Available Power
2.7.5. SOC Estimation
2.7.6. Lead-Time
3. Results
3.1. Preliminary 1: Data Selection
- On the middle: low values for both SP and SPu
- In the upper right corner: high values for both SP and SPu
- At top left: high value for SP and low value for SPu
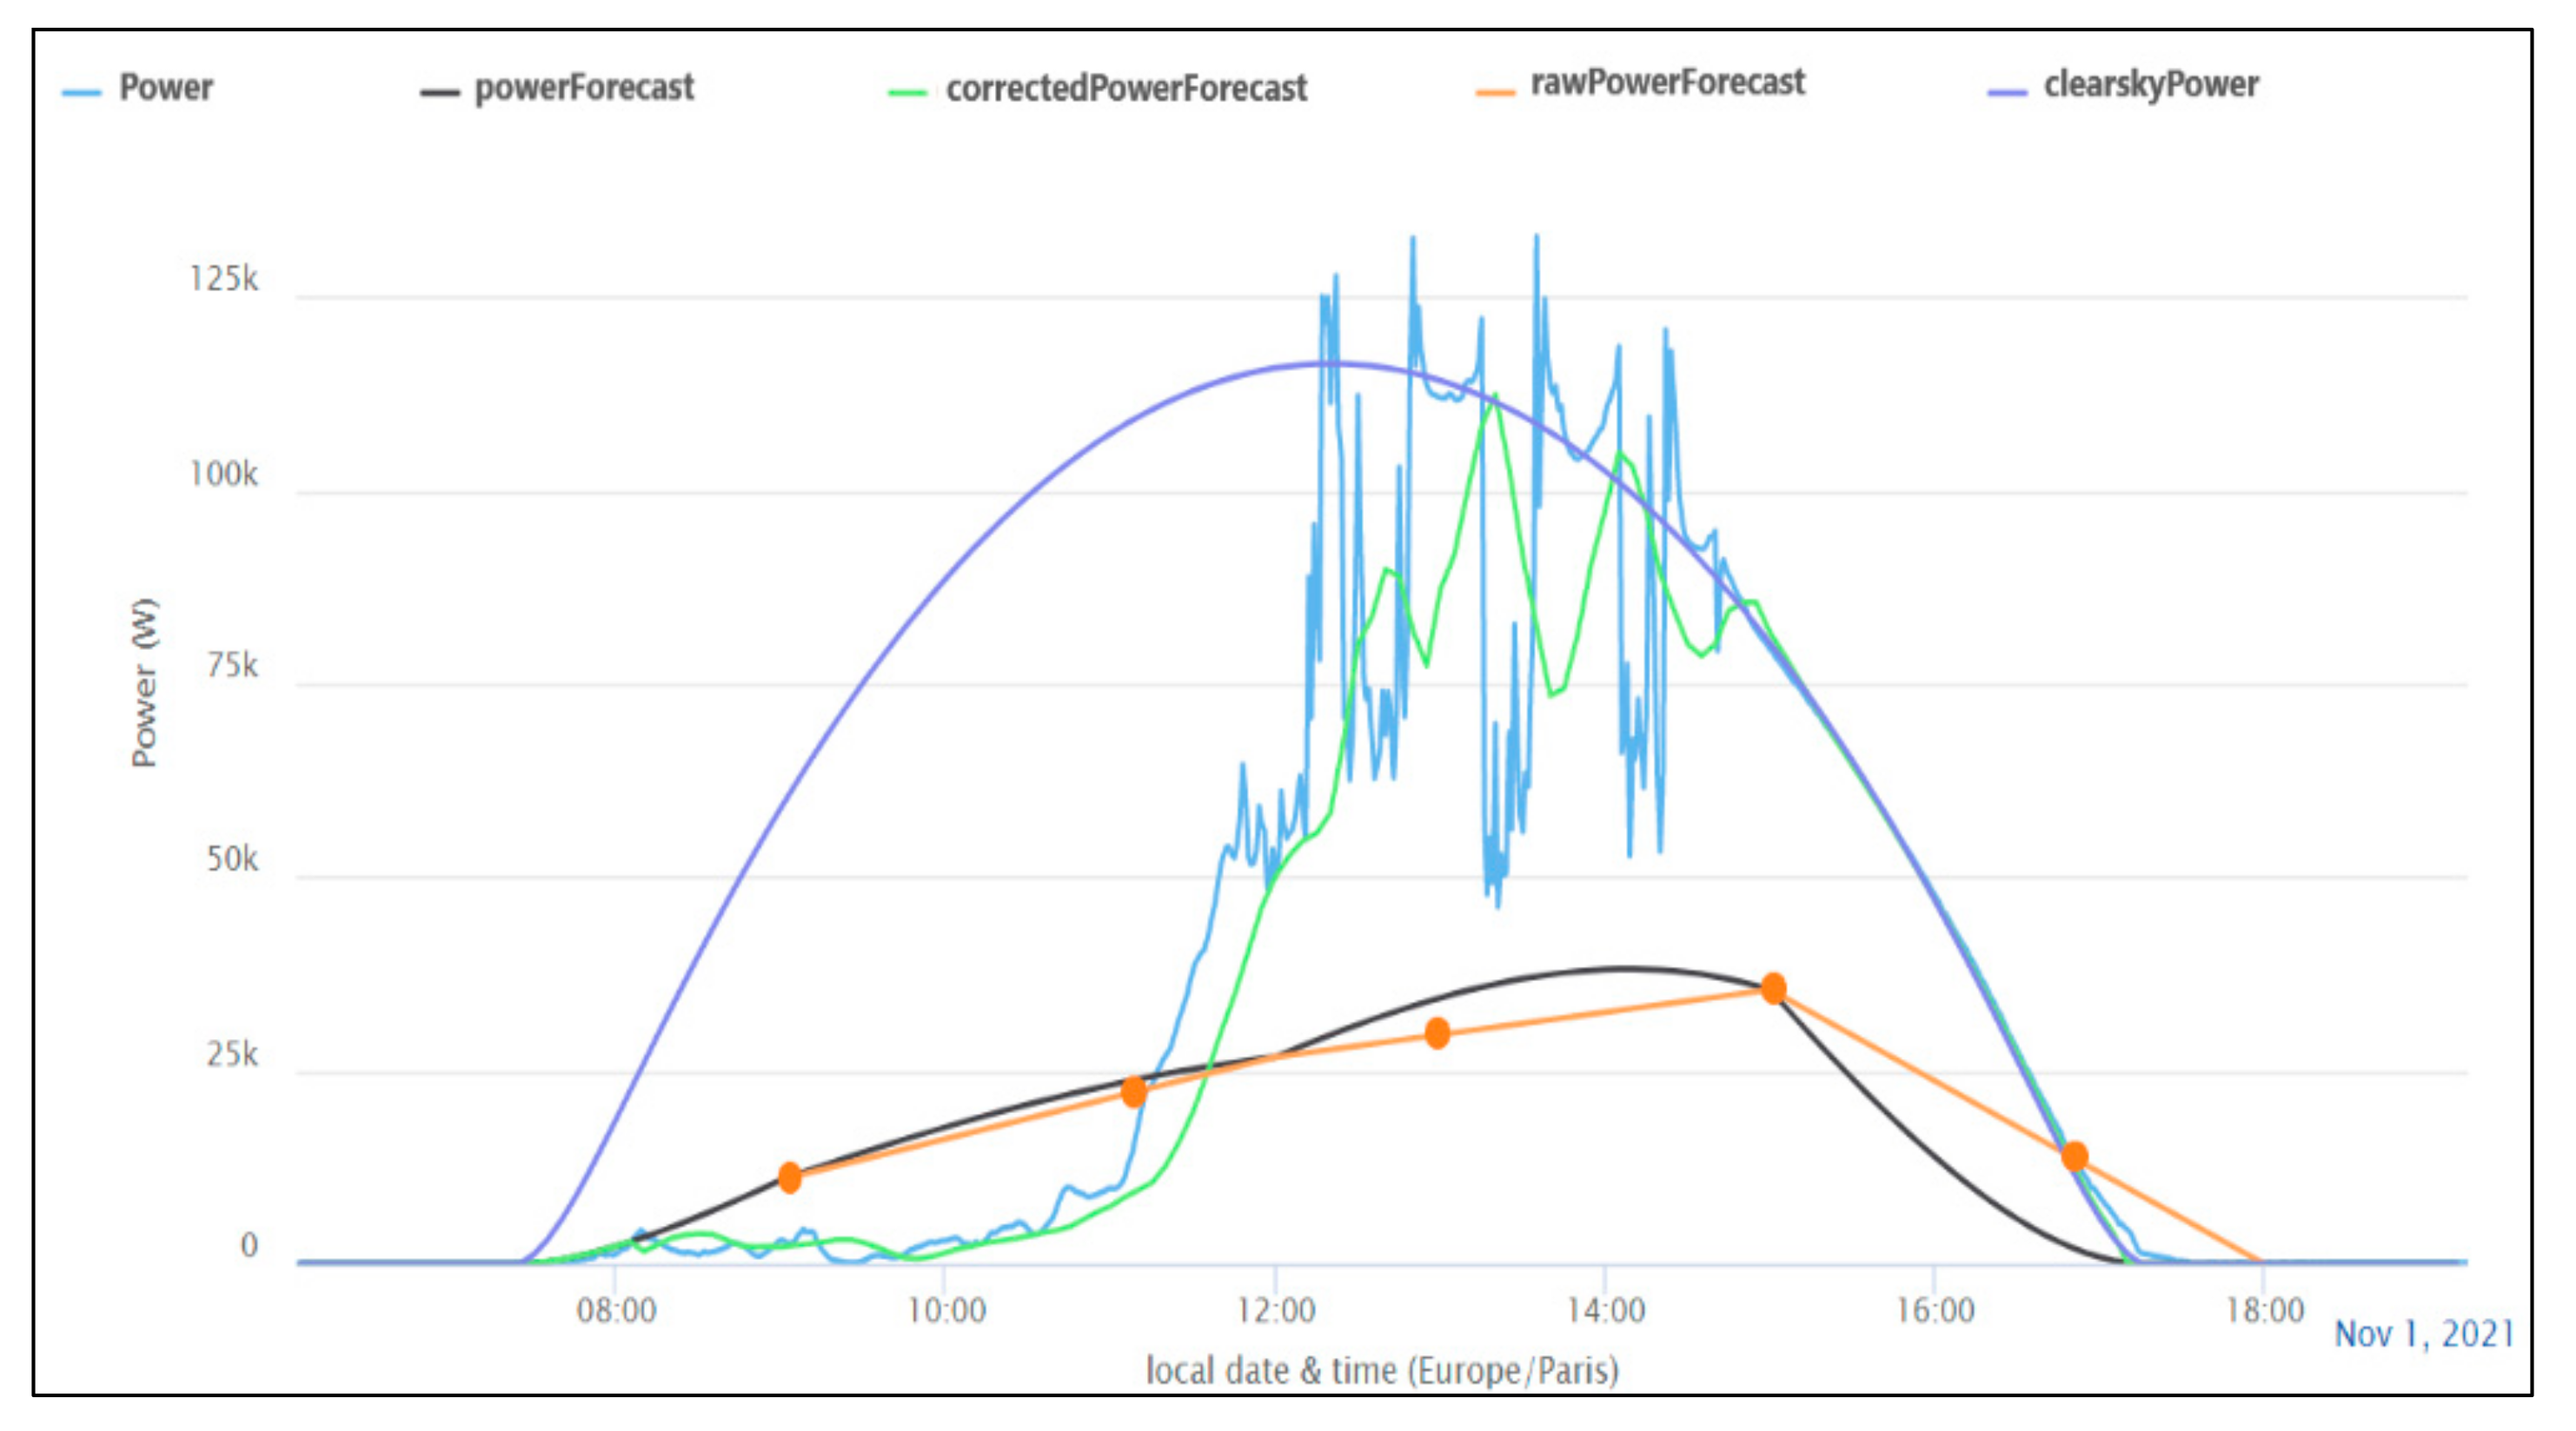
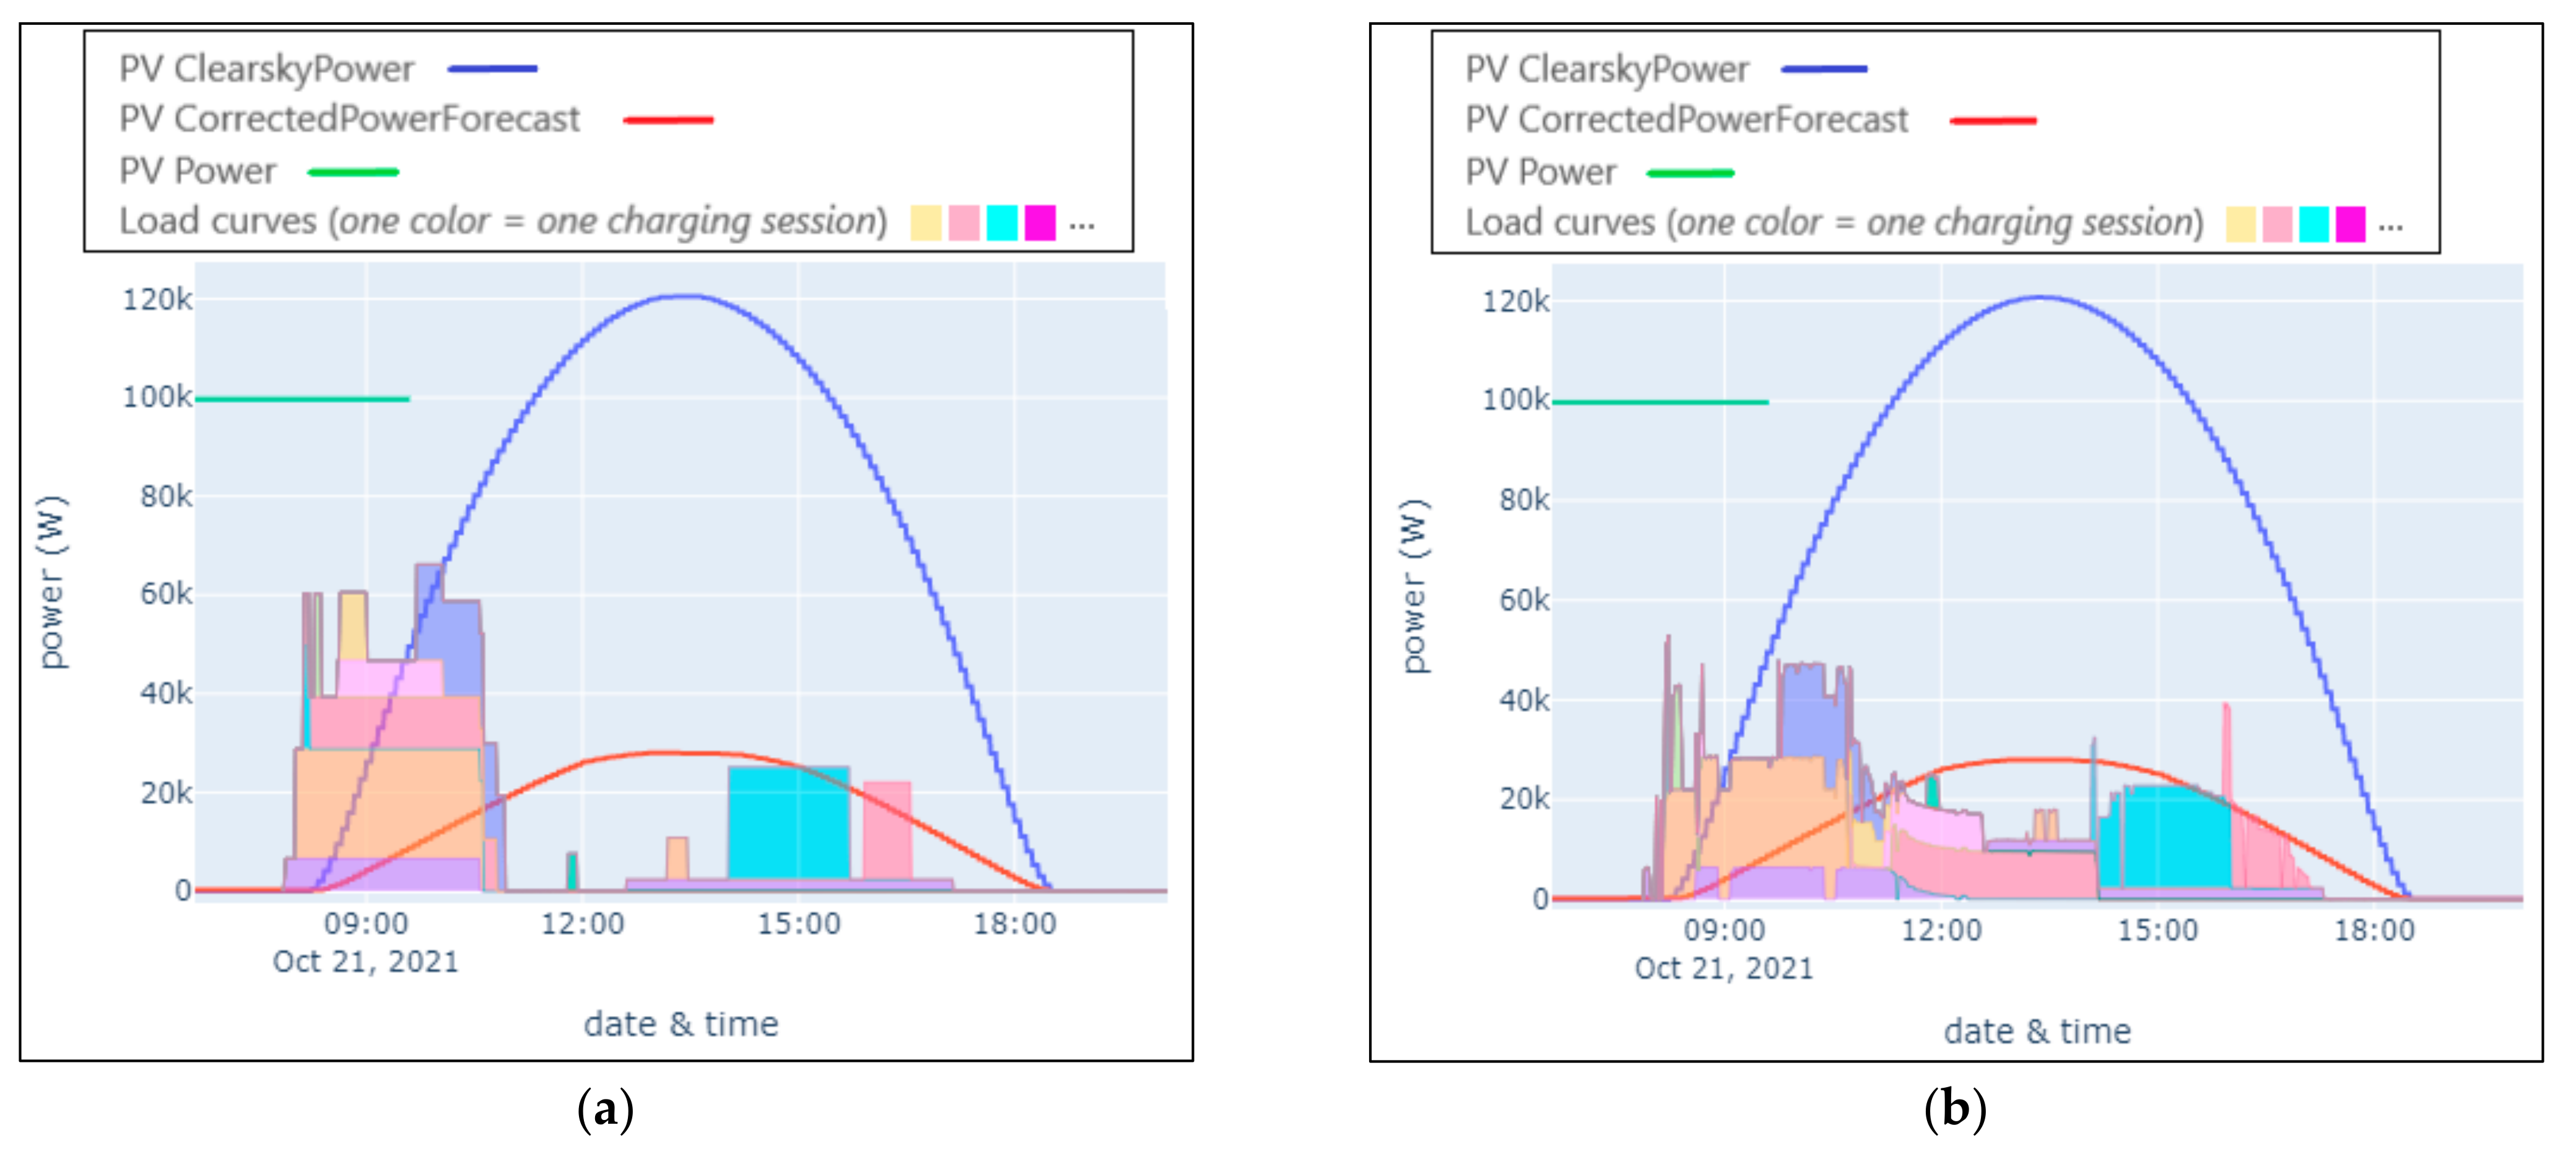
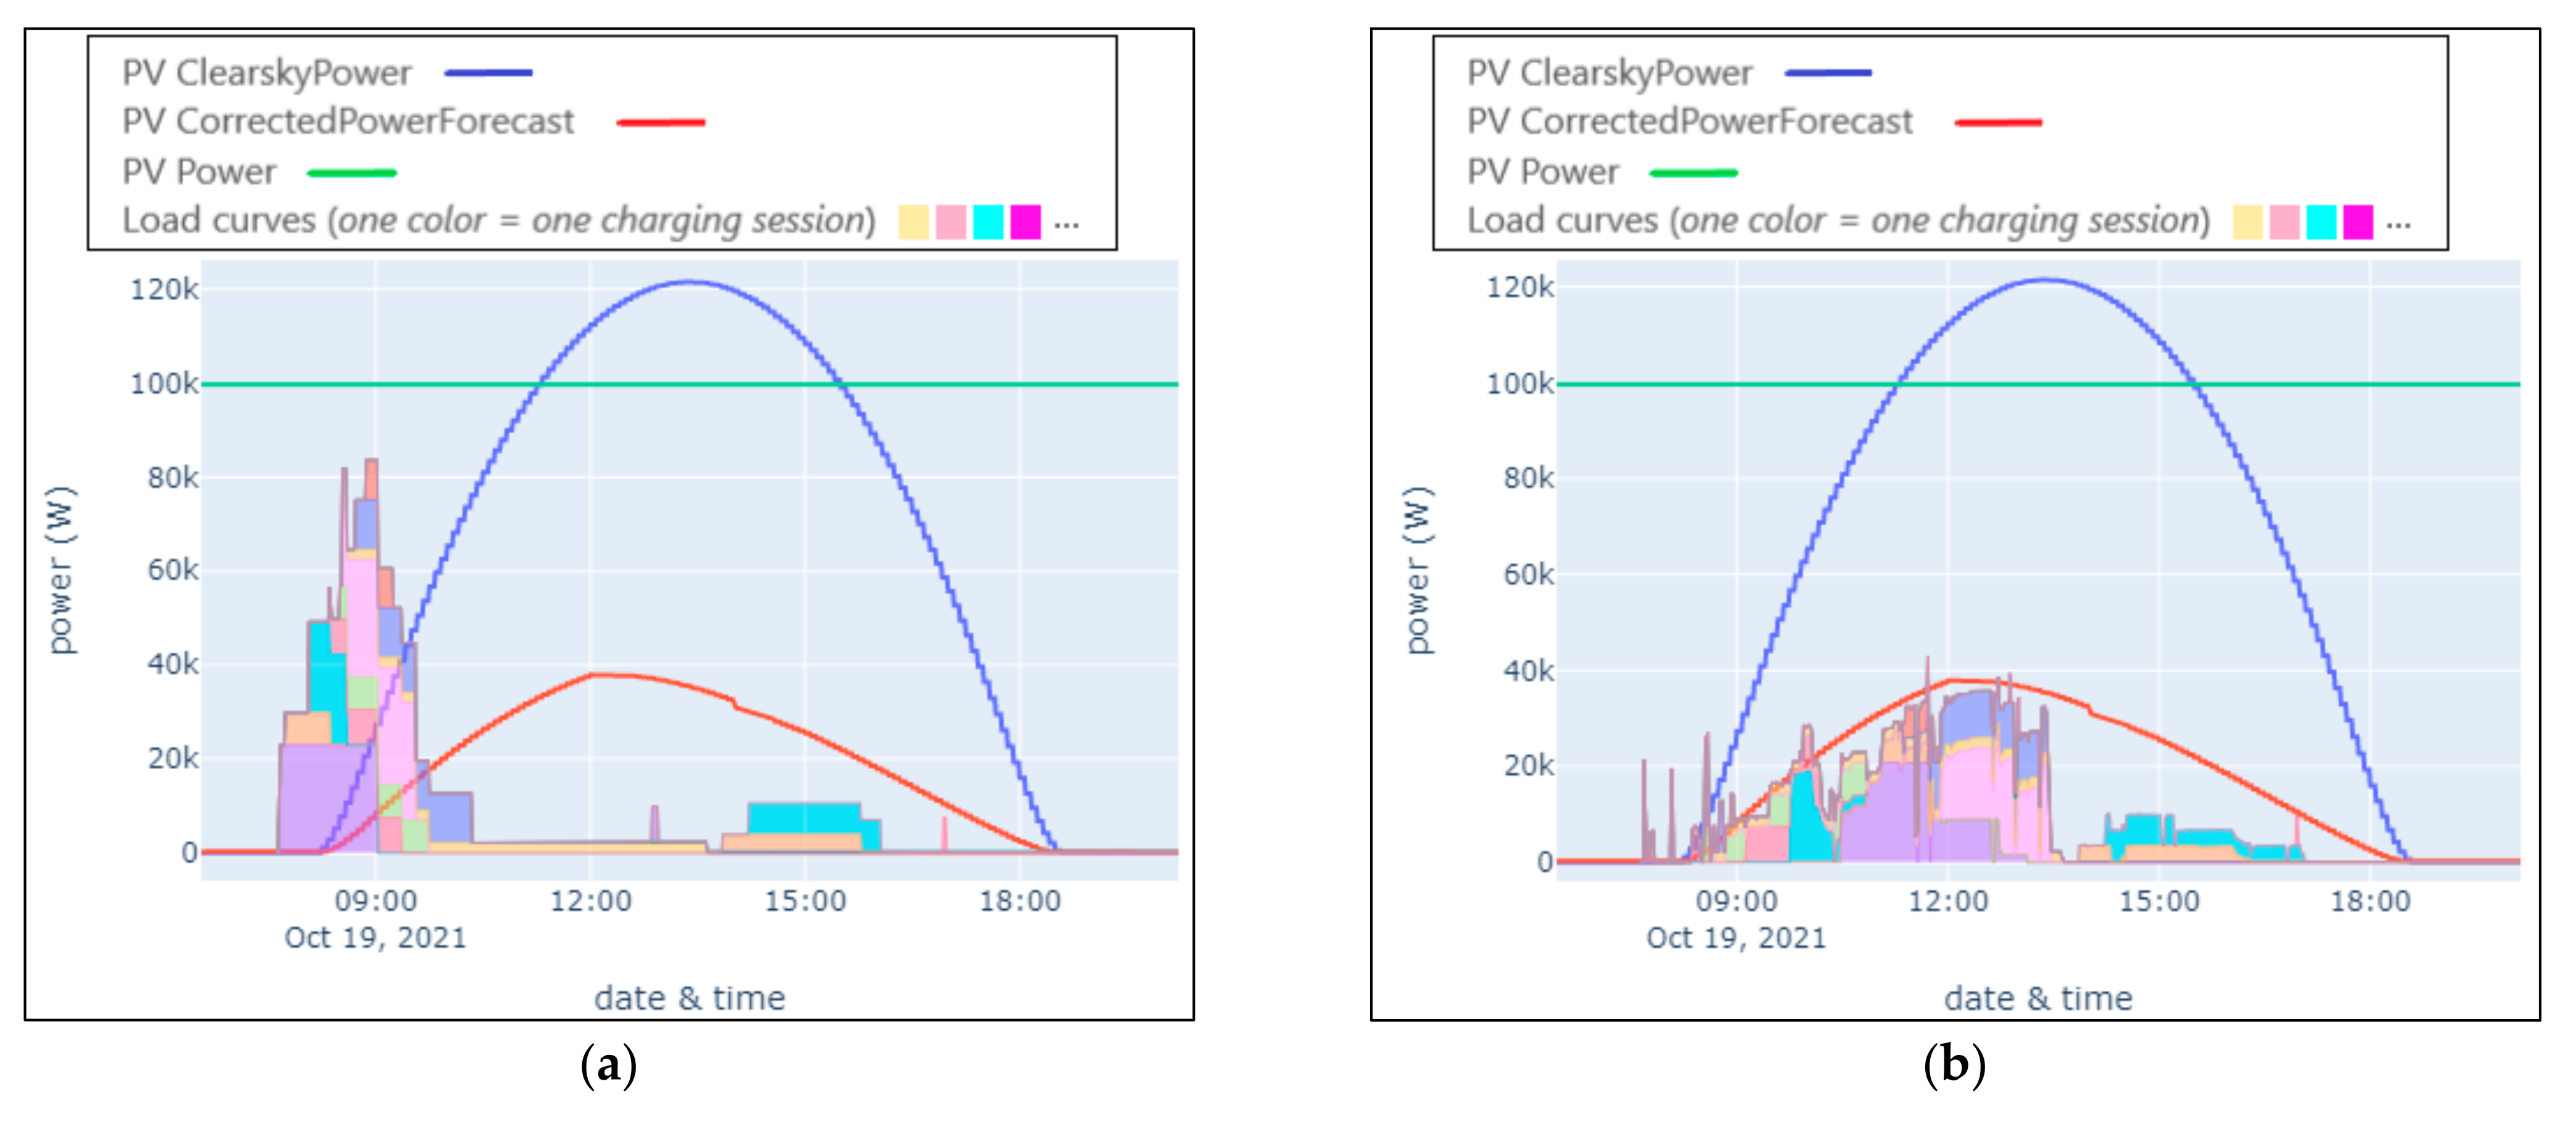
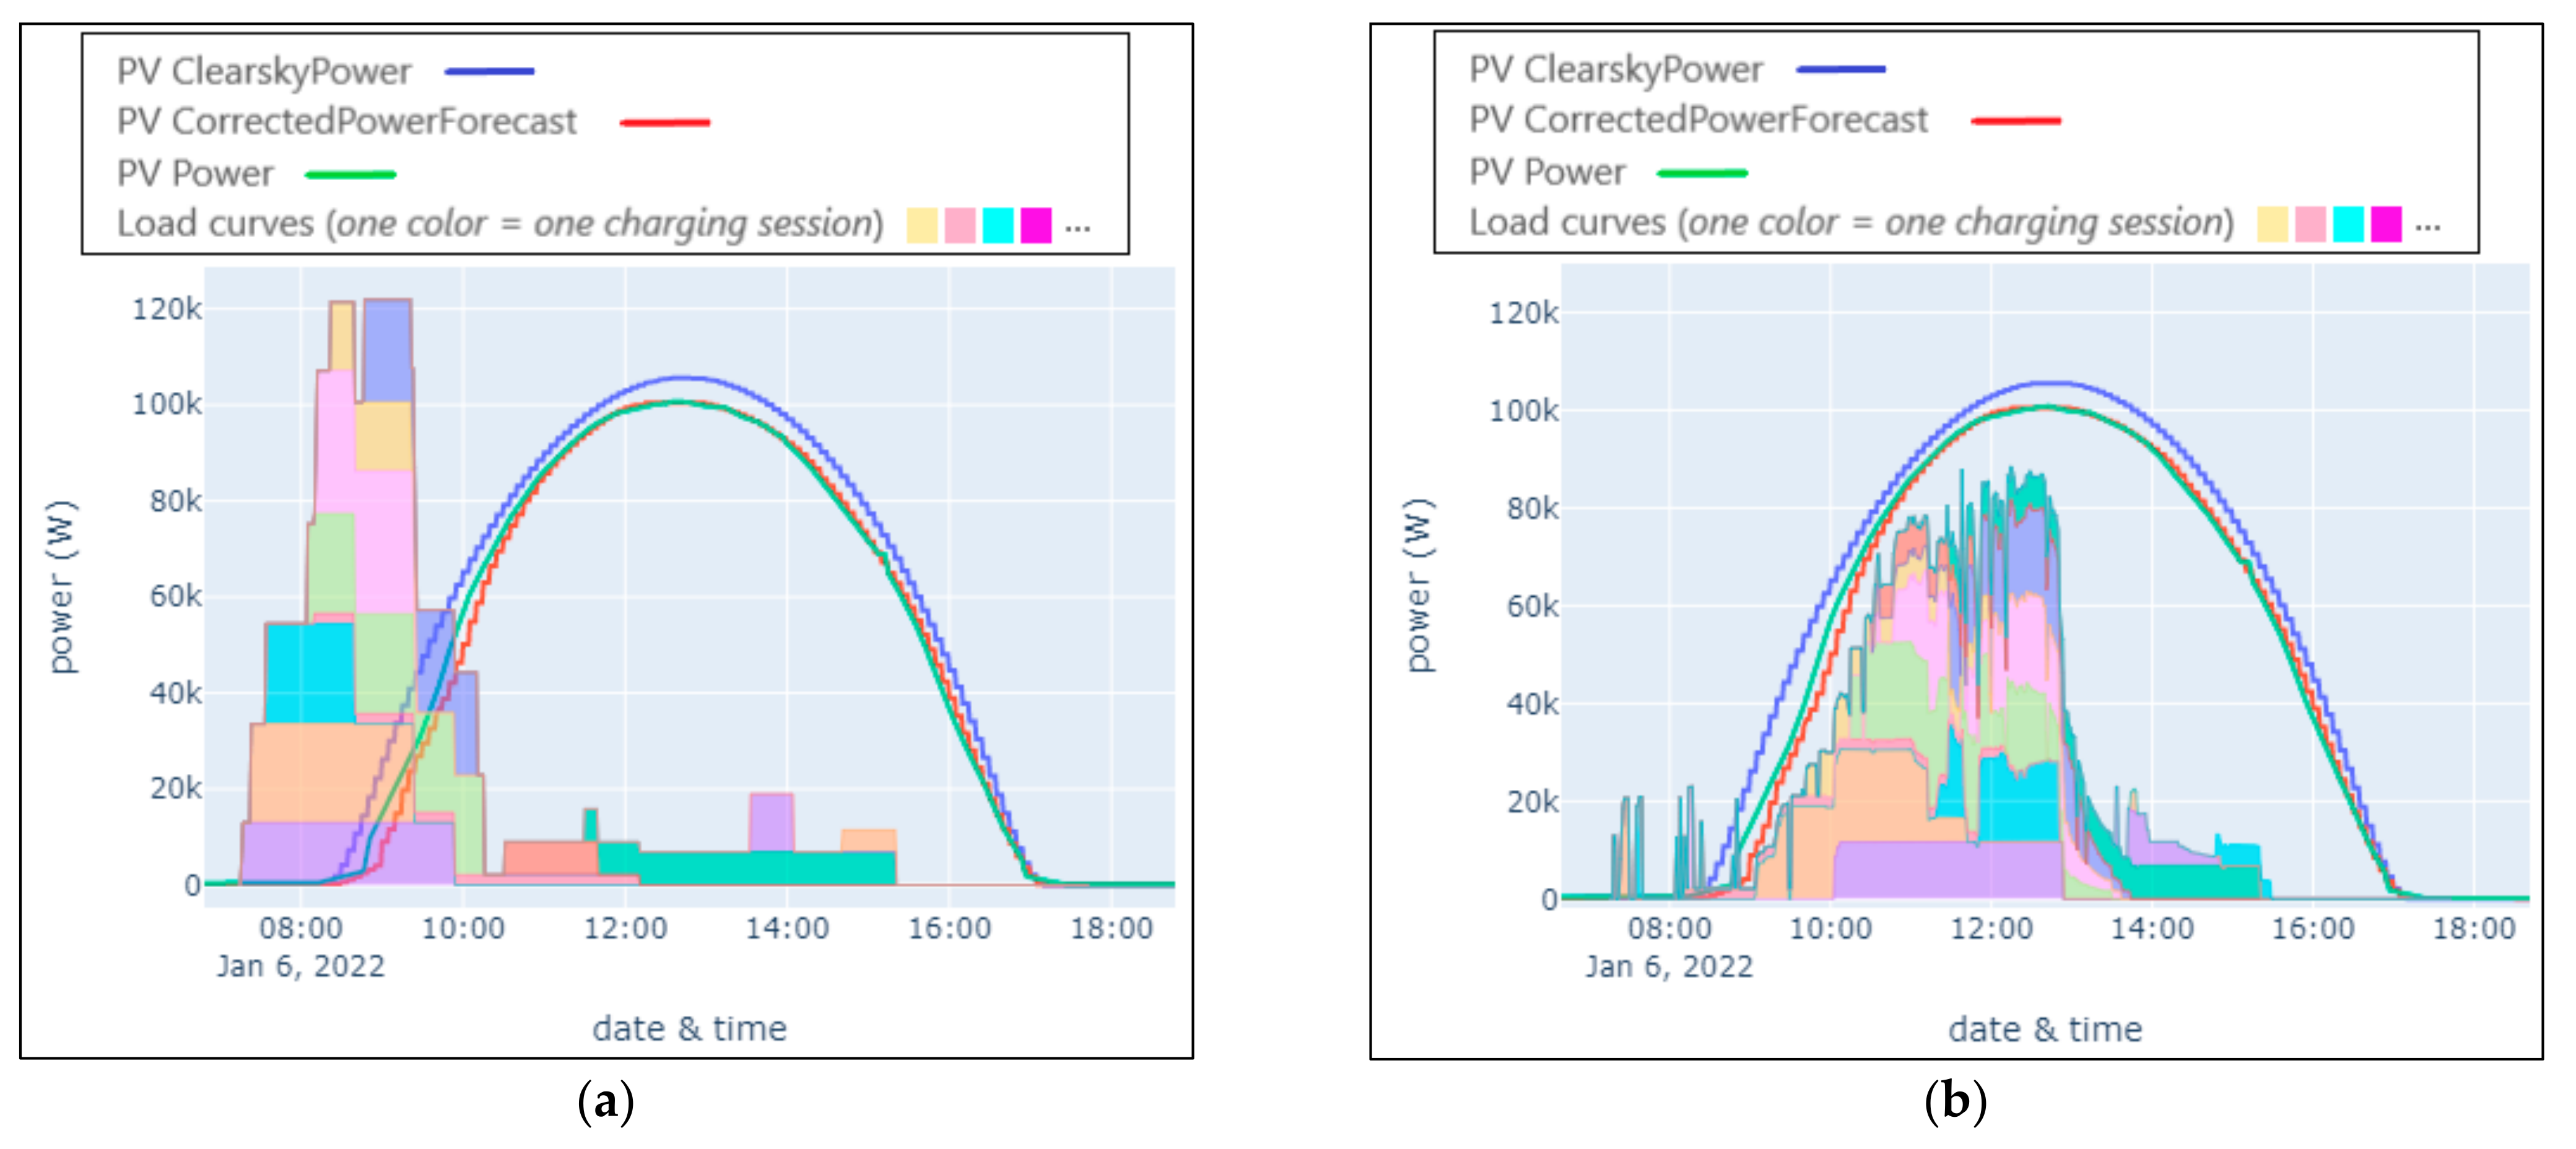
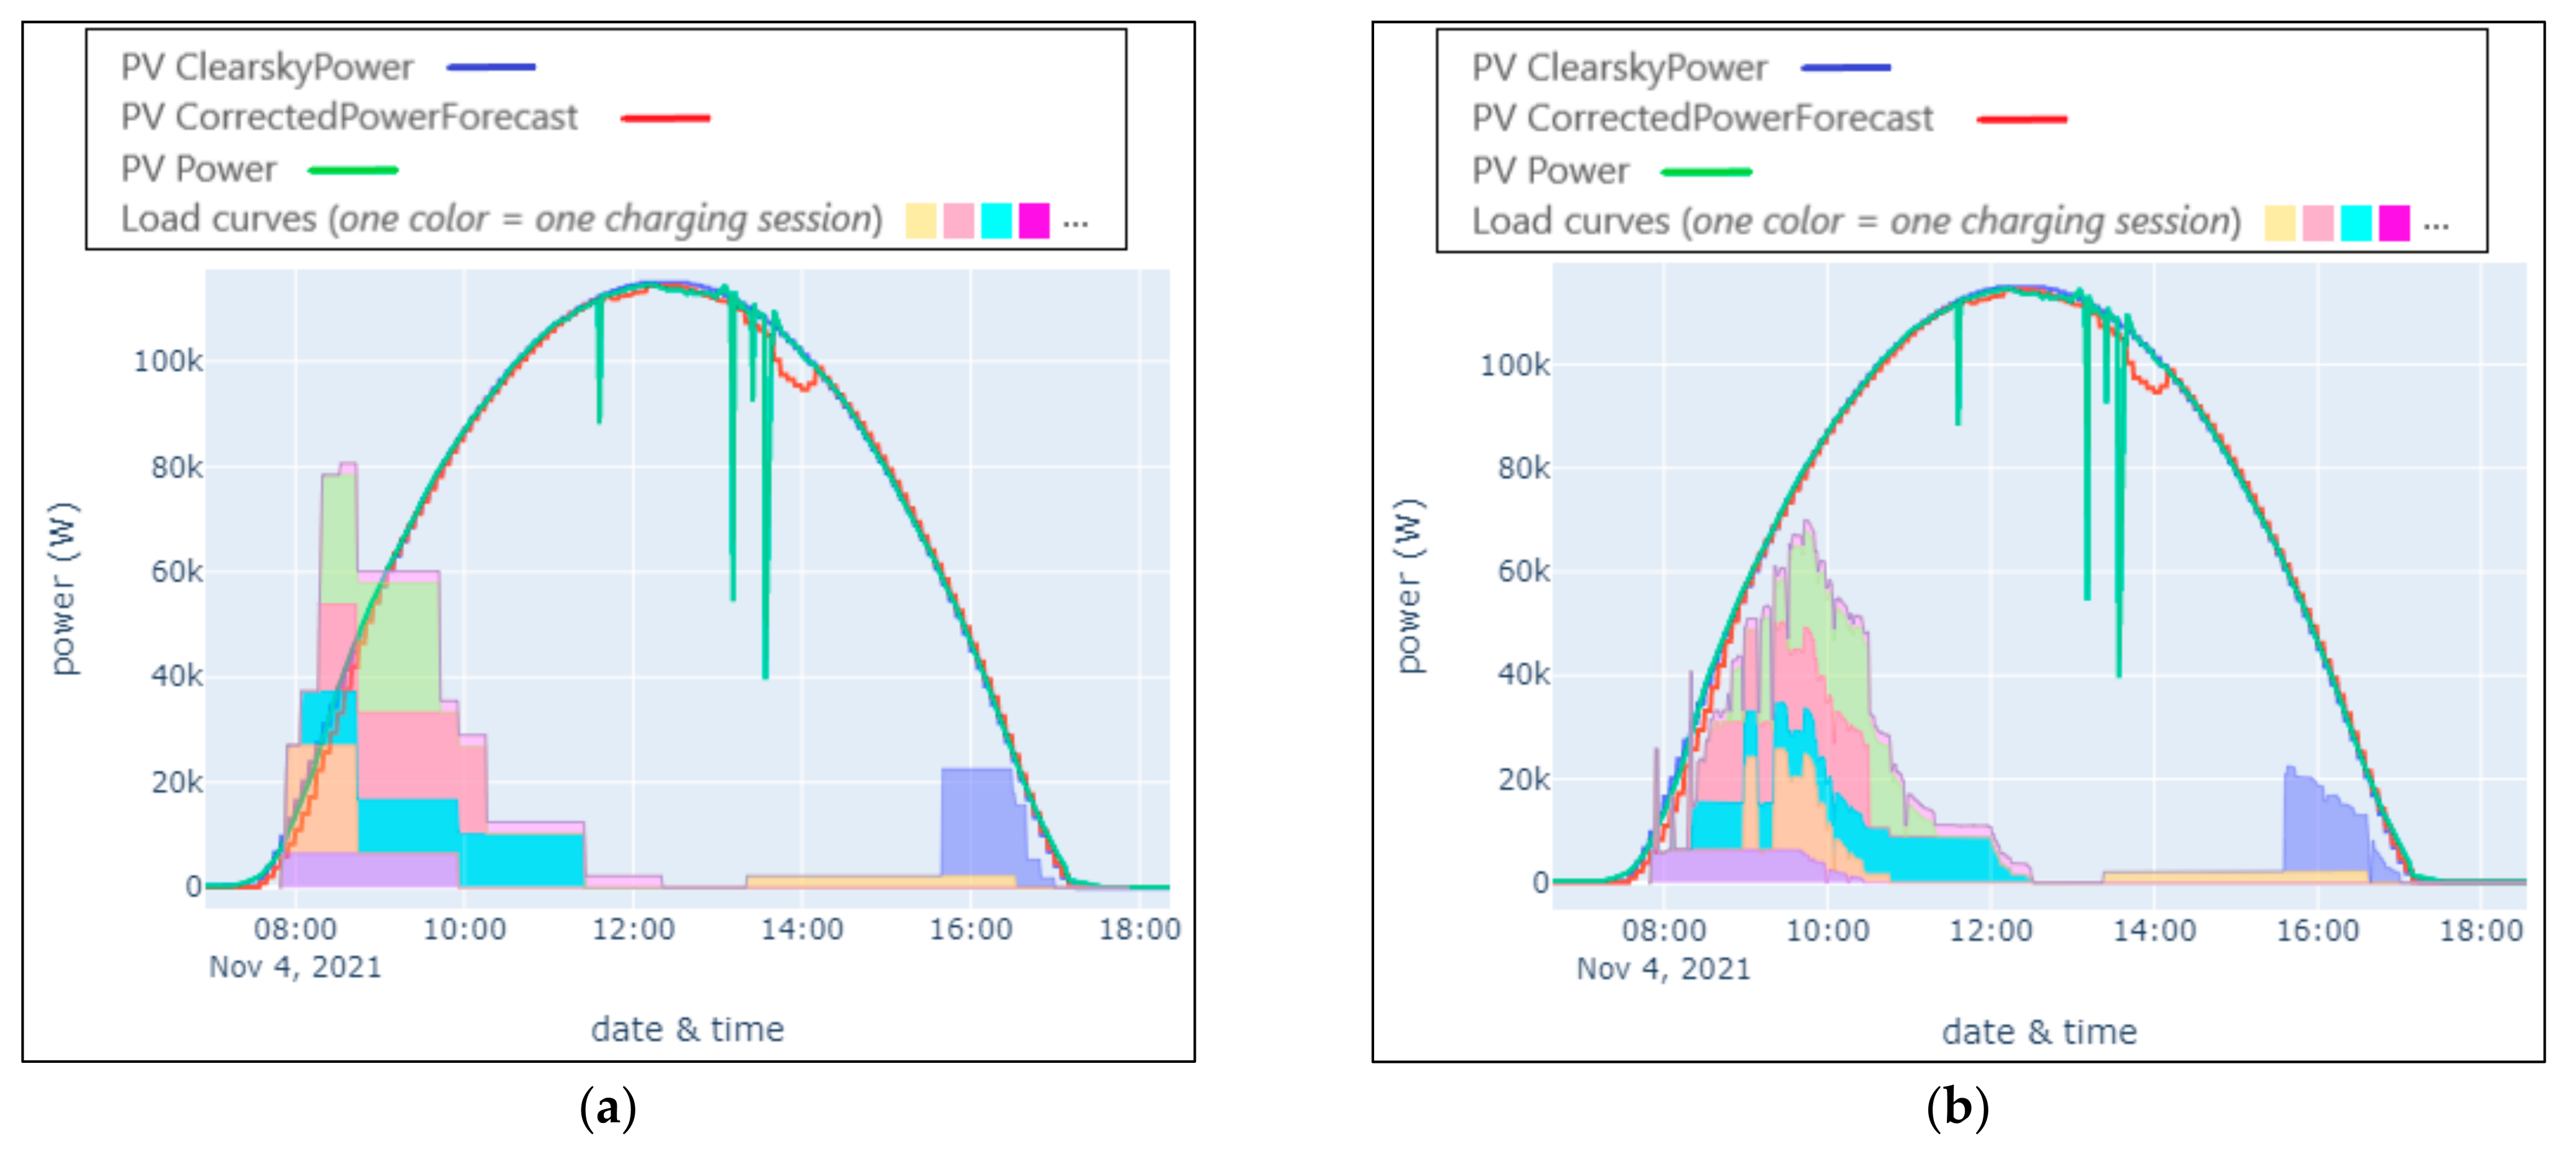
3.2. Preliminary 2: Description of Figures 4–7
- The blue curve corresponds to the “ClearskyPower”.
- The red curve represents the “CorrectedPowerForecast” which is considered as the available power.
3.3. The Control of Charge Increases Drastically the Self-Production Ratio
3.4. The Self-Production Rate Can Be High, Even without Control
3.5. The Self-Production Ratio May Be Relatively Low, Even with Control
4. Conclusions and Perspectives
Author Contributions
Funding
Institutional Review Board Statement
Informed Consent Statement
Data Availability Statement
Acknowledgments
Conflicts of Interest
References
- European Commission Proposal for a Regulation of the European Parliament and of the Council Amending Regulation (EU) 2019/631 as Regards Strengthening the CO2 Emission Performance Standards for New Passenger Cars and New Light Commercial Vehicles in Line with the Union’s Increased Climate Ambition. CELEX 52021PC0556; European Commission: Brussels, Belgium, 14 July 2021.
- New Car Registrations by Fuel Type, European Union. Available online: https://www.acea.auto/files/20220202_PRPC-fuel_Q4-2021_FINAL.pdf (accessed on 11 March 2022).
- Interactive Map—Correlation between Electric Car Sales and Charging Point Availability (2021 Update), ACEA-European Automobile Manufacturers’ Association-2021. Available online: https://www.acea.auto/figure/interactive-map-correlation-between-electric-car-sales-and-charging-point-availability-2021-update (accessed on 11 March 2022).
- ACEA Proposal for the Alternative Fuels Infrastructure Regulation (AFIR), ACEA Position Paper. 2021. Available online: https://www.acea.auto/files/ACEA_Position_Paper-Alternative_Fuels_Infrastructure_Regulation.pdf (accessed on 11 March 2022).
- Richardson, D.B. Electric vehicles and the electric grid: A review of modeling approaches, impacts, and renewable energy integration. Renew. Sustain. Energy Rev. 2013, 19, 247–254. [Google Scholar] [CrossRef]
- Muratori, M. Impact of uncoordinated plug-in electric vehicle charging on residential power demand. Nat. Energy 2018, 3, 193–201. [Google Scholar] [CrossRef]
- Energy Pathways to 2050 Key Results, RTE 2021. Available online: https://assets.rte-france.com/prod/public/2022-01/Energy%20pathways%202050_Key%20results.pdf (accessed on 11 March 2022).
- Bañol Arias, N.; Hashemi, S.; Andersen, P.B.; Traeholt, C.; Romero, R. Distribution system services provided by electric vehicles: Recent status, challenges, and future prospects. IEEE Trans. Intell. Transport. Syst. 2019, 20, 4277–4296. [Google Scholar] [CrossRef] [Green Version]
- Aghajan-Eshkevari, S.; Azad, S.; Nazari-Heris, M.; Ameli, M.T.; Asadi, S. Charging and discharging of electric vehicles in power systems: An updated and detailed review of methods, control structures, objectives, and optimization methodologies. Sustainability 2022, 14, 2137. [Google Scholar] [CrossRef]
- Divshali, P.H.; Evens, C. Optimum day-ahead bidding profiles of electrical vehicle charging stations in fcr markets. Electr. Power Syst. Res. 2021, 190, 106667. [Google Scholar] [CrossRef]
- Tsagkaroulis, P.; Thingvad, A.; Marinelli, M.; Suzuki, K. Optimal scheduling of electric vehicles for ancillary service provision with real driving data. In Proceedings of the 56th IEEE International Universities Power Engineering Conference (UPEC), Middlesbrough, UK, 31 August 2021; pp. 1–6. [Google Scholar]
- de Hoog, J.; Alpcan, T.; Brazil, M.; Thomas, D.A.; Mareels, I. Optimal charging of electric vehicles taking distribution network constraints into account. IEEE Trans. Power Syst. 2015, 30, 365–375. [Google Scholar] [CrossRef] [Green Version]
- Frendo, O.; Gaertner, N.; Stuckenschmidt, H. Real-time smart charging based on precomputed schedules. IEEE Trans. Smart Grid 2019, 10, 6921–6932. [Google Scholar] [CrossRef]
- Calearo, L.; Thingvad, A.; Ipsen, H.H.; Marinelli, M. Economic value and user remuneration for ev based distribution grid services. In Proceedings of the 2019 IEEE PES Innovative Smart Grid Technologies Europe (ISGT-Europe), Bucharest, Romania, 29 September–2 October 2019; pp. 1–5. [Google Scholar]
- Sousa, T.; Hashemi, S.; Andersen, P.B. Raising the potential of a local market for the reactive power provision by electric vehicles in distribution grids. IET Gener. Transm. Distrib. 2019, 13, 2446–2454. [Google Scholar] [CrossRef] [Green Version]
- Brinkel, N.B.G.; Gerritsma, M.K.; AlSkaif, T.A.; Lampropoulos, I.; van Voorden, A.M.; Fidder, H.A.; van Sark, W.G.J.H.M. Impact of rapid PV fluctuations on power quality in the low-voltage grid and mitigation strategies using electric vehicles. Int. J. Electr. Power Energy Syst. 2020, 118, 105741. [Google Scholar] [CrossRef]
- Mets, K.; De Turck, F.; Develder, C. Distributed smart charging of electric vehicles for balancing wind energy. In Proceedings of the 2012 IEEE Third International Conference on Smart Grid Communications (SmartGridComm), Tainan, Taiwan, 5–8 November 2012; pp. 133–138. [Google Scholar]
- Divshali, P.H.; Choi, B.J. Efficient indirect real-time EV charging method based on imperfect competition market. In Proceedings of the 2016 IEEE International Conference on Smart Grid Communications (SmartGridComm), Sydney, Australia, 6–9 November 2016; pp. 453–459. [Google Scholar]
- Sundström, O.; Binding, C. Optimization Methods to Plan the Charging of Electric Vehicle Fleets. Available online: https://www.zurich.ibm.com/pdf/csc/EDISON_ccpe_main.pdf (accessed on 11 March 2022).
- Kuran, M.S.; Carneiro Viana, A.; Iannone, L.; Kofman, D.; Mermoud, G.; Vasseur, J.P. A smart parking lot management system for scheduling the recharging of electric vehicles. IEEE Trans. Smart Grid 2015, 6, 2942–2953. [Google Scholar] [CrossRef]
- van der Kam, M.J.; van Sark, W. Smart charging of electric vehicles with photovoltaic power and vehicle-to-grid technology in a microgrid; a case study. Appl. Energy 2015, 152, 20–30. [Google Scholar] [CrossRef] [Green Version]
- Zhang, Y.; Cai, L. Dynamic charging scheduling for EV parking lots with photovoltaic power system. IEEE Access 2018, 6, 56995–57005. [Google Scholar] [CrossRef]
- van der Meer, D.; Chandra Mouli, G.R.; Morales-España Mouli, G.; Elizondo, L.R.; Bauer, P. Energy management system with PV power forecast to optimally charge EVs at the workplace. IEEE Trans. Ind. Inform. 2018, 14, 311–320. [Google Scholar] [CrossRef] [Green Version]
- Ivanova, A.; Chassin, D.; Aguado, J.; Crawford, C.; Djilali, N. Techno-economic feasibility of a photovoltaic-equipped plug-in electric vehicle public parking lot with coordinated charging. IET Energy Syst. Integr. 2020, 2, 261–272. [Google Scholar] [CrossRef]
- Cheikh-Mohamad, S.; Sechilariu, M.; Locment, F.; Krim, Y. PV-powered electric vehicle charging stations: Preliminary requirements and feasibility conditions. Appl. Sci. 2021, 11, 1770. [Google Scholar] [CrossRef]
- Krim, Y.; Sechilariu, M.; Locment, F. PV benefits assessment for PV-powered charging stations for electric vehicles. Appl. Sci. 2021, 11, 4127. [Google Scholar] [CrossRef]
- Minh, P.V.; Le Quang, S.; Pham, M.-H. Technical economic analysis of photovoltaic-powered electric vehicle charging stations under different solar irradiation conditions in vietnam. Sustainability 2021, 13, 3528. [Google Scholar] [CrossRef]
- Marinelli, M.; Calearo, L.; Ried, S.; Pfab, X.; Diaz Cabrera, J.C.; Spalthoff, C.; Braun, M.; Sale, H.; Torsater, B.N.; Divshali, P.H.; et al. Electric vehicles demonstration projects—An overview across europe. In Proceedings of the 55th International Universities Power Engineering Conference (UPEC), Turin, Italy, 1–4 September 2020; pp. 1–6. [Google Scholar]
- Nissan, Enel and Nuvve Operate World’s First Fully Commercial Vehicle-To-Grid Hub in Denmark. Available online: https://denmark.nissannews.com/da-DK/releases/nissan-enel-and-nuvve-operate-world-s-first-fully-commercial-vehicle-to-grid-hub-in-denmark (accessed on 14 March 2022).
- Charging EVs without Stressing the Electricity Network. Electric Nation Smart Charging Summary Report. October 2019. Available online: https://www.electricnation.org.uk/wp-content/uploads/2019/10/Electric-Nation-Powered-Up-Report-WEB.pdf (accessed on 25 April 2022).
- Lipman, T.; Callaway, D.; Fierro Mahdi Ghamkhari, G.; Liu, M.; von Meier, A.; Moura, S.; Peffer, T.; Phanivong Elizabeth Ratnam, P.; Szinai, J. Open Source, Open Architecture Software Platform for Plug-In Electric Vehicle Smart Charging in California, California Energy Commission. March 2020. Available online: https://www.energy.ca.gov/sites/default/files/2021-05/CEC-500-2020-005.pdf (accessed on 11 March 2022).
- Algorithms Successful in Controlling the Charging Speed of Electric Cars. Available online: https://h2020invade.eu/news/algorithms-successful-in-controlling-the-charging-speed-of-electric-cars/ (accessed on 25 April 2022).
- Report: V2G Hub|V2G Around the World. Available online: https://www.v2g-hub.com/reports/ (accessed on 16 March 2022).
- Sechilariu, M.; Reinders, A.; Krim, Y.; Cheikh-Mohamad, S.; Sierra, A.; Seiler, G.; Ben Slimane, K. PV-Powered Electric Vehicle Charging Stations: Preliminary Requirements and Feasibility Conditions. Report IEA-PVPS T17-02:2021. December 2021. Available online: https://iea-pvps.org/wp-content/uploads/2021/12/PVPS_Report_T17-02_2021-1.pdf (accessed on 25 April 2022).
- Askjær, R.J.; Andersen, P.B.; Thingvad, A.; Marinelli, M. Demonstration of a technology neutral control architecture for providing frequency control using unidirectional charging of electric vehicles. In Proceedings of the 55th International Universities Power Engineering Conference (UPEC), Turin, Italy, 1–4 September 2020; pp. 1–6. [Google Scholar] [CrossRef]
- BMW ChargeForward. Available online: https://bmwchargeforward.com/ (accessed on 21 March 2022).
- Frendo, O.; Gaertner, N.; Stuckenschmidt, H. Open source algorithm for smart charging of electric vehicle fleets. IEEE Trans. Ind. Inform. 2021, 17, 6014–6022. [Google Scholar] [CrossRef]
- Holmgren, W.F.; Hansen, C.W.; Mikofski, M.A. Pvlib python: A python package for modeling solar energy systems. J. Open Source Softw. 2018, 3, 884. [Google Scholar] [CrossRef] [Green Version]
- Frendo, O.; Graf, J.; Gaertner, N.; Stuckenschmidt, H. Data-driven smart charging for heterogeneous electric vehicle fleets. Energy AI 2020, 1, 100007. [Google Scholar] [CrossRef]


Publisher’s Note: MDPI stays neutral with regard to jurisdictional claims in published maps and institutional affiliations. |
© 2022 by the authors. Licensee MDPI, Basel, Switzerland. This article is an open access article distributed under the terms and conditions of the Creative Commons Attribution (CC BY) license (https://creativecommons.org/licenses/by/4.0/).
Share and Cite
Robisson, B.; Guillemin, S.; Marchadier, L.; Vignal, G.; Mignonac, A. Solar Charging of Electric Vehicles: Experimental Results. Appl. Sci. 2022, 12, 4523. https://doi.org/10.3390/app12094523
Robisson B, Guillemin S, Marchadier L, Vignal G, Mignonac A. Solar Charging of Electric Vehicles: Experimental Results. Applied Sciences. 2022; 12(9):4523. https://doi.org/10.3390/app12094523
Chicago/Turabian StyleRobisson, Bruno, Sylvain Guillemin, Laurie Marchadier, Gérald Vignal, and Alexandre Mignonac. 2022. "Solar Charging of Electric Vehicles: Experimental Results" Applied Sciences 12, no. 9: 4523. https://doi.org/10.3390/app12094523
APA StyleRobisson, B., Guillemin, S., Marchadier, L., Vignal, G., & Mignonac, A. (2022). Solar Charging of Electric Vehicles: Experimental Results. Applied Sciences, 12(9), 4523. https://doi.org/10.3390/app12094523