1. Introduction
Coal and oil resources co-storage areas are predominant in Songliao, Junggar, Tarim, Qaidam, and Ordos Basins in China [
1,
2]. The Shuangma coal mine in eastern Ningxia is in the coal and oil resources co-storage area in the Ordos Basin (
Figure 1). The coal mine contains numerous abandoned oil wells that were left over from early oil exploration and connect the coal seam and the oil-bearing layer. After over 60 years of precipitation, the gas in the oil-bearing layer accumulates in the oil well cavity and generates a high pressure. The pressure provides continuous power for the oil and gas and promotes their diffusion into the coal mass fracture, forming an oil–gas accumulation area around abandoned oil wells [
3]. During oil and gas enrichment, the initiation, propagation, coalescence, expansion failure, and rapid release of accumulated coal mass fracture stress [
4] can induce dynamic disasters, such as coal mass instability/collapse and oil–gas diffusion. The essence of dynamic disaster in the co-storage area of coal and oil resources is the failure mechanism of coal and rock mass. Therefore, the fundamental studies on the dynamic evolution characteristics of coal mass fractures in coal and oil resources co-storage areas are vital to warning against dynamic disasters.
Recently, several novel technologies have been employed to investigate the micro-structure and fracture characteristics of coal rock. Computed tomography (CT) scanning is a non-destructive testing method [
5], which is suitable for rapidly acquiring the internal structural characteristics of rocks. CT has scanning, imaging, and visualization functions and does not deform samples [
6,
7]. Zhou [
8] used X-ray CT imaging and digital imaging techniques to study the anisotropic damages and spatial fracture evolution of sandstone under uniaxial compression. Likewise, Liu [
9] used CT scanning to analyze the fracture propagation of sandstone subjected to loading. Deng [
10] performed CT scanning on failed rock samples to investigate the fracture evolution law. However, because of the resolution constraint of CT devices, CT images can only be used for describing the evolution law of macro-fractures. Therefore, the effect of micro-fractures on coal mass damages can be investigated using the average CT number method [
11,
12,
13].
The evolution characteristics of rock fracture can be monitored using acoustic emission (AE) signals, which depict how the dynamic disaster develops in coal and rock mass. Moradian [
14] used collision parameters to describe the dynamic process from microcrack nucleation to macro-fracture formation. Wang [
15] analyzed the failure of granite under uniaxial compression by observing the changing AE energy. Wang [
16] also investigated the frequency spectrum characteristics of coal mass during fracturing induced by uniaxial compression. Dou [
17] examined the AE and electromagnetic radiation laws during the deformation and failure of coal mass. Wang [
18] adopted parameters such as AE counts and dominant frequency to describe the propagation of a prefabricated fracture of coal mass under compression. Ohtsu [
19] categorized AE incidents into tensile and shear fracture incidents according to different wave characteristics, using the RA–AF (rise time/peak amplitude–count/duration) relation. Zhou [
20] found that granite had an increased RA after subsequent disturbance-induced failures when loading exceeded 60% of the compression strength. Studies on AE signals provide important data for the characteristic evolution analysis of coal mass instability and disaster warning [
21,
22,
23].
Previous studies on coal mass damages mainly focused on the impact of fracture structure on the strength and anisotropic characteristics of coal and rock mass under uniaxial compression. Few studies have investigated the RA–AF fracture evolution characteristics of coal mass under uniaxial compression and the formation of diffusion channels of oil and gas disasters, considering the mining-induced damage of coal mass in coal and oil resources co-storage areas. Therefore, this study investigated coal mass in a coal and oil resources co-storage area: we investigated the macro- and micro-failure laws of coal mass under loading in the coal and oil resources co-storage area, and we also investigated the mechanism of oil and gas diffusion channels.
2. Experimental Design
The X-ray spiral CT scanning equipment was used to carry out tomography on the coal specimen to obtain the coal CT tomography image. The fracture edge of the CT tomography image was detected through the Laplacian of Gaussian (log) algorithm, the geometric characteristic parameters of the coal fracture were statistically analyzed, and the CT values of the pixel points of each fracture slice were extracted and compared. The spatial morphological evolution characteristics of cracks in oil- and gas-damaged coal were revealed. The dynamic evolution characteristics of microcracks were analyzed through the changes of average CT number, uniaxial compression test, acoustic emission wave, CT scanning, and stress path slope. Then, the macro- and micro-failure laws of coal in the co-storage area of coal and oil resources under load and the formation mechanism of the oil–gas diffusion channel were analyzed. Finally, the multi-parameter early-warning conditions for coal instability and oil and gas disasters were put forward.
2.1. Sample Preparation
The coal mass samples used in this study were Jurassic coal in the 105 working face of the 4-1 coal seam in Shuangma coal mine, Ningdong mining area. Coal blocks located at positions 50, 150, and 300 m away from the abandoned oil well (center, middle, and edge of the oil and gas enrichment area, respectively) were processed into cubic samples (100 mm
3) by sand line cutting. In order to avoid the influence of coal anisotropy, typical coal samples are selected from three samples made at each position for analysis. With the oil well as the origin, the numbers from near to far were CSCA-1, CSCA-2, and CSCA-3. The test piece shall be polished with a grindstone for test use (
Figure 2).
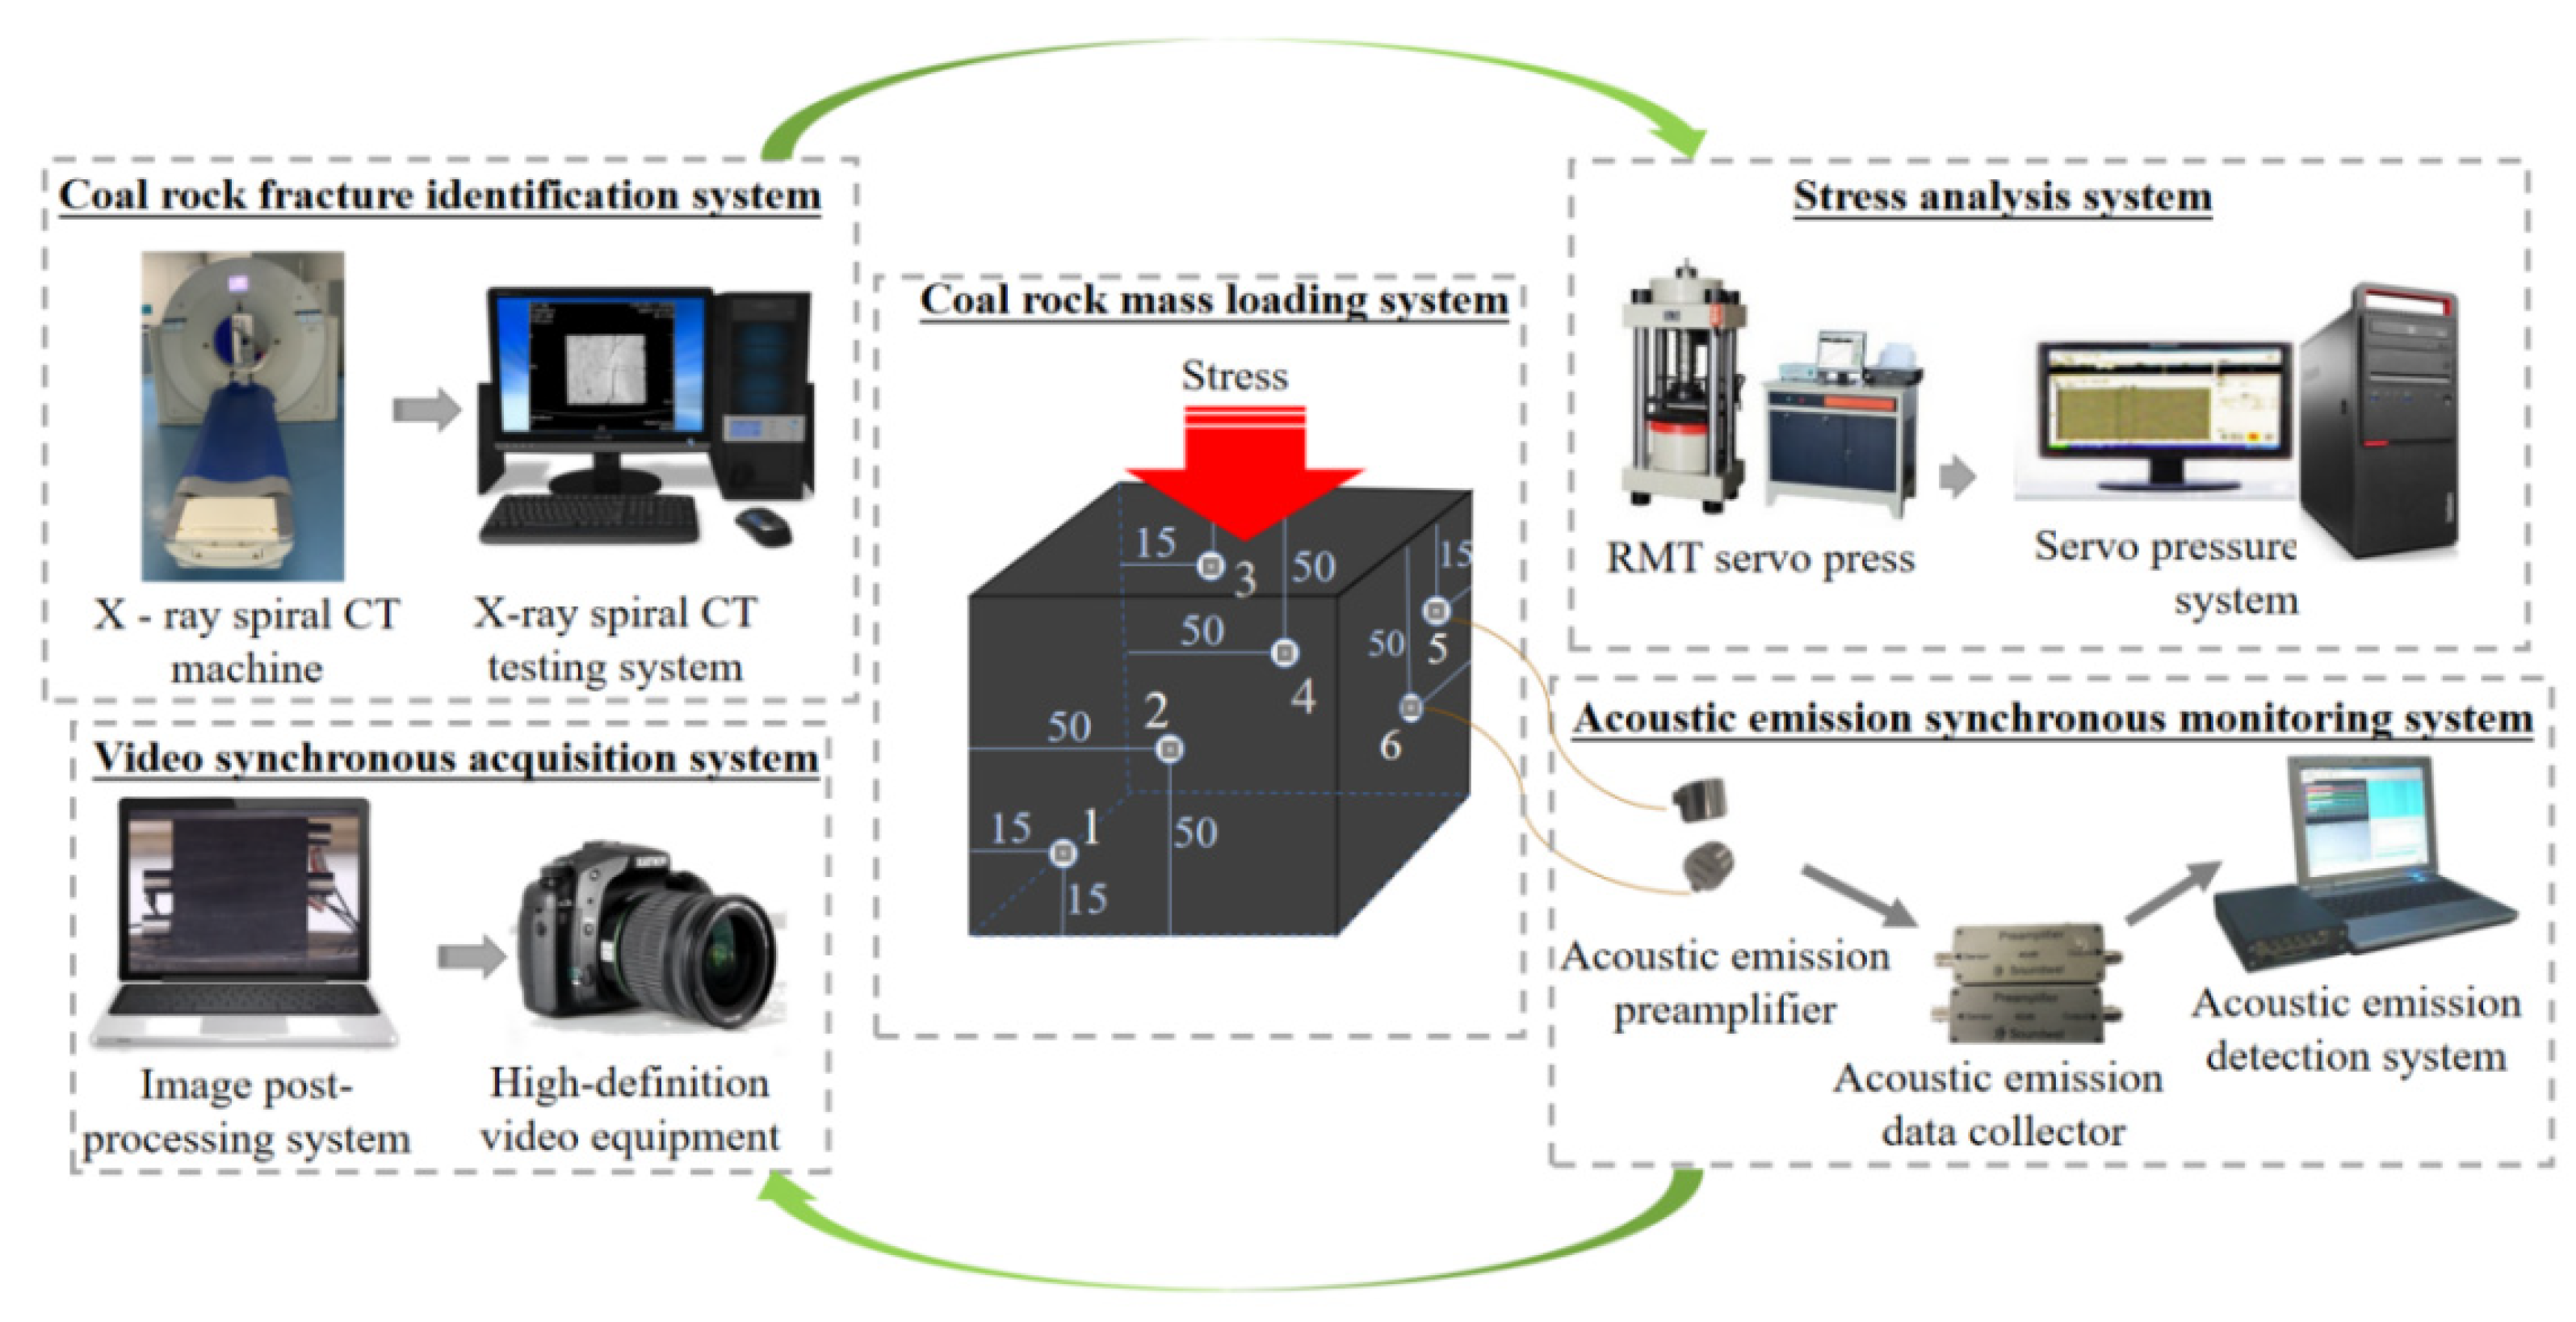
2.2. Experimental System
The experimental system comprised CT scanning, mechanical loading, and AE monitoring systems. The CT scanning equipment was a UCT 780 X-ray helical CT scanner (Shanghai United Imaging Healthcare Co., Ltd., Shanghai, China) with a spatial resolution of 0.3 × 0.3 mm, density contrast resolution of 3 HU, and scanning layer thickness of 0.5 mm. The mechanical loading system was an RMT-150B rock mechanics testing machine at the Key Laboratory of Western Mine Exploitation and Hazard Prevention, Ministry of Education. Before the test loading, the sample was padded with Teflon sheets, and silicone grease was applied to ensure uniform stress distribution at the end of the sample during loading. The loading was performed at a rate of 0.2 mm/min until failure occurred. The AE monitoring system was a DS5-16B full-information AE signal acquisition and analysis system with a 16-digit A/D converter and 10 MHz sampling frequency. Six AE probes (
Figure 2) were fixed at three arbitrary positions on the sample, and an appropriate amount of coupling agent was used to attach the sensor to the sample for sufficient contact. Before the test, the sample was hit with the marker to simulate the signal source and to ensure that all probe channels responded adequately. In order to reduce the impact of noise on the damage of coal and rock mass and quickly obtain the damage characteristics of coal and rock mass, the AE threshold value was 38 dB, the sampling frequency was 1 MHz, and the preamplifier gain was set to 40 dB.
3. Test Results and Analysis
3.1. Qualitative Description of Fracture Propagation
The thickness of the CT slice of the coal mass sample was set to 2 mm, and 50 CT slice images were obtained from a single sample. Given the paper length limitation, a slice with typical fracture distribution characteristics was selected (
Table 1). A binary graph [
24] was obtained to analyze the fracture characteristics.
The micro-fractures of rock samples (scale = 0.001 mm) are typically difficult to identify because of the low-resolution scale of the CT scanner (medical = 0.3 mm and industrial = 0.01 mm). The average CT number method is currently the most widely used damage detection CT method. The CT number is the relative value of the linear attenuation coefficient of a tissue structure in a CT image, and the unit is HU. The CT number reflects the density of the object being scanned, and the density is directly proportional to the CT number. Therefore, fracture and mineral particles in coal mass are important factors that affect the CT number [
11].
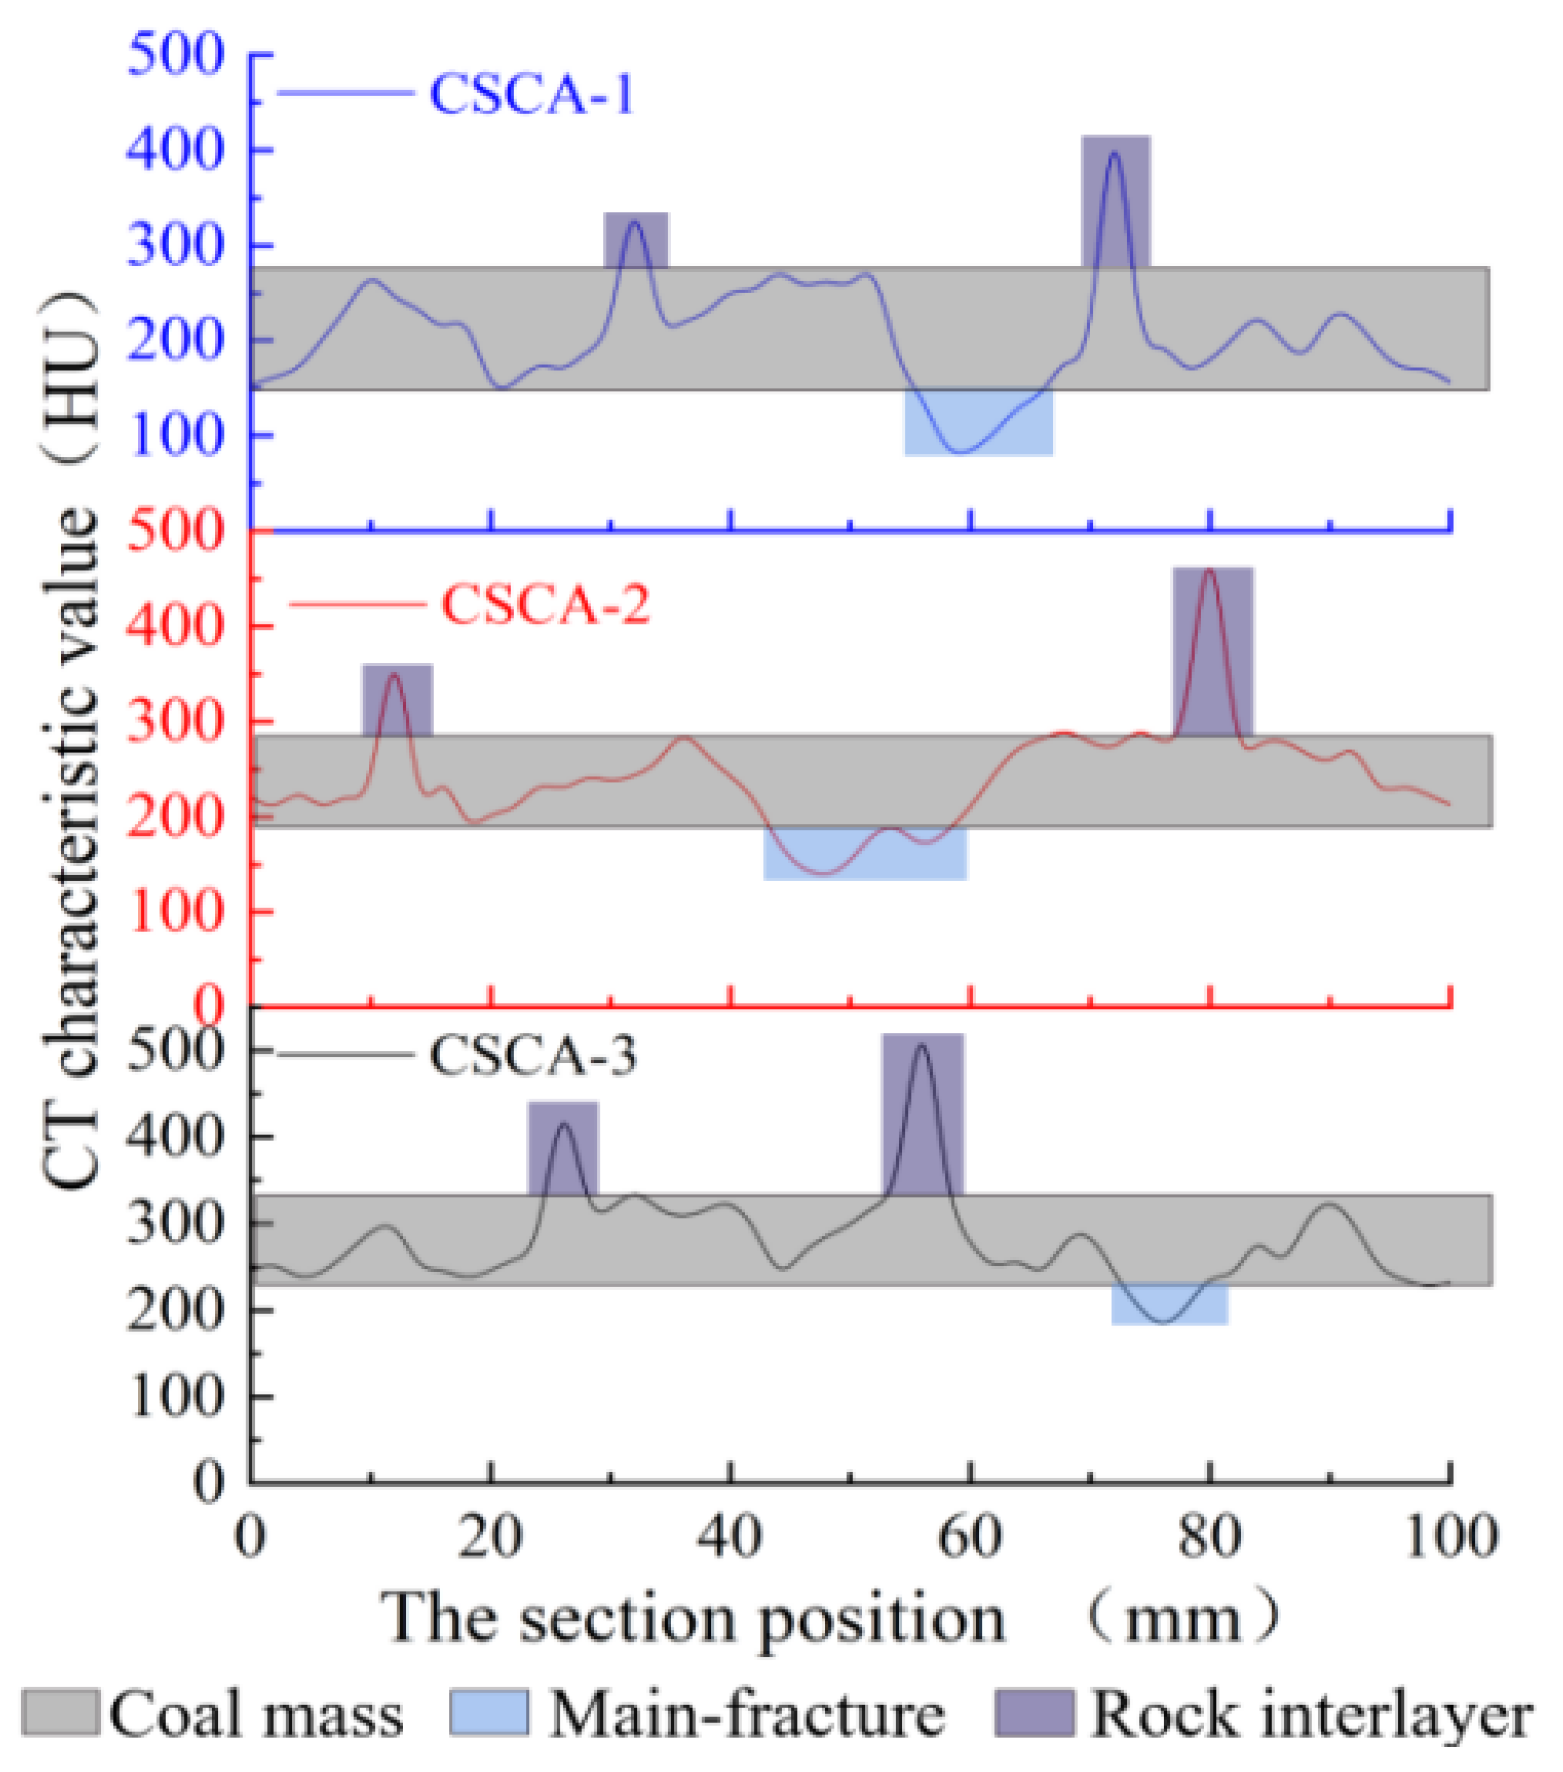
As shown in
Figure 3, the fracture of the coal mass in Shuangma developed rapidly, and the average CT number of the coal medium was distributed between 150 and 305 HU. The average CT number of the principal fracture location was distributed between 50 and 225 HU, while that of the mineral particles was distributed between 325 and 500 HU. The CT number in the same sample’s cross-section exhibited a complex distribution. The distribution of CT number exhibited multiple peak values and had the random distribution characteristics of diffusion, but did not follow a conventional statistical distribution law. The overall average CT number decreased as the sampling locations of different samples were closer to abandoned oil wells, whereas the micro-fractures increased. This indicates that coal mass damage was not caused by a single factor, but by multiple fracture sources, mineral particles, and gas pressure.
In summary, as the sampling location approached the oil well disaster source, the opening degree, density, and volume of the coal mass sample fracture showed an increasing trend, and the sensitivity of the average CT number to the principal fracture location and mineral particles also significantly increased. However, the gas pressure leads to crack development and the material density of the coal body decreases, and the average CT number showed a decreasing trend. The diffusion of high-pressure oil and gas into the coal mass resulted in the increase in the fracture density and volume ratio, which allowed the accumulation of oil and gas in the coal and oil resources co-storage area. This phenomenon was the basis of coal mass instability and the formation of oil and gas disasters.
3.2. AE Characteristics of Loaded Coal Mass
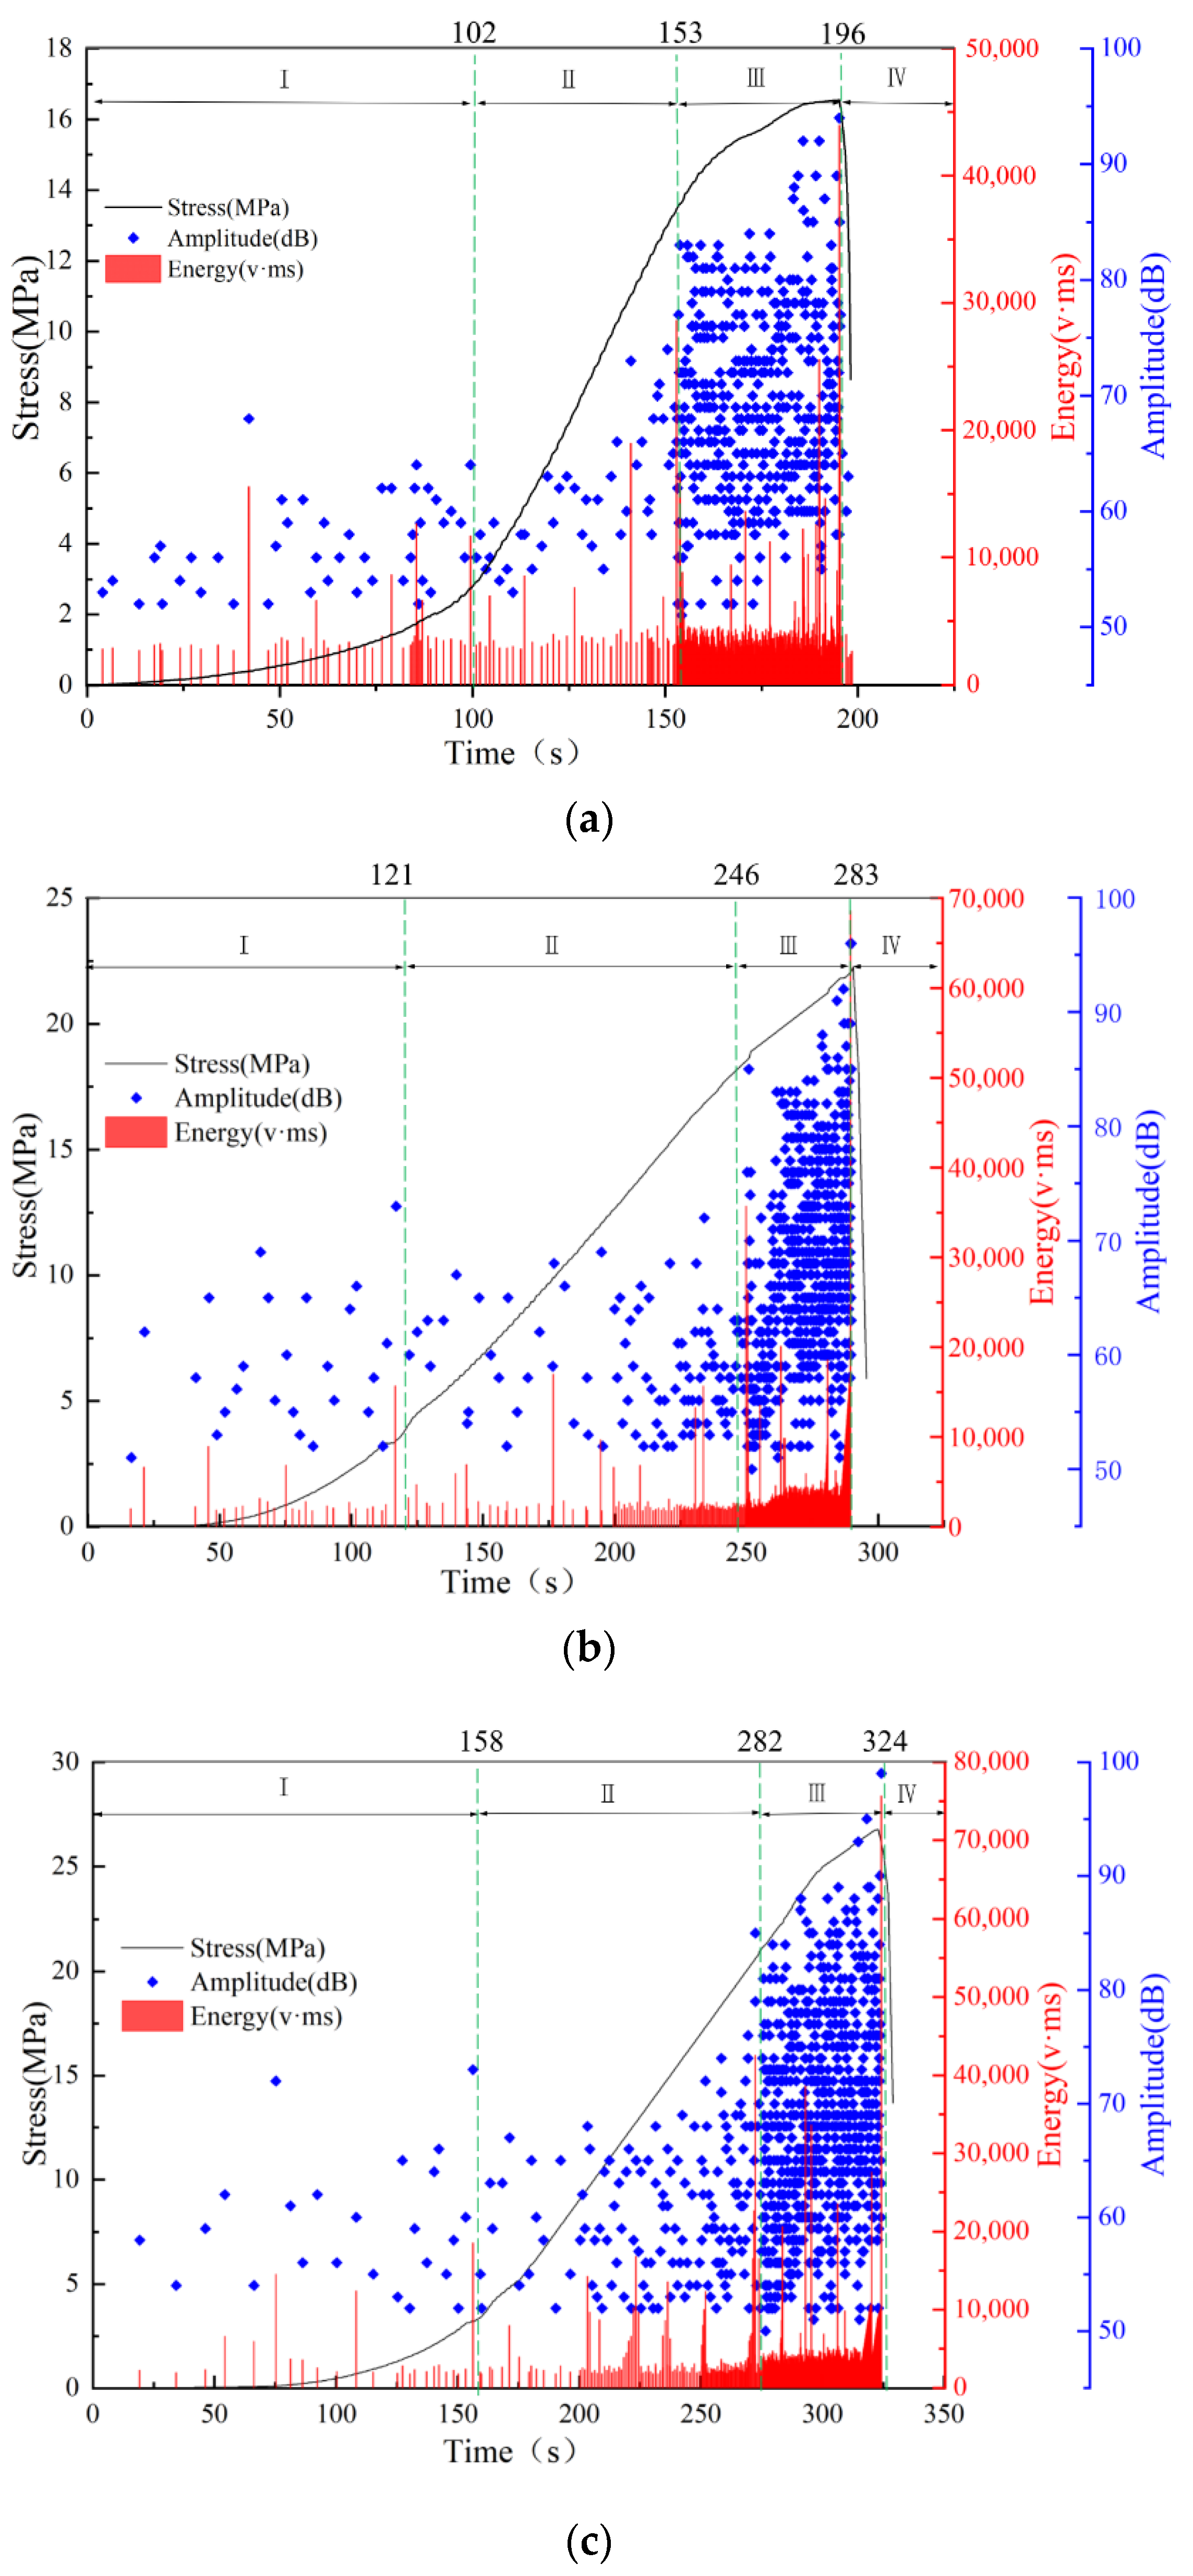
The fracture evolution of coal mass in Shuangma was categorized into four stages based on the stress–strain curve of rock subjected to uniaxial compression [
25,
26]. The stages were compaction (I), linearly elastic (II), rapidly fracturing (III), and post-peak (IV) stages. The stress, time, energy, and amplitude during loading are illustrated in
Figure 4.
During the loading of the coal mass sample, the energy and amplitude intensities of the dynamic evolution of fracture had a desirable periodic variation law. In stage (I), a closed fracture due to compaction was observed, the stress–time curve was concave, the stress curve slope increased continuously, the fracture energy intensity increased gradually, and the fracture amplitude was mainly in the low-intensity range. This stage contained fewer incidents and different coal samples. The more the initial fractures, the more the incidents and the greater the energy intensity. In stage (II), initial fracture compaction occurred, and new fractures emerged, resulting in a positive correlation between the stress and time. The stress slope tended to be stable. The fracture energy intensity increased, and the fracture amplitude was mainly in the medium-intensity range. The stress curve slope decreased for the first time in this stage, and the fracture evolved into stage (III), where fractures with a high-energy intensity suddenly appeared. Many fractures with medium- and low-energy intensities occurred in this stage, and fractures with different amplitude intensities occurred. In stage (IV), a penetrating principal failure surface was formed in the sample, leading to a rapid stress drop. The stress slope was negative, and the fracture energy and amplitude intensities decreased.
As the loading continued, the slope of the load curve in each stage first increased before decreasing, and the total time was shortened. The fracture energy and amplitude in each stage gradually intensified, and the rupture incidents mainly occurred in stage (III).
4. Analysis of Crack Evolution Mechanism
4.1. AE Parameter Characteristics
The amplitude and energy parameters of AE signals are adopted as fracture intensity characteristics for investigations. In fracture incidents, the amplitude,
A, of an AE signal is expressed as [
27]:
where
Aimax is the maximum amplitude of the impact wave received by the
ith AE sensor,
V,
ri is the distance from the AE source to the
ith sensor, mm, and
k is the number of sensors in the incident location.
Based on the Richter method for estimating earthquake magnitude, the magnitude of AE incidents is expressed as [
28]:
Similarly, the energy level and hit rate of AE incidents are Em = lgEs and Hm = lgHs, respectively.
Based on the rock fracture frequency and the amplitude correlation analysis method [
19], we associated the average frequency of coal mass fracture and its corresponding signal rise time with the maximum amplitude ratio, thus establishing a damage evolution relationship of coal mass.
During the coal mass fracturing, tensile stress destroyed the medium from the edges, resulting in an increase in the volume of the medium. Therefore, the energy transmitted was mostly the S-wave or P-wave (
Figure 5), whereas the slower S-wave had a lower energy. This phenomenon implied that most energy transmissions occurred early, and the signal rise time was short, resulting in a large wave angle. Shear stress caused a change in the shape of the medium (instead of its volume) near the crack; thus, the energy was mostly transformed to shear wave (or S-wave). The maximum amplitude occurred a long time after the threshold was first exceeded, and the rise time was long.
4.2. Fracture Classification Characteristics
Moment tensor theory [
29] was applied to determine the fracture type. When the source is synchronous, moment tensor,
Mij(γ,t′), represents the upward force of all elements, and a linear relationship is established with the displacement field,
μi(
x,
t), of the point force of source
γ in direction
i at location
x and time
t. The moment tensor is deduced as shown in Equation (3):
where
mij is a constant component representing the second-order moment tensor,
Mij, MISO is the isotropic component of the moment tensor,
MCLVD is the linear vector dipole component of the moment tensor, and
MDC is the pure shear fracture component of the moment tensor (i.e., pure bi-couple composition), representing the superposition of swelling, shearing, and double couple without moment [
30].
where
λmin,
λint, and
λmax are minimum, intermediate, and maximum eigenvalues, respectively [
27].
where
tr is the trace, and
= λi − tr(M)/3, where
λ1,
λ2, and
λ3 are the three eigenvalues of the moment tensor.
The proportions of the three eigenvalues in Equation (5) are obtained using Equation (4). OHTSU [
19] categorized acoustic emission events in uniaxial compression coal and rock mass into tension- and shear-type crack events based on waveform characteristics and the relationship among rise time peak amplitude and count duration ratios (RA–AF).
MDC ≥ 60% indicates shear fracture,
MDC ≤ 40% indicates tensile fracture, and 40% <
MDC < 60% indicates mixed fracture.
4.3. Dynamic Inversion of Fractures in Coal Mass
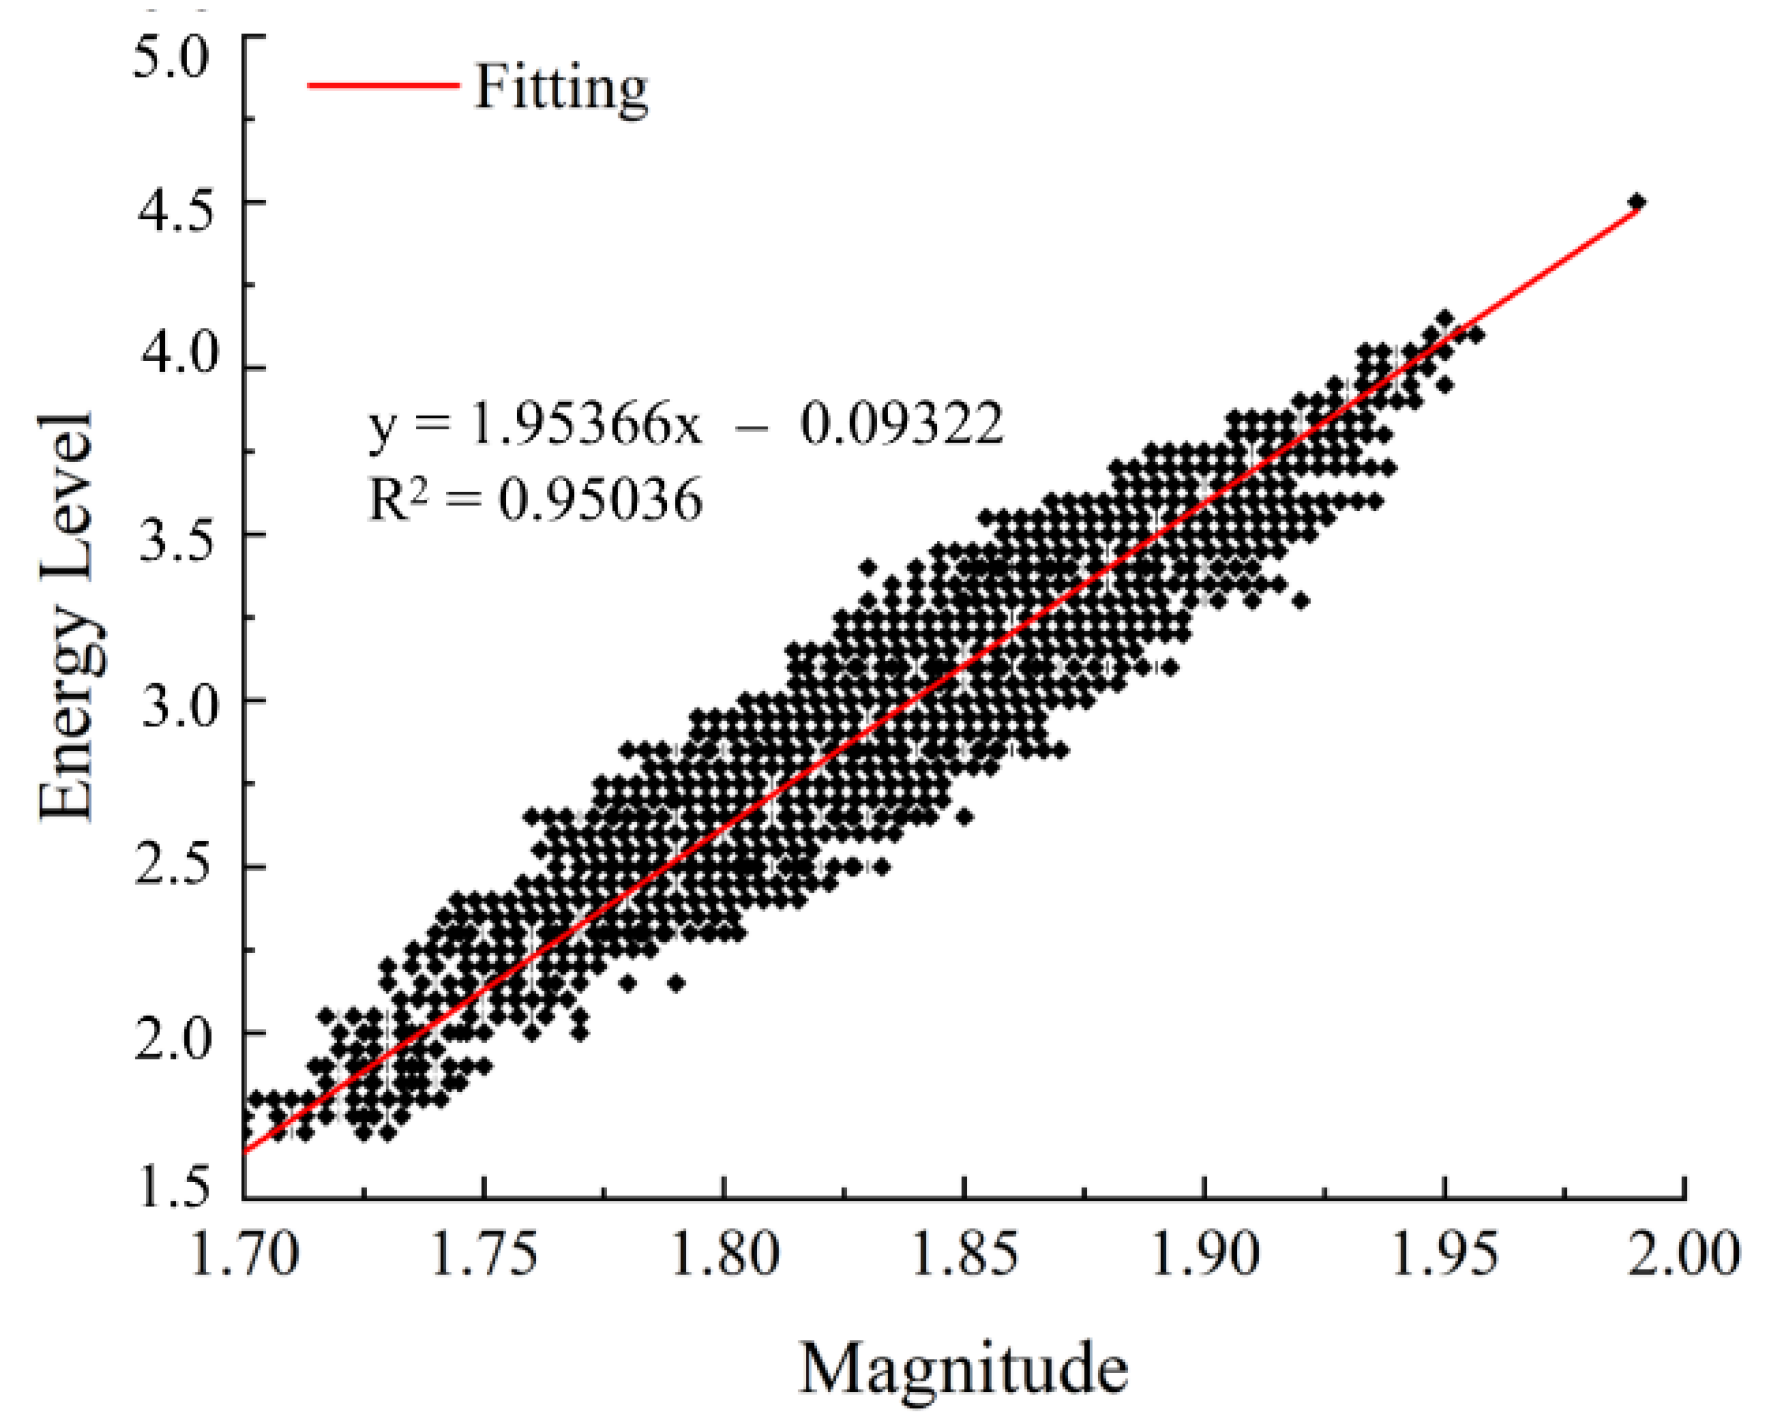
We performed a regression analysis on the fracture intensities of all samples based on the relationships between AE energy and amplitude of sandstone [
27] as well as their fracture energy level and magnitude. As shown in
Figure 6, the averaged correlation coefficient was 0.95.
Fracture intensity can be indicated by energy level and magnitude. Based on the test performed on the energy level and magnitude range of the coal mass sample, we defined energy level 0–2 as “low intensity,” 2–4 as “medium intensity,” and >4 as “high intensity.”
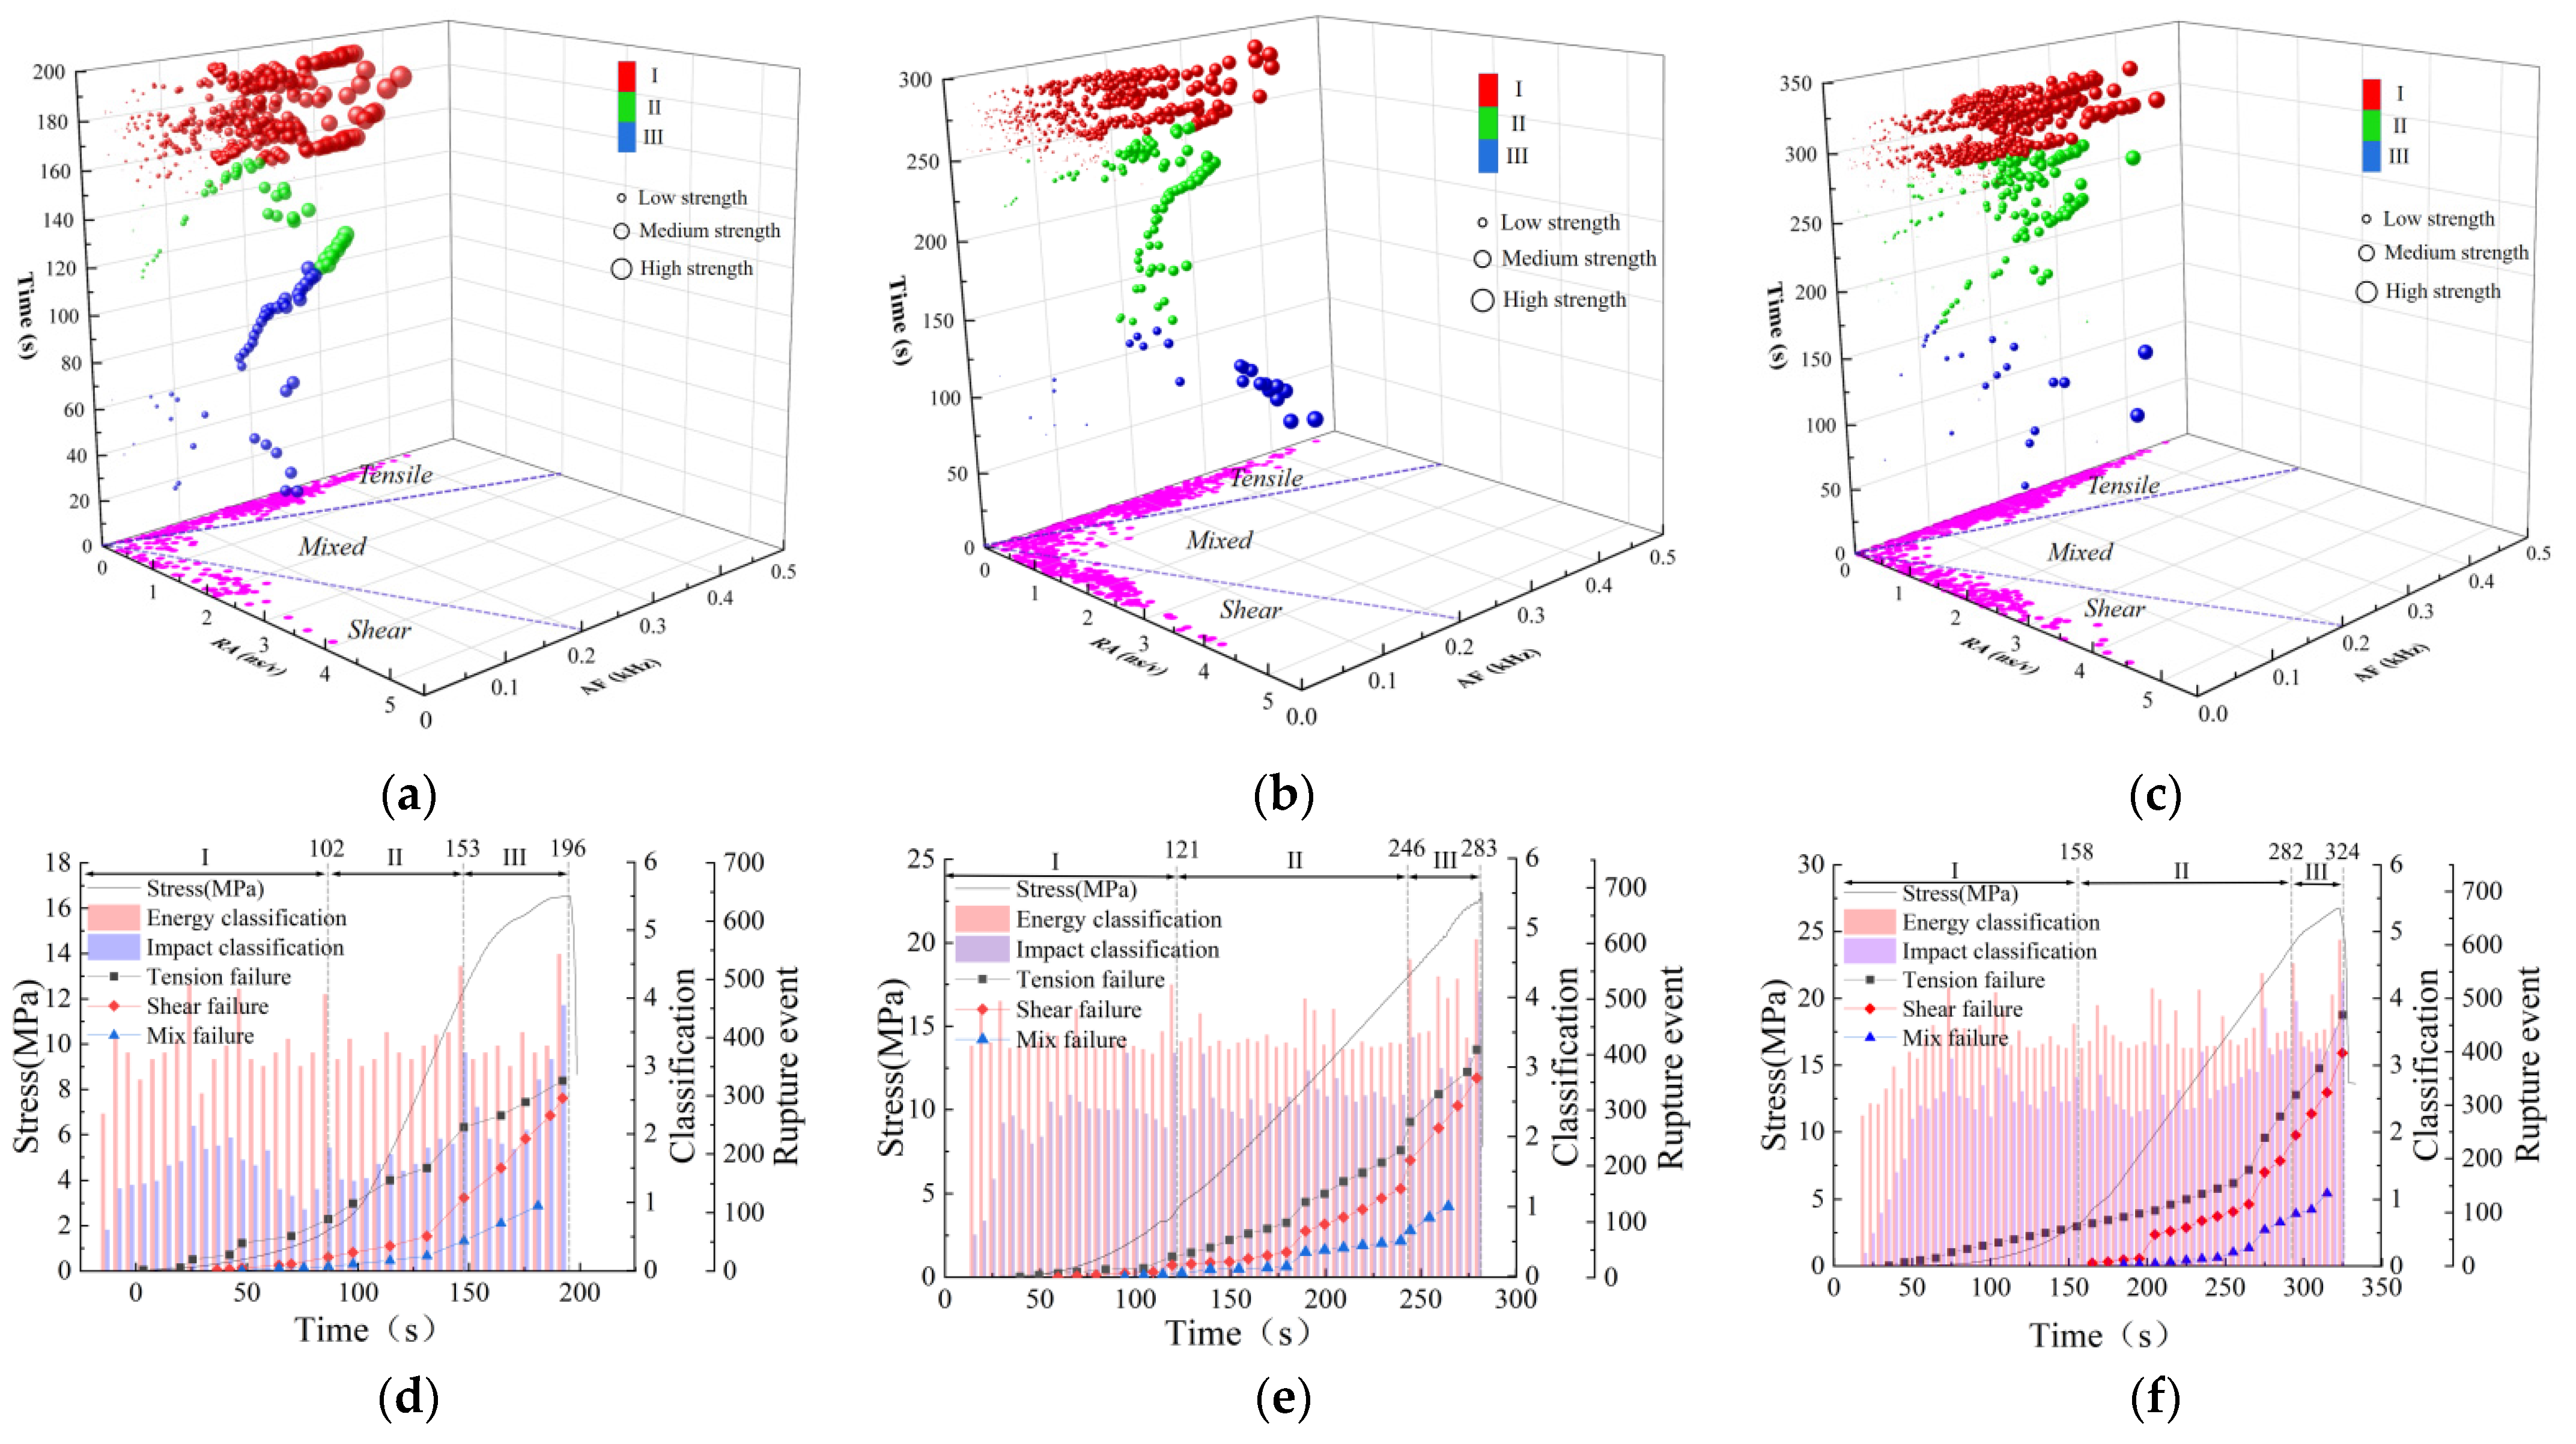
The RA–AF dynamic evolution analysis method was used [
31,
32,
33] to analyze the coal mass sample based on the actual distribution of AF and RA values of fracture samples. The results are shown in
Figure 7.
In stage (I), the fracture was dominated by high-AF and low-RA tensile fractures, as well as a few fractures with low intensity, low energy level, and low impact level. In stage (II), the proportion of tensile fractures decreased, and the number of shear fractures increased, and the fracture type changed from tensile to shear. Here, the number of fractures gradually increased initially, the intensity grade gradually changed from low intensity to medium intensity, the impact rate grade exhibited multiple peaks, the energy level tended to be stable, and the coal mass micro-fracture frequently occurred. In stage (III), fracture quantity and intensity increased considerably, especially medium and high intensities, and the impact rate substantially increased. The results of RA–AF and failure mode analyses showed that the fracture incidents were mainly of the shear type, increased exponentially, and were accompanied by abnormal shear fractures with high RA and low AF, which indicated sample failure.
Figure 7 illustrates the RA–AF relationship of coal samples from Shuangma mine. The failure stage of coal mass is similar to the research results of other authors, but there are obvious spatial differences in the failure characteristics of coal mass damaged by different oil and gas. With the sampling location away from the oil well, the number of CSAS-2 and CSAS-3 fractures of coal samples increased by 40.62% and 81.93%, respectively, and the number of tensile failures was significantly higher than that of shear failure. These observations indicate that the closer the coal mass to the oil well, the greater the damage degree of high-pressure oil and gas diffusion, the smaller the number of coal sample fracture events, the more complex the failure mode, and the greater the oil and gas storage and migration ability.
The elastic modulus changed rapidly during the rapid fracture stage of the coal body under load, and there were obvious cracks with high strength, high RA, and low AF, which made the cracks expand and fracture violently, which is similar to the dynamic disaster of coal mining.
During the fracture dynamic evolution, the fracture quantity and intensity increased with the load on the coal mass sample. The shear fracture intensity was greater than the tensile fracture intensity. In the rapid fracture stage, the elastic modulus of the coal mass changed rapidly during loading, and there were obvious cracks with high strength, high RA, and low AF, which caused a drastic fracture expansion. The dynamic disaster was similar to that induced by coal mining. Therefore, the high strength, high RA, and low AF of the coal mass can be regarded as a qualitative warning signal for its instability and oil–gas disaster formation.
4.4. Fracture Evolution Path
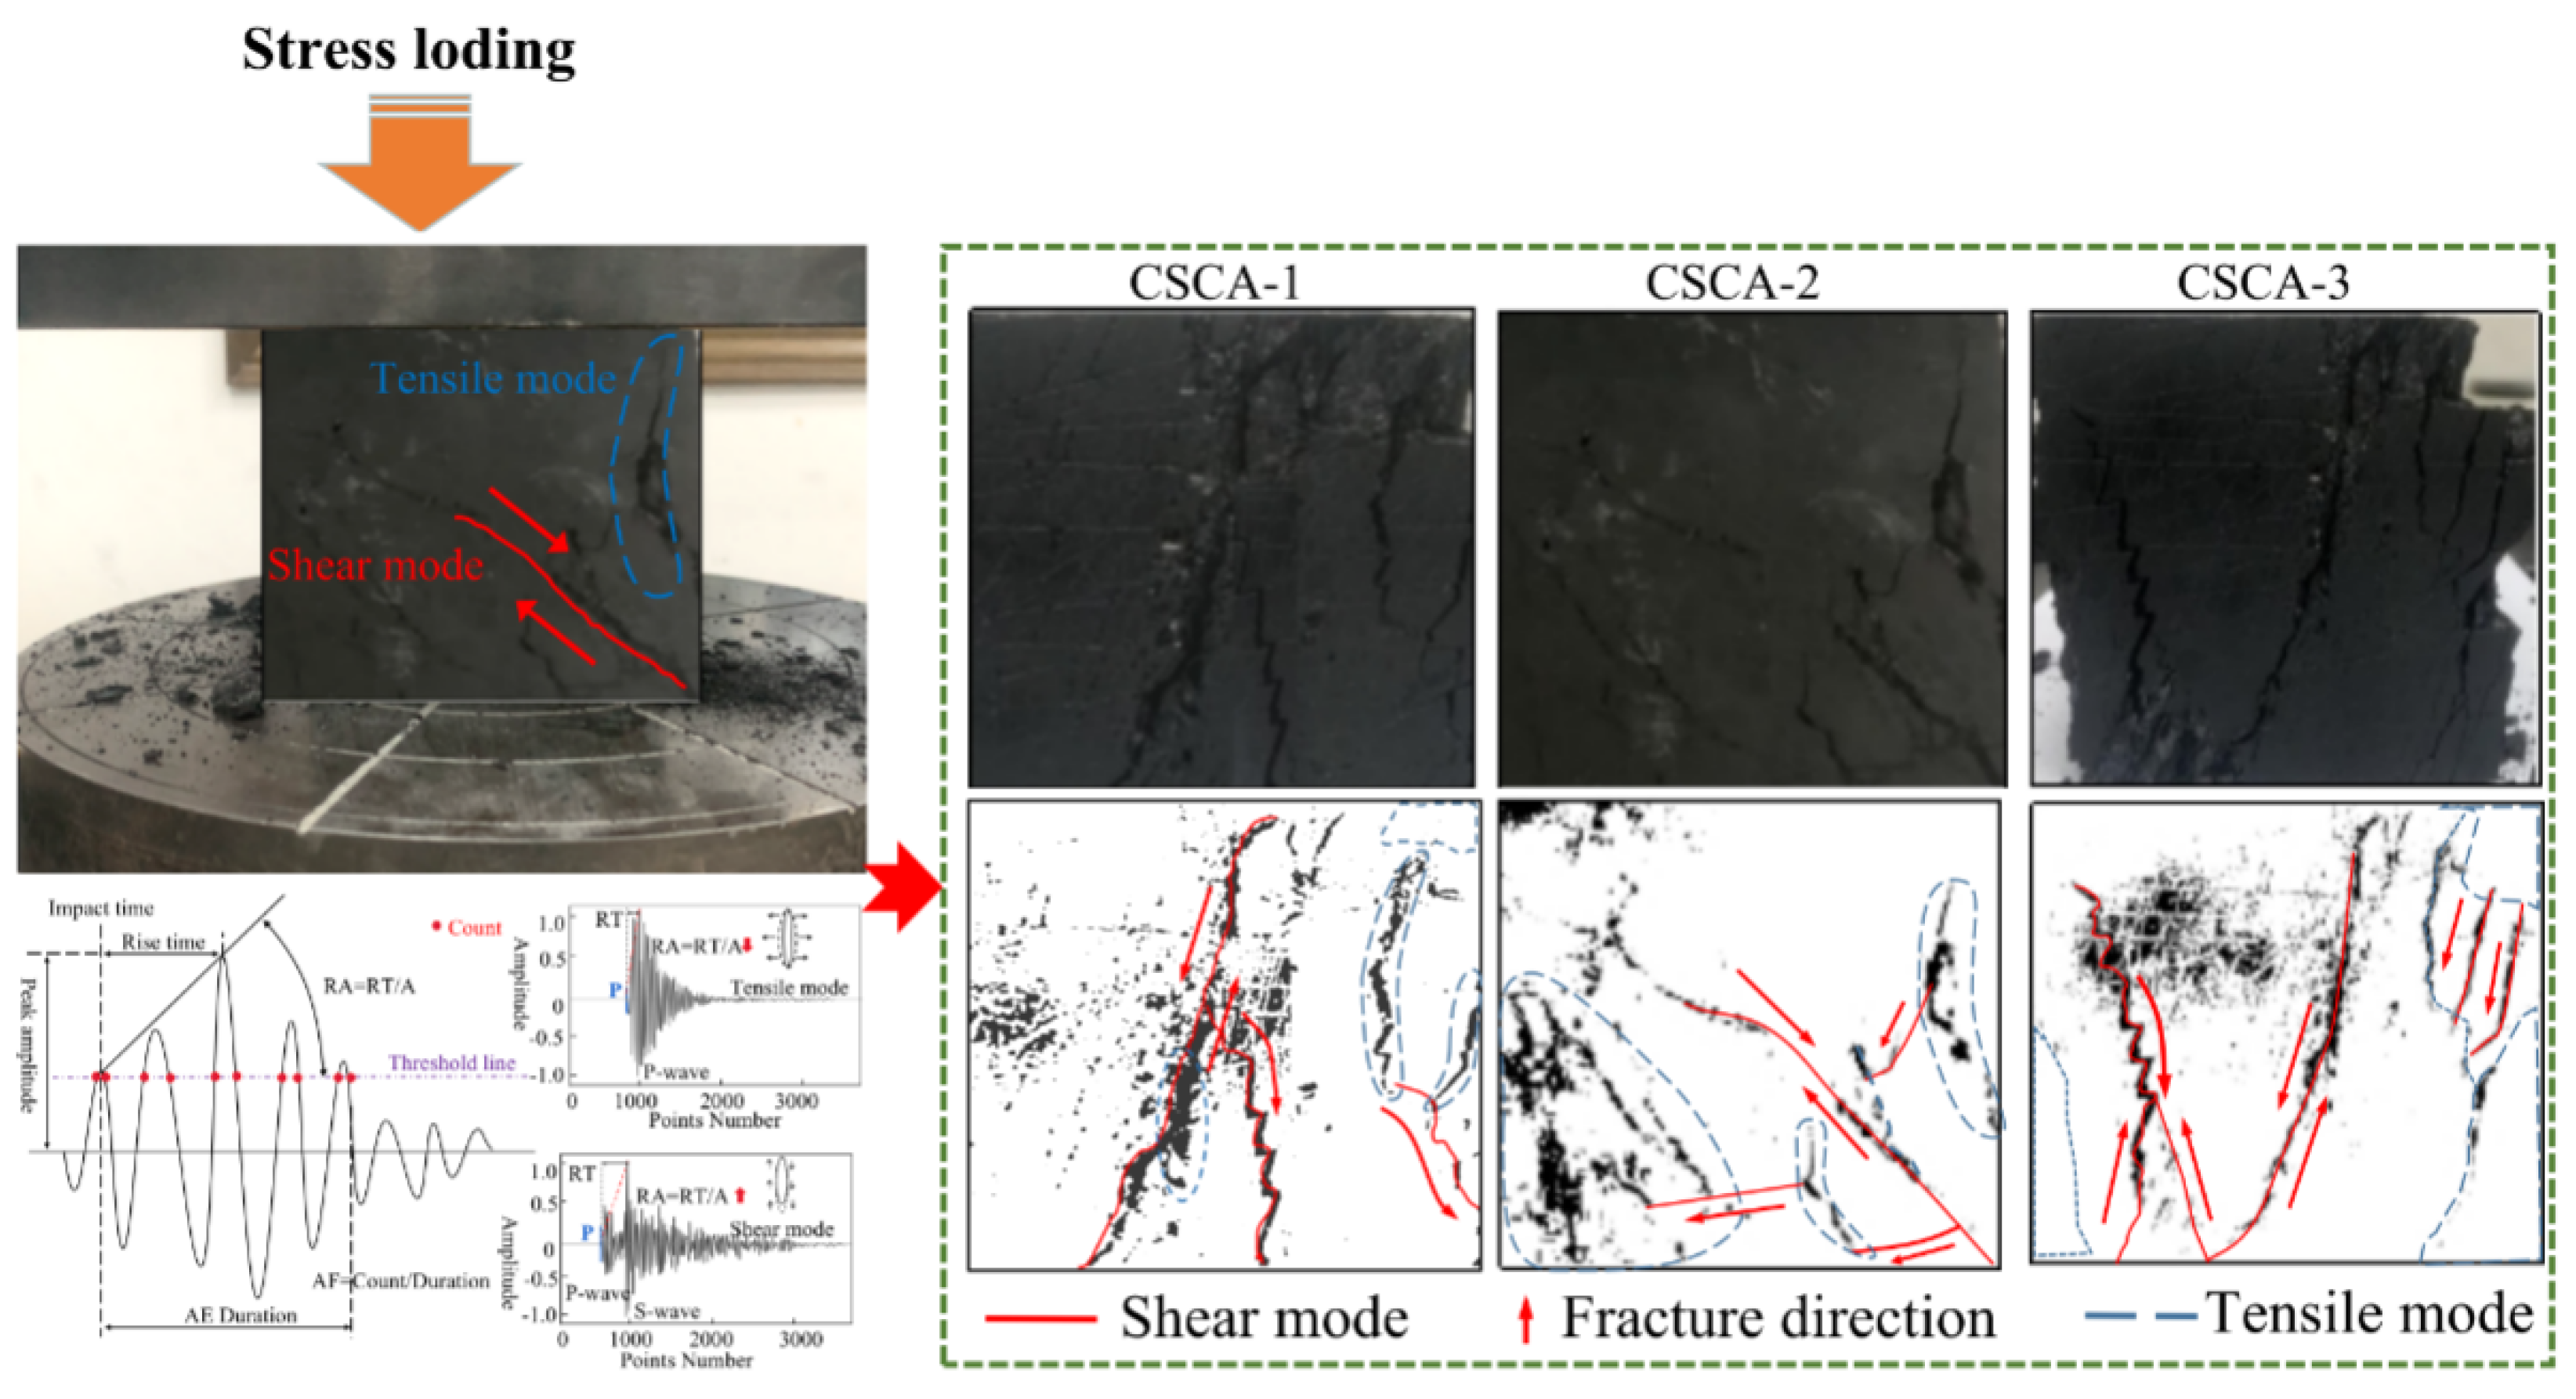
Figure 8 shows the fracture evolution characteristics and fracture mode of a coal mass sample at stage (III). In the loading process of CSCA-1 at the center of the oil and gas enriching section, shear failure first occurred along two principal fractures, and then tensile failure occurred at the edge of the sample. However, fractures were not propagated throughout the sample. Stress and energy continuously accumulated, and finally, shear fracture was propagated throughout the sample in the middle of the principal fracture induced by shear stress. Further, energy was rapidly released during this process. The phenomena that occurred were as follows: A large principal fracture occurred in the sample because of high-pressure oil and gas diffusion at the early stage; moreover, shear failure occurred in the sample along the principal fracture direction under the action of external loads. In the loading process of sample CSCA-2 in the center of the oil–gas enriching section, the sample was first dominated by tensile failure, then the fracture expanded, extended, coalesced, and formed a network structure from the edge to the middle. Subsequently, shear failure occurred in the middle of the sample. The failure path of the sample was approximately a conjugate failure path. In the fracture of sample CSCA-3 at the edge of the oil–gas enriching section, the number and failure form of the fracture expansion were relatively complex. Tensile failure first occurred at the edge of the sample. As the loading strength increased, the fracture expanded, coalesced, and formed a network. Finally, under the combined action of tensile and shear failures, the sample collapsed, and the accumulated stress energy was rapidly released. Moreover, the sample had a high residual strength after yield strength.
5. Discussion
According to the above analysis of the test results, it can be seen that the mechanical properties of the coal around the abandoned oil well have obvious deterioration effects. As the coal is close to the dynamic pressure source, the development degree of internal cracks increases, and the compressive strength gradually decreases. The reason is closely related to the high-pressure gas diffusion. The following is the analysis of the evolution characteristics of coal crack:
(1) There are many microcracks, voids, and mineral particles in the coal body. These defects are the main judgment basis for crack evolution, slip deformation between mineral particles, deformation and failure of coal mass, and also an effective channel for gas disasters. In the reservoir gas enrichment area, under the action of the dynamic pressure source of the abandoned oil well, the internal defect surface of the coal body produces tensile stress, which shows tensile fracture failure on the macro-level. The stress concentration of reservoir gas along the crack tip further promotes the initiation and expansion of cracks and fractures, which is equivalent to forming and widening the permeability channel of reservoir gas, promoting the formation of a dominant channel of reservoir gas in the coal body and increasing the storage capacity.
(2) Different from the previous coal mass damage [
8,
34], the damage of the high-pressure reservoir aerodynamic pressure source to coal mass is horizontal, which is closely related to the location of coal mass and the time of reservoir gas diffusion. The damage characteristics of coal mass have obvious temporal and spatial differences. Due to the small air pressure in the oil layer, the damage to the coal body is similar to the compaction stage of the compression test. Therefore, in the process of oil layer gas diffusion, as the coal mass approaches the abandoned oil well and the accumulation of time, the main crack develops obviously, some microcracks are compacted, the coal density decreases, the CT number decreases, the fractal dimension increases, the deterioration of the mechanical properties of the loaded coal mass increases, and the dominant failure probability of the main crack increases.
(3) Fracture evolution caused by high-pressure oil and gas diffusion increased the density and volume ratio of the coal mass fracture, which contributes to oil and gas disasters. The coal mass produced by mining resulted in the initiation, propagation, and coalescence of fracture due to tensile failure as well as the coalescence and formation of macro-fracture due to shear failure. Meanwhile, the stress and energy released rapidly accumulated at the final coal mass collapse. The rapid accumulation was likely to induce the gushing of oil and gas or a squirting dynamic disaster, where coal and oil resources overlap in the coal mine.
6. Conclusions
(1) The dynamic evolution characteristics of micro-fracture strength and type were analyzed using the average CT number, AE wave, as well as CT scanning and slope change of the stress path. Subsequently, we investigated the macro- and micro-failure laws of coal mass under loading in the coal and oil resources co-storage area, and we also investigated the mechanism of oil and gas diffusion channels. Finally, we proposed a multi-parameter warning condition for coal mass instability and oil and gas disasters.
(2) In the overlapping area of coal and oil resources in a coal mine, coal mass was subjected to the diffusion of high-pressure gas and the mining-induced disturbance in the coal seam, where the oil–gas diffusion damage was related to the distance from the disaster source. The closer the coal mass was to the source, the greater the damage it experienced. Macroscopically, the trace width, length, cutting depth, quantity, and volume ratio of the principal fracture increased; microscopically, the average CT number of the sample was reduced. The oil–gas diffusion damage was mainly tensile failure, leading to an increase in the coal mass fracture density and enhancement of oil–gas storage capacity.
(3) The analysis of RA–AF and the fracture path of coal mass showed that the coal mass fracture was mainly of the tensile type in the first two stages under uniaxial compression, causing an increase in fracture volume and oil–gas storage capacity. In the third stage, an increase in the quantity and intensity of shear fracture caused the rupture and instability of the coal mass and the formation of channels for oil and gas disasters. The high intensity, high RA, and low AF of the fracture in the third stage can serve as qualitative warning conditions for coal mass disasters.
(4) Coal mass instability in the co-storage area of coal and oil resources had a dynamic transformation relationship with oil and gas disasters. Specifically, the formation of oil and gas disaster channels was facilitated by the deterioration of the coal mass mechanical properties in areas where oil and gas disaster sources were abundant. Meanwhile, the stress-relief effect of oil and gas diffusion on the coal mass damage reduced various dynamic disasters caused by coal mining. However, there is no coal and rock mass damage test for the coupling field of high-pressure reservoir gas and mine pressure in the common storage area of kerosene resources. Therefore, the later stage will focus on exploring the damage law of coal and rock mass in the gas–solid coupling field.
Author Contributions
Conceptualization, Y.S. (Yawu Shao) and Y.S. (Yonglu Suo); methodology, Y.S. (Yawu Shao); software, Y.S. (Yawu Shao); validation, Y.S. (Yonglu Suo), J.X.; formal analysis, J.X.; investigation, Y.S. (Yawu Shao); resources, Y.S. (Yonglu Suo); data curation, Y.B.; writing—original draft preparation, Y.S. (Yawu Shao); writing—review and editing, Y.S. (Yonglu Suo); visualization, Y.S. (Yawu Shao); supervision, Y.S. (Yonglu Suo); project administration, S.F.; funding acquisition, T.Y. All authors have read and agreed to the published version of the manuscript.
Funding
This research was funded by [Tao Yang] grant number [National Natural Science Foundation of China: 52004200].
Data Availability Statement
The data analyzed or generated during the research can be provided by the corresponding author upon request.
Conflicts of Interest
The authors declare that they have no conflict of interest.
References
- Yang, Y.L. The safety technology of kerosene gas symbiotic mine in Western China won the first prize. West. Resour. 2015, 2, 61. [Google Scholar]
- Wang, Y.; Yang, W.L.; Deng, J. Coexistence and enrichment of multiple energy minerals in the same basin, metallogenic (reservoir) system and collaborative exploration: Taking Ordos Basin as an example. J. Geol. 2014, 88, 815–824. [Google Scholar]
- Xiao, J.; Ma, X.H. Research and Application of Key Technologies for Disaster Prevention and Control of Abandoned Oil Wells in Ningdong Coalfield; Xi’an Publishing House: Xi’an, China, 2021. [Google Scholar]
- Shao, Y.W.; Suo, Y.L.; Yang, T. Mechanism of Loading Fracture of Coal Mass and Formation of Oil and Gas Disaster Channel in Coal and Oil Resources Costorage Area. Shock. Vib. 2022, 2022, 3372793. [Google Scholar] [CrossRef]
- Zhang, C.Z. Technology and Principle of Industrial Computed Tomography; Science Press: Beijing, China, 2009. [Google Scholar]
- Mao, L.T.; Yuan, Z.X.; Lian, X.Y.; Peng, R.; Liu, H. Measurement of 3D strain field in red stone sample under uniaxial compression with computer tomography and digital volume correlation method. Chin. J. Rock Mech. Eng. 2015, 34, 21–30. [Google Scholar]
- Yuan, J.; Jia, D.; Wei, D.; Chen, Z.; Cui, J.; Wu, X. The characteristics of the core fracture structure based on the industrial CT scanning. Geol. J. China Univ. 2016, 22, 200–206. [Google Scholar]
- Zhou, X.P.; Zhao, Z.; Liu, Y. Digital spatial fracturing behaviors of fine-grained sandstone with pre-fractures under uniaxial compression. Int. J. Numer. Anal. Methods Geomech. 2020, 44, 1770–1787. [Google Scholar] [CrossRef]
- Liu, J.X.; Yang, C.H.; Mao, H.J. Study on fracture spreading and evolvement of clay shale based on CT image processing. J. Zhejiang Univ. Technol. 2015, 43, 66–72. [Google Scholar]
- Deng, Y.G.; Wang, S.L.; Meng, Y.R. Fracture evolution of the tight sandstone of brittle failure based on CT Technology. J. Water Resour. Archit. Eng. 2017, 15, 39–43, 116. [Google Scholar]
- Du, F.; Wang, K.; Dong, X.L.; Wei, J.L. Numerical simulation of damage and failure of coal rock combination based on CT three-dimensional reconstruction. J. China Coal Soc. 2021, 46, 253–262. [Google Scholar] [CrossRef]
- Fu, Y.; Feng, Z.L.; Li, P.C. Numerical analysis of coal rock heterogeneity and its reconstruction model based on CT scanning. J. Min. Saf. Eng. 2020, 37, 828–835. [Google Scholar] [CrossRef]
- Fu, Y.; Chen, X.; Feng, Z.L. Coal rock fracture characteristics based on CT scanning and its influence on failure mode. J. China Coal Soc. 2020, 45, 568–578. [Google Scholar] [CrossRef]
- Moradian, Z.; Einstein, H.; Ballivy, G. Detection of fracturing levels in brittle rocks by parametric analysis of the acoustic emission signals. Rock Mech. Rock Eng. 2016, 49, 785–800. [Google Scholar] [CrossRef]
- Wang, C.L. Evolution, Monitoring and Predicting Models of Rockburst; Springer: Singapore, 2018. [Google Scholar]
- Wang, X.R.; Wang, E.Y.; Liu, X.-F.; Li, X.L.; Wang, H.; Li, D. Macro-fracture propagation process and corresponding AE behaviors of fractured sandstone under different loading rates. Chin. J. Rock Mech. Eng. 2018, 37, 1446–1458. [Google Scholar]
- Dou, L.M.; He, X.Q. Model for rock burst failure and its critical values of acoustic and electromagnetic emission. J. China Univ. Min. Technol. 2004, 33, 504–508. [Google Scholar]
- Wang, E.Y.; He, X.Q.; Liu, Z.T.; Li, Z.H. Study on frequency spectrum characteristics of acoustic emission in coal or rock deformation and fracture. J. China Coal Soc. 2004, 29, 289–292. [Google Scholar]
- Ohtsu, M.; Isoda, T.; Tomoda, Y. Acoustic emission techniques standardized for concrete structures. J. Acoust. Emiss. 2007, 25, 21–32. [Google Scholar]
- Zhou, Z.L.; Li, G.N.; Ning, S.L.; Du, K. Acoustic emission characteristics and failure mechanism of high-stressed rocks under lateral disturbance. Chin. J. Rock Mech. Eng. 2014, 33, 1720–1728. [Google Scholar]
- Zeng, H.; Hartell, J.A. Identification of Acoustic Emission Signatures and Their Capability to Assess the Damage of Reinforced Concrete Beam under Incremental Cyclic Loading. J. Mater. Civ. Eng. 2022, 34, 04022085. [Google Scholar] [CrossRef]
- Pei, X.J.; Zhu, L.; Cui, S.H. Study on acoustic emission response characteristics of rock with defects under loading and unloading conditions. J. Rock Mech. Eng. 2020, 39 (Suppl. 1), 2602–2611. [Google Scholar] [CrossRef]
- Zhao, Y.X.; Qiao, H.Q.; Xie, R.S. Study on lightweight three-dimensional convolution prediction model of acoustic emission for uniaxial compression failure of coal and rock. J. Rock Mech. Eng. 2022, 1–14. [Google Scholar] [CrossRef]
- Sun, H. Study and Application of Stress Fracture Seepage Coupling Mechanism of Mining Coal and Rock; Xi’an University of Science and Technology: Xi’an, China, 2017. [Google Scholar]
- Cai, M.F.; He, M.H.; Liu, D.Y. Rock Mechanics and Engineering, 2nd ed.; Xue Publishing House: Beijing, China, 2013. [Google Scholar]
- Lai, X.P.; Zhang, S.; Cui, F. Energy release law and key disaster acoustic emission signal pickup during damage evolution of water bearing coal and rock. J. Rock Mech. Eng. 2020, 39, 433–444. [Google Scholar] [CrossRef]
- Wang, C.L.; Houx, L.; Li, H.T. Experimental study on dynamic evolution characteristics of meso cracks in uniaxial compression sandstone. J. Geotech. Eng. 2019, 41, 2120–2125. [Google Scholar]
- Zhang, P.H. Study on Precursory Law Prior to Rock Failure Based on Acoustic Emission Time Order; Northeastern University: Shenyang, China, 2015; pp. 44–48. [Google Scholar]
- Ohtsu, M. Simplified moment tensor analysis and unified decomposition of acoustic emission source: Application to in situ hydrofracturing test. J. Geophys. Res. 1991, 96, 6211–6221. [Google Scholar] [CrossRef]
- Aki, K.; Richards, P.G. Quantitative Seismology: Theory and Methods; W. H. Freeman: San Francisco, CA, USA, 1980. [Google Scholar]
- Lai, X.; Ren, J.; Cui, F.; Shan, P.; Dai, J.; Xu, H.; Wang, Z. Study on vertical cross loading fracture of coal mass through hole based on AE-TF characteristics. Appl. Acoust. 2020, 166, 107353. [Google Scholar] [CrossRef]
- Zhao, Y.; Wang, C.L.; Teng, M.Y. Observation on microstructure and shear behavior of mortar due to thermal shock. Cem. Concr. Compos. 2021, 121, 104106. [Google Scholar] [CrossRef]
- Lai, X.P.; Zhang, S.; Dai, J.J. Multi scale damage evolution characteristics of coal and rock under hydraulic coupling. J. Rock Mech. Eng. 2020, 39, 3217–3228. [Google Scholar] [CrossRef]
- Wen, H.; Fan, S.; Ma, L.; Guo, J. Cheng Xiaojiao, principal Tong Development status and Prospect of CT scanning technology for coal and rock damage research. Coal Sci. Technol. 2019, 47, 44–51. [Google Scholar] [CrossRef]
| Publisher’s Note: MDPI stays neutral with regard to jurisdictional claims in published maps and institutional affiliations. |
© 2022 by the authors. Licensee MDPI, Basel, Switzerland. This article is an open access article distributed under the terms and conditions of the Creative Commons Attribution (CC BY) license (https://creativecommons.org/licenses/by/4.0/).


