Featured Application
The Taguchi methodology can effectively optimize brain gray/white matter CT image quality by finite combinations of five parameters with an auxiliary slit gauge and solid water plates. The methodology can be applied in other medical facilities in similar scenarios and the slit gauge solidifies the image quality via a quantified calculation instead of a manual judgement.
Abstract
Injuries due to traffic accidents have been significant causes of death in Taiwan and traffic accidents have been most common in recent years. Brain computed tomography (CT) examinations can improve imaging quality and increase the value of an imaging diagnosis. The image quality of the brain gray/white matter was optimized using the Taguchi design with an indigenous polymethylmethacrylate (PMMA) slit gauge to imitate the adult brain and solid water phantoms. The two gauges without coating contrast media were located inside the center of a plate to simulate the brain and scanned to obtain images for further analysis. Five major parameters—CT slice thickness, milliampere-seconds, current voltage, filter type, and field of view—were optimized. Analysis of variance was used to determine individual interactions among all control parameters. The optimal experimental acquisition/settings were: slice thickness 2.5 mm, 300 mAs, 140 kVp, smooth filter, and FOV 200 mm2. Signal-to-noise was improved by 106% (p < 0.001) over a routine examination. The effective dose (HE) is approximately 1.33 mSv. Further clinical verification and the image quality of the ACR 464 head phantom is also discussed.
1. Introduction
Injuries caused by accidents were among the top ten leading causes of death in Taiwan in 2020, and most were caused by traffic accidents [1]. Computed tomography (CT) is commonly used in the front-line diagnosis of brain trauma and can improve the probability of survival of an injured person with brain trauma [2]. CT has been proven to be accurate in revealing anatomical and pathological phenomena owing to its high spatial resolution [2,3,4,5,6,7,8]. Imaging quality for brain gray/white matter was optimized using the Taguchi methodology with an indigenous polymethylmethacrylate (PMMA) slit gauge and solid water phantom to imitate the adult brain (300 × 300 × 40 mm3) in this work [9]. In addition, the specific slit gauge can solidify the image quality into a quantified evaluation rather than a visible judgement by well-trained radiologists. The image quality that is achieved by a brain CT acquisition examination for brain trauma was optimized using the Taguchi design.
CT is extensively used as a vital non-invasive diagnostic tool in the medical field and material science. Most radiographers in Taiwan proceed to follow quality assurance experiments of the American College of Radiology (ACR) phantom weekly or biweekly to optimize the quality of brain images and avoid clinical misdiagnosis. In Taiwan, five parameters—(A) CT slice thickness, (B) milliampere-seconds (mAs), (C) current voltage, (D) filter type, and (E) field of view (FOV)—are regarded as the most important parameters in a routine examination to determine the quality of images obtained in brain CT. The factors or levels assigned in this work were referred to the previous research listed in Pan et al. and recommended by the clinical medical staff to conclude the arrangement of practical brain CT scan cases [8].
Many researchers have developed customized phantoms that fulfill the requirements associated with their unique purposes. These adopted phantoms are commercially standardized and assembled with multiple layers to ensure the accuracy of medical images, densitometry, and a favorable spatial resolution [10,11,12,13,14]. Pan et al. developed a new slit gauge made of PMMA. That was assembled with solid water plates to imitate the adult abdomen (300 × 300 × 200 mm3) for 64-slice CT scanning [8]. In contrast, a new idea to simulate the gray/white matter brain was developed herein [9]. It could effectively help radiologists to identify the optimal acquisitions for routine brain CT and to ensure the accuracy, reproducibility, and consistency of multiple experiments [6,7,8]. Yunker et al. designed a phantom for surveying liquid flow during imaging [10]. Brisse et al. used PMMA cylindrical phantoms with various diameters to evaluate contrast-to-noise ratio and low contrast detectability evaluation [11]. Yoon et al. used an anthropomorphic lung phantom to revise CT imaging experiment [12]. Daisnea et al. used a 3D phantom to verify the integrated performance of performance of combined CT, MRI, and PET scan imaging [13]. This particular slit gauge could be assembled with a solid water plate of any dimensions to simulate accurately the size of the brain for use during CT examinations in cases of brain trauma.
Scattered and unscattered photon attenuations cause much interference and noise in relation to image quality; therefore, an optimal acquisition of dominant parameters can effectively suppress noise to obtain suitable images for clinical diagnosis. The organized plate gauge was scanned three times in each experiment, analyzed, and graded by three well-trained radiologists according to the double-blind principle to ensure reproducibility. Unlike some optimization processes focused only on a single or minor parameter, the optimization herein simultaneously considered five parameters. To evaluate the complexity of the optimization, the cross-interactions between these parameters were considered. The purpose was to investigate the improvement in image quality that can be achieved by modulating the parameters in brain CT examination following injuries caused by accidents. The suitability of ACR 464, the head phantom for this purpose, is also discussed.
The Taguchi design was first introduced by Genichi Taguchi to improve the quality of manufactured products. It is a well-known methodology and widely adopted in most industrial engineering contexts. However, the optimization of medical images was initiated only in the last decade. The unique sets of criteria for optimizing image quality in various facilities have to be considered individually; thus, optimization becomes essential in medical fields for providing confident imaging in clinical diagnosis [14]. The Taguchi method is very effective for designing high-quality systems. It uses unique orthogonal arrays to obtain extensive data from only a small number of experiments. The design involves not only the optimal acquisition of operative parameters but also reduces fluctuations in system performance as a result of any variations in quality [6,7,8,14,15,16]. The Taguchi design can be used to optimize brain CT parameters to generate CT images of reliably high quality. Typically, quality characteristics are of three kinds: the-higher-the-better, the-more-nominal-the-better, and the-lower-the better. The goal of this study is to maximize image quality, which is a higher-the-better parameter [14]. The Taguchi design can be applied to medical facilities and scenarios.
2. Materials and Methods
2.1. The 128-Slice CT
At Lukang Christian Hospital (LKCH), image quality was measured using 128-slice multi-detector computed tomography (MDCT) with Extended Brilliance Workspace V4.0 with O-MAR (Metal Artifact Reduction for Orthopedic Implants) and the iDose 4 (iterative Dose) technique for processing and analyzing. The model was a Philips Brilliance 128-slice CT with a Maximus Rotalix Ceramic X-ray tube (Brilliance, Phillips Healthcare Center) [2]. The iterative algorithm in the Philips CT scan protocol is iDose 4 that was preset as the original default in our study to suppress unexpected uncertainty. In addition, the iDose 4 was set as level 2 to maintain either low noise (93% to primary image) or low dose (−20% to original preset).
2.2. Slit Gauge
To evaluate the quality of the reconstructed CT image of the brain, a specifically customized slit gauge (60 × 30 × 20 mm3) was used. It was made of PMMA. Three groups of slits in the gauge were milled precisely using a 0.5 or 0.7 mm cutter. As presented in Figure 1, Group (A) consisted of four vertical slits with a width of 0.5 mm, Group (B) consisted of five horizontal slits with a width of 0.7 mm, and Group (C) consisted of two oppositely oriented V-shaped slits that were milled with either a 0.5 or a 0.7 mm cutter for comparison. The width of each of the four slits had increments of 0.5, 1.0, 1.5, 2.0, and 2.5 mm, and the depths of the four slits were 0.2, 0.4, 0.6, and 0.8 mm. The slit gauge was customized by a digitized machining mill with an accuracy up to 2 × 10⁻² mm. These groups of slits were designed to generate a series of recognizable shapes that were useful in quantifying the quality of gauge images that were obtained during brain CT examinations. A line that is completely well visualized and clearly distinguished is scored one; any other is scored zero. Group (A) has 16 (8 × 2 = 16) lines and group (B) has 20 (5 × 4 = 20) lines. Horizontal and vertical scans clearly distinguish 72 (2 × (16 + 20) = 72) lines. Therefore, in each experiment, the maximum grade is 72 and the minimum grade is zero.
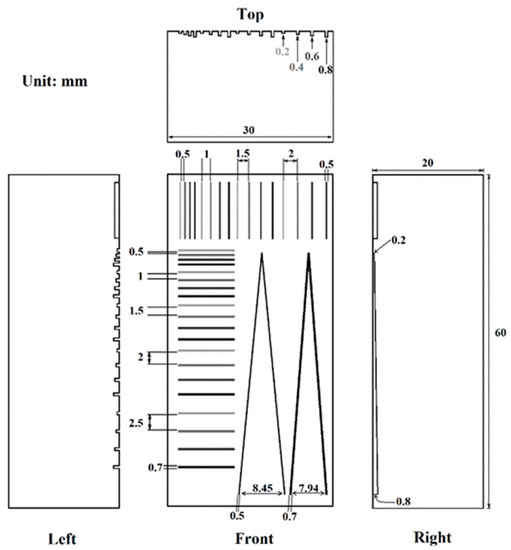
Figure 1.
Slit gauge.
The study was preset to recognize the differences between gray and white matters in brains from the CT diagnosis; thus, the slits were not coated with contrast media [9]. Figure 2 displays the slit gauge ready for scanning. Figure 2A presents the 128-slice brain CT examination and demonstrates that the slit gauge was assembled using several solid water plates (300 × 300 × 40 mm3) whose dimensions were equal to 4, 4, and 4 cm to simulate an adult head. Figure 2B presents a detailed view of the slit gauge. It was placed in the center of solid water plates for (C) horizontal and (D) vertical verification.
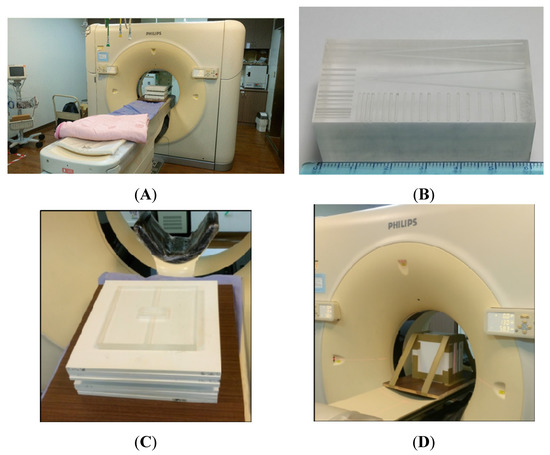
Figure 2.
(A): Slit gauge under 128-slice brain CT examination. (B) Detailed view of the slit gauge. The slit gauge was placed in the center of three solid water plates (300 × 300 × 40 mm3). The thickness of each of the upper, middle, and bottom plates was 4, 4, and 4 cm for (C) horizontal and (D) vertical verification. The slit gauge was assembled using several solid water plates to simulate an adult head for CT scanning.
2.3. Orthogonal Arrays
An experimental design that was based on an orthogonal array was used to examine the five parameters of acquisition in various experiments. One parameter had two levels and the other four had three levels, as presented in Table 1. Accordingly, the total number of possible experiments was 2 × 34 = 162 listed at Table 2. The most suitable orthogonal array L18 (21 × 34) was selected to determine brain CT imaging. The Taguchi design is used to reduce the sensitivity of parameters to causes of variance [14]. Only 18 experiments with different sets of values of the parameters were carried out; the results had the same degree of confidence, as if all of the parameters were considered separately. The five considered parameters were (A) CT slice thickness, (B) milliampere-seconds (mAs), (C) current voltage (kVp), (D) filter type, and (E) field of view (FOV).

Table 1.
Brain CT parameters and their levels.

Table 2.
Full Taguchi design with L18 (21 × 34) orthogonal array.
In the Taguchi design, the terms “signal” (S) and “noise” (N) represent desirable and undesirable output characteristics, respectively. A loss function S/N (η) is defined to quantify the deviation between desirable and undesirable values. Taguchi recommended the use of S/N to express the deviations of performance characteristics from desirable values [13]. Each experiment is associated with a particular definition of the S/N ratio, which is used in the computation of optimal acquisitions. The optimal acquisitions are those that yield the highest η ratios, which always correspond to better quality [14,15].
A larger η is considered preferable because the quality of a gauge image is “the-higher-the-better”. Therefore, the higher-the-better quality characteristic is used as follows.
where ηi is the loss function S/N in the ith experiment and is given in units of dB, for xij is the grade of a gauge image that is assessed by the ith radiologist in the jth trial. r is the same image grade by a radiologist for three trials. q is the number of radiologists. m represents the total number of trial repeats in each experiment. The sensitivity of the average ηi for various experiments to each parameter was calculated. In this study, q = 3 and r = 3 were used in all experiments.
The average η values from the experiments were calculated to evaluate the sensitivity of each experiment [17]. The total number of trials in each experiment was 9. The same gauge image was graded by three radiologists in three trials, so m = 3 × 3 = 9. Taguchi recommended the use of the common logarithm of this S/N ratio, multiplied by 10 [6,7,14,15].
2.4. Analysis of Variance (ANOVA)
Analysis of variance (ANOVA) was used to measure confidence and to determine which parameters had statistical significance [6,7,14,15]. The sum of squares of all the variance (SST) can be separated into the sum of squares which correlate with particular operating parameters (SSP) and the sum of squared errors (SSE) [14,17].
where . is associated with the specific parameter of the mean grades of all experiments; is the mean grade of the kth level of a specific parameter; n is the number of experiments (n = 18); m is the number of trials in each experiment (m = 9); and L is the number of levels of each parameter. The values of L are 2, 3, 3, and 3 (Table 1).
2.5. F-Test and t-Test
The F-test, developed by Fisher, is a useful method to determine whether parameters are dominant or not in a brain CT examination. The F-test is used to find the effectiveness and non-effectiveness of the parameters in the experiment at the confidence level of interest. Percentage contribution is a statistical parameter that compares the effect of different experiments on the output of two sampled populations. Consequently, the F-test was conducted as follows [14,15,16,17,18,19]:
Fx is the F-value of the specific parameter for checking this parameter, x. SSx is the sum of squares of specific parameter x. DoFx is the degree of freedom. Varx is the variance of parameter x and SSx/DoFx is the variance of Fx. If the confidence level of the F-value exceeds 99%, then the imaging parameter is regarded as statistically significant. Furthermore, a larger F-value indicates greater importance of the parameter in brain CT [17]. The DoFx values for thickness, mAs, kVp, filter, FOV, and SSE are 1, 2, 2, 2, and (2 × (5 − 1)) = 8, respectively [14]. The confidence level can be derived using the FDIST run in Excel 2020.
If the variances of parameter are equal, then the probability that F will exceed F0.05 is only 5%. The value of F0.05 depends on the number of samples taken from each population. Therefore, if F > F0.05, the variance of one population exceeds the variances of the others. A confidence interval of >95% was considered to be statistically significant with a very large number of samples. A larger Fx value indicates a more dominant parameter in 128-slice brain CT.
The paired Student’s t-test with a S/N value of 95% (p < 0.05) was used in statistical analysis to compare experimental results accurately and completely [3]. The basic indices, routine, Taguchi, and optimal acquisitions were compared using this t-test. The tested hypothesis was that S/N values did not vary among routine examinations, the Taguchi experiments, and the optimal experiments. Two confidence intervals, p < 0.01 and p < 0.05, were used to identified significant differences at the 95% and 99% levels, respectively.
2.6. Grading the Gauge and Verification
All of the visible lines in the slit gauge (both horizontal and vertical) in the 128-slice CT scanned images in every experiment were evaluated by three well-trained radiologists, so r = 3 in Equation (1). To eliminate any biases to ensure reproducibility and consistency and to reduce counting errors, each reconstructed image was given to a randomly selected radiologist and graded blindly. Each grading was carried out three times. Accordingly, nine grades for each experiment (m = 9) were averaged to determine the quality of the reconstructed brain CT images. Numerous visible lines were recorded in the reconstructed 128-slice CT images in the 18 experiments, and n = 18 in Equation (2).
For further verification, imaging qualities of CT accreditation phantom of ACR (model 464, Gammex-RMI, Middleton, WI, USA) in 128-slice brain CT using the predicted optimal experiment and the routine examination had been previously used in LKCH for verification [20].
3. Results
3.1. Data Analysis
Increasing the value of the loss function (S/N, η) and reducing the radiation dose are very important to improve the quality of brain images. The optimal experiments in the Taguchi design are those that yield the maximum S/N values. The definition of η (Equation (1)) herein can be revised to satisfy various requirements. However, the definition of η involved not only the averaged grades in each experiment but also the consistency of the grades given by the well-trained radiologists in a real optimization process. The recalculated S/N values for experiments 1 to 18 were 33.06, 34.30, 33.36, 32.98, 33.66, 34.89, 33.50, 34.00, 33.98, 22.92, 33.74, 33.11, 26.12, 33.00, 33.54, 26.67, 32.51, and 33.76, respectively.
Table 3 presents the η values for the L18 orthogonal array. Experiment 6 yielded the highest average grade of 55.56, converted into an η value of 34.89 dB, which was the highest for any experiment. That experiment therefore involved the optimal acquisitions of A1 (2.5 mm thickness), B2 (350 mAs), C3 (140 kVp), D3 (smooth filter), and E1 (200 mm2 FOV). Accordingly, a high η does not depend on a high averaged grade (Equation (1)). Table 3 based on the Taguchi design shows that the optimal experiment for CT was experiment 6. Experiment 10 yielded the worst grade of 14.00, with a standard deviation of 7.50, converted to an η value of 22.92 dB.

Table 3.
Grading images from 18 experiments based on the Taguchi design.
Figure 3 plots the averaged grades, the standard deviations of the grades, and η values against the corresponding operating parameters of the 128-slice CT. However, neglecting cross-interactions of the five parameters may produce an erroneous optimization analysis because over-intensifying the η of an individual parameter might reduce the overall performance [7,14].
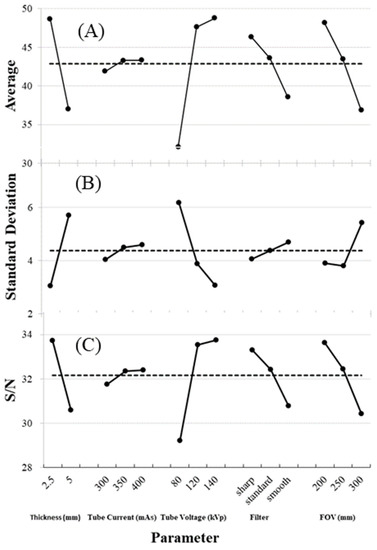
Figure 3.
Fish-bone-plots of (A) the average grades, (B) the standard deviations of the grades and (C) S/N value against the parameters in the 128-slice brain CT experiments. A1 (2.5 mm thickness), B3 (400 mAs), C3 (140 kVp), D1 (sharp filter), and E1 (200 mm2) yield the highest S/N among the 18 experiments.
Table 4 presents a Taguchi experiment with A1 (2.5 mm thickness), B3 (400 mAs), C3 (140 kVp), D1 (sharp filter), and E1 (200 mm2 FOV) such that the parameters are set to yield the highest S/N obtained in any of the experiments because the variable η is of the “the-higher-the-better” type according to the Taguchi design (Equation (1)). Variations in the other parameters caused only minor fluctuations.

Table 4.
Parameter confidence levels attributed to the effectiveness of the 128-slice CT acquisition experiment. A parameter was considered significant if the corresponding confidence level exceeded 95%.
3.2. Analysis of Variance: ANOVA
ANOVA is a statistical method for determining individual interactions among all control parameters in Taguchi designs. It is used herein to identify parameters that significantly affect image quality characteristics among thickness, mAs, kVp, filter type, and FOV. A parameter was considered significant if the confidence level exceeded 95% [14]. Table 4 presents the ANOVA results for the five parameters. F0.05 is provided for reference, since it represents a statistical confidence of 95%. ANOVA results revealed that most parameters significantly affected the values at a significance level of 0.05. Since they had higher F-values than other parameters, (A) thickness, (C) current voltage (kVp), (D) filter type, and (E) Field of View (FOV) were deemed to be significant primarily because their associated confidence levels exceeded 95%.
Thickness was the most influential parameter, with an F-value of 224.97. Table 4 shows that the F-values of kVp, field size, and filter type were 188.35, 71.14, and 31.80, respectively. Percentage contribution is a statistical parameter that is used to compare the effects of parameters on an output. mAs was deemed insignificant because its associated confidence level was 80.25% less than those of other parameters. Therefore, thickness, kVp, filter type, and FOV corresponded to the confidence level that is required for clinical diagnosis. The only minor parameter was mAs. The confidence level associated with the parameter “other” was 97.62%, which is close to 99%, revealing that other parameters affect the quality of images obtained in a 128-slice CT brain examination [6,7,8]. In the Taguchi design, the experiment that yields the highest S/N ratio is the best of the experiments performed but not necessarily the optimal one.
3.3. Cross-Interactions of Operating Parameters in Brain CT
The Taguchi design is used herein not only to identify the parameters that dominate image quality but also to calculate specific cross-interactions among them. In the unique orthogonal arrangement L18 (21 × 34) of the experiments, the frequencies of the parameters were fixed across interactions (Table 1). The data in Table 3 were rearranged to calculate the cross-interactions of the five parameters, providing a regulated basis for compiling six cross-interactions among five individual parameters [6,14].
In the 128-slice CT acquisition experiment, three of the six cross-interactions of these parameters were strong. Figure 4 presents the cross-interactions between pairs of parameters, (A) thickness vs. filter type (A × D), (B) thickness vs. current voltage (A × C), (C) thickness vs. FOV (A × E), (D) filter type vs. FOV (D × E), (E) current voltage vs. FOV (C × E), and (F) current voltage vs. filter type (C × D). Parameter D (filter type) was determined to be the most influential of five parameters in brain CT examinations. The data fluctuations that were associated with changes in these parameters exceeded those associated with changes in the other parameters. In Figure 4B (thickness vs. current voltage (A × C)) and C (thickness vs. FOV (A × E)), the two lines barely intersected, implying the absence of any cross-interaction between the two parameters, which were weakly correlated. The S/N values declined as the thickness decreased with filter type, kVp, and FOV acquisitions. Figure 4A–C demonstrate that the S/N values were highest when filter type, kVp, and FOV were at their highest values (sharp filter, 140 kVp, 200 mm2). Figure 4E,F show that the most complicated cross-interactions among these three parameters in all of the CT experiments are between filter type and FOV.
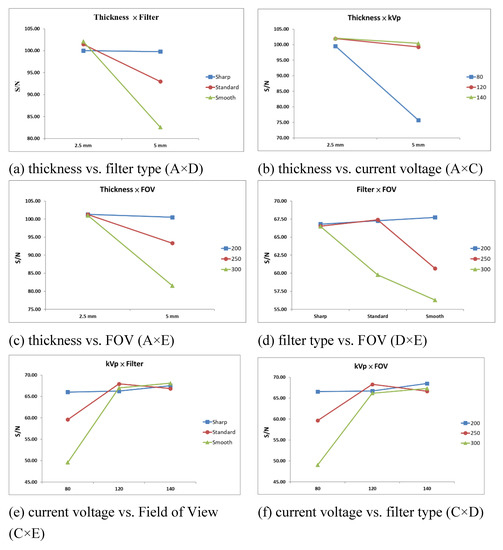
Figure 4.
Six cross-interactions between pairs of parameters in the 128-slice CT acquisition experiments. (a) Thickness vs. filter type (A × D). (b) Thickness vs. current voltage (A × C). (c) Thickness vs. FOV (A × E). (d) Filter type vs. FOV (D × E). (e) Current voltage vs. FOV (C × E). (f) Current voltage vs. filter type (C × D).
3.4. Confirming Brain CT Experiments
The optimal experiment is unique and may or may not be one of the 18 original experiments that were designed according to Taguchi’s method. However, any suggested experiment must be practically verified to confirm its suitability. A confirmatory brain CT experiment should therefore be conducted under Taguchi conditions. The highest S/N value in any individual experiment does not suffice in the real optimization design recommended by Taguchi [14]. A confirmatory experiment was therefore carried out to validate the optimal acquisitions that were obtained from the Taguchi design. In practice, no operating parameter can be identified by the highest S/N value alone; rather, the parameter must be considered with others in determining the image quality of 128-slice CT examinations. A routine examination with A2 (5 mm thickness), B2 (350 mAs), C2 (120 kVp), D2 (standard filter), and E2 (250 mm2 FOV), which is used in most hospitals, is considered for comparison [2].
Table 5 presents the Taguchi experiment that yields the highest S/N value when the parameters are considered separately; it has A1 (2.5 mm thickness), B3 (400 mAs), C3 (140 kVp), D1 (sharp filter), and E1 (200 mm2) FOV, as mentioned in Figure 3C. Table 5 compares brain CT experiments with the routine examination, the Taguchi experiment, and the optimal experiment. Routine examination yields the average grade with an S/N value of 33.13. The Taguchi experiment yields a maximum increase of 6% because 35.03/33.13 = 106%. A significant difference in S/N (p < 0.001) was observed between the routine examination, 33.13, and the Taguchi experiment, 35.03. A significant difference in S/N (p < 0.001) was also observed between the routine examination, 33.13, and the optimal experiment, 34.89. In addition, Figure 5 shows the (A1) horizontal, (A2) vertical of the routine examination, (B1) horizontal, (B2) vertical of the Taguchi experiment, and (C1) horizontal, (C2) vertical of the optimal experiment in 128-slice brain CT examinations.

Table 5.
Comparisons among the routine examination, the Taguchi experiment, and the optimal experiment in 128-slice brain CT examinations.
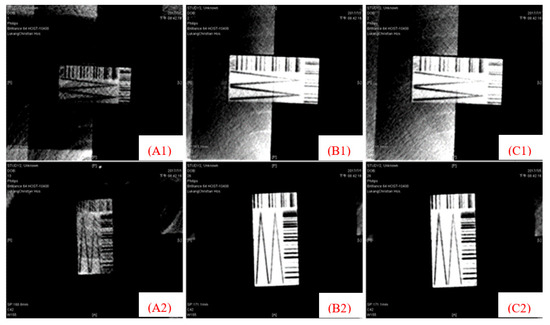
Figure 5.
(A1) Horizontal, (A2) vertical of the routine examination, (B1) horizontal, (B2) vertical of the Taguchi experiment, and (C1) horizontal, (C2) vertical of the optimal experiment in 128-slice brain CT examinations.
The accompanying Volume Computer Tomography Dose Index (CTDIVOL) of the brain CT effective dose (HE) in examinations was read directly from the CT machine [2]. During the scan, it was multiplied by the scan length (17.1 cm) to yield the dose length product (DLP) (mGy cm) [3]. HE is calculated as:
where k [mSv/(mGy cm)], the conversion factor, is 0.0019 mSv/(mGy cm) for the brain scan [3]. The HE of the routine examination at LKCH was 60 mGy × 17.5 cm × 0.0019 mSv/(mGy cm) = 2.01 mSv. The HE values of the Taguchi experiment and the optimal experiment were evaluated as 3.34 and 2.51 mSv, respectively. The accompanying HE was still under the limit of 100 mSv/year and 50 mSv/year that was recommended by the International Commission on Radiological Protection in its report no. 60 [21]. In addition, Yeh et al. demonstrated that the diagnosis reference level for the mean HE of head CT was 2.0 ± 0.4 mSv in Taiwan in 2013 [22].
HE (mSv) = k × DLP
3.5. Clinical Verification with ACR Phantom
For further verification, brain CT examinations were performed on ACR 464 accreditation phantoms using the optimal experiment that was based on the Taguchi design and the routine examination that was previously used at LKCH. The ACR 464 CT accreditation solid phantom had an acrylic PMMA block, as shown in Figure 6. The solid phantom is suitable for scanning image quality and evaluating HE. It consists of four independent modules, constructed originally from a water-equivalent material. Each module is 4 cm deep and 20 cm in diameter. Module 4 contains eight bar resolution patterns of 4, 5, 6, 7, 8, 9, 10, and 12 line pairs per centimeter. It tests high-contrast resolution with eight different spatial frequency bar patterns [20].
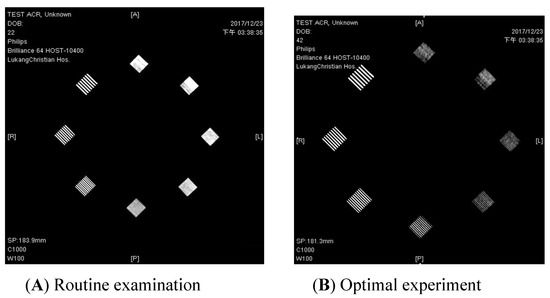
Figure 6.
Contrast resolution image from (A) the routine examination and (B) the optimal experiment using the ACR CT accreditation phantom. The window acquisition is 100 and the level acquisition is 1000. The mean spatial resolution is 8.0 ± 0.00 line pairs/cm and 9.33 ± 0.50 line pairs/cm, respectively.
In Module 4, the high-contrast resolution test involved 4, 5, 6 line pairs per centimeter (lp/cm), which were easily visible in (A) the routine examination. The 4, 5, 6, 7, 8 lp/cm were easily visible in (B) the optimal brain CT, while the 9, 10, 12 lp/cm were less easily visible. A significant difference in line pairs was observed between the Taguchi experiment and the optimal experiment. As shown in Figure 6, the spatial resolution was 8.00 ± 00 lp/cm in the routine examination and 9.33 ± 0.50 lp/cm in the optimal experiment, with significant differences in line pairs between the two experiments (p < 0.001). The S/N values of the ACR head phantom can be improved by 16%, since 9.33/8.00 = 116%, from the optimal experiment to the routine examination. The Taguchi design is found to be an effective design in developing the optimal experiment in brain CT, although some limitations are introduced by either choosing the S/N ratio as the metric or presenting an inappropriate orthogonal array for finding the optimum levels of the parameters. Many investigators have introduced other performance measures as alternatives to the S/N ratio.
4. Conclusions
Brain CT examinations were the most common examinations and increased rapidly. For front-line diagnosis of brain trauma, five parameters of 128-slice MDCT were quantified for the quality of images obtained in 18 experiments of the Taguchi design. In the optimization process, the suggested optimal parameters that yielded the highest S/N value were: 2.5 mm thickness, 400 mAs, 140 kVp, sharp filter, and 200 mm2 FOV. The parameters are set to yield the highest S/N obtained in any of the experiments because the variable S/N is of the “the-higher-the-better” type according to the Taguchi design. The results thus obtained demonstrate that the S/N changed from 22.92 to 34.89. Thickness was the most strongly influencing of the five parameters as determined by analysis of variance (ANOVA). Thickness was the most strongly influencing of the five parameters as determined by ANOVA.
Our results can significantly improve image quality up to 106%. The specific optimization was accomplished using the unique 40 mm solid water plate and the Philips CT facility. Thus, all the essential parameters need to be reset according to other medical facilities in similar scenarios. The HE of the optimal experiment was higher than that of the routine examination for brain trauma. HE was increased but still far below the dose limit recommended by the authority, from 2.01 (the routine examination) to 3.34 mSv (the optimal experiment).
Author Contributions
Conceptualization, Y.-C.T., H.-C.L., C.-H.L. and C.-Y.C.; methodology, S.-P.C., H.-C.T., Y.-C.L. and C.-Y.C.; formal analysis, Y.-C.T. and H.-C.L.; resources, Y.-C.T., H.-C.L. and C.-Y.C.; data curation, S.-P.C., H.-C.T., Y.-C.L. and C.-Y.C.; writing—original draft preparation, Y.-C.T., H.-C.L. and C.-Y.C.; writing—review and editing, C.-Y.C.; supervision, S.-P.C., H.-C.T., Y.-C.L., C.-H.L. and C.-Y.C. All authors have read and agreed to the published version of the manuscript.
Funding
This research received no external funding.
Institutional Consent Statement
Not applicable. The study did not involve humans or animals.
Informed Consent Statement
Not applicable. The study did not involve humans.
Data Availability Statement
Not applicable.
Conflicts of Interest
The authors declare no conflict of interest.
References
- Cause of Death Statistics at Taiwan in 2020. Available online: https://www.mohw.gov.tw/cp-5256-63399-2.html (accessed on 28 March 2022).
- Lin, H.C.; Lai, T.J.; Tseng, H.C.; Wang, C.H.; Tseng, Y.L.; Chen, C.Y. Radiation doses with various body weights of phantom in brain 128-slice MDCT Examination. J. Radiat. Res. 2019, 60, 466–475. [Google Scholar] [CrossRef] [PubMed]
- Alsufayan, M.; Sulieman, A.; Moslem, R.; Asiri, A.; Alomary, A.; Alanazi, B.M.; Aldossari, H.; Alonazi, B.; Bradley, D.A. Assessment of Imaging Protocol and Patients Radiation Exposure in Computed Tomography Colonography. Appl. Sci. 2021, 11, 4761. [Google Scholar] [CrossRef]
- Qurashi, A.A.; Rainford, L.A.; Alhazmi, F.H.; Alshamrani, K.M.; Sulieman, A.; Alsharif, W.M.; Alshoabi, S.A.; Gameraddin, M.B.; Aloufi, K.M.; Aldahery, S.T.; et al. Low Radiation Dose Implications in Obese Abdominal Computed Tomography Imaging. Appl. Sci. 2021, 11, 2456. [Google Scholar] [CrossRef]
- Albano, D.; Loria, A.; Fanciullo, C.; Bruno, A.; Messina, C.; Vecchio, A.; Sconfienza, L.M. Diagnostic Performance and Radiation Dose of the EOS System to Image Enchondromatosis: A Phantom Study. Appl. Sci. 2020, 10, 8941. [Google Scholar] [CrossRef]
- Pan, L.F.; Chang, M.H.; Jong, G.P.; Pan, L.K. Optimization of the Spider View in Coronary Angiography Using Taguchi Method: A Phantom study with Clinical Confirmation. Int. J. Cardiovasc. Imaging 2017, 33, 1287–1295. [Google Scholar] [CrossRef] [PubMed]
- Chen, C.Y.; Pan, L.F.; Chiang, F.T.; Yeh, D.M.; Pan, L.K. Optimizing quality of digital mammographic imaging using Taguchi analysis with an ACR accreditation phantom. Bioengineered 2016, 7, 226–234. [Google Scholar] [CrossRef] [PubMed][Green Version]
- Pan, L.F.; Erdene, E.; Chen, C.C.; Pan, L.K. Optimization of the Imaging Quality of 64-Slice CT Acquisition Protocol Using Taguchi Analysis: A Phantom Study. Biomed. Mater. Eng. 2015, 26, 1651–1658. [Google Scholar] [CrossRef] [PubMed]
- Oh, J.H.; Choi, S.P.; Wee, J.H.; Park, J.H. Inter-scanner variability in Hounsfield unit measured by CT of the brain and effect on gray-to-white matter ratio. Am. J. Emerg. Med. 2019, 37, 680–684. [Google Scholar] [CrossRef] [PubMed]
- Yunker, B.E.; Cordes, D.; Scherzinger, A.L.; Dodd, G.D.; Shandas, R.; Feng, Y.; Hunter, K.S. An investigation of industrial molding compounds for use in 3D ultrasound, MRI, and CT imaging phantoms. Med. Phys. 2013, 40, 052905. [Google Scholar] [CrossRef] [PubMed]
- Brisse, H.J.; Brenot, J.; Pierrat, N.; Gaboriaud, G.; Savignoni, A.; Rycke, T.D.; Neuenschwander, S.; Aubert, B.; Rosenwald, J. The relevance of image quality indices for dose optimization in abdominal multi-detector row CT in children: Experimental assessment with pediatric phantoms. Phys. Med. Biol. 2009, 54, 1871–1892. [Google Scholar] [CrossRef] [PubMed]
- Yoon, S.; Henry, R.W.; Bouley, D.M.; Bennett, N.R.; Fahrig, R. Characterization of a novel anthropomorphic palatinate lung phantom. Med. Phys. 2008, 35, 5934–5943. [Google Scholar] [CrossRef] [PubMed]
- Daisne, J.F.; Sibomana, M.; Bol, A.; Cosnard, G.; Lonneux, M.; Grégoire, V. Evaluation of a multimodality image (CT, MRI and PET) coregistration procedure on phantom and head and neck cancer patients: Accuracy, reproducibility and consistency. Radiother. Oncol. 2003, 69, 237–245. [Google Scholar] [CrossRef] [PubMed]
- Taguchi, G. Introduction to Quality Engineering: Designing Quality into Products and Processes; Asian Productivity Organization: Tokyo, Japan, 1990. [Google Scholar]
- Tseng, H.C.; Liu, W.S.; Huang, H.S.; Lai, W.H.; Changlai, S.P.; Chen, C.Y. Spatial distributions of environmenral radiations at medical linac undergoing treatment of VMAT using Taguchi method. J. Radioanal. Nucl. Chem. 2016, 307, 1635–1639. [Google Scholar] [CrossRef]
- Chen, C.Y.; Liu, K.C.; Chen, H.H.; Pan, L.K. Optimizing the TLD-100 readout system for various radiotherapy beam doses using the Taguchi methodology. Appl. Radiat. Isot. 2010, 68, 481–488. [Google Scholar] [CrossRef] [PubMed]
- Huang, C.K.; Wu, J.; Cheng, K.Y.; Pan, L.K. Optimization of imaging parameters for SPECT scans of [99mTc]TRODAT-1 using Taguchi analysis. PLoS ONE 2015, e0113817. [Google Scholar] [CrossRef] [PubMed]
- Kumar, R.; Kumar, K.; Bhowmik, S. Optimization of mechanical properties of epoxy based wood dust reinforced green composite using Taguchi method. Proc. Mater. Sci. 2014, 5, 688–696. [Google Scholar] [CrossRef]
- Fisher, R.A. Design and Analysis of Experiments; Olive and Boyd: London, UK, 1925. [Google Scholar]
- McCollough, C.H.; Bruesewitz, M.R.; McNitt-Gray, M.F.; Bush, K.; Ruckdeschel, T.; Payne, J.T.; Brink, J.A.; Zeman, R.K. The phantom portion of the American College of Radiology (ACR) computed tomography (CT) accreditation program: Practical tips, artifact examples, and pitfalls to avoid. Med. Phys. 2004, 31, 2423–2442. [Google Scholar] [CrossRef] [PubMed]
- International Commission on Radiological Protection (ICRP). Recommendations of the International Commission on Radiological Protection; ICRP 60 Report; Pergamon Press: Oxford, UK, 1991. [Google Scholar]
- Yeh, D.M.; Tsai, H.Y.; Tyan, Y.S.; Chang, Y.C.; Pan, L.K.; Chen, T.R. The Population Effective Dose of Medical Computed Tomography Examinations in Taiwan for 2013. PLoS ONE 2016, 11, e0165526. [Google Scholar] [CrossRef] [PubMed]
Publisher’s Note: MDPI stays neutral with regard to jurisdictional claims in published maps and institutional affiliations. |
© 2022 by the authors. Licensee MDPI, Basel, Switzerland. This article is an open access article distributed under the terms and conditions of the Creative Commons Attribution (CC BY) license (https://creativecommons.org/licenses/by/4.0/).