Article

Fixed-Bed Adsorption of Phenol onto Microporous Activated Carbon Set from Rice Husk Using Chemical Activation

by
Samah B. Daffalla
1,2,*,
Hilmi Mukhtar
3,
Maizatul S. Shaharun
4 and
Abdalhaleem A. Hassaballa
1
1
Department of Environment and Agricultural Natural Resources, College of Agricultural and Food Sciences, King Faisal University, P.O. Box 400, Al-Ahsa 31982, Saudi Arabia
2
Department of Chemical Engineering, College of Engineering, University of Khartoum, Khartoum P.O. Box 321, Sudan
3
Department of Chemical Engineering, Universiti Teknologi PETRONAS, Tronoh 31750, Malaysia
4
Department of Fundamental and Applied Sciences, Universiti Teknologi PETRONAS, Tronoh 31750, Malaysia
*
Author to whom correspondence should be addressed.
Appl. Sci. 2022, 12(9), 4354; https://doi.org/10.3390/app12094354
Submission received: 23 March 2022 / Revised: 17 April 2022 / Accepted: 20 April 2022 / Published: 25 April 2022
(This article belongs to the Topic Sustainable Environmental Technologies)

Abstract

:
In the course of this research, the potential of activated carbon from rice husk was examined as being a phenol removal medium from an aqueous solution in a fixed-bed adsorption column. The activated carbon was characterized through FESEM (Field-Emission Scanning Electron Microscopy) and BET (Brunauer–Emmett–Teller) surface area. According to the FESEM micrograph and BET surface area, RHAC (rice husk activated carbon) had a porous structure with a large surface area of 587 m2·g−1 and mean diameter of pores of 2.06 nm. The concentration effects on the influent phenol (100–2000 mg·L−1), rate of flow (5–10 mL·min−1), and bed depth (8.5–15.3 cm) were examined. It was found that the capacity of bed adsorption increased according to the increase in the influent concentration and bed depth. However, the capacity of bed adsorption decreased according to the increase in the feed flow rate. The regeneration of activated carbon column using 0.1 M sodium hydroxide was found to be effective with a 75% regeneration efficiency after three regeneration cycles. Data on adsorption were observed to be in line with many well-established models (i.e., Yoon–Nelson and Adams–Bohart, as well as bed depth service time models).

1. Introduction

Phenol is an important industrial pollutant that is toxic and causes severe and long-term impacts on living things. Being exposed to reduced phenol dozes could potentially be problematic, causing conditions like dermatitis, as well as blocking in respiratory system [1,2,3]. Phenol is certainly essential as an environmental investigation medium as it was preferred mostly to use as the contaminant model. Moreover, much information on its devastation as well as removal exists, especially regarding treatment of wastewater [4]. Wastewater from various industrial sectors, for instance coal transformation, oil, petrochemical, pulp, pesticide and pharmaceutical, as well as industries of dye, are considered as the principal phenol and phenol derivatives sources [4,5,6]. Numerous practices were debated throughout previous studies with regard to phenol removal from water and wastewater, for instance microbial retrogression [7], oxidation of chemicals [8,9,10,11], extraction of solvent [12], membrane separation [4,12], and adsorption [13,14]. In most of the pre-mentioned research, adsorption has been commonly-used technology for removing water pollutant [1], and a powerful way of removing contaminants from wastewater. Essentially, the most common adsorbent used for adsorption is commercially produced activated carbon, which is a carbon-rich substance demonstrating a distinct pore composition, significant surface area, and decent structure [3,15]. The surface chemistry and pore structure of activated carbon affect the adsorption process. The porosity of carbonaceous material is considered an important factor in adsorption processes of organic compounds from aqueous solutions. It has been reported that the adsorption capacity of small molecules, such as phenol, on the inner surface of carbon correlates with the content of micropores and BET surface area, while for mesoporous activated carbons, the substituent group in the phenol and nature of the carbon also controlled the phenol adsorption [3,5,15]. Nevertheless, the expensive regeneration value of activated carbon restricts its use; in addition, the carbon’s breakable nature is utilized for the adsorption of organic materials, producing carbon fines [1]. Agricultural, industrial, or municipal waste usage as adsorbents for the production of activated carbon suggest different common values in a way that makes the process more appealing. Furthermore, this kind of waste biomass can be utilized as a carbon precursor in order to study the pollution challenges associated with landfilling of such wastes, and could be a new element for biomass managing industries [3,16]. Many components have already been researched with a view to produce economical activated carbon, like banyan root [3], date pits [16], terminalia arjuna nuts [17], coconut shells [18], palm shells [19], jackfruit peel waste [20], bagasse and rice husk (RH) [21], vetiver roots [22], coconut shell [23], RH [24], sugarcane bagasse [25], Lantana camara [26], and sugar cane bagasse and sunflower seed hull [27].
Rice is among the main foods eaten worldwide. Furthermore, it produces huge waste husk quantities. RH (rice husk) is stated as being the most convenient absorbent for variable pollutants [28,29]. For every 4 tons of rice produced, a generation of 1 ton of waste RH is recorded [30]. RH consists of 32.2% cellulose, 21.4% hemicelluloses, and 21.3% lignin. The cellulose, hemicellulose, and lignin form a very stable matrix structure. The cellulose–lignin matrix burns away due to carbonization, resulting in the formation of high porosity, being full of cavities, and having almost perfect pore shapes [27]. Converting RH into activated carbon could potentially lead to the development of a particularly good adsorbent with a high removal efficiency. Zinc chloride (ZnCl2) is a crucial chemical agent used as an activator. It is powerful dehydration reagent, which supports material carbonaceous decomposition and encourages the aromatization and charring of carbon, thus restraining the creation of tar and increasing the yield of carbon [31]. Numerous researchers have set activated carbon through ZnCl2 activation of many carbonaceous sources [27,31,32,33]. Throughout this study, the phenol adsorption with rice husk activated carbon (RHAC) was examined using adsorption column studies. The crucial design parameters, like flow rate, influent phenol concentration, and bed depth, were evaluated by utilizing a fixed-bed column at laboratory scale. The phenol adsorption development curves were assessed making use of the pre-mentioned stablished models (Yoon–Nelson and Adams–Bohart, along with bed depth service time (BDST)). A model that describes the fixed bed adsorption dynamics was, hence, presented, so that, eventually, a correlation relationship between the model and the investigational figures was examined.

2. Materials and Methods

2.1. Chemicals

The chemicals employed in this study were phenol (with a purity percentage of 99.99%), sodium hydroxide (NaOH), hydrochloric acid (HCl), and ZnCl2. These chemicals were handled and analytically graded by Merck, Darmstadt, Germany.

2.2. Preparation of Chemicals Activated Carbon

The RH utilized for setting up and carbon activation was provided by a field owned by “Pusat Benih Padi Felcra Berhad-FELCRA” Paddy Seed Company located in the state of Perak in Malaysia. The preparation entailed washing the RH many times in distilled water, in order to remove soluble impurities, 24 h drying up on an oven at 105 °C, and then milling and sieving to 125–250 µm size of particles. A chemical activation process using ZnCl2 has also been applied for the raw material activation purpose. In order to decrease ash content within the sample, the RH was pending to reflux with 1 M NaOH solution for 1 h. The used ZnCl2 amount was set to provide ratio of imbibition (activating agent mass: dried RH) of 1:1. A horizontal tubular furnace (model TSH17/75/450-2416-2116) was used to heat the mixture under pure N2 gas at a rate of 10 °C. min−1 to the ultimate carbonization degree of heat, then held for 1 h at a carbonization temperature of 600 °C. The ratio of imbibition and carbonization temperature were selected upon our previous published work [34]. The activated carbon was then washed with 3 M HCl at 23 ± 0.5 °C for an hour. After the acidic solution was drained, the sample was washed with distilled water several times to remove the residual chemicals. The washed sample was then dried at 105 °C for 24 h.

2.3. Activated Carbon Characterization

The formulated adsorbent was characterized by surface area plus the size of pore’s distribution, in terms of porosity as well as morphological structure using EDX (energy dispersive X-ray) and FESEM. In order to identify the organics of the adsorbent, a detailed characterization was carried out using XRD (X-ray diffraction).

2.4. Adsorption Column (Fixed Bed)

Experiments concerning the column were conducted via a glass column (at lab scale) packed with RHAC with a 1.6 cm internal diameter and a 50 cm length. A supportive wool was fixed in the glass and, to ensure a good distribution of the liquid, the column was closed. Further, to obtain a particular adsorbent bed height, the column was stuffed with 5.0, 7.5, and 9.0 g of RHAC (equivalent to 8.50, 12.75, and 15.30 cm of bed depth, respectively). At certain concentrations (100, 400, 700, 1000, and 2000 mg·L−1), phenol solution was thrust downward within the sorbent column at a convenient flow rate (5.0, 7.5, and 10.0 mL·min−1) by a Charles Austen pump (Model CAPEX L3, Byfleet, United Kingdom). The column effluent samples were collected at consistent durations and then evaluated using a chromatography for high performance liquid (HPLC Agilent 1100 series, Waldbronn, Germanysupported with a detecting system based on a diode array (DAD). The tests were achieved at a 23 ± 1 °C without any pH adjustment. All kinetic studies of the column were repeated once more, and then mean values were considered for the analysis.

2.5. Fixed-Bed Column Analysis Breakthrough

The breakthrough time (tb) and the exhaustible time (te) were acquired through applying a measure of the fixed-bed breakthrough curves, when Ct/C0 = 0.1 and Ct/C0 = 0.9, respectively. The ultimate uptake capacity ( q t o t a l , mg) for a specified concentration of the inlet and the rate of flow is equivalent to the acquired under-the-plot area for the concentration of the adsorbed phenol, and can be determined through the following formula [35,36]:
q t o t a l = Q A 1000 = Q 1000 t = 0 t = t t o t a l ( C 0 C e f f ) d t
where Q, A, and t t o t a l represent the flow rate (mL·min−1), the area below the curve, as well as flow total time (min), respectively. C 0 is the concentration of the influent phenol, while C e f f represents the effluent phenol concentration (mg·L−1). The effluent volume (Veff) is computed by Equation (2), as follows [37]:
V e f f = Q × t t o t a l
The column’s equilibrium uptake ( q e q ) (mg·g−1) is described in Equation (3) as being the overall adsorbed phenol volume (qtotal) per each gram of adsorbent (m) at the total flow end time [38], as follows:
q e q = q t o t a l m  

2.6. Desorption Studies

It is crucial to consider the regeneration of the adsorbent material, as it is significant in economic development. The current study was intended to accomplish phenol (adsorbate) elution from an aqueous solution through the use of 0.1 M NaOH, taking into account identical settings of a flow rate of 8 mL·min−1, adsorbent bed height of 8.5 cm used for preloading of adsorbent, and a concentration of phenol feeding of 1000 mg·L−1. After the elution, distilled water was conveyed via the column for bed washing purposes until the wash effluent’s pH settled at nearly 7. The column was loaded once again with a phenol concentration of 1000 mg·L−1 within conformable regeneration conditions. Studies on regeneration of the column, as well as reuse, were applied for three sequences of adsorption–desorption. The efficiency of regeneration was determined by Equation (4), as follows [39]:
R e g e n e r a t i o n   e f f i c i e n c y   ( % ) = ( q e , e x p ) r ( q e ,   e x p   ) o × 100
where ( q e ,   e x p   ) r is the adsorptive capacity of the regenerated column (mg·g−1) and ( q e ,   e x p   ) o is the original capacity of the virgin adsorbent (mg·g−1).

2.7. Adsorption Column Modeling

Various kinetic models with different levels of complexity and accuracy were proposed and reported; they normally predict or describe breakthrough curves of column adsorption studies accurately. In this section, three different adsorption models were studied. Each model was different from the other in terms of type of adsorption isotherm, inclusion or exclusion of chemical reaction, significant or negligible mass transfer resistance, chemical reaction kinetics, and the type of rate law used if nonequilibrium is assumed [35,40]. The governing equations for each model are presented.

2.7.1. Model of Yoon–Nelson

The Yoon–Nelson model is based on the assumption that the rate of decrease in the probability of adsorption of adsorbate molecule is proportional to the probability of the adsorbate adsorption and the adsorbate breakthrough on the adsorbent. The Yoon and Nelson model is not only less complicated than other models, but also requires no detailed data concerning the characteristics of adsorbate, type of adsorbent, and the physical properties of the adsorption bed [37]. The Yoon–Nelson equation’s linear expression for a sole constituent can be shown in Equation (5), as follows [37]:
l n   ( C e f f C 0 C e f f ) = k Y N   t τ   k Y N
where k Y N   represents a constant for the rate (given in min−1) in addition to τ , which is the time, required for 50% adsorbate development (given in min).

2.7.2. Model of Adams–Bohart

The model of Adams–Bohart is certainly an experimental formula constructed upon the supposition that the adsorption rate is relative to the capacity of the adsorbent’s residual, and the adsorbate concentration. Often, such model is utilized to highlight the early phase of adsorption within the breakout curve. The expression is given as Equation (6), as follows [37]:
l n   ( C e f f C 0 ) = k A B   C 0   t k A B   N 0   Z V
where kAB stands for the kinetic constant (L·mg−1·min−1), N0 presents the concentration of saturation (mg·L−1), Z represents the column bed depth (cm), and V is the linear velocity, which is determined as (flow rate/column’s e section area (cm·min−1)).

2.7.3. BDST Model

The model of BDST depends physically on measuring the bed capacity at several values of breakthrough. This basic model disregards the resistant mass transfer of the intra-particles, as well as the external film resistance so that the adsorbate is adsorbed directly onto the surface of adsorbent. Considering such hypothesis, the model of BDST properly achieves and yields worthwhile modeling formulae for system parameters change. An altered version of the formula that indicates the service time at breakthrough (t) as being a static function concerning the process elements is the model of BDST [35,40,41]. The model of BDST is illustrated by Equation (7), as following:
t = N 0 C 0 V Z 1 C 0 K   ln ( C 0 C b 1 )
where t represents the column’s service time (h), N 0 represents the adsorption capacity (mg·L−1), V represents the linear velocity of flow for the bed feed (cm·h−1), K represents a constant value for adsorption rate (L·mg−1·h−1), and Cb represents the desired concentration of solute at breakthrough (ultimate acceptable limit concentration, mg·L−1). The BDST formula was effectively applied to characterize the adsorption of heavy metals using phosphate-treated RH [41] and copper ions on RH [35]. The formula of the Adams–Bohart equation, given in Equation (7), could be applied to determine the column’s service time (t) of a bed depth Z having the values of N 0 , C0, and K, which, essentially, can be assessed for laboratory columns operated over a range of velocity values (V). Applying t = 0 while solving Equation (8) for Z produces the following equation:
Z 0 = V K N 0   ln ( C 0 C b 1 )
where Z 0 represents the least height of column required to output the effluent concentration Cb, which is, moreover, recognized as the critical depth of bed. A basic form of the BDST model is given as below:
t = a Z + b
where
a = s l o p e = N 0 C 0 V
and
b = i n t e r c e p t = 1 C 0 K   ln ( C 0 C b 1 )
With the view to associate the isotherm cogency with kinetic formula more definitely, the mean percent error (APE) with a base on the differences among the investigational data, plus the model’s generated data will be applied through Equation (12), as follows [42]:
A P E   ( % ) = i = 1 N | ( A e x p A c a l ) / A e x p | N × 100
in which Aexp and Acal present the experimental, as well as determined, amounts, respectively, while N is data point’s number.

3. Results

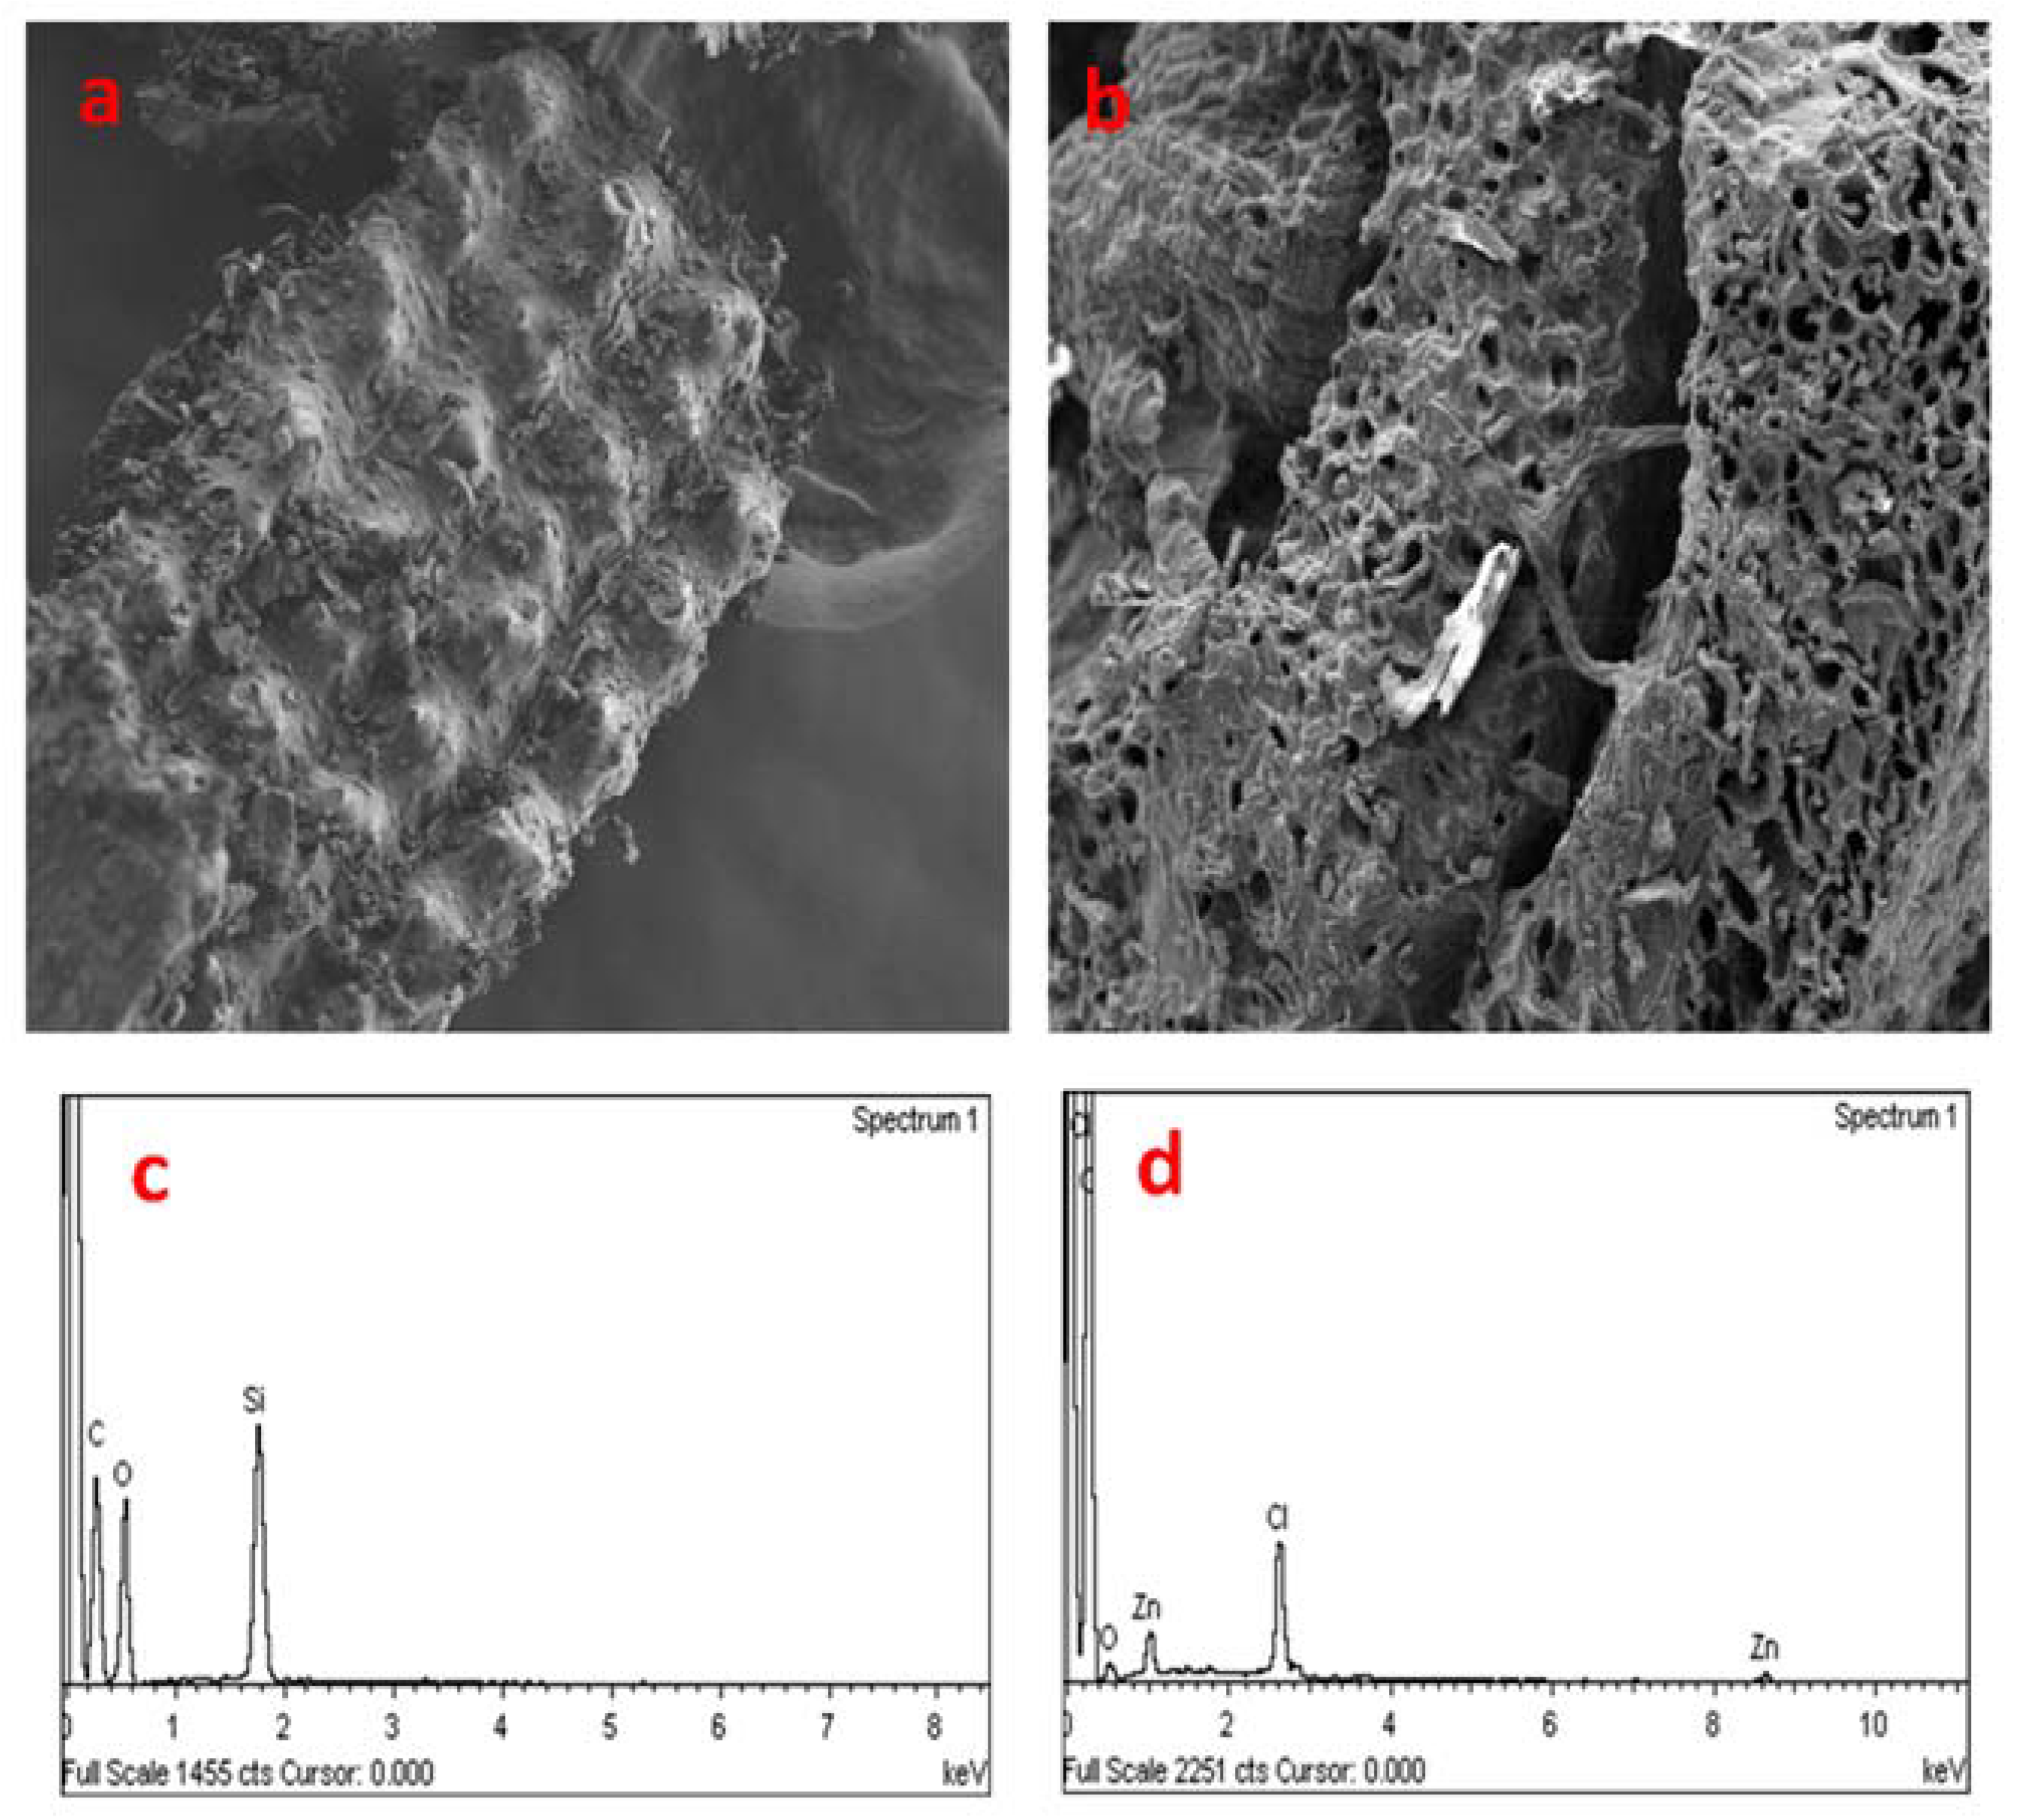
3.1. Physical Morphology of the Surface

The FESEM procedure was followed in order to examine the physical morphology of the surface for RH, as well as the sample of activated carbon. Figure 1a–d summarizes the FESEM/EDX mapping of the adsorbents. There were substantial variations between the RH surface morphology and the sample of activated carbon. The morphological aspects of the RH external epidermis presented an efficient arrangement that bears a resemblance to rolling hills, and is porosity-free (Figure 1a), while the activated carbon sample’s surface was completely occupied by cavities, as porous structures were formed after chemical activation (Figure 1b).
Figure 1c,d shows the EDX images of the RH and RHAC. The EDX analysis demonstrated that C, O, Cl, and Zn were the only four elements observed on the surface of RHAC, with contents of 94.16%, 3.92%, 1.50%, and 0.41% (atomic percentage), respectively, and respective corresponding mass percentages of 88.78%, 4.93%, 4.17%, and 2.12%. The C, O, and Si contents within the RH were 58.89%, 34.98%, and 6.13% (atomic percentage), respectively, demonstrating respective equivalent mass percentages of 49.15%, 38.89%, and 11.96% (Figure 1c). To acquire a better perception of the textural properties of these adsorbents, and the size of pores, as well as surface area distribution, analyses were conducted.

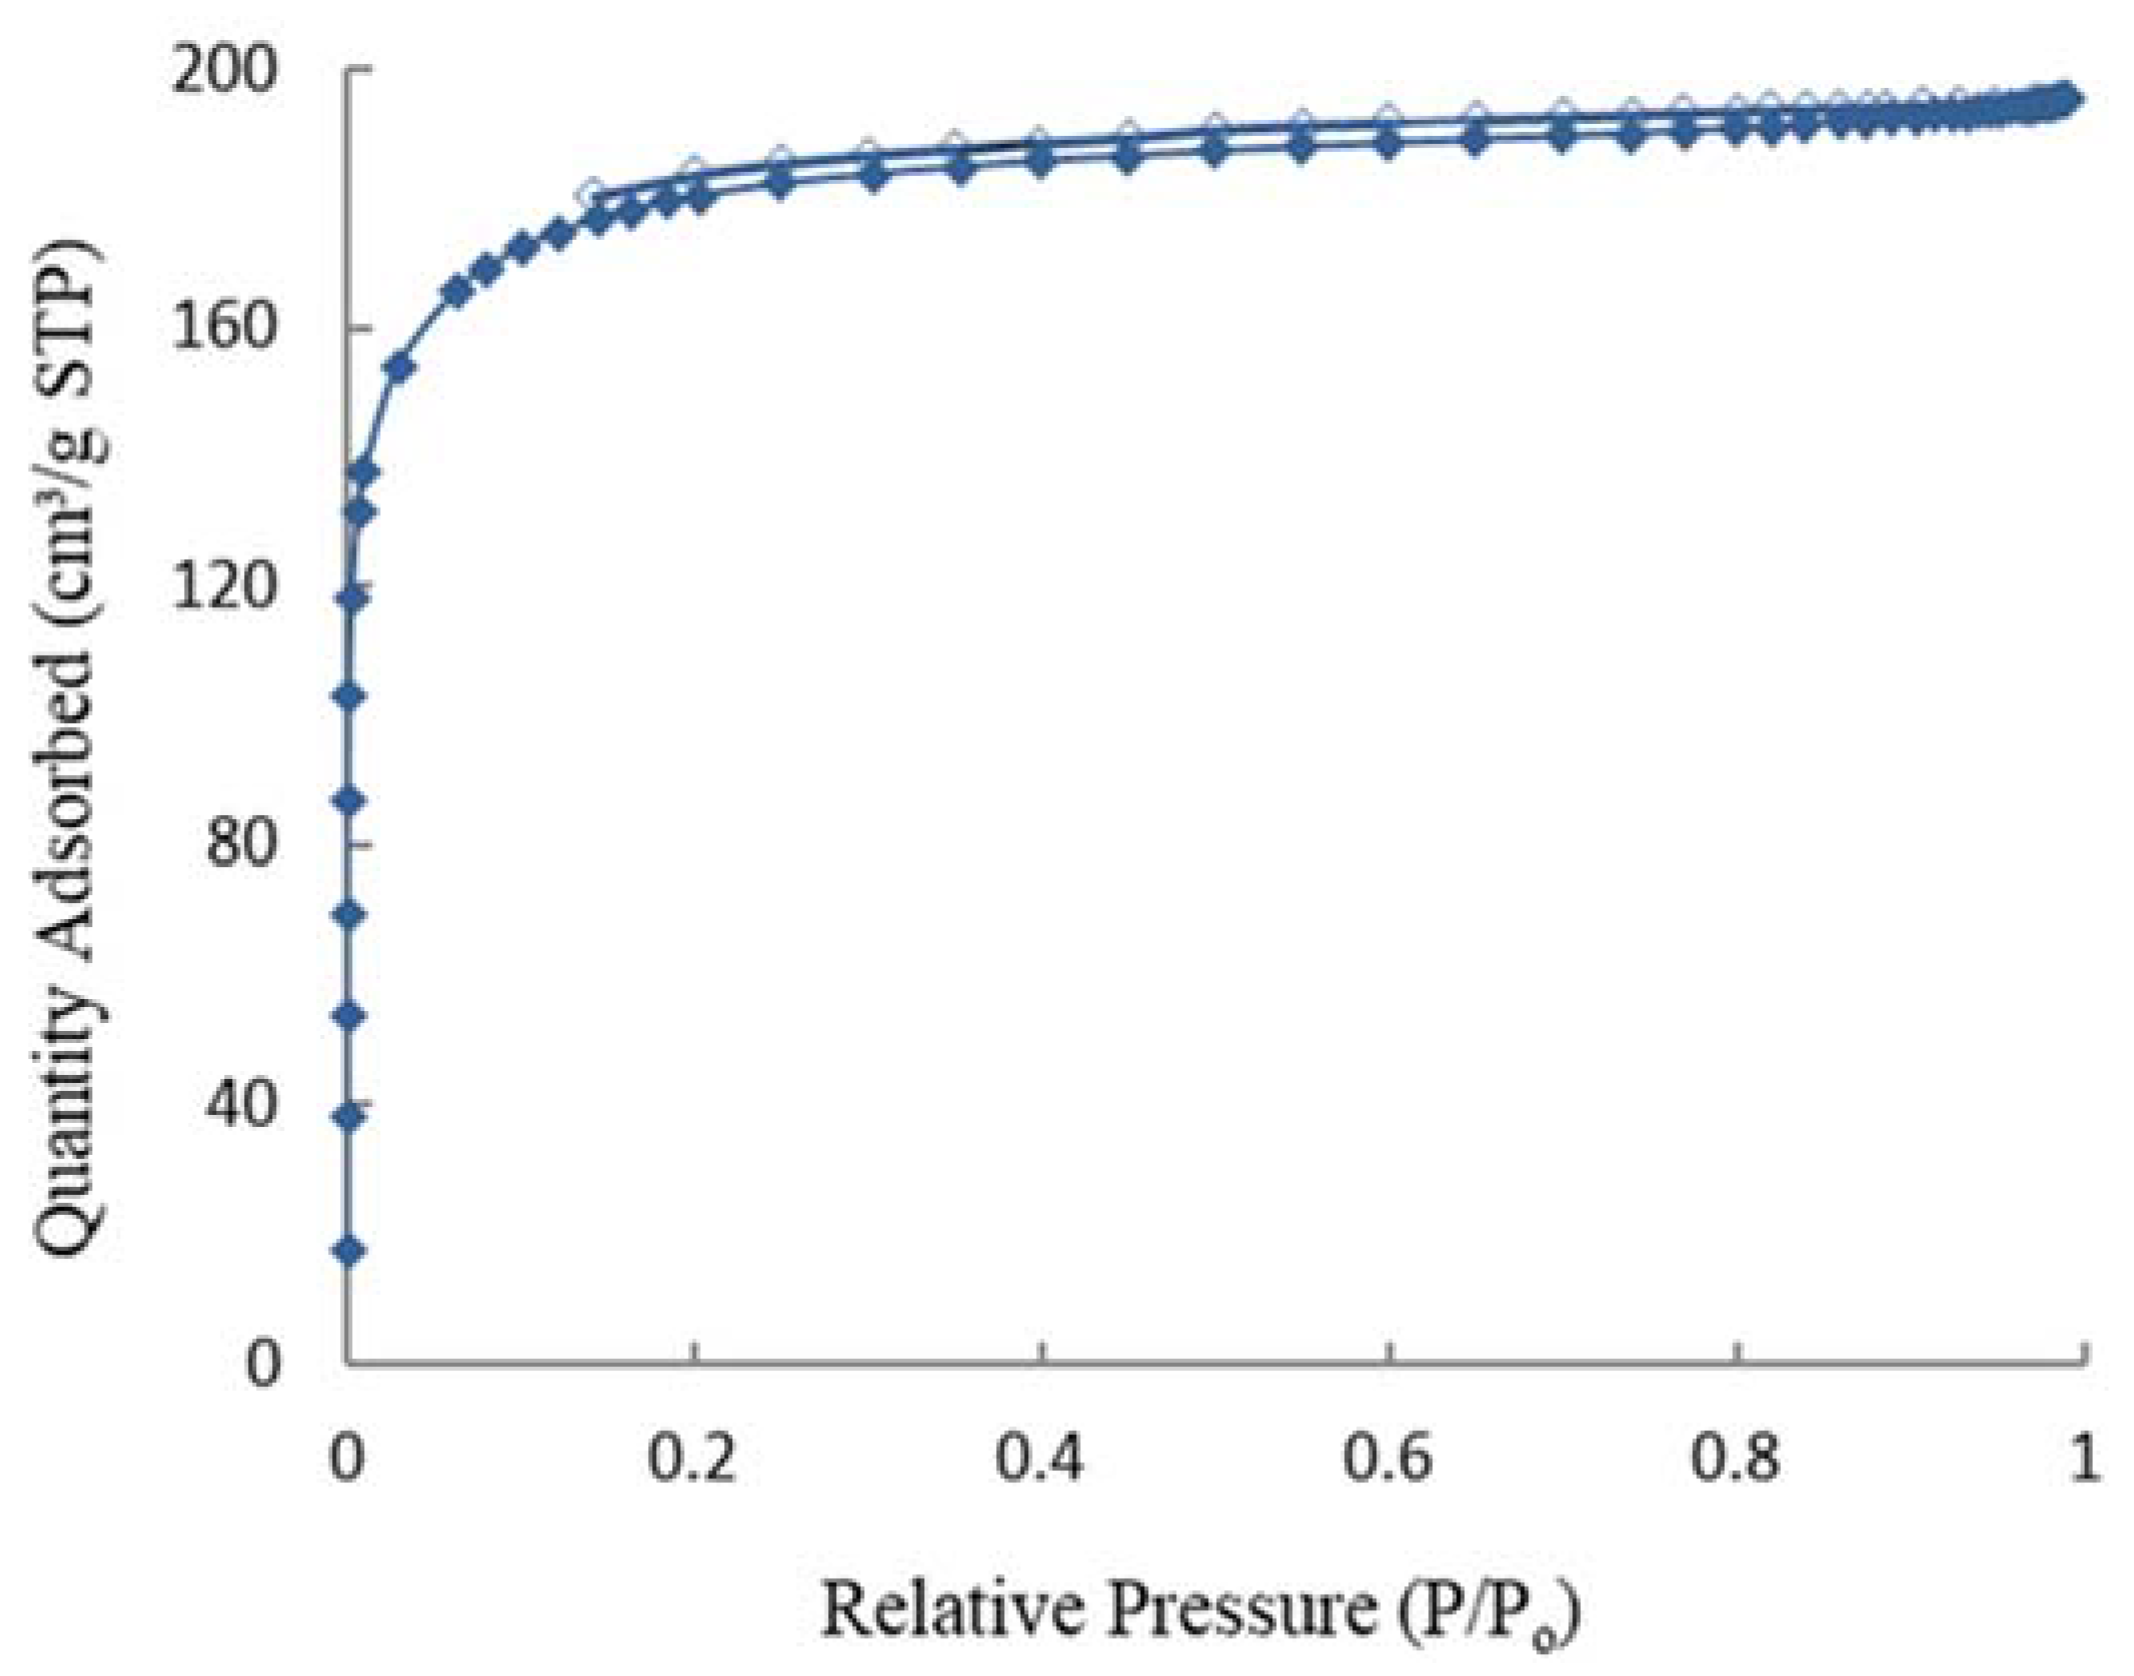
3.2. Isotherms of Nitrogen Adsorption and Physical Properties

The surface area of BET, volume of pores, diameter of pores, and microporosity of the RH and RHAC are tabulated (Table 1). The resultant surface area produced by RH was small, whereas the RHAC had a large surface area owing to its highly developed microporous structure. The surface area of the RH increased by approximately 82.2 times from 7.14 m2·g−1 to 586.59 m2·g−1. The RHAC had high microporosity of 67.6% with a pore diameter of 2.06 nm, which produced an effective microporous adsorbent. This adsorbent’s morphology also exhibited that it was porous (Figure 2).
The observed surface area expansion of the BET was a result of micro-pores presence, as demonstrated by the adsorption escalation at little relative pressures (P/P0 less than 0.1), as appears in the nitrogen isotherm for the adsorption–desorption shown in Figure 2. In accordance with the International Union of Pure and Applied Chemistry classification [43], the RHAC adsorbent exhibited type I, which is a typical microporous configurations in which the ultimate adsorption is realized at relative pressures (P/P0) near to unity.

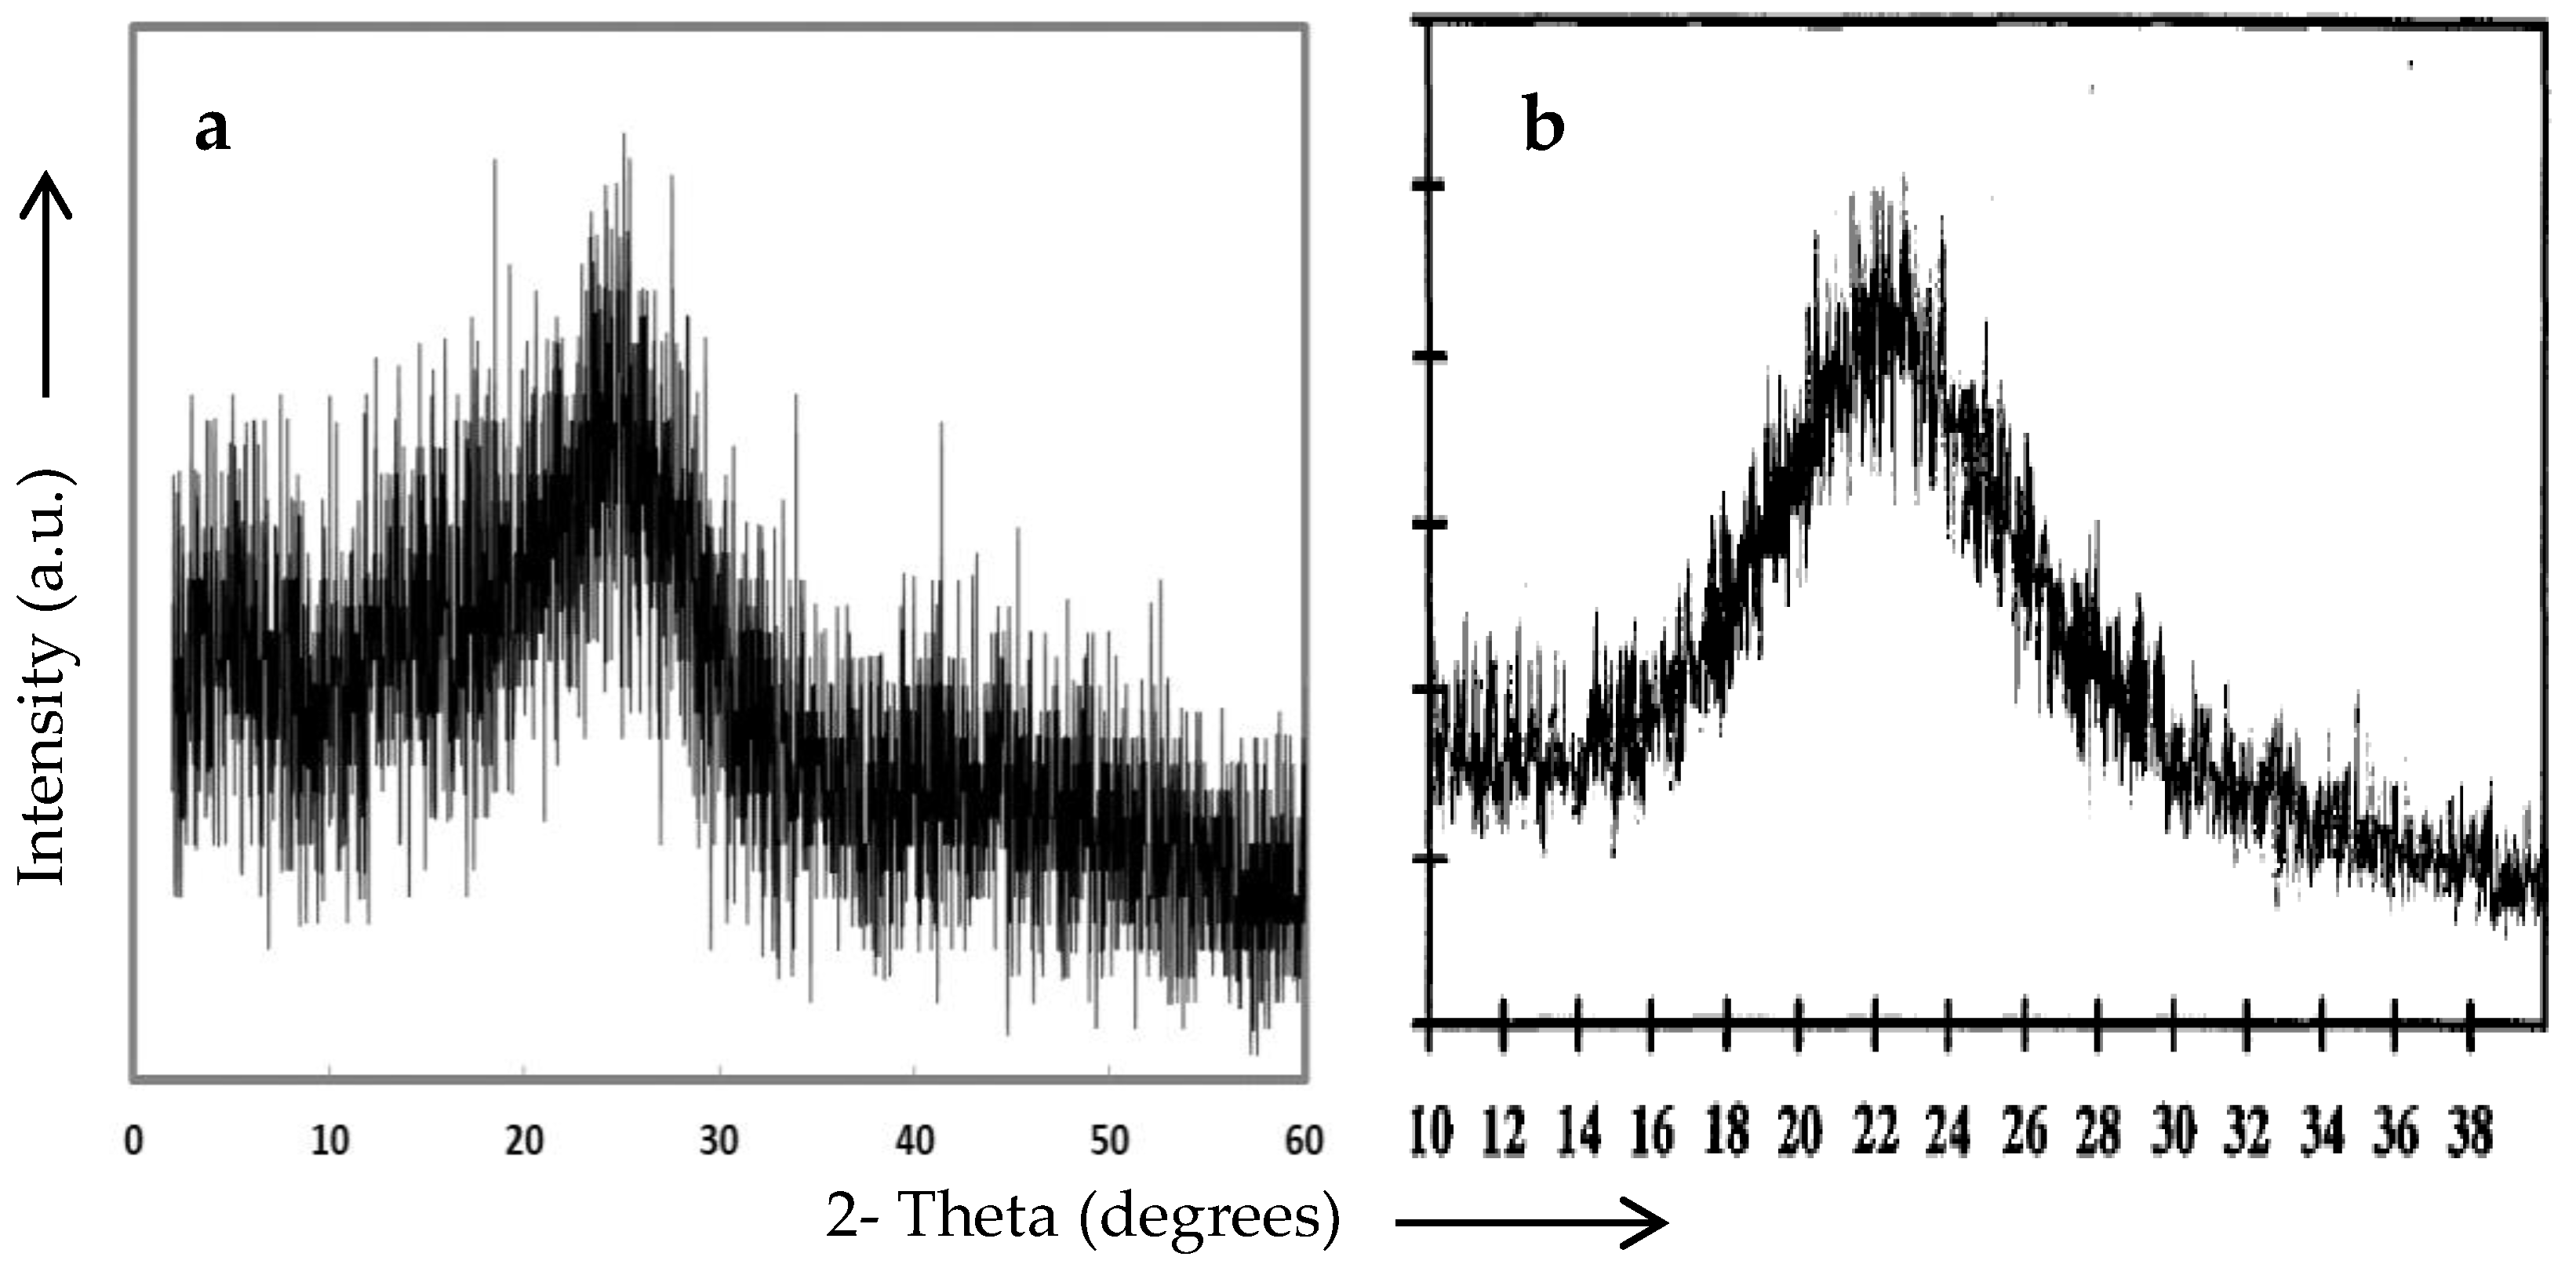
3.3. Identification and Structural Analysis of Rice Husk Activated Carbon

The X-ray diffraction of the RHAC is shown in Figure 3a. From this figure it was found that the X-ray diffraction patterns of the RHAC show a broad ‘hump’ between 15 and 35 °θ diffraction angles, while lacking any defined peaks. This pattern is similar to the X-ray diffraction pattern of silicic acid (Figure 3b) reported by Nakbanpote et al. [44]. This suggests that the organics of this sample is characteristic of amorphous silica, which cannot be detected by X-ray diffraction. The results indicated that for the RHAC, the structure of silicon dioxide did not change from an amorphous structure to a crystalline structure, such as quartz, critobalite, or tridrimite.

3.4. Studies of Fixed-Bed Column

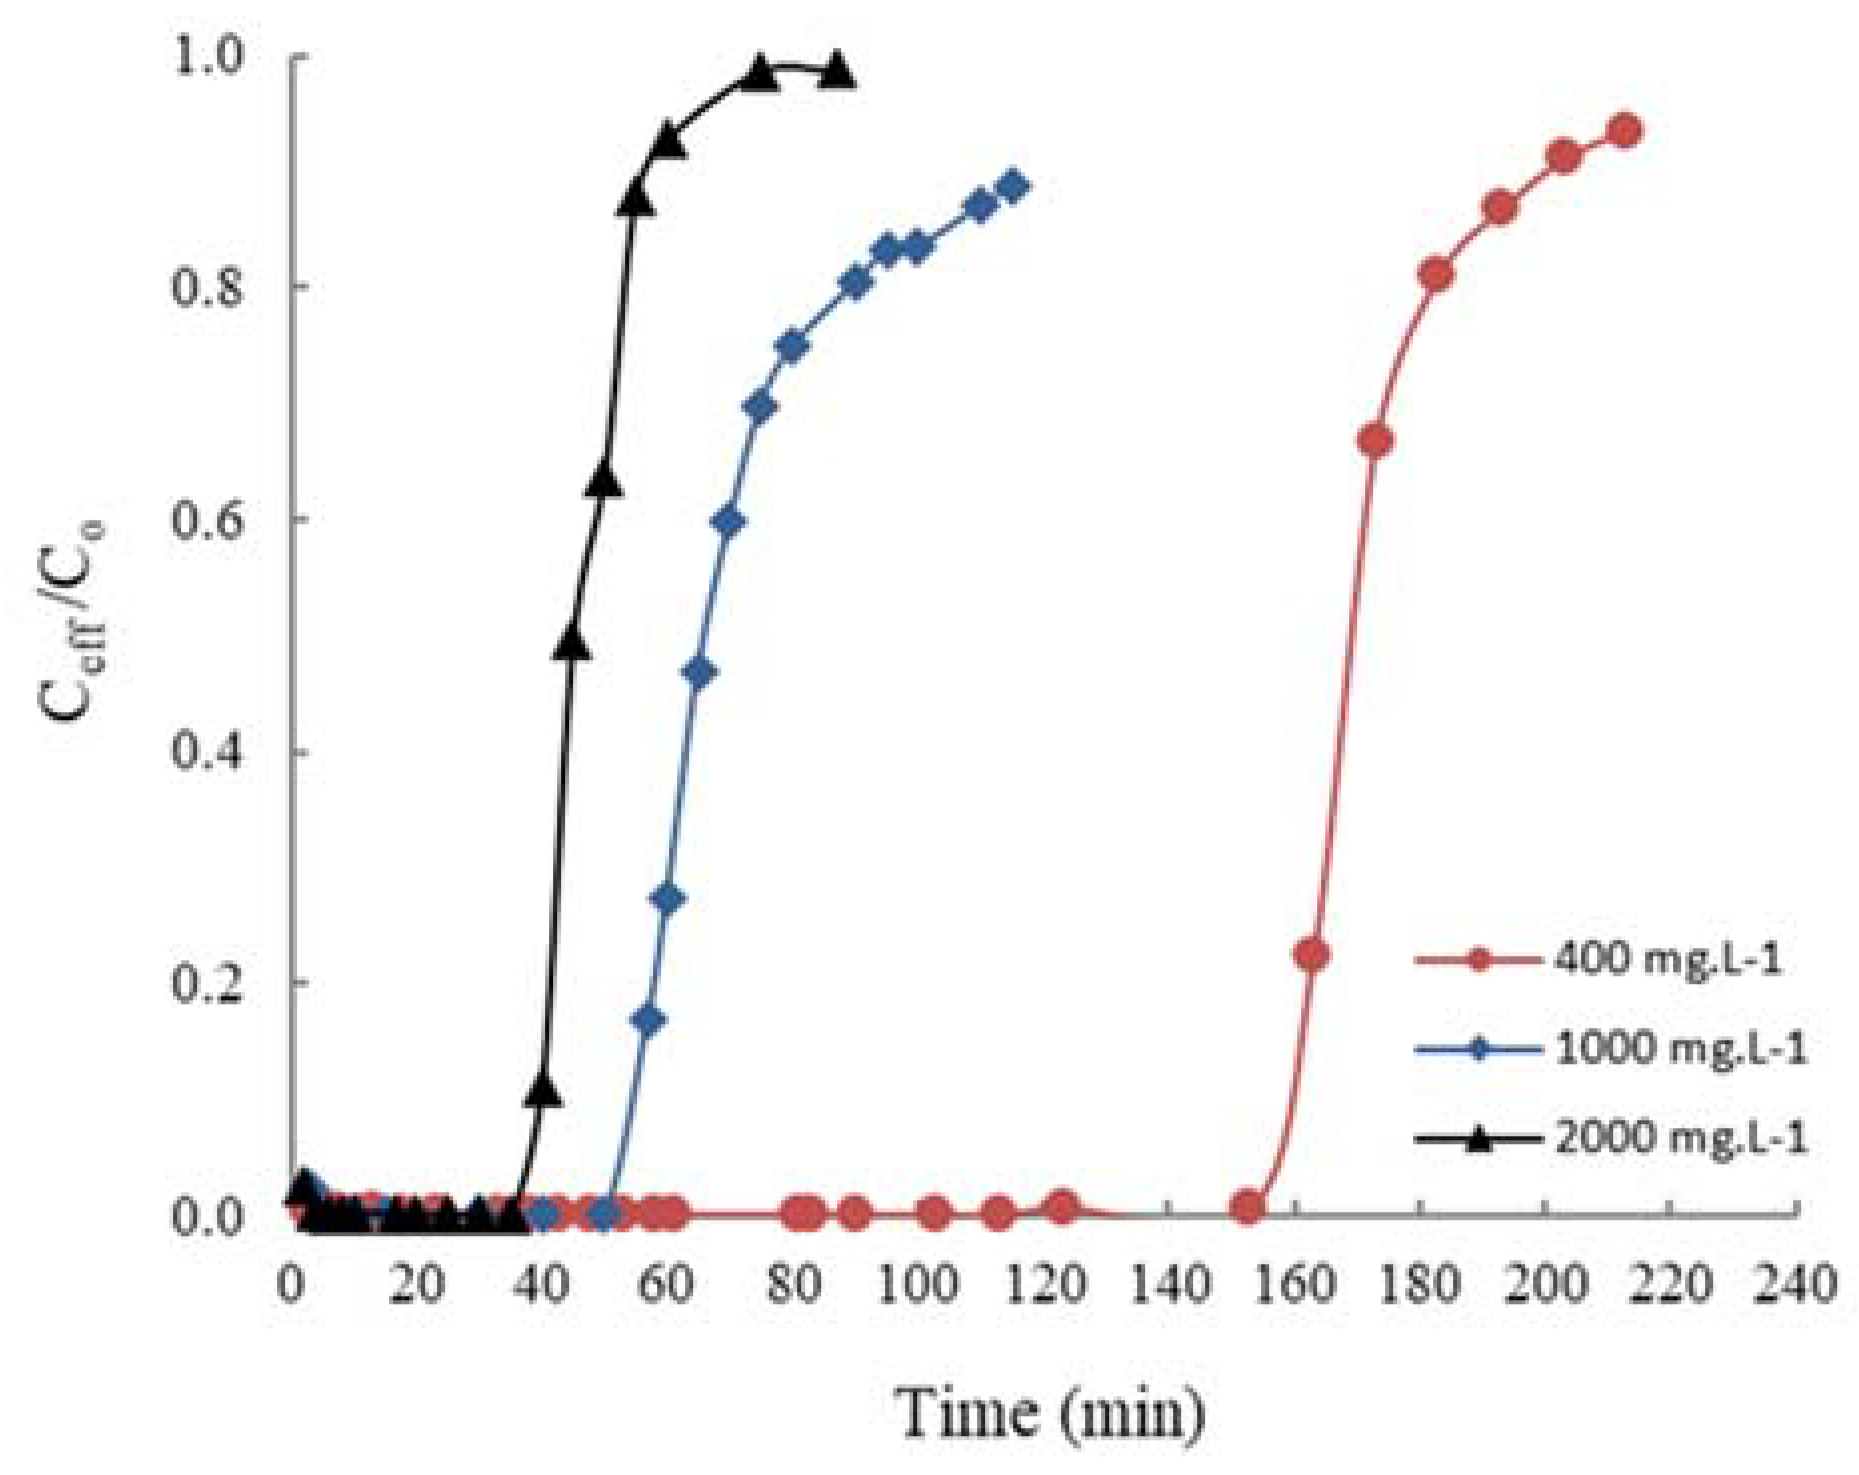
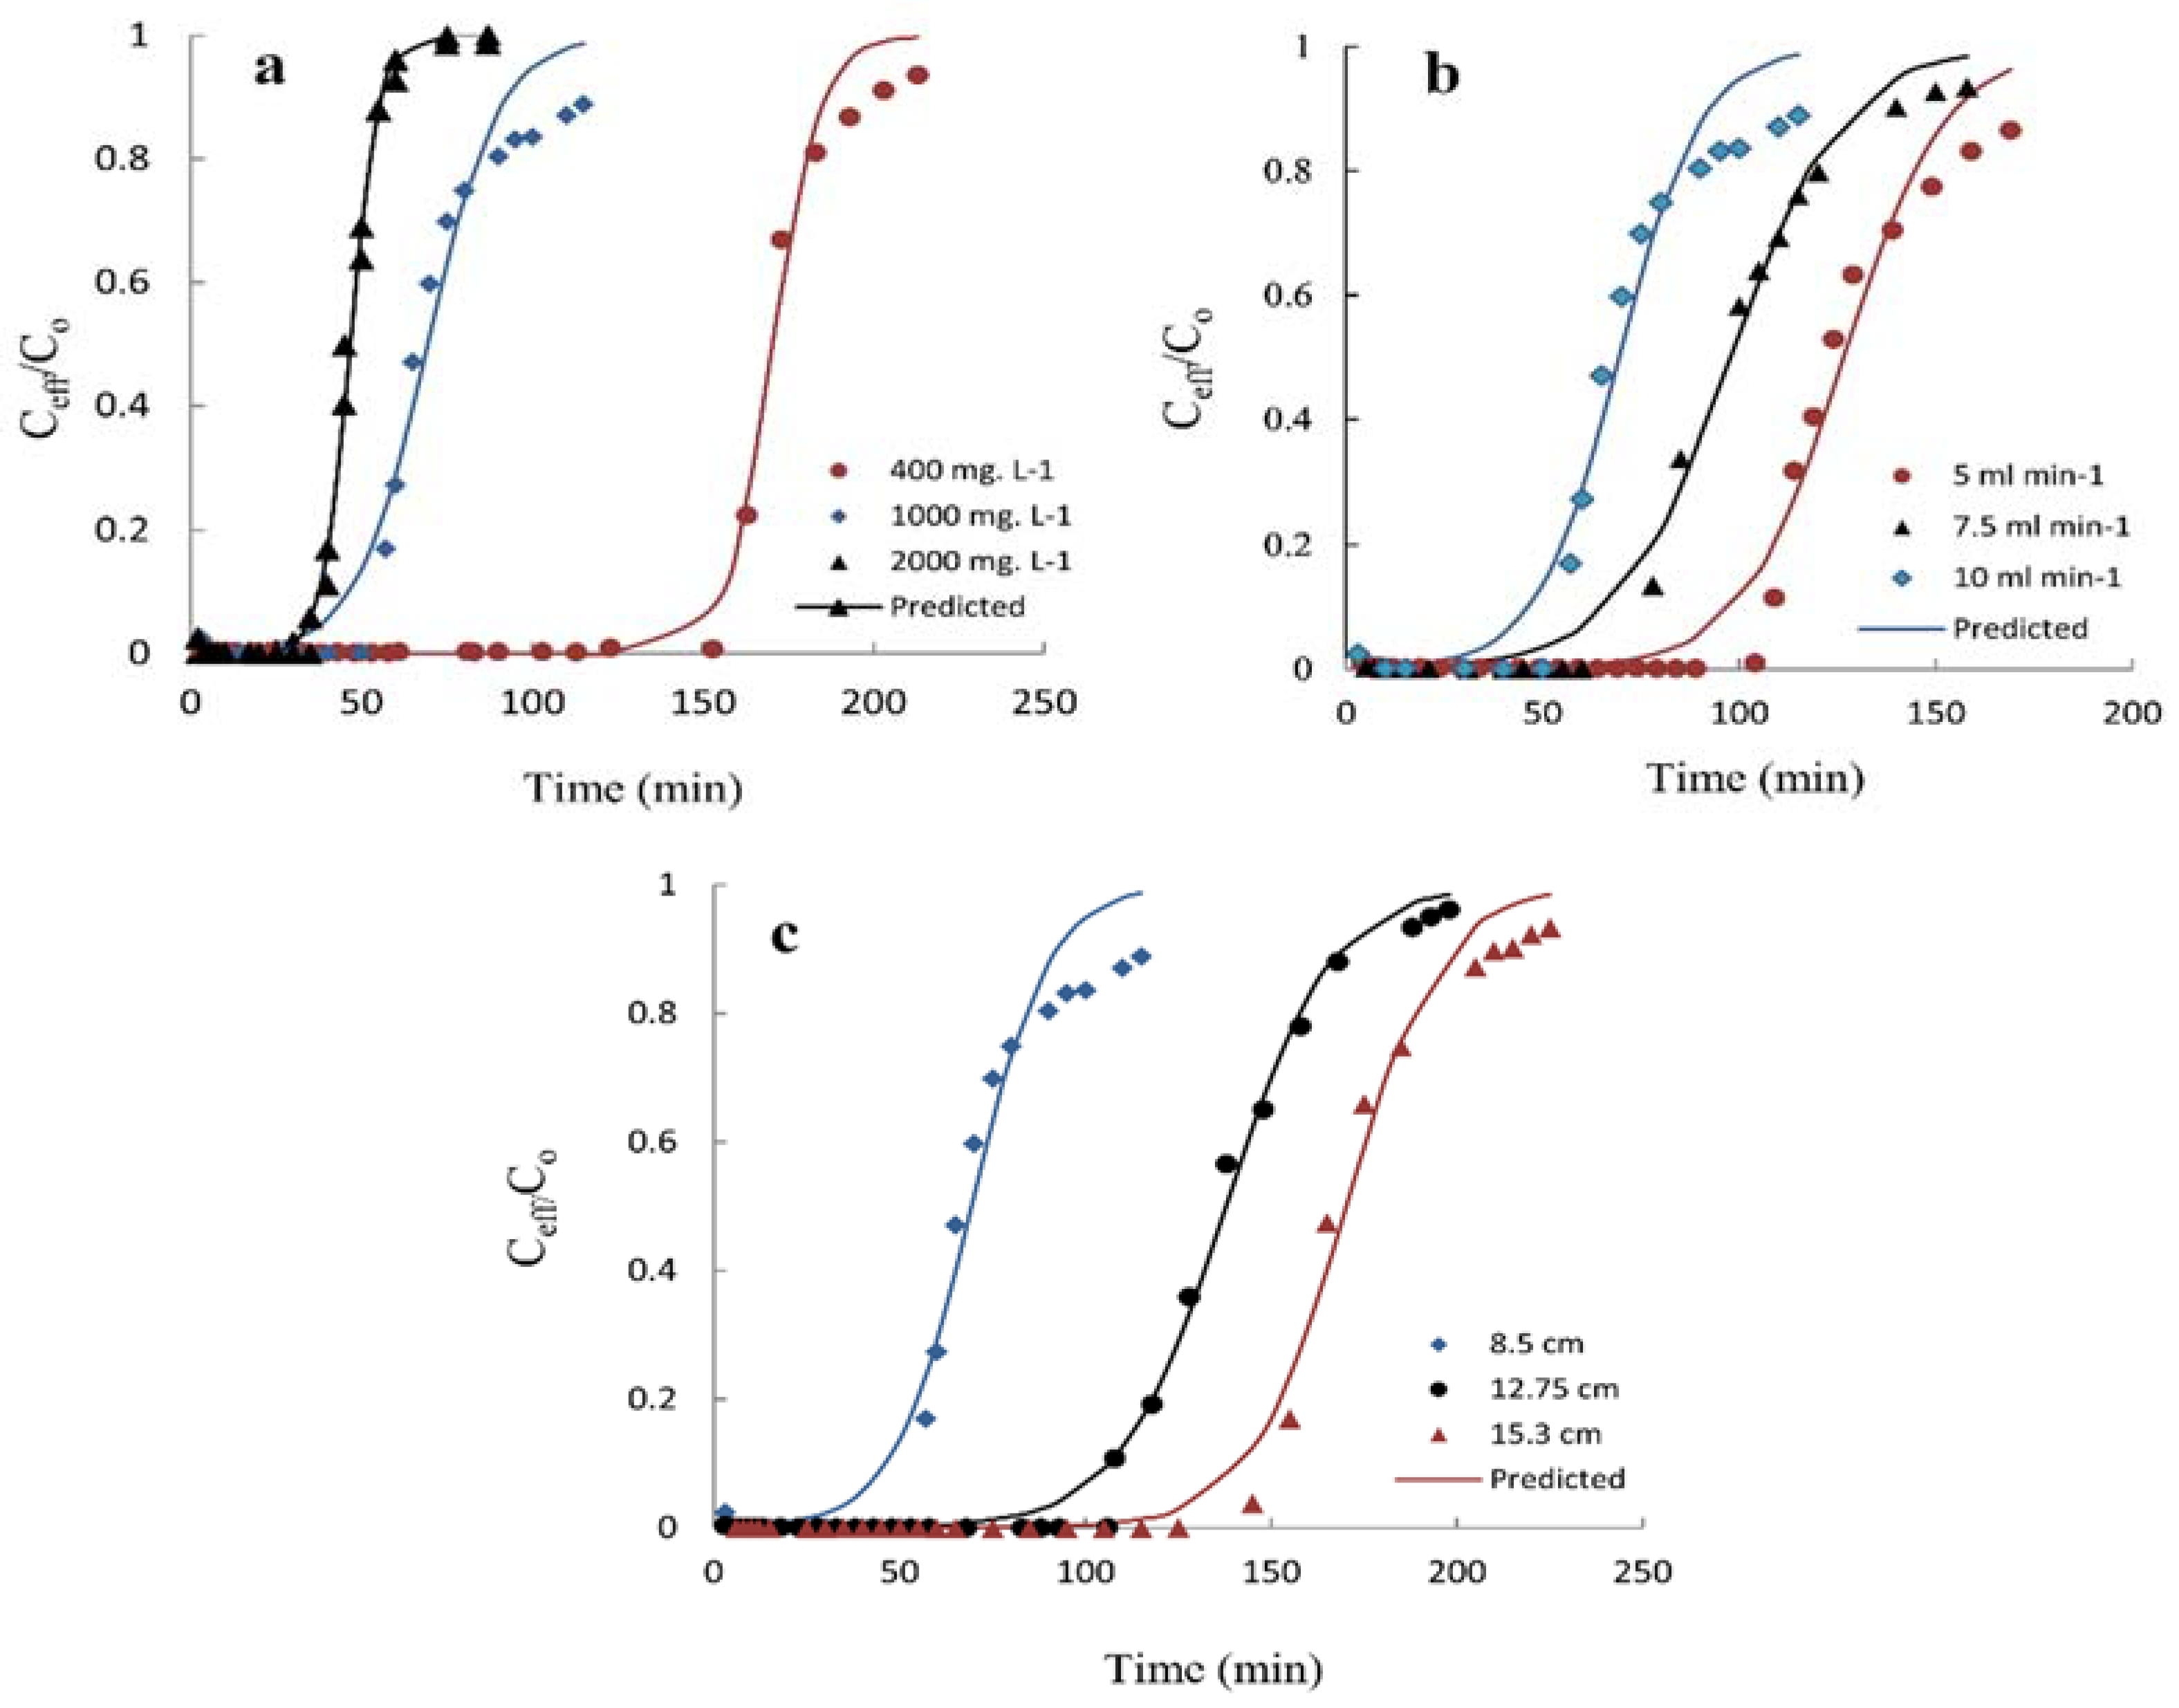
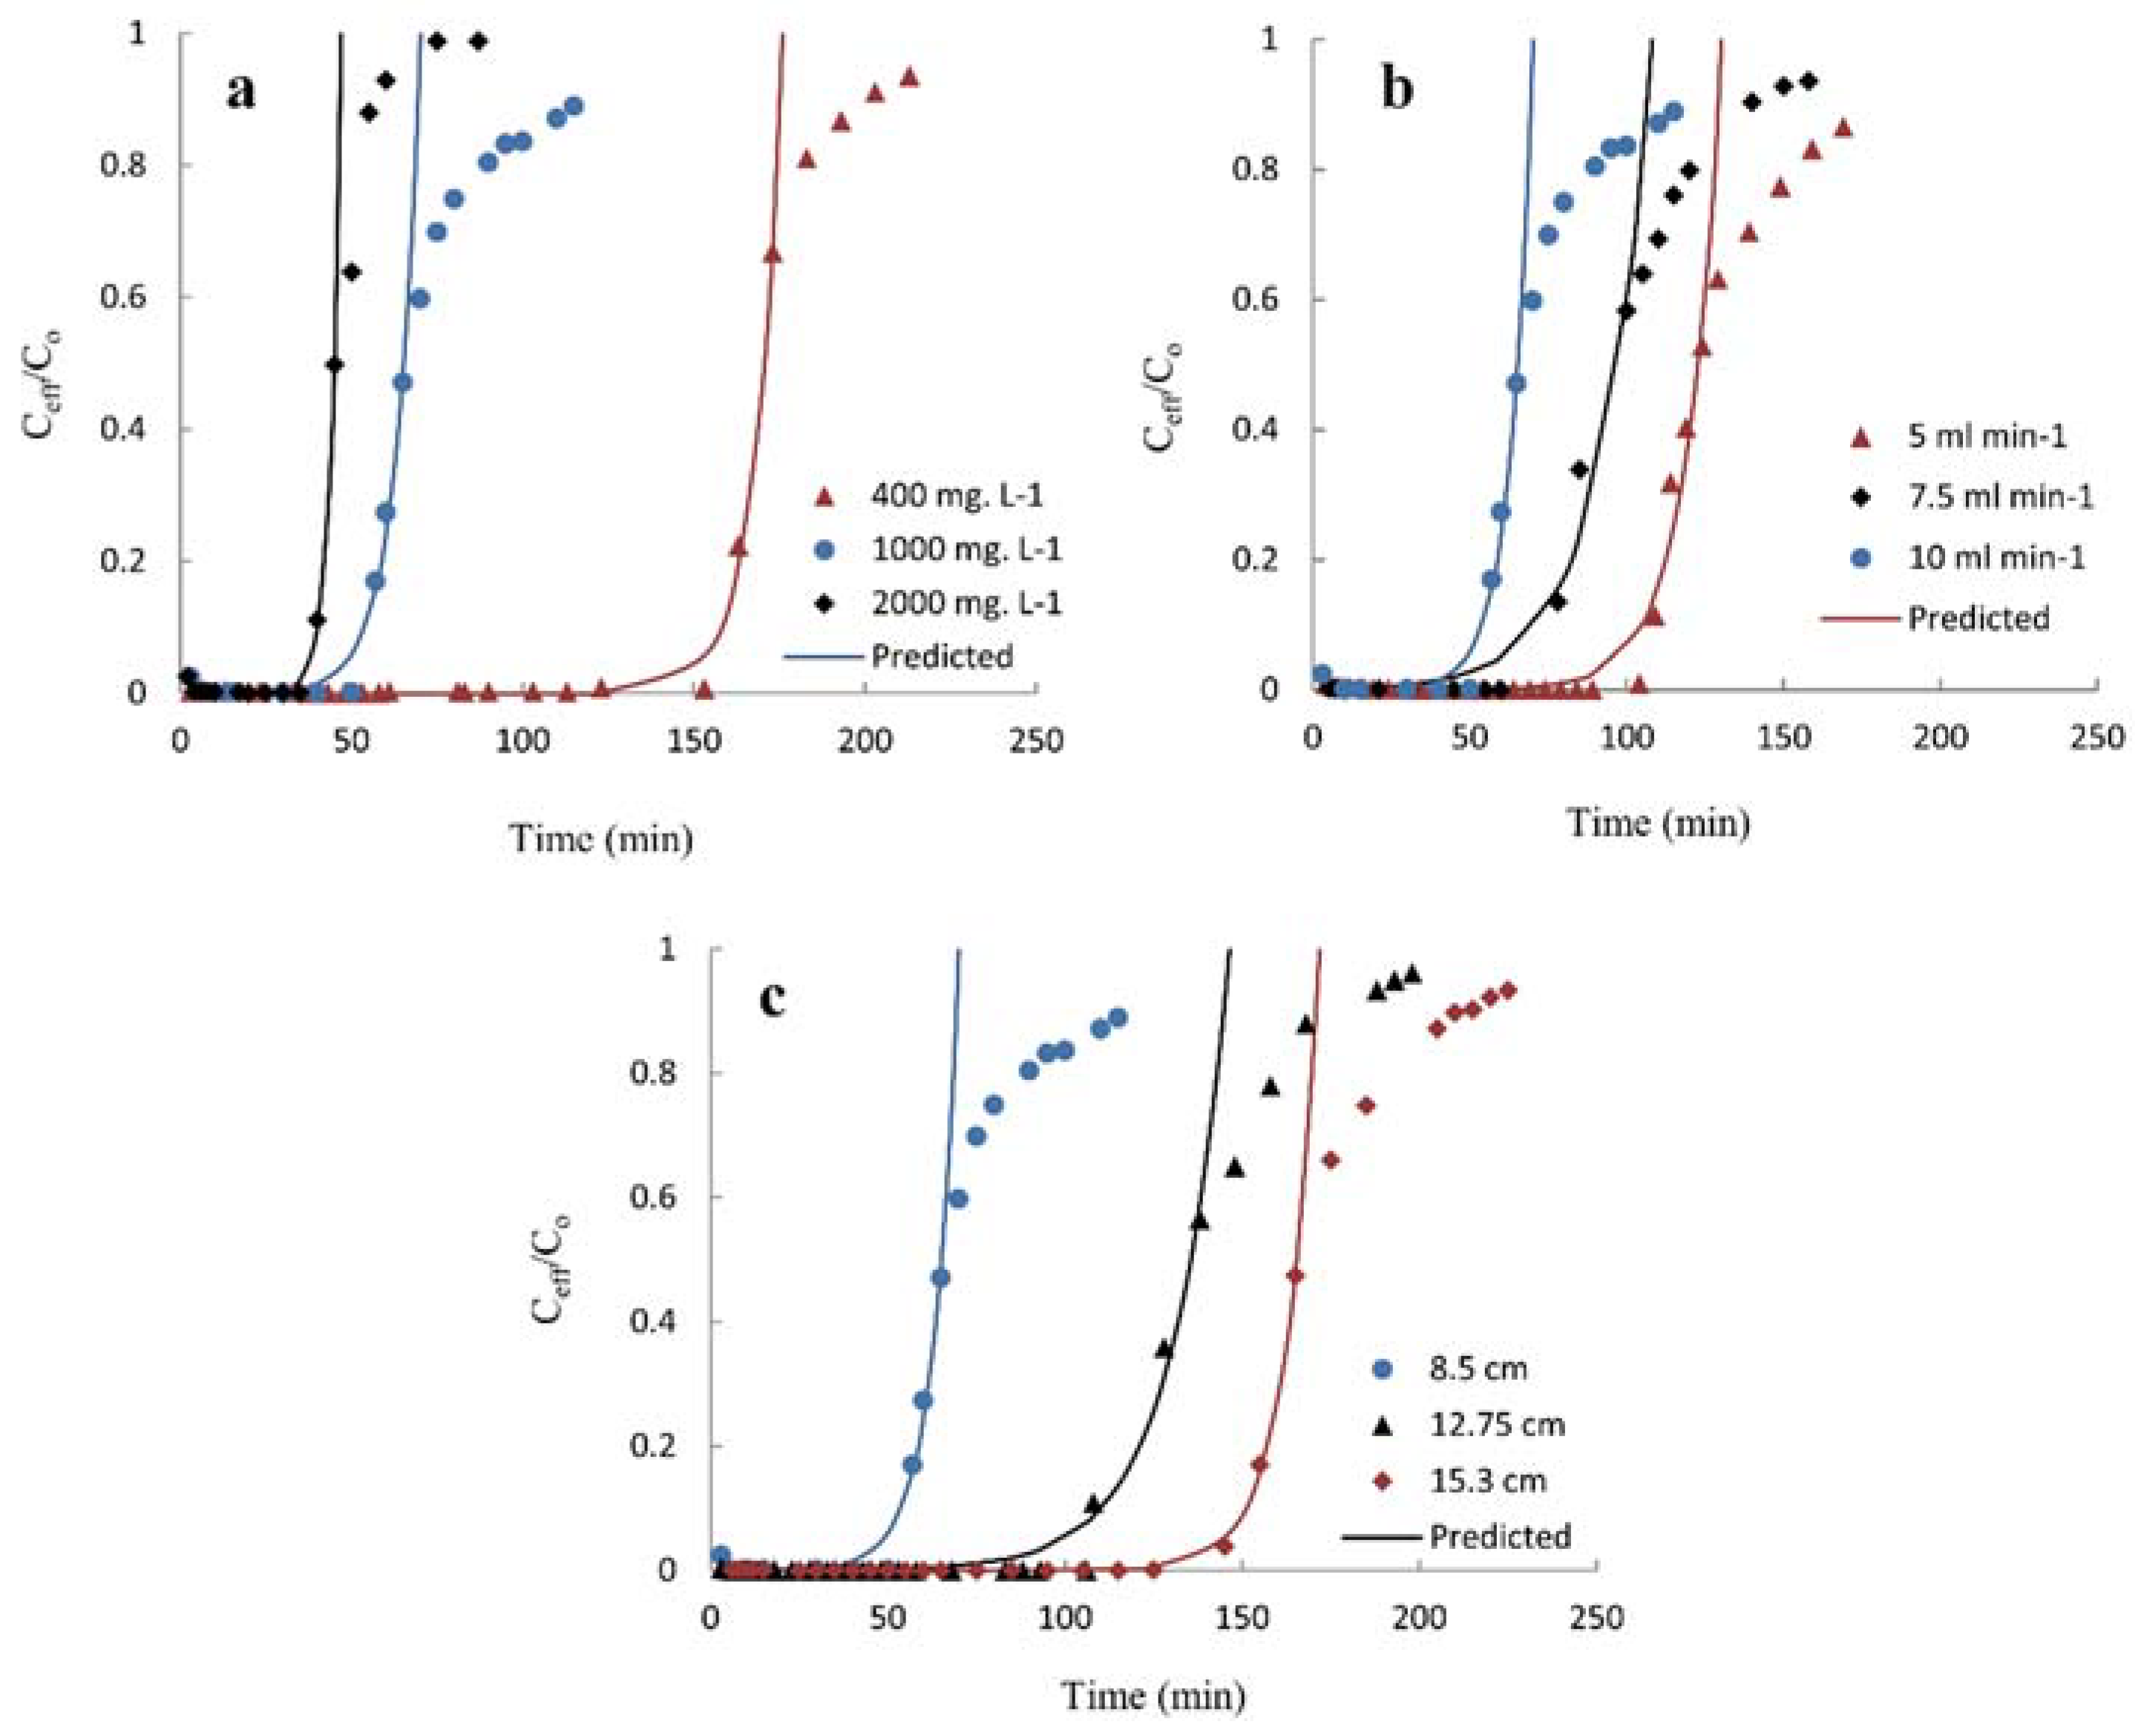
3.4.1. Concentration Effect of the Influent Phenol on the Curve of Breakthrough

The breakthrough curves at variable concentrations of influent phenol are presented in Figure 4. It was revealed that the process of adsorption rapidly reached the stage of saturation and the breakthrough time deteriorated according to the increase in the concentration of influent phenol. The influent phenol concentration’s increase caused a shorter breakthrough along with higher adsorption capacity. Table 2 shows that the time for breakthrough decreased from 153 min to 35 min, whereas the equilibrium uptake (qeq) increased from 17.49 mg·g−1 to 45.75 mg·g−1 as the inlet concentration increased from 400 mg·L−1 to 2000 mg·L−1. This occurred because, at lesser inlet phenol concentrations, curves of breakthrough scattered; hence, a slower breakthrough occurred. Sharper curves of breakthrough were observed once the influent concentration has boosted [45]. Additionally, a minor concentration gradient produced gentler conveyance owing to the diffusion coefficient’s reduction or the coefficients of mass transfer. As the concentration of inlet elevated, the breakthrough curve’s slopes and shorter times are obtained [45,46].

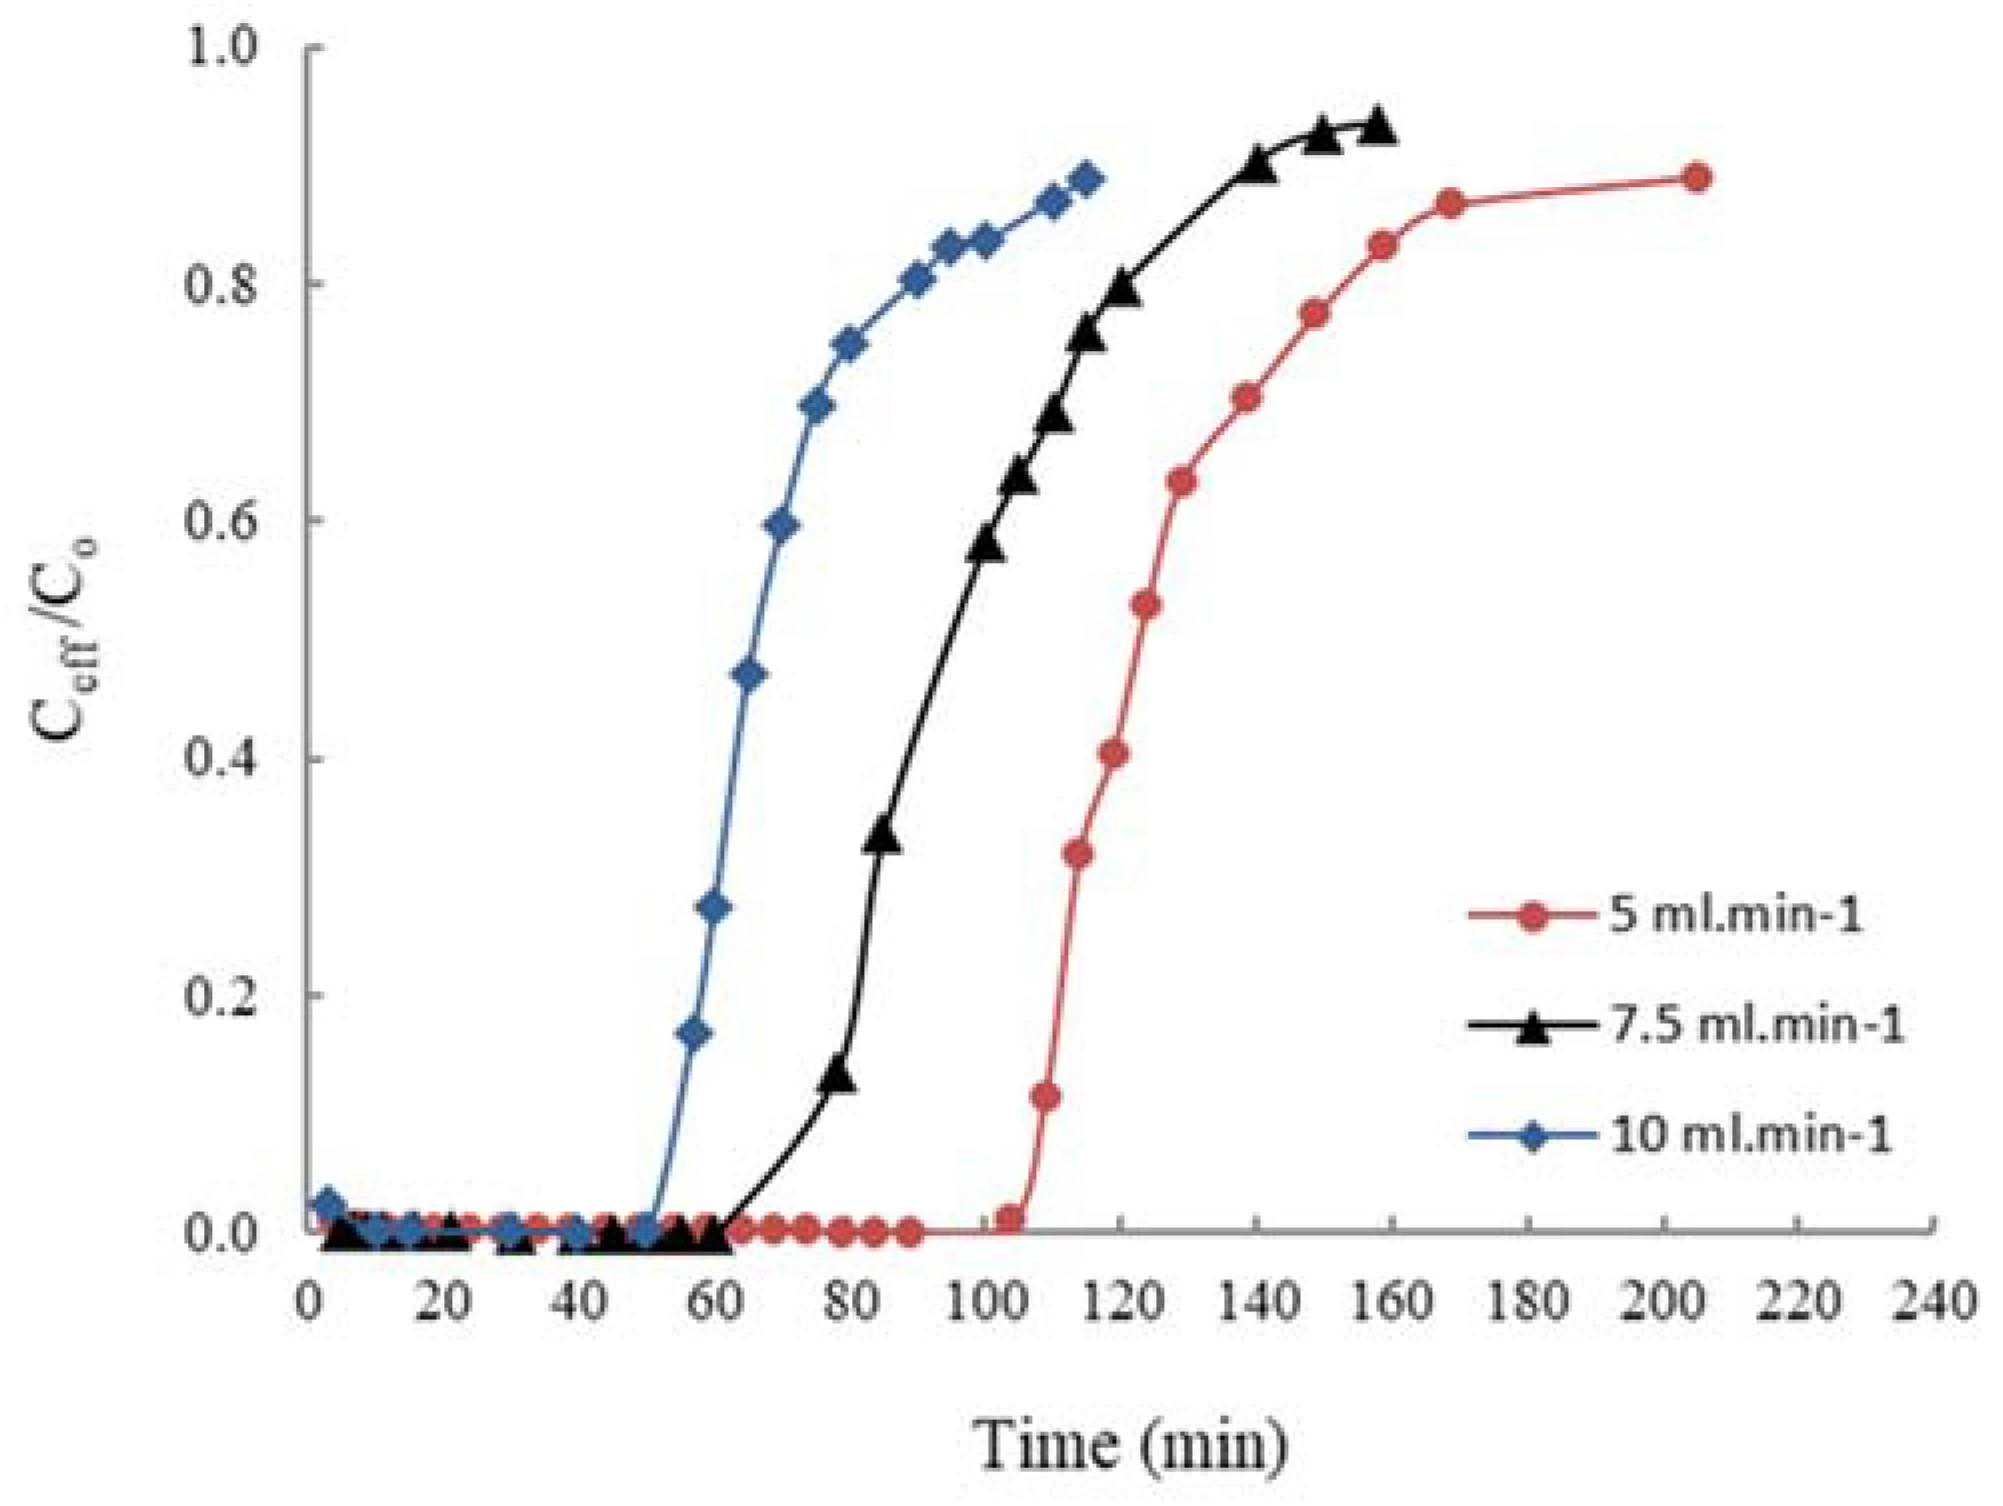
3.4.2. The Rate of Flow Effect

The curves of breakthrough at different phenol’s rates of flow are demonstrated in Figure 5. Breakthrough occurred faster as the flow rate increased. The breakthrough time and qeq decreased from 84 min to 40 min and from 30.41 mg·g−1 to 22.17 mg·g−1, as the rate of flow increased from 5 mL/min to 10 mL/min−1, respectively (Table 2). At a low influent rate of flow, phenol required more time to connect with RHAC, thereby causing a higher capacity of adsorption within the column. Nevertheless, the adsorbent at a higher linear rate of flow was saturated early; due to the minimized time of contact, a huge volume of phenol was adsorbed onto the adsorbent. Hence, there was a mis-distributed liquid into the column, which led to a decreased solute diffusivity amongst the absorbent’s constituent parts [35,40]. Moreover, the reason was due to the reduction of external mass transfer as a result of an increase in the flow rate as phenol is easily transported to and from the beds surface by diffusion. Until the point of breakthrough, the treated volume was efficiently reduced as the rate of flow increased. Thus, the bed’s service time has changed accordingly.

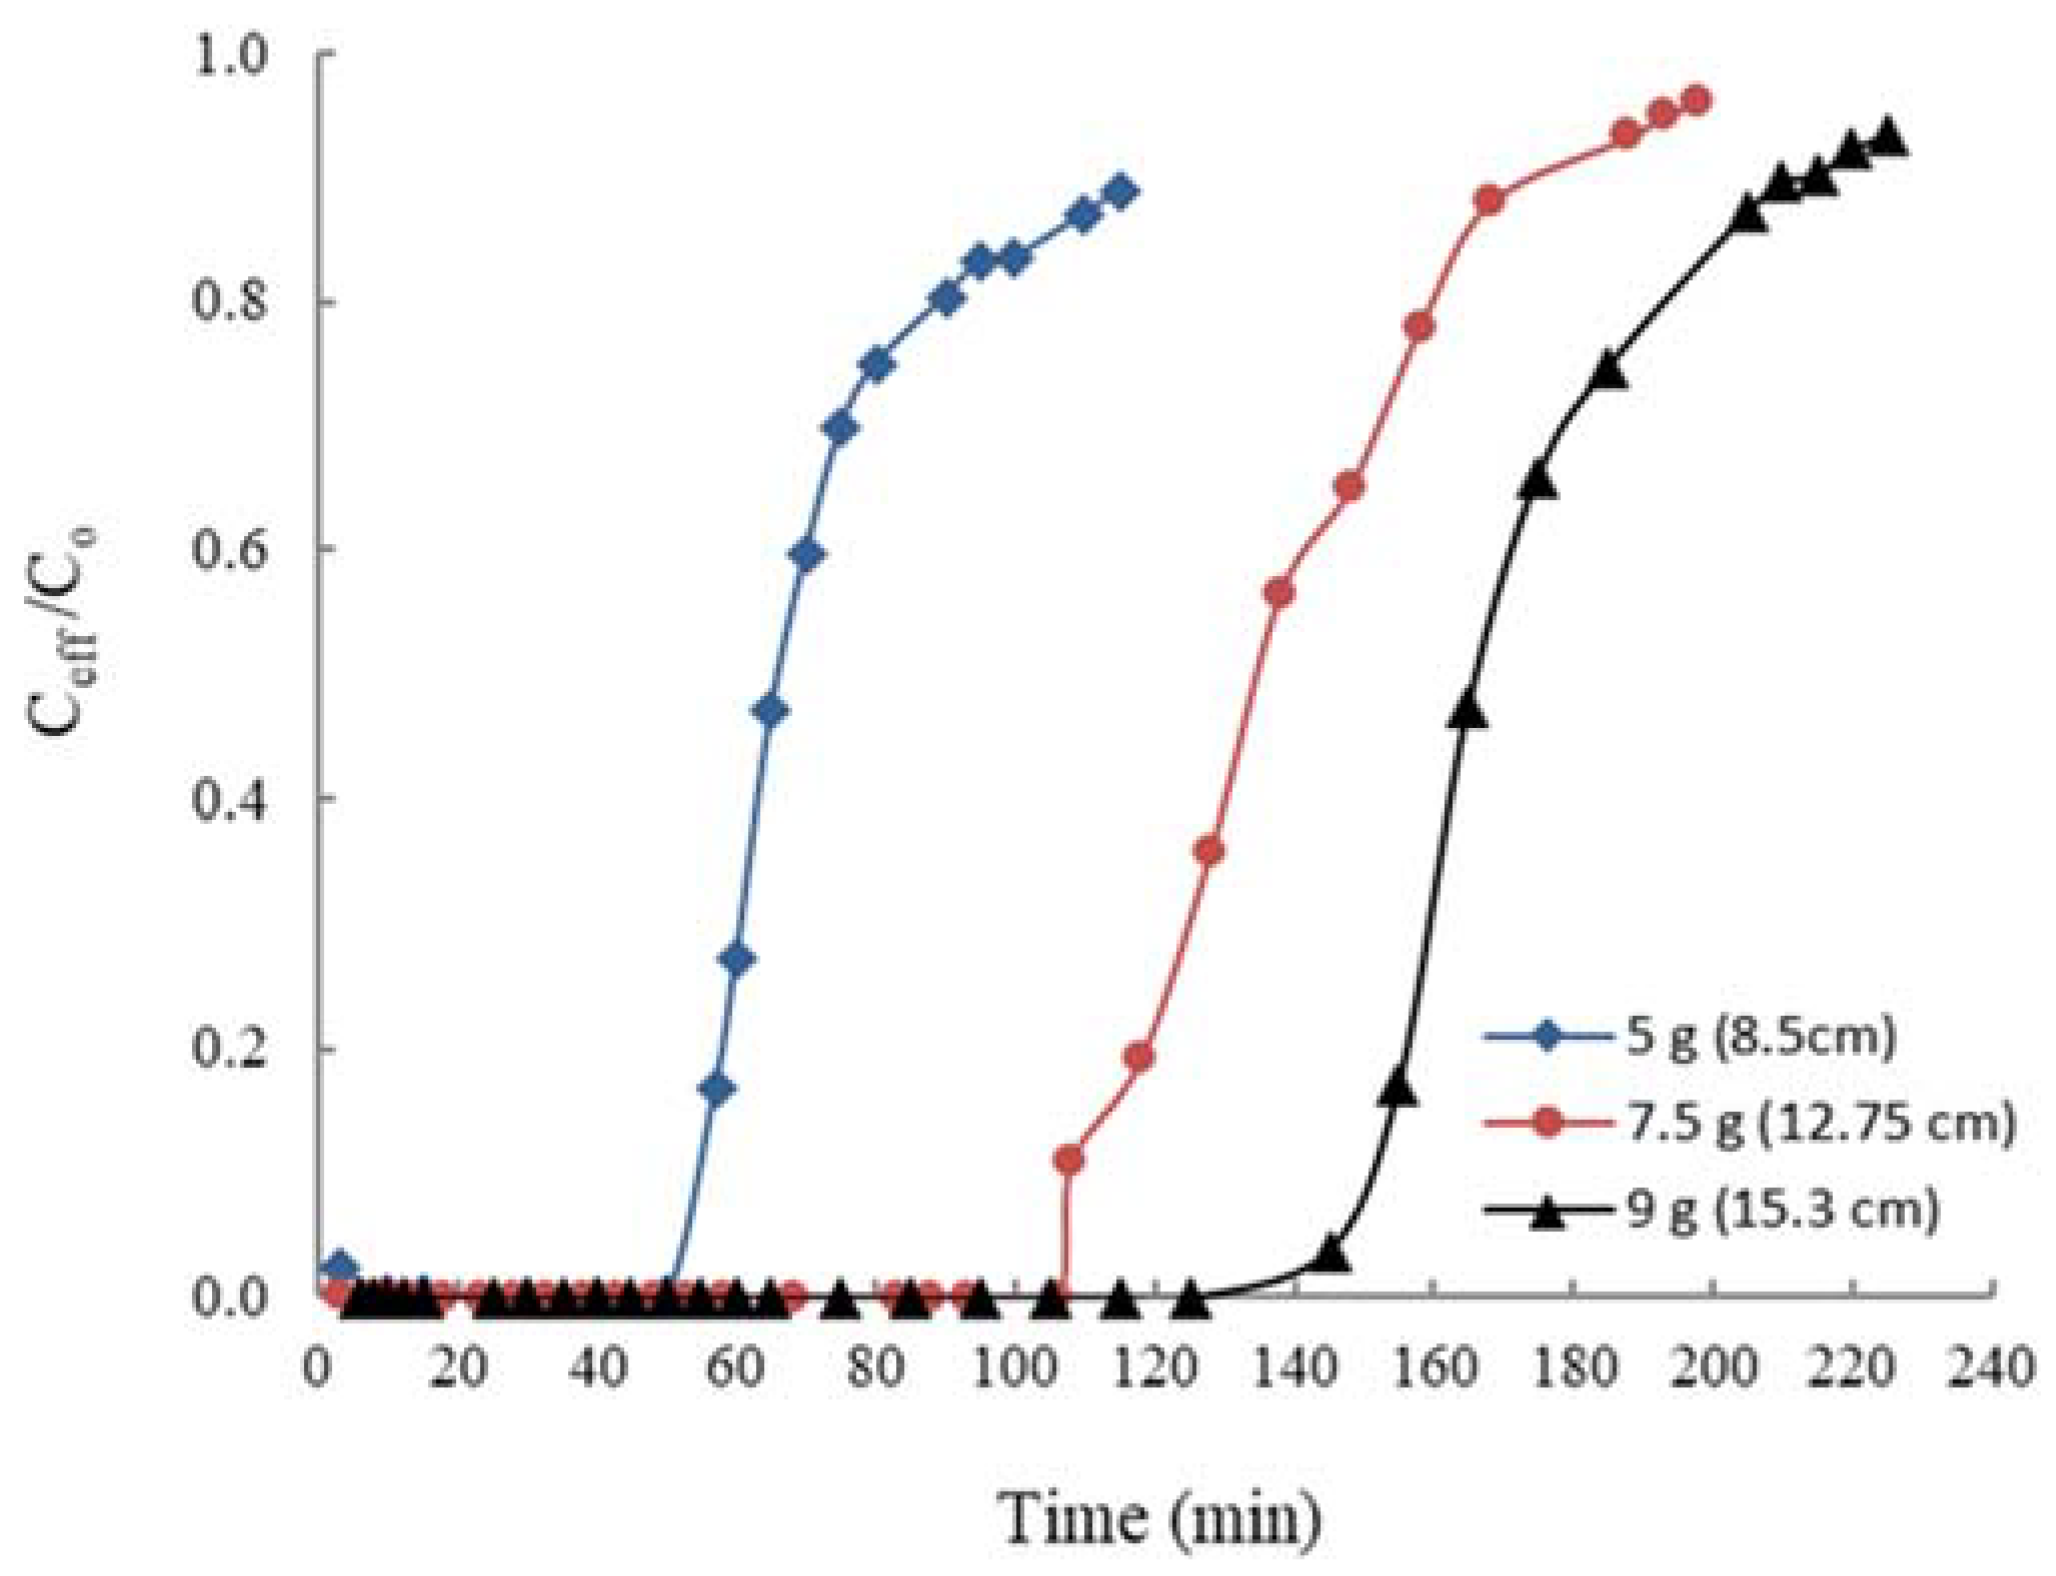
3.4.3. The Bed Depth Effect

Curves of breakthrough at different bed depths are displayed in Figure 6. They demonstrated that their development usually take place faster at a reduced bed depth, and that the breakthrough slope decreases upon the increase in bed depth, which usually leads to an expanded zone of mass transfer. Table 2 shows that qeq was boosted from 22.17 mg·g−1 to 31.49 mg·g−1 as the bed depth increased from 8.5 cm to 15.3 cm, respectively. The slope of breakthrough curve declined following the increase in the bed depth, which led to an expanded zone of mass transfer. At the ultimate bed depth, a higher uptake occurred due to the adsorbent’s surface area growth, leading to additional sorption sites adherence. Pollutant delayed breakthrough then led to a volumetric intensification within the processed solution [28,40].

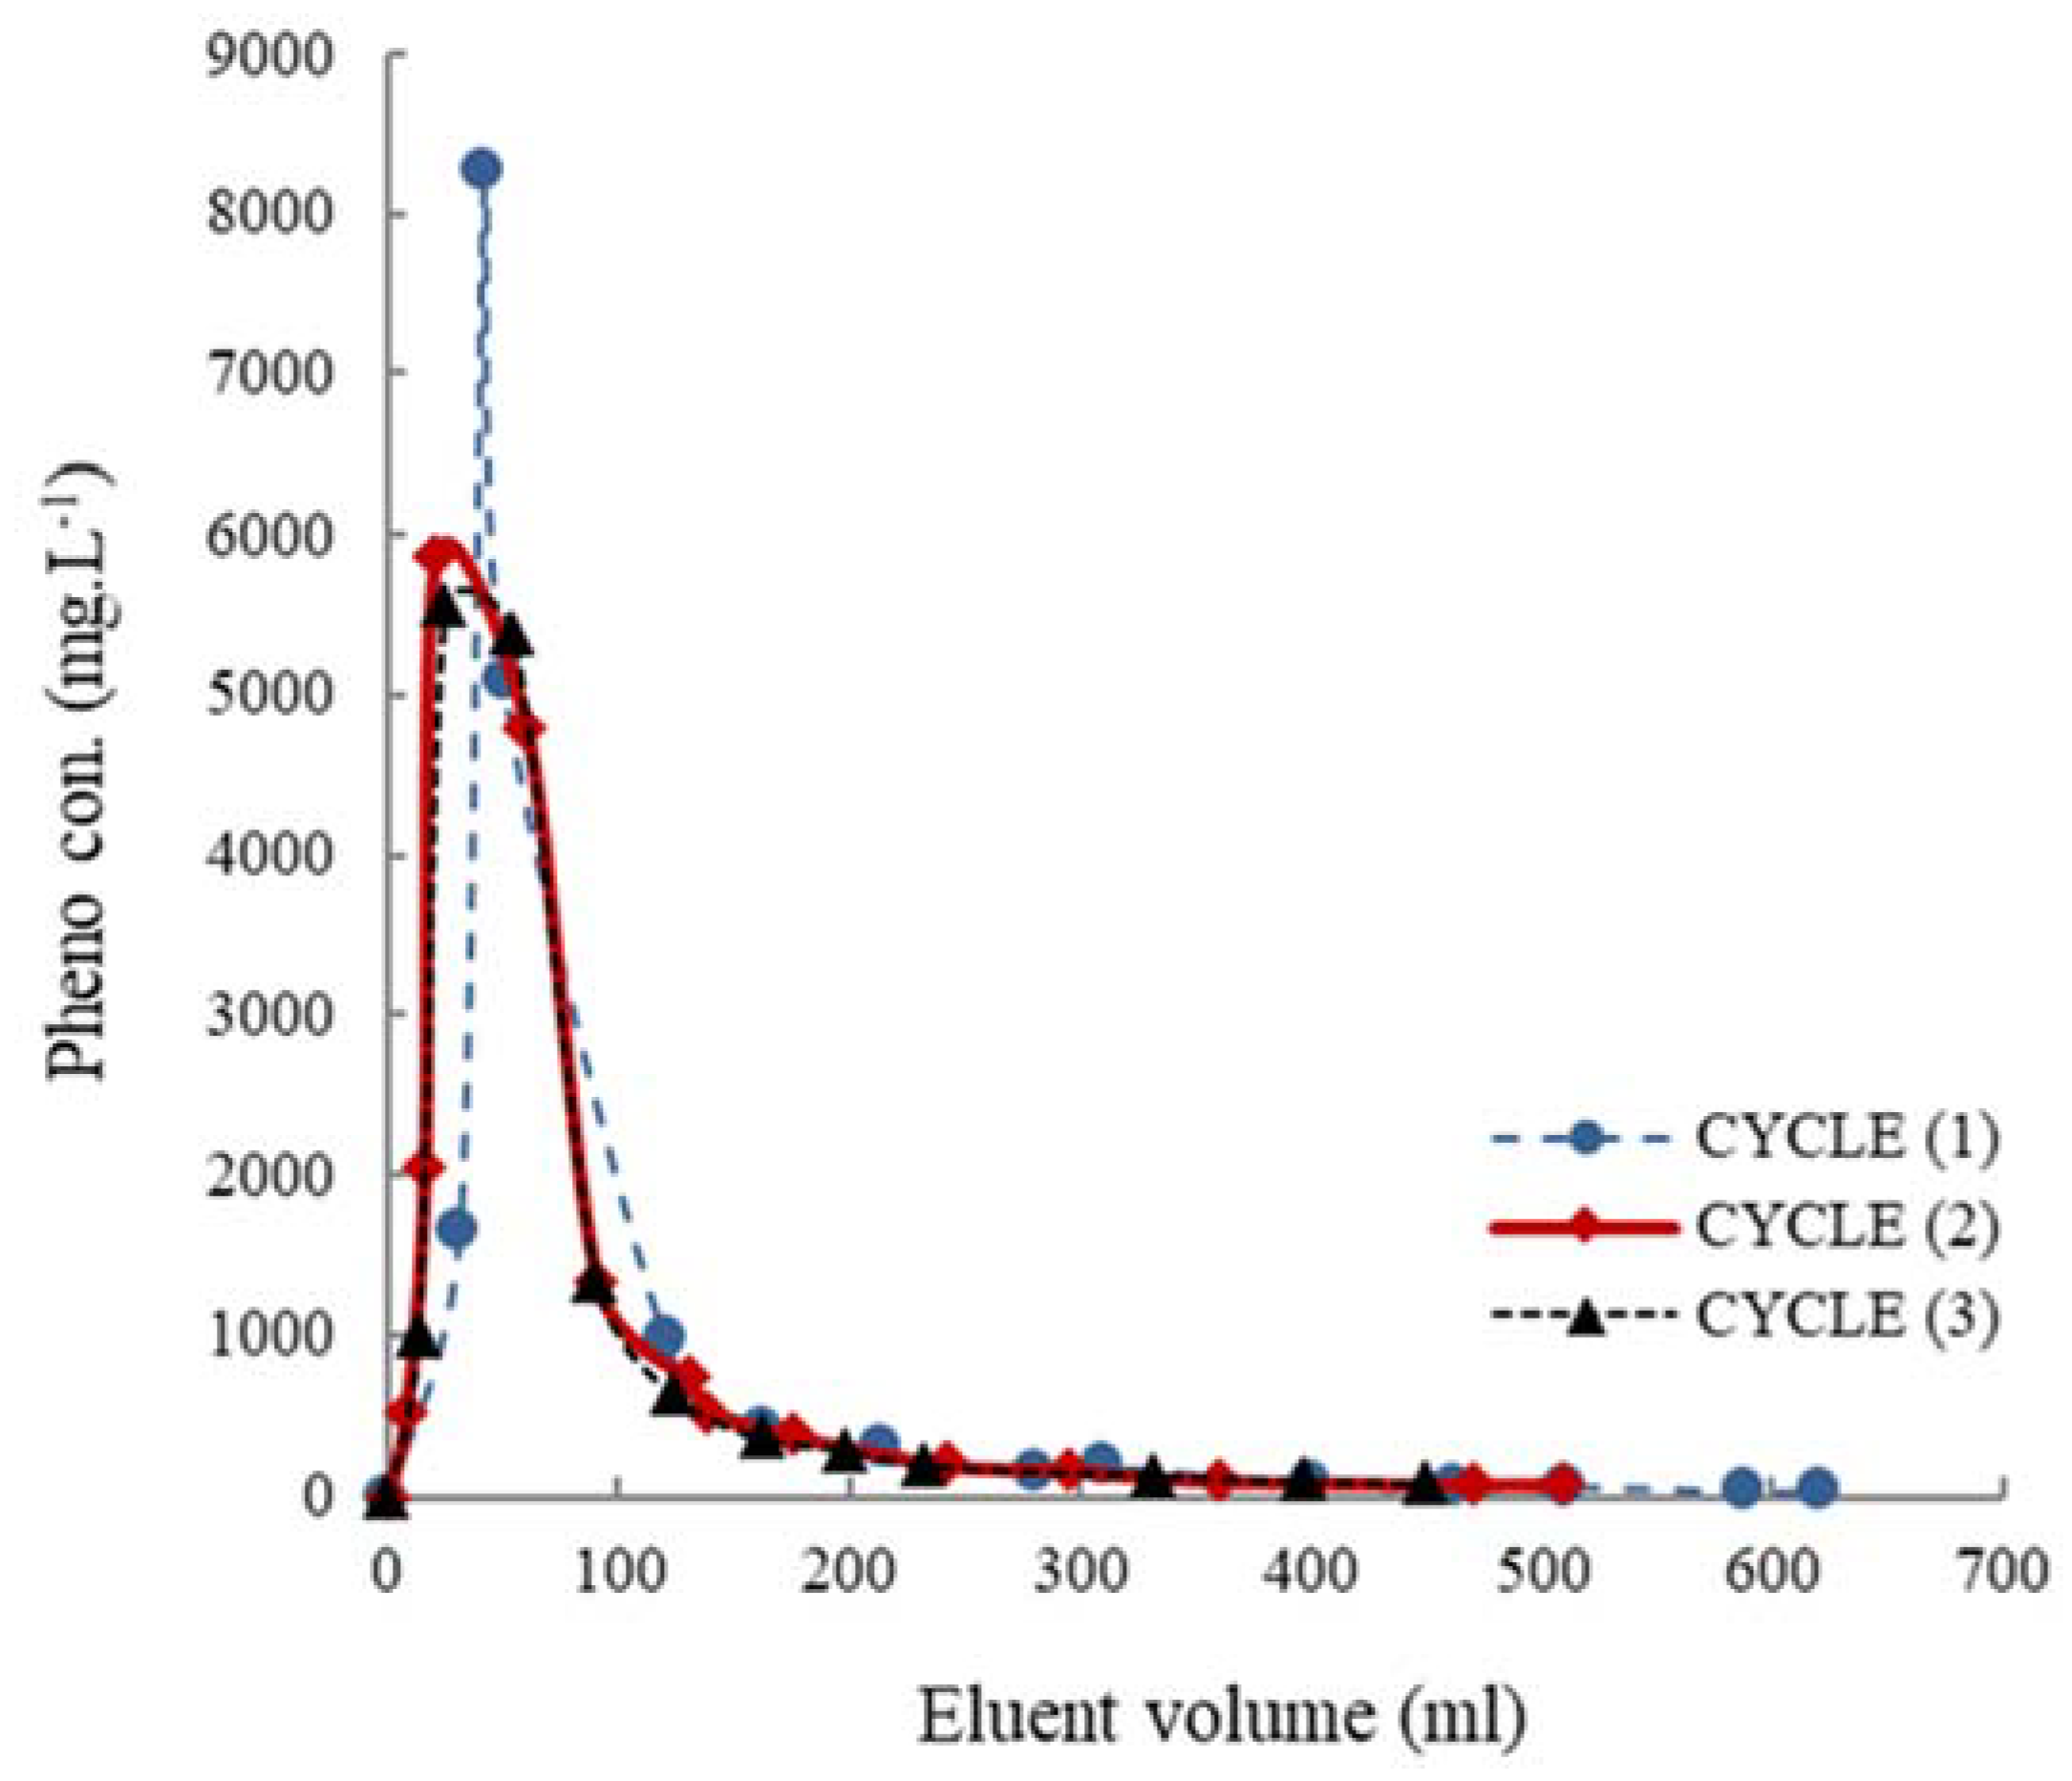
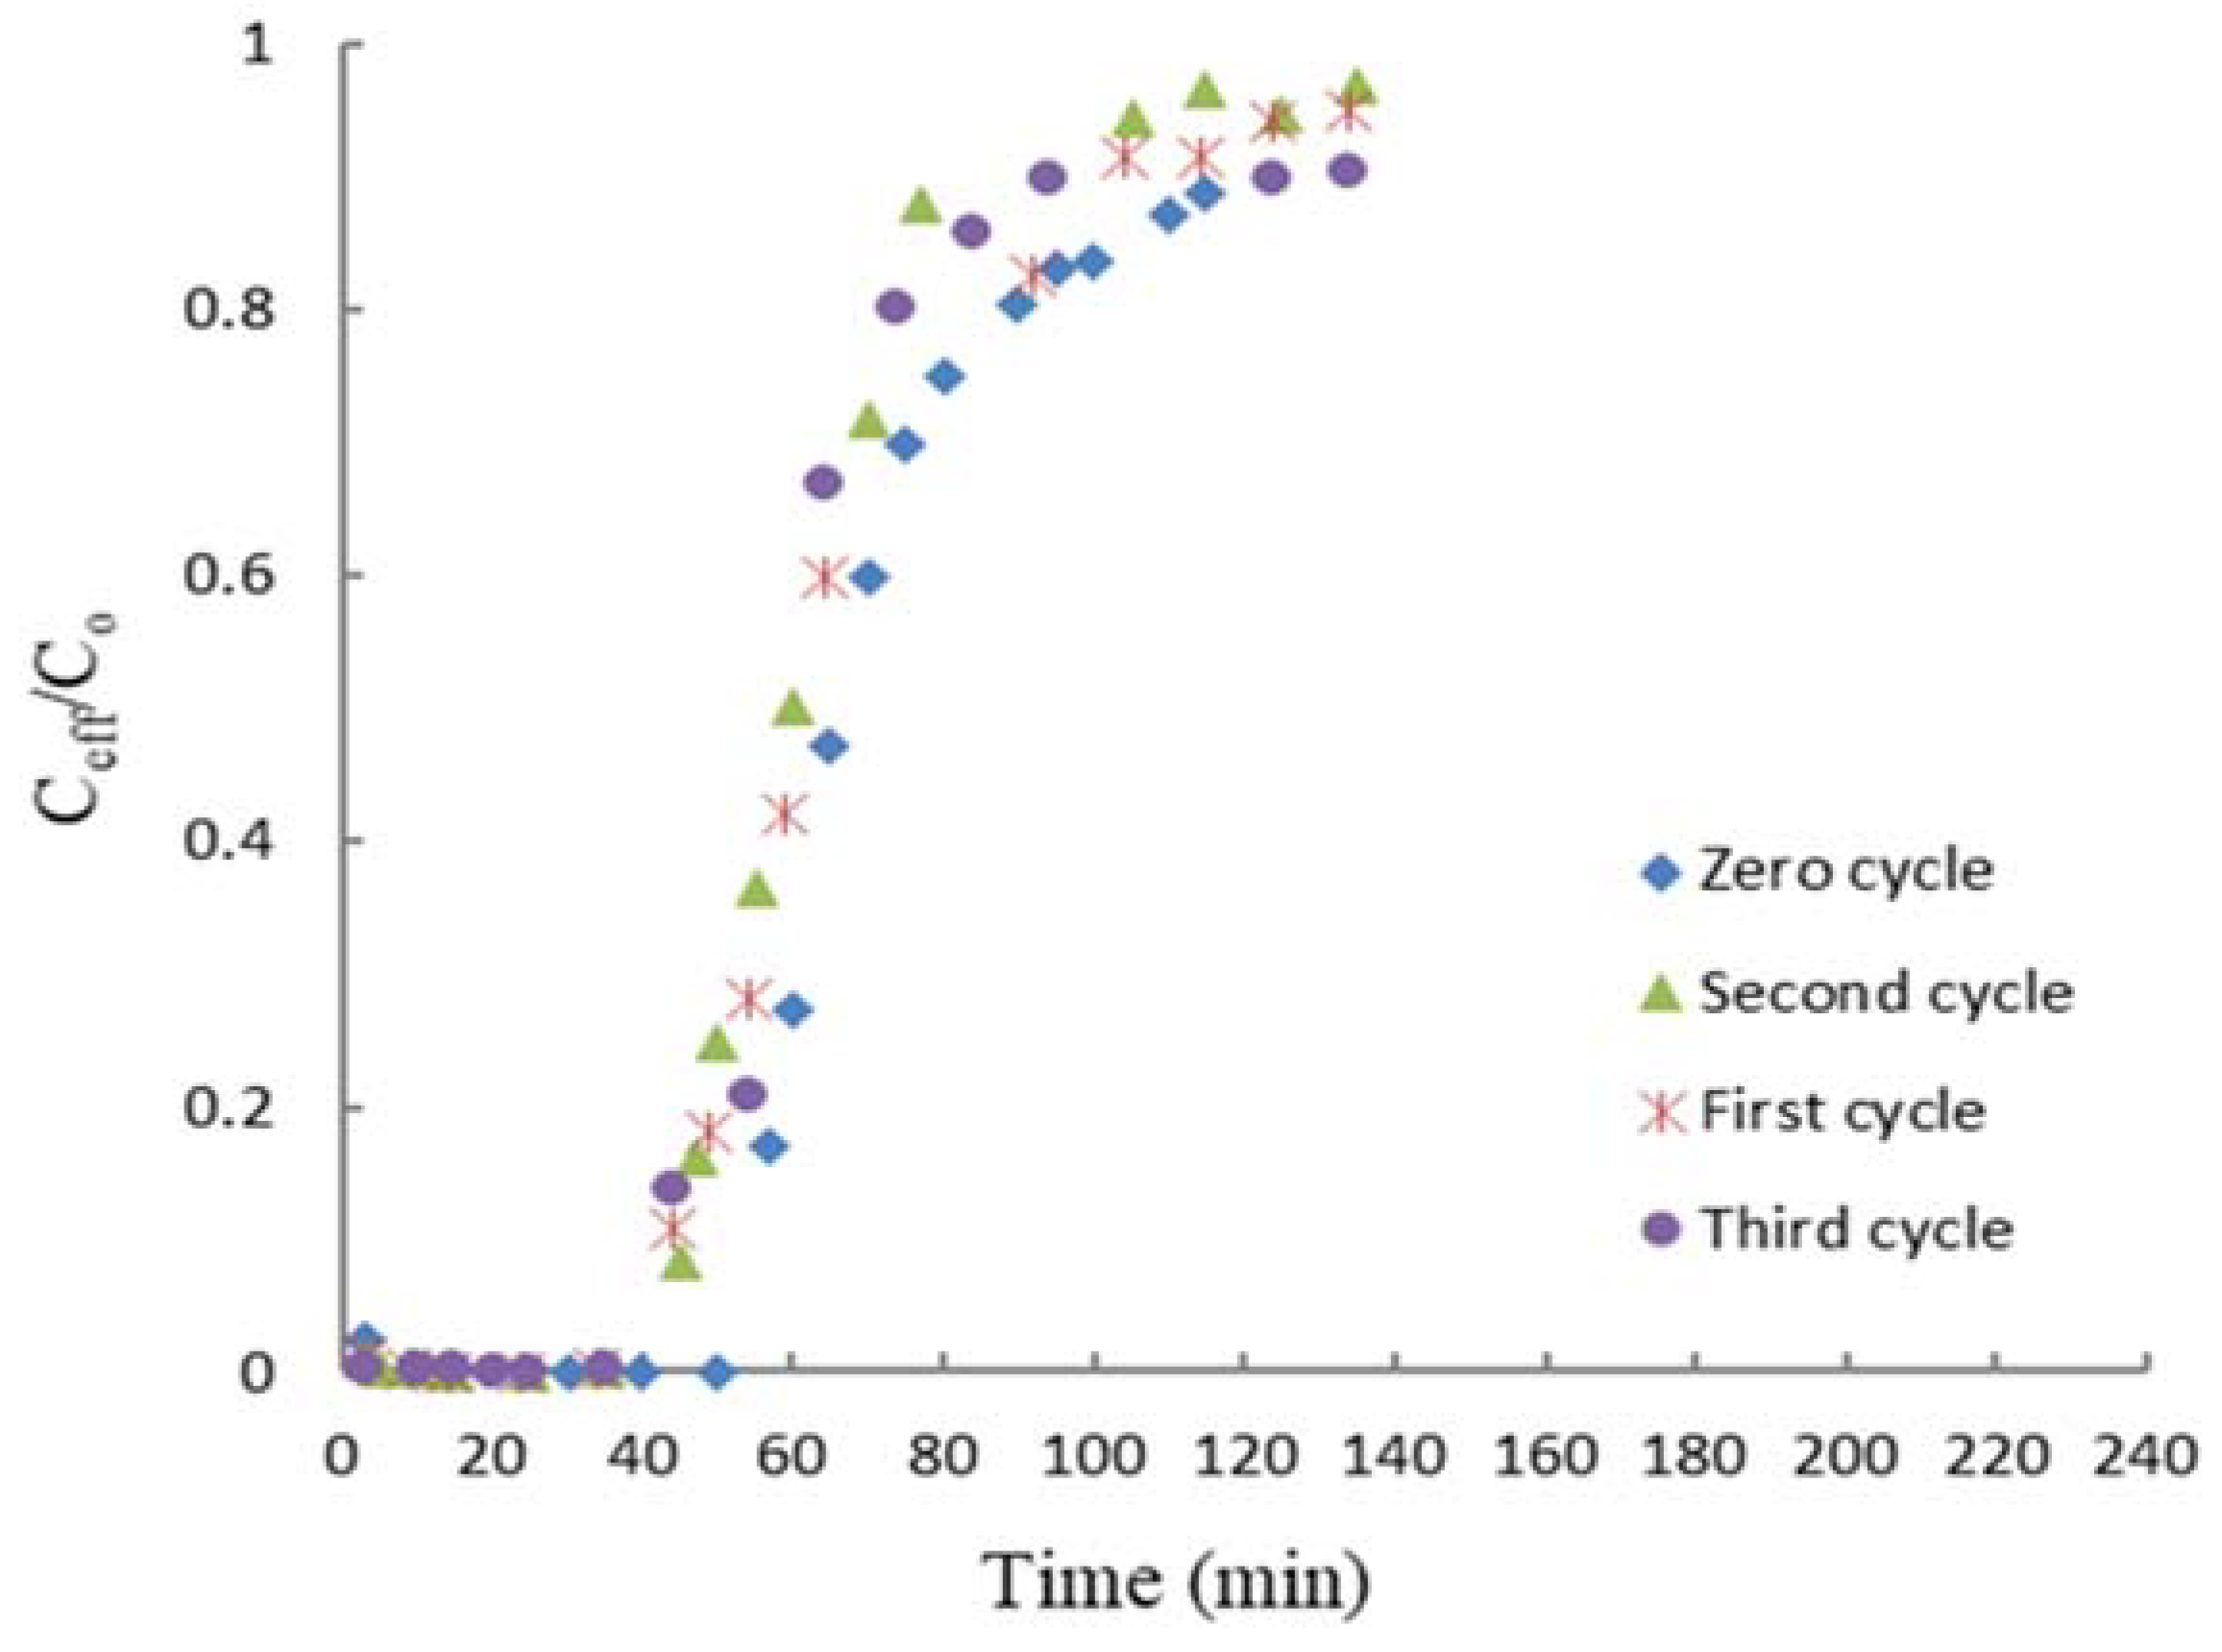
3.5. Study of Desorption

The desorption cycle profile of phenol is shown in Figure 7. The curves of desorption from cycles 1 to 3 exhibited a comparable asymmetrical form along with a fast increase in concentration succeeded by a flatter decrease. It was observed that desorption cycles took 2 h, after which further desorption was insignificant. In the first cycle, the eluent’s total volume at 2 h was 588 mL. The phenol ultimate concentration was acquired at 7, 6, and 4 min contact times and noted as 8282, 5861, and 5562 mg·L−1 for the first, second, and third cycle, respectively. In spite of the small volume of eluting solution, it contained a high concentration, which contributed to the processing simplicity, revival, and reuse of phenol.
The regenerated RHAC was reused for further adsorption cycles. Figure 8 presents the curves of breakthrough produced for the cycles of adsorption. The breakthrough time (tb) remained almost constant throughout the three cycles of sorption, which has noticeable significance for the feasible implementation of RHAC as phenol bio-sorbent. This is because RHAC entails persistent use of the bio-sorbent without an obvious lack of sorption process. Furthermore, no adsorbent swelling occurred, as specified by the constant column’s bed depth [47]. The maximum uptake of phenol brought in a substantial decrease from 22.17 mg·g−1 to 16.71 mg·g−1 after the three cycles. The regeneration efficiency was 89.06% throughout the first cycle, then declined to 75.34% at the third cycle. The regeneration efficiency reduction occurred as some adsorbate ions were linked to the adsorbent via robust interconnection [47].

3.6. Curve of Breakthrough Modeling

3.6.1. Yoon–Nelson Model Application

An ordinary hypothetical model established by Yoon–Nelson was utilized to examine the phenol’s breakthrough behavior within a fixed-bed column. The kYN (a constant for rate) and τ (required time for 50% phenol breakthrough) values were acquired using Equation (5). Such values were implemented to determine the curve of breakthrough. The kYN and τ values are presented in Table 3. As expected, τ decreased and kYN increased as the concentration in phenol inlet, along with the rate of flow, increased. Furthermore, as the bed depth increased, τ increased and kYN decreased. The notional curves were matched against their equivalent experimental ones in Figure 9. It can be noticed that the resulting curves of breakthrough from the experimental data are similar to the those examined by the Yoon–Nelson model at different rates of flow, primary concentrations, and bed depths. The model provided higher (R2 > 0.977) and lower APE values varying from 4.09% to 12.99% (Table 3).

3.6.2. The Adams–Bohart Model Application

The sorption model of Adams–Bohart was applied to the investigational data as a way to define the primary breakthrough curve’s portion. This method concentrates on the assessment of variables that describe the properties, for instance, the sorption’s maximum capacity (N0) and kinetic const. (kAB) by the Adams–Bohart model. The N0 and kAB values were determined from Equation 6, as shown in Table 4. The kAB value decreased in accordance with the increase in the bed depth, as well as influent concentration of phenol. However, it increased as the rate of flow increased. On the other hand, the N0 value in all circumstances showed no substantial change. Moreover, the model provided a high R2 > 0.975. A comparison between predicted curves against their corresponding experimental ones was conducted as presented in Figure 10. There was clearly considerable consistency between the values (experimental vs. predicted), thereby indicating that the model of Adams–Bohart was valid for concentrations up to 0.5, above which big contradictions could be observed among the plotted curves (experimental–predicted) regarding the adsorption of phenol in the RHAC column. Although the model of Adams–Bohart delivers a basic and comprehensive methodology for running and assessing sorption-column experiments, it encounters a limited validity to the level of the employed conditions [48].

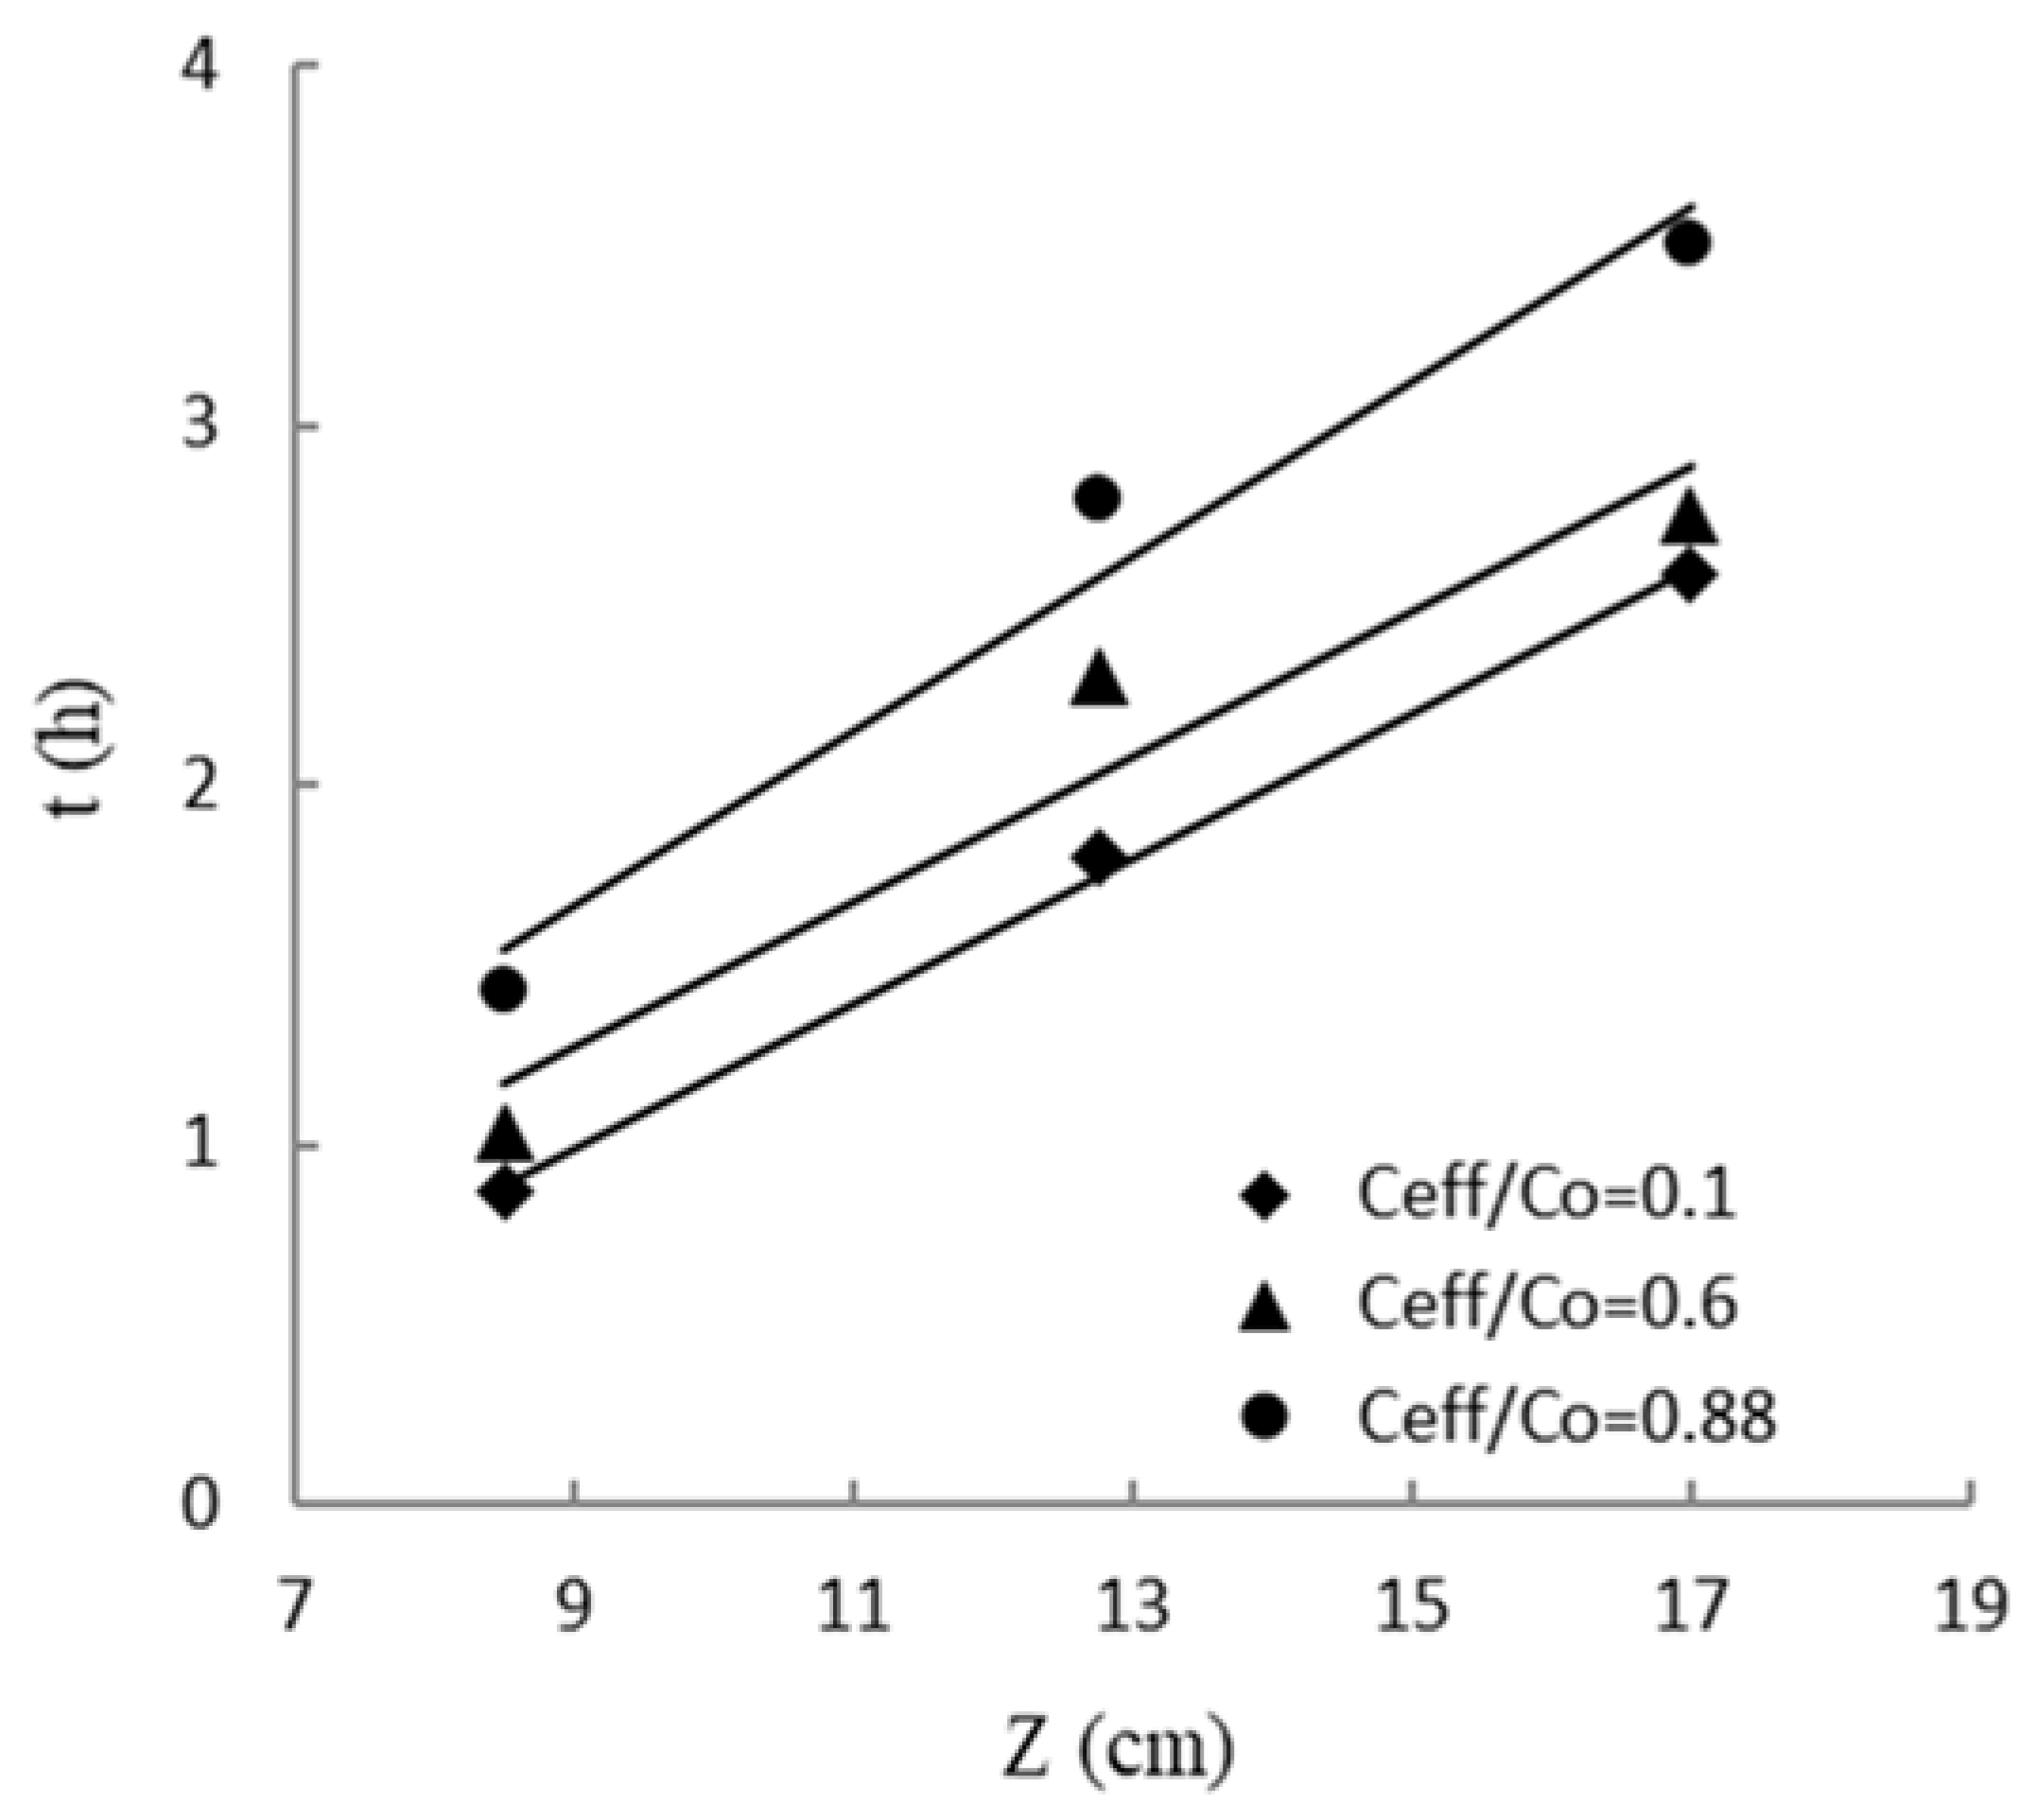
3.6.3. The BDST Model Application

The tZ lines at Ceff/C0 of 0.10, 0.60, and 0.88 values are presented in Figure 11. The affined BDST constants that occur in accordance to the slopes and lines intercept, such as K and, were determined using Equations (7)–(11); their results are shown in Table 5. The K value describes the extent to which the fluid stage turned into the solid one. In the case that K is large, even a small bed would avert breakthrough; though, as K declines, an increasingly deeper bed is essential to avert breakthrough [49]. The capacity of BDST adsorption ( N 0 ) is a crucial constant for evaluating the efficiency of adsorbent; a powerful adsorbent is typically characterized by higher N 0 values [49]. The lowest height of column (Z0) essential for effluent concentration (Cb) of 0.1 mg·L−1 production was determined by Equation (8). As shown in Table 5, as the Ceff/C0 value improved, the constant (K) and the bed’s capacity of adsorption/ a unit bed volume ( N 0 ) improved, while the minimum column height (Z0) decreased. The R2 values were observed between 0.9299 and 0.9975, which specified the BDST model soundness for this method. BDST model constants could be useful to increase the progression in any other rates of flow as well as concentrations with no more experimental runs.

4. Discussion

Techniques that aim at characterizing FESEM and BET were followed in order to investigate the structural features and surface areas of the RH and RHAC. Figure 1a demonstrates that the outer epidermis of the RH sample was wrapped with a uniform fluted texture. The sample of RHAC had a microporous structure with a large surface area and many adsorption active spots (Figure 1b). The analysis of EDX revealed that the RH and RHAC samples had comparable C and O elemental configurations; nonetheless, they had dissimilar ratios by weight (Figure 1c,d). The elemental composition of RH showed a higher carbon content, which makes it a convenient raw material for activated carbon preparations. Carbon represents the largest part of RHAC, whereas a complete absence of silica was observed within the RHAC, and existed merely in the RH. The carbon content of the RHAC was 94.16%, which was higher than that of the RH (49.15%), while the RHAC surface area was 586.59 m2·g1. The larger RHAC surface area observed was due to the increase in interspaces among the layers of carbon of the RHAC as a result of the ZnCl2 action; microspores existed in the adsorbent [6]. The nature of the boost in the RHAC microporosity was, likewise, due to the areas left by ZnCl2 during carbon activation process. This occurred as a result of the frequent washing process, which aimed to eliminate the surplus ZnCl2 linked to the RHAC. Additionally, ZnCl2 brings about swelling, considering cellulose as a major compound in RH; ZnCl2 imposes electrolytic action to the cellulose molecular structure. The swelling action caused by ZnCl2 on the sidelong can break the bonds of the molecules of cellulose, which leads to an intensification in intermicelle and intramicelle voids of RHAC [6]. Therefore, a large surface area was observed for RHAC. Priya et al. [6] reported related findings with a greater surface area of activated carbon treated with ZnCl2.

5. Conclusions

In this study, RHAC has been on an aqueous solution and assessed to be very powerful adsorbent used for removing phenol. The morphological features of RHAC have demonstrated a highly porous adsorbent compared with RH. RHAC demonstrated a surface area (586.6 m2·g−1), total volume of pores (0.3 cm3·g−1), and microporosity (67.6%) that greater than RH. The phenol uptake within a column of fixed-bed was reliant on the concentration of the influent phenol, the bed depth, and rate of flow. The capacity of adsorption increased as the influent concentration and bed depth increased, but reduced as the flow rate increased. The process of column sorption was improved at a higher concentration of influent phenol and minor rate of flow, in addition to greater bed depth. The models of Adams–Bohart, BDST, and Yoon–Nelson were properly utilized to predict the curves of breakthrough, thereby proving that they were appropriate for the RHAC column design. A high percentage of phenol desorption from consumed activated carbon implied that the activated carbon could be redeveloped to be used. RH can efficiently be utilized in order to equip activated carbon for treating phenol at cost effectiveness.

Author Contributions

Conceptualization, methodology, validation, formal analysis, investigation, resources, data curation, and visualization, S.B.D., H.M. and M.S.S.; supervision, project administration, writing—original draft preparation, and funding acquisition, S.B.D.; software, and writing—review and editing, S.B.D. and A.A.H. All authors have read and agreed to the published version of the manuscript.

Funding

This research was funded by the Annual Funding track by the Deanship of Scientific Research. Vice Presidency for Graduate Studies and Scientific Research, King Faisal University, Saudi Arabia [Project No. AN00048].

Institutional Review Board Statement

Not applicable.

Informed Consent Statement

Not applicable.

Data Availability Statement

Not applicable.

Acknowledgments

The authors are grateful to King Faisal University and Universiti Teknologi PETRONAS for facilitating laboratory works beside getting this work accomplished.

Conflicts of Interest

The authors declare no conflict of interest.

References

  1. Mishra, S.; Yadav, S.S.; Rawat, S.; Singh, J.; Koduru, J.R. Corn husk derived magnetized activated carbon for the removal of phenol and para-nitrophenol from aqueous solution: Interaction mechanism, insights on adsorbent characteristics, and isothermal, kinetic and thermodynamic properties. J. Environ. Manag. 2019, 246, 362–373. [Google Scholar] [CrossRef] [PubMed]
  2. Chen, D.; Kannan, K.; Tan, H.; Zheng, Z.; Feng, Y.L.; Wu, Y.; Widelka, M. Review of the Bisphenol analogues other than BPA: Environmental occurrence, human exposure, and toxicity. Environ. Sci. Technol. 2016, 50, 5438–5453. [Google Scholar] [CrossRef] [PubMed]
  3. Nirmala, G.; Murugesan, T.; Rambabu, K.; Sathiyanarayanan, K.; Show, P.L. Adsorptive removal of phenol using banyan root activated carbon. Chem. Eng. Commun. 2021, 208, 831–842. [Google Scholar] [CrossRef]
  4. Busca, G.; Berardinelli, S.; Resini, C.; Arrighi, L. A short review of recent developments: Technologies for the removal of phenol from fluid streams. J. Hazard. Mater. 2008, 160, 265–288. [Google Scholar] [CrossRef]
  5. Stasinakis, A.S.; Elia, I.; Petalas, A.V.; Halvadakis, C.P. Removal of total phenols from olive-mill wastewater using an agricultural by-product, olive pomace. J. Hazard. Mater. 2008, 160, 408–413. [Google Scholar] [CrossRef]
  6. Priya, D.S.; Sureshkumar, M.V. Synthesis of Borassus flabellifer fruit husk activated carbon filter for phenol removal from wastewater. Int. J. Environ. Sci. Technol. 2020, 17, 829–842. [Google Scholar] [CrossRef]
  7. El-Naas, M.H.; Al-Zuhair, S.; Alhaija, M.A. Removal of phenol from petroleum refinery wastewater through adsorption on date-pit activated carbon. Chem. Eng. J. 2010, 162, 997–1005. [Google Scholar] [CrossRef]
  8. Aksu, Z. A review: Application of biosorption for the removal of organic pollutants. Process Biochem. 2005, 40, 997–1026. [Google Scholar] [CrossRef]
  9. Cordova-Rosa, S.M.; Dams, R.I.; Cordova-Rosa, E.V.; Radetski, M.R.; Corrêa, A.X.R.; Radetski, C.M. Remediation of phenol-contaminated soil by a bacterial consortium and Acinetobacter calcoaceticus isolated from an industrial wastewater treatment plant. J. Hazard. Mater. 2009, 164, 61–66. [Google Scholar] [CrossRef]
  10. Garcia-Castello, E.; Cassano, A.; Criscuoli, A.; Conidi, C.; Drioli, E. Recovery and concentration of polyphenols from olive mill wastewaters by integrated membrane system. Water Res. 2010, 44, 3883–3892. [Google Scholar] [CrossRef]
  11. Jain, A.K.; Bhatnagar, A. Methylphenols removal from water by low-cost adsorbents. J. Colloid Interface Sci. 2002, 251, 39–45. [Google Scholar] [CrossRef] [PubMed]
  12. Kujawski, W.; Warszawski, A.; Ratajczak, W.; Porębski, T.; Capała, W.; Ostrowska, I. Removal of phenol from wastewater by different separation techniques. Desalination 2004, 163, 287–296. [Google Scholar] [CrossRef]
  13. Hameed, B.H.; Rahman, A.A. Removal of phenol from aqueous solutions by adsorption onto activated carbon prepared from biomass material. J. Hazard. Mater. 2008, 160, 576–581. [Google Scholar] [CrossRef] [PubMed]
  14. Kumar, A.; Jena, H.M. Preparation and characterization of high surface area activated carbon from Fox nut (Euryale ferox) shell by chemical activation with H3PO4. Results Phys. 2016, 6, 651–658. [Google Scholar] [CrossRef] [Green Version]
  15. Kavand, M.; Soleimani, M.; Kaghazchi, T.; Asasian, N. Competitive separation of lead, cadmium, and nickel from aqueous solutions using activated carbon: Response surface modeling, equilibrium, and thermodynamic studies. Chem. Eng. Commun. 2016, 203, 123–135. [Google Scholar] [CrossRef]
  16. Krishnamoorthy, R.; Govindan, B.; Banat, F.; Sagadevan, V.; Purushothaman, M.; Show, P.L. Date pits activated carbon for divalent lead ions removal. J. Biosci. Bioeng. 2019, 128, 88–97. [Google Scholar] [CrossRef] [PubMed]
  17. Mohanty, K.; Jha, M.; Meikap, B.C.; Biswas, M.N. Removal of chromium (VI) from dilute aqueous solutions by activated carbon developed from Terminalia arjuna nuts activated with zinc chloride. Chem. Eng. Sci. 2005, 60, 3049–3059. [Google Scholar] [CrossRef]
  18. Azevedo, D.C.; Araújo, J.C.S.; Bastos-Neto, M.; Torres, A.E.B.; Jaguaribe, E.F.; Cavalcante, C.L. Microporous activated carbon prepared from coconut shells using chemical activation with zinc chloride. Microporous Mesoporous Mater. 2007, 100, 361–364. [Google Scholar] [CrossRef]
  19. Adinata, D.; Daud, W.M.A.W.; Aroua, M.K. Preparation and characterization of activated carbon from palm shell by chemical activation with K2CO3. Bioresour. Technol. 2007, 98, 145–149. [Google Scholar] [CrossRef]
  20. Prahas, D.; Kartika, Y.; Indraswati, N.; Ismadji, S.J.C.E.J. Activated carbon from jackfruit peel waste by H3PO4 chemical activation: Pore structure and surface chemistry characterization. Chem. Eng. J. 2008, 140, 32–42. [Google Scholar] [CrossRef]
  21. Kalderis, D.; Bethanis, S.; Paraskeva, P.; Diamadopoulos, E. Production of activated carbon from bagasse and rice husk by a single-stage chemical activation method at low retention times. Bioresour. Technol. 2008, 99, 6809–6816. [Google Scholar] [CrossRef] [PubMed]
  22. Altenor, S.; Carene, B.; Emmanuel, E.; Lambert, J.; Ehrhardt, J.J.; Gaspard, S. Adsorption studies of methylene blue and phenol onto vetiver roots activated carbon prepared by chemical activation. J. Hazard. Mater. 2009, 165, 1029–1039. [Google Scholar] [CrossRef]
  23. Din, A.T.M.; Hameed, B.H.; Ahmad, A.L. Batch adsorption of phenol onto physiochemical-activated coconut shell. J. Hazard. Materials 2009, 161, 1522–1529. [Google Scholar]
  24. Liou, T.H.; Wu, S.J. Characteristics of microporous/mesoporous carbons prepared from rice husk under base-and acid-treated conditions. J. Hazard. Mater. 2009, 171, 693–703. [Google Scholar] [CrossRef] [PubMed]
  25. Karunarathne, H.D.S.S.; Amarasinghe, B.M.W.P.K. Fixed bed adsorption column studies for the removal of aqueous phenol from activated carbon prepared from sugarcane bagasse. Energy Procedia 2013, 34, 83–90. [Google Scholar] [CrossRef] [Green Version]
  26. Girish, C.R.; Ramachandra Murty, V. Adsorption of phenol from aqueous solution using Lantana camara, forest waste: Kinetics, isotherm, and thermodynamic studies. Int. Sch. Res. Not. 2014, 2014, 201626. [Google Scholar]
  27. Liou, T.H. Development of mesoporous structure and high adsorption capacity of biomass-based activated carbon by phosphoric acid and zinc chloride activation. Chem. Eng. J. 2010, 158, 129–142. [Google Scholar] [CrossRef]
  28. Kumar, U.; Bandyopadhyay, M. Sorption of cadmium from aqueous solution using pretreated rice husk. Bioresour. Technol. 2006, 97, 104–109. [Google Scholar] [CrossRef]
  29. Ngah, W.W.; Hanafiah, M.M. A review: Removal of heavy metal ions from wastewater by chemically modified plant wastes as adsorbents. Bioresour. Technol. 2008, 99, 3935–3948. [Google Scholar] [CrossRef]
  30. Wong, K.K.; Lee, C.K.; Low, K.S.; Haron, M.J. Removal of Cu and Pb by tartaric acid modified rice husk from aqueous solutions. Chemosphere. 2003, 50, 23–28. [Google Scholar] [CrossRef]
  31. Miao, Q.; Tang, Y.; Xu, J.; Liu, X.; Xiao, L.; Chen, Q. Activated carbon prepared from soybean straw for phenol adsorption. J. Taiwan Inst. Chem. Eng. 2013, 44, 458–465. [Google Scholar] [CrossRef]
  32. Komal Kumar, N.; Shukla, V.K. Electrode material for supercapacitor using activated carbon derived from flower of Achyranthes aspera L. Proc. AIP Conf. 2020, 2220, 140046. [Google Scholar]
  33. Joshi, S.; Bishnu, K.C. Synthesis and Characterization of Sugarcane Bagasse Based Activated Carbon: Effect of Impregnation Ratio of ZnCl2. J. Nepal Chem. Soc. 2020, 41, 74–79. [Google Scholar] [CrossRef]
  34. Daffalla, S.B.; Mukhtar, H.; Shaharun, M.S. Properties of activated carbon prepared from rice husk with chemical activation. Int. J. Glob. Environ. Issues 2012, 12, 107–129. [Google Scholar] [CrossRef]
  35. Luo, X.; Deng, Z.; Lin, X.; Zhang, C. Fixed-bed column study for Cu2+ removal from solution using expanding rice husk. J. Hazard. Mater. 2011, 187, 182–189. [Google Scholar] [CrossRef]
  36. Aksu, Z.; Gönen, F. Biosorption of phenol by immobilized activated sludge in a continuous packed bed: Prediction of breakthrough curves. Process Biochem. 2004, 39, 599–613. [Google Scholar] [CrossRef]
  37. Shi, S.L.; Lv, J.P.; Liu, Q.; Nan, F.R.; Jiao, X.Y.; Feng, J.; Xie, S.L. Application of Phragmites australis to remove phenol from aqueous solutions by chemical activation in batch and fixed-bed columns. Environ. Sci. Pollut. Res. 2018, 25, 23917–23928. [Google Scholar] [CrossRef]
  38. Oguz, E.; Ersoy, M. Removal of Cu2+ from aqueous solution by adsorption in a fixed bed column and Neural Network Modelling. Chem. Eng. J. 2010, 164, 56–62. [Google Scholar] [CrossRef]
  39. Dwivedi, C.P.; Sahu, J.N.; Mohanty, C.R.; Mohan, B.R.; Meikap, B.C. Column performance of granular activated carbon packed bed for Pb (II) removal. J. Hazard. Mater. 2008, 156, 596–603. [Google Scholar] [CrossRef]
  40. Han, R.; Ding, D.; Xu, Y.; Zou, W.; Wang, Y.; Li, Y.; Zou, L. Use of rice husk for the adsorption of congo red from aqueous solution in column mode. Bioresour. Technol. 2008, 99, 2938–2946. [Google Scholar] [CrossRef]
  41. Mohan, S.; Sreelakshmi, G. Fixed bed column study for heavy metal removal using phosphate treated rice husk. J. Hazard. Mater. 2008, 153, 75–82. [Google Scholar] [CrossRef] [PubMed]
  42. Ren, L.; Zhang, J.; Li, Y.; Zhang, C. Preparation and evaluation of cattail fiber-based activated carbon for 2, 4-dichlorophenol and 2, 4, 6-trichlorophenol removal. Chem. Eng. J. 2011, 168, 553–561. [Google Scholar] [CrossRef]
  43. Pallarés, J.; González-Cencerrado, A.; Arauzo, I. Production and characterization of activated carbon from barley straw by physical activation with carbon dioxide and steam. Biomass Bioenergy 2018, 115, 64–73. [Google Scholar] [CrossRef] [Green Version]
  44. Nakbanpote, W.; Thiravetyan, P.; Kalambaheti, C. Preconcentration of gold by rice husk ash. Miner. Eng. 2000, 13, 391–400. [Google Scholar] [CrossRef]
  45. Chen, N.; Zhang, Z.; Feng, C.; Li, M.; Chen, R.; Sugiura, N. Investigations on the batch and fixed-bed column performance of fluoride adsorption by Kanuma mud. Desalination 2011, 268, 76–82. [Google Scholar] [CrossRef] [Green Version]
  46. Ahmad, A.A.; Hameed, B.H. Fixed-bed adsorption of reactive azo dye onto granular activated carbon prepared from waste. J. Hazard. Mater. 2010, 175, 298–303. [Google Scholar] [CrossRef]
  47. Sharma, N.; Kaur, K.; Kaur, S. Kinetic and equilibrium studies on the removal of Cd2+ ions from water using polyacrylamide grafted rice (Oryza sativa) husk and (Tectona grandis) saw dust. J. Hazard. Mater. 2009, 163, 1338–1344. [Google Scholar] [CrossRef]
  48. Bhaumik, M.; Setshedi, K.; Maity, A.; Onyango, M.S. Chromium (VI) removal from water using fixed bed column of polypyrrole/Fe3O4 nanocomposite. Sep. Purif. Technol. 2013, 110, 11–19. [Google Scholar] [CrossRef]
  49. Al-Degs, Y.S.; Khraisheh, M.A.M.; Allen, S.J.; Ahmad, M.N. Adsorption characteristics of reactive dyes in columns of activated carbon. J. Hazard. Mater. 2009, 165, 944–949. [Google Scholar] [CrossRef]
Figure 1. FESEM and EDX images of (a,c) rice husk (RH) and (b,d) rice husk activated carbon (RHAC) magnified 500 times.
Applsci 12 04354 g001
Figure 2. Hysteresis loops for activated carbon of rice husk.
Applsci 12 04354 g002
Figure 3. X-ray diffraction pattern of (a) RHAC and (b) silicic acid.
Applsci 12 04354 g003
Figure 4. Concentration effect of the influent phenol on the curve of breakthrough of phenol adsorption of RHAC (rate of flow given as 10 mL·min−1; bed depth given as 8.5 cm).
Applsci 12 04354 g004
Figure 5. Effects of variable rates of flow on the adsorption’s curve of breakthrough for RHAC (bed depth = 8.5 cm; phenol concentration at inlet = 1000 mg·L−1).
Applsci 12 04354 g005
Figure 6. Different bed depths effect on the adsorption’s curves of breakthrough onto RHAC (rate of flow of 10 mL/min; inlet phenol concentration of 1000 mg/L).
Applsci 12 04354 g006
Figure 7. Desorption cycle profile of phenol at a rate of flow of 8 mL/min & bed depth of 8.5 cm with 0.1 M NaOH as eluent.
Applsci 12 04354 g007
Figure 8. Curves of multiple breakthrough for phenol adsorption (1000 mg/L) at a constant 8 mL/min rate of flow & 8.5 cm bed depth.
Applsci 12 04354 g008
Figure 9. Experimental curves of breakthrough versus the predicted, attained at various (a) concentrations of phenol inlet, (b) phenol rates of flow, and (c) bed depths according to the model of Yoon–Nelson.
Applsci 12 04354 g009
Figure 10. The experimental vs. predicted curves of breakthrough gained at dissimilar (a) pheno’s inlet concentrations, (b) phenol rates of flow, and (c) bed depths according to Adams–Bohart model.
Applsci 12 04354 g010
Figure 11. Lines of bed depth service time for 0.10, 0.60, and 0.88 breakthrough for diverse bed heights (Co given as 1000 mg/L; Q given as 10 mL/min).
Applsci 12 04354 g011
Table 1. Characteristics of rice husk (RH) pore’s texture and rice husk activated carbon (RHAC).
ParameterRHRHAC
Surface area (m2·g−1)7.14586.59
Micropore area (m2·g−1) a1.44415.80
Micropore volume (cm3·g−1) a0.0000.204
Total pore volume (cm3·g−1) b0.0060.301
Average pore diameter (nm) c3.0802.055
Microporosity (%) d0.0067.60
a Applying the model of Barrett–Joyner–Halenda; b A total pore volume for single-point adsorption; c Average adsorption’s pore width (4V/A by BET)); d Microporosity given as (volume of micro-pore /total volume of pore) × 100%.
Table 2. Data on column and their acquired parameters at different influent phenol concentrations, rates of flow, and bed depths onto rice husk activated carbon (RHAC) (temperature = 23 ± 1 °C; pH = 5.58).
C0
(mg·L−1)
v
(mL·min−1)
Z
(cm)
tb
(min)
ttotal
(min)
qtotal
(mg)
qeq
(mg·g−1)
Veff
(mL)
40010.08.5015319387.4517.491930
100010.08.504090110.8522.17900
200010.08.503560228.9545.79600
10007.58.5060130135.7527.15975
10005.08.5084149152.0530.41745
100010.012.75106188223.2829.771880
100010.015.30125195283.4131.491950
Table 3. The Yoon–Nelson model parameters at dissimilar conditions.
C0
(mg·L−1)
Q
(mL·min−1)
Z
(cm)
kYN
(min−1)
τ
(min)
R2τexp
(min)
APE
(%)
10005.08.500.077126.590.97712412.64
10007.58.500.06997.810.9921004.89
100010.08.500.09569.390.9806512.99
40010.08.500.142170.580.9881739.51
200010.08.500.23946.670.992454.73
100010.012.750.070137.860.9941384.09
100010.015.300.077170.210.98916511.02
Table 4. The Adams–Bohart model’s parameters under various circumstances.
C0
(mg·L−1)
Q
(mL·min−1)
Z
(cm)
kAB × 104
(L·mg−1·min−1)
N0 × 10−4
(mg·L−1)
R2
10005.08.501.143.8080.975
10007.58.500.594.8870.981
100010.08.501.314.0390.982
40010.08.501.685.4210.979
200010.08.501.525.7760.997
100010.012.750.595.7960.994
100010.015.301.075.0960.999
Table 5. Service time model parameters for bed depth used for phenol adsorption (C0 given as 1000 mg/L; Q given as 10 mL/min).
Ceff/C0K (L·mg−1·h−1) N 0   ×   10 3   ( mg · L 1 ) Z0 (cm)R2
0.100.010862.0484.08420.9975
0.600.016462.0482.70890.9299
0.880.017174.6732.14810.9665
Publisher’s Note: MDPI stays neutral with regard to jurisdictional claims in published maps and institutional affiliations.

