Article

Multi-Institutional Breast Cancer Detection Using a Secure On-Boarding Service for Distributed Analytics

1
Information Systems and Database Technology Research Group, RWTH Aachen University, 52062 Aachen, Germany
2
Institute for Medical Informatics, Statistics and Epidemiology, Leipzig University, 04107 Leipzig, Germany
3
Department of Medical Data Science, Leipzig University Medical Center, 04107 Leipzig, Germany
4
Database Group, Mittweida University of Applied Sciences, 09648 Mittweida, Germany
5
Institute for Medical Informatics, Faculty of Medicine and University Hospital Cologne, University of Cologne, 50674 Cologne, Germany
6
Fraunhofer Institute for Applied Information Techniques, 53757 St. Augustin, Germany
7
Department of Medical Informatics, University Medical Center Göttingen, 37075 Göttingen, Germany
*
Author to whom correspondence should be addressed.
These authors contributed equally to this work.
Appl. Sci. 2022, 12(9), 4336; https://doi.org/10.3390/app12094336
Submission received: 24 February 2022 / Revised: 13 April 2022 / Accepted: 21 April 2022 / Published: 25 April 2022
(This article belongs to the Special Issue Data Science for Medical Informatics)

Abstract

:
The constant upward movement of data-driven medicine as a valuable option to enhance daily clinical practice has brought new challenges for data analysts to get access to valuable but sensitive data due to privacy considerations. One solution for most of these challenges are Distributed Analytics (DA) infrastructures, which are technologies fostering collaborations between healthcare institutions by establishing a privacy-preserving network for data sharing. However, in order to participate in such a network, a lot of technical and administrative prerequisites have to be made, which could pose bottlenecks and new obstacles for non-technical personnel during their deployment. We have identified three major problems in the current state-of-the-art. Namely, the missing compliance with FAIR data principles, the automation of processes, and the installation. In this work, we present a seamless on-boarding workflow based on a DA reference architecture for data sharing institutions to address these problems. The on-boarding service manages all technical configurations and necessities to reduce the deployment time. Our aim is to use well-established and conventional technologies to gain acceptance through enhanced ease of use. We evaluate our development with six institutions across Germany by conducting a DA study with open-source breast cancer data, which represents the second contribution of this work. We find that our on-boarding solution lowers technical barriers and efficiently deploys all necessary components and is, therefore, indeed an enabler for collaborative data sharing.

1. Introduction

We are witnessing the rise of data-driven medicine, which has attracted considerable interest in diagnosis, clinical decision making, or research and has the potential to fundamentally revolutionise the healthcare domain [1,2,3]. Especially in research, the availability of sufficiently large and reliable data sets, e.g., patient records or medical images, are decisive for the impact of treatments and clinical trials [4]. The demand for a vast amount of data is fueled even more by the application of AI methodologies playing an increasing role in the healthcare sector due to their learning and prediction capabilities [1,5,6].
Nevertheless, the ongoing success comes along with new emerging challenges. One major challenge is the compliance with patients’ rights and privacy regulations because of the sensitive nature of patient data [7]. Such sensitive patient information finds particular protection in the European GDPR (https://gdpr.eu, accessed on 18 February 2022) for example.
While these regulations enhance data privacy, they hinder healthcare institutions from sharing their data since it poses the risk of losing sovereignty over the data instances [8]. Consequently, researchers are limited to the availability of the data within the institutional borders, which reduces the effectiveness of clinical outcomes. In consequence of these regulatory requirements and their effect on data-driven medicine, there is a need for privacy-preserving data analysis.
Therefore, approaches for Distibuted Analytics (DA) have come into focus [7,9,10,11,12,13,14,15]. The advantages of these approaches stem from a paradigm shift in current data analyses. Conventionally, from an abstract perspective, data is brought to the analysis by following a data centralisation approach. So, data is collected from different institutions and transferred to a central location. As mentioned above, this procedure is difficult to incorporate with present data protection regulations. DA, however, reverses this procedure by bringing the analysis to the data. Hence, data never leaves its origin and stays under the control of the data owner [12]. While DA represents a first step towards privacy-preserving analyses and forges connections between institutions, it invokes new research questions induced by its highly decentralised nature. Particularly in the past years, the rising trend of FAIR (https://www.go-fair.org/fair-principles/, accessed on 18 February 2022). Data Management and the FAIRification of digital assets have revealed several shortcomings of DA infrastructures. Although selected DA concepts have been theoretically evaluated with respect to their contribution to the FAIR Data, it is still lacking actual practical development towards this direction [12]. Besides these more abstract principles, common approaches often require advanced technical understanding and knowledge to connect the data holding institution with the DA network (so-called on-boarding). This often has an impact on the deployment time and in-depth support, which does not scale when the number of new sites increases from a few to tens or hundreds per week [15].

1.1. Objective

In this work, we pursue the questions of what the current shortcomings of the state-of-the-art on-boarding processes in DA ecosystems are and how we can propose a solution which addresses these challenges. We aim to develop an on-boarding service for DA platforms to facilitate the participation of data premises in such a network. Our objective is to develop a technical solution contributing to the FAIRification of DA ecosystems by simultaneously reducing the deployment effort for each participating party. We intend to provide a solution for each part of the FAIR principles at the institution-level rather than the data-level. For the Findability, our main objective is to make all participating data premises visible for researchers. Each institution should be enriched with meaningful metadata and constitute a first step towards the transparency of each component. For both Accessibility and Interoperability, each institution should be accessible through the same interfaces to reduce the usage of adapter components. Lastly, regarding Reusability, the infrastructure should facilitate the continuous usage of provided data such that the institution has to be interconnected only once. We further pursue the usage of well-established, well-known, and easy-to-use technologies to meet the different requirements of users with varying technological backgrounds. Moreover, due to these technologies, we want to significantly reduce the deployment effort and, consequently, the time-to-result of analyses by using a seamless and automated workflow. The provided services should finally enable a sufficient level of security and trust in the ecosystem.

1.2. Contribution and Findings

Our first contribution is a concept for a (semi-automated) on-boarding service, which enables institutions to provide data endpoints in a DA infrastructure—the so-called Personal Health Train. Using a central registry, we make these data nodes, equipped with metadata, visible for researchers. We have applied the on-boarding process to an already existing Personal Health Train infrastructure and evaluated our work with six (healthcare) institutions across Germany in a sample data analysis use case, i.e., breast cancer detection, with open-source data, which represents the second contribution of our work.
We have found several shortcomings of the state-of-the-art DA ecosystems that can be categorised into three groups: FAIRification, automation, and installation. Our evaluation has shown that our on-boarding process indeed poses a solution for these aspects by reducing the deployment time for an institution to participate in the network, by simultaneously requiring less technical expertise for the deployment process, and by contributing to the FAIRification of DA. Further, we experienced less one-to-one support during the deployment of the data endpoint, which increases the scalability of such a network. The data use case shows that our solution is an enabler for the collaboration between different data-sharing institutions, which supports clinical research.

1.3. Overview

This work is structured as follows. The next Section 2 provides an overview of DA and on-boarding processes. Section 3 briefly presents the distributed analytics infrastructure we used and gives a detailed presentation about the on-boarding process. In Section 4, we evaluate our implementation in a data study. Section 5 and Section 6 discuss and conclude this work.

2. Related Work

This section briefly introduces the FAIR principles and related workflows first (Section 2.1), before it presents different DA approaches and gives a more detailed overview of the Personal Health Train infrastructure, which plays a dominant role in this work (Section 2.2). Further, we investigate similar on-boarding mechanisms, which have served as inspiration for our solution (Section 2.3).

2.1. FAIR Principles

The FAIR principles, firstly introduced by Wilkinson, M., Dumontier, M., Aalbersberg, I. et al., represent four basic guidelines for the improvement of scientific data management [16]. One driver of the FAIR data principles is the GO FAIR (https://www.go-fair.org/fair-principles/, accessed on 18 February 2022) initiative, which creates and coordinates so-called implementation networks (IN) to foster the establishment of these guidelines. As the acronym might suggest, these principles consist of the following four core pillars:
  • Findable: To make data usage possible, researchers should be able to find digital assets. Each data object should have a persistent and unique identifier and should include rich metadata. Additionally, the metadata—or the identifier, respectively—should be stored in searchable resources.
  • Accessible: Open, free, and universal communication protocols should make data objects accessible by their identifier. Further, metadata should be archivable and available even when the corresponding data is not available.
  • Interoperable: Data should be interoperable with other data assets. This can be achieved by using formal, accessible, shared, and broadly applicable languages or vocabularies. Additionally, data should be referenceable from other data.
  • Reusable: To enable reusability, data should be equipped with usage licenses and detailed provenance and meet community standards.
Besides data, the authors have emphasised that these principles also constitute characteristics for data resources, tools, vocabularies, or infrastructures, and thus, they are not limited to data objects.
Recently, much efforts have been devoted to establishing these guidelines in the scientific landscape [17,18]. For example, Jacobsen et al. has presented a seven-step FAIRification workflow for generic data [17]. The authors have divided the workflow into a pre-processing, the actual FAIRification, and a post-processing phase, which are even further subdivided into several processing steps. As this workflow focuses on the FAIRification of generic data, Sinaci et al. developed a more specific workflow for healthcare data [18].
These works have been an inspiration for our on-boarding service development, paving the way for making institutions especially findable and also accessible for DA use cases. DA and its concepts will be presented in the next section.

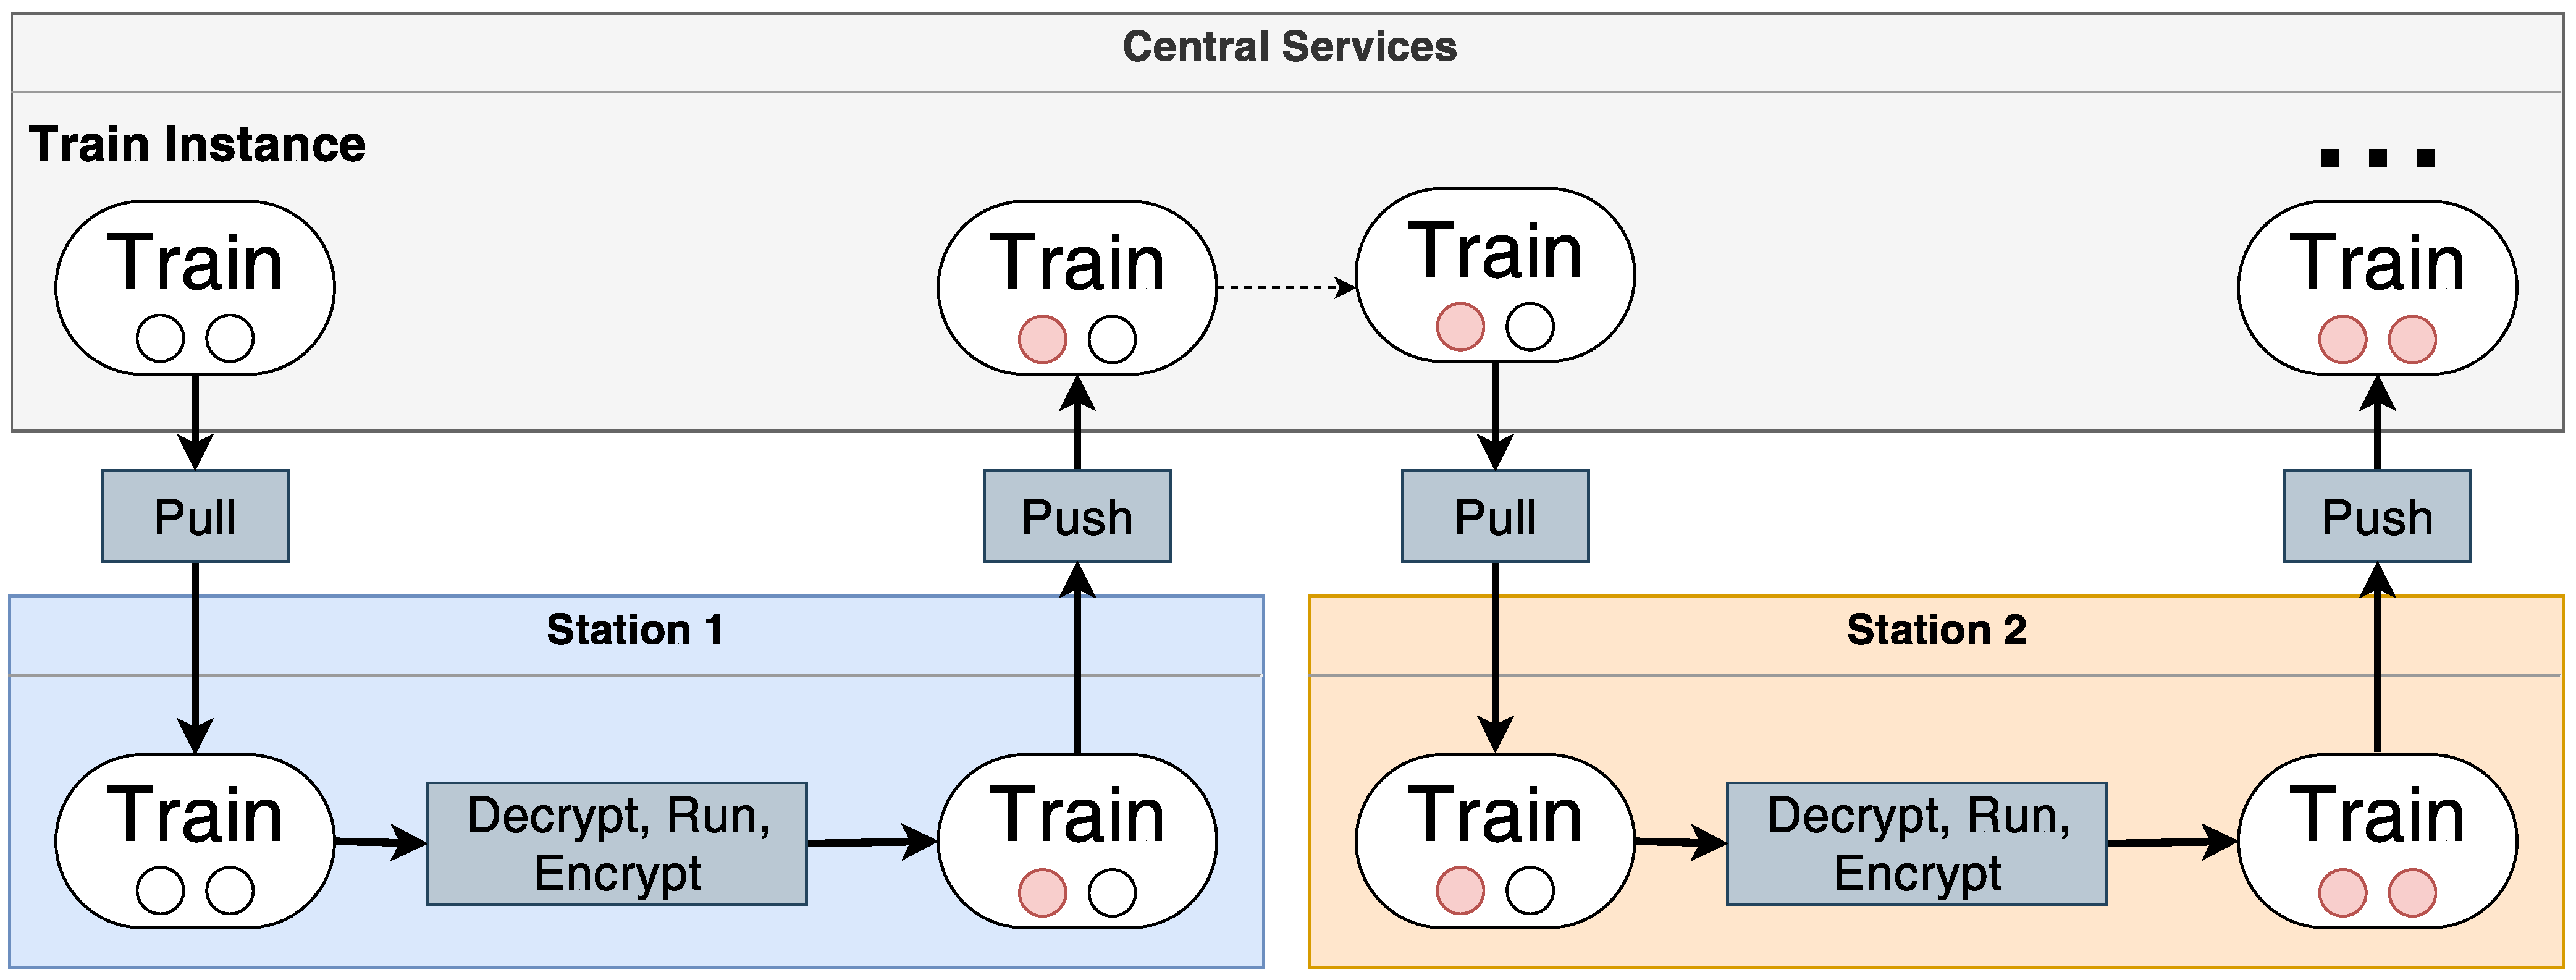
2.2. Distributed Analytics

DA constitutes a paradigm shift in conventional data analysis [7,9,10,11,12,13,14,15]. At its core, approaches for DA perform data analysis decentrally. This means that analysis-ready data sets stay within institutional borders, and only the analysis code and its analysis results are transmitted between each institution. Finally, after analysing each data set, the aggregated analysis results return to the analyst, and from the obtained information, insights can be derived. The analysis can include basic statistics, queries, or even complex Machine Learning (ML) training routines. Besides the differences in the used technology, DA implementations can differ in their execution policies. There exists an incremental or a parallel execution of the analysis [13]. For the first approach, the involved data premises are set in succession, and the analysis is sent from one institution to the other. For the latter one, replicas of the analysis are sent to each institution and executed simultaneously. The results are sent back and aggregated centrally. Several prominent representatives of DA have been introduced during the past years, and basically, all of them follow these abstract analysis strategies [12,19,20,21,22].
One of such approaches is DataSHIELD (DS), which is client-server based [20,23]. DS uses a custom R-library to execute the analysis requests decentrally. DS has been applied to multiple use cases already (https://www.datashield.org/about/publications, accessed on 18 February 2022). Second, secure multi-party computation (SMPC) has attracted attention due to its security guarantees [21]. Instead of libraries, SMPC is protocol and encryption-based. Dependent on the analysis to be executed, these protocols could be more or less complex. In this work, we primarily focus on another approach: The so-called Personal Health Train (PHT) [12,19,22].
The PHT is an infrastructure for privacy-preserving DA of patient-related health data. Figure 1 shows a high-level overview of the PHT. It consists of multiple components that can be roughly classified into centralised and client-side components. Clients—the so-called stations—are typically, but not necessarily, located in secured environments, i.e., behind a firewall at a specific institution which can be a research organization or even a company. Note that each institution can install as many stations as they want. The stations communicate with centralised components to retrieve analytical tasks, which are then executed on the client-side. Each station itself has access to the patient data, which is ideally already virtually integrated and homogenised. In Germany, patient data is currently homogenised based on the HL7 FHIR standard (https://www.hl7.org/fhir/, accessed on 18 February 2022) within the large Medical Informatics Initiative (https://www.medizininformatik-initiative.de/en/start, accessed on 18 February 2022). After an analysis ends, the station sends the results to the central components from which the next station can retrieve both the analysis algorithm (or better: script/program) and the intermediate results provided by previous stations.
Usually, PHT ecosystems are based on containerised applications using OCI-compliant (https://opencontainers.org, accessed on 18 February 2022) technologies such as Docker (https://www.docker.com, accessed on 18 February 2022) [19,22]. Therefore, the train represents an image encapsulating the algorithm code. This has the advantage that the analysis code is programming language independent and hence increases the flexibility. The PHT has already been applied to several data use cases in the healthcare domain, such as skin lesion analysis, radiomics, or lung cancer [14,15,24].
As all the above-mentioned methods foster collaborative data sharing, there is the indispensable necessity to technologically on-board each participating party and enable access to the network. Hence, we present on-boarding procedures of PHT-related infrastructures in the next section.

2.3. On-Boarding

To participate in a collaboration, one must set up all (technical) requirements to comply with the present conditions of this collaborative network. In this work, the mentioned collaborative network is the DA ecosystem, and the on-boarded object is the data-sharing institution. We interpret the term on-boarding as the process of providing all necessary installation materials and the installation itself. Finally, the goal of the on-boarding workflow is the unrestricted and secure operability of the pre-existing network, including the new institution. Having the definition in mind, we present already developed on-boarding workflows of known DA technologies in the following.
In order to on-board a so-called data computer in DS, researchers need an Opal server, which is open-source and online (https://opaldoc.obiba.org/en/latest/cookbook/r-datashield.html, accessed on 18 February 2022) available [20]. Gaye et al. state that the configuration of a DS does not require much IT expertise, and the installation can be conducted with no IT background [20]. Other possibilities (https://data2knowledge.atlassian.net/wiki/spaces/DSDEV/pages/1142325251/v6.1+Linux+Installation+Instructions, accessed on 18 February 2022) involve the deployment of a virtual machine hosting the DS functionalities and the manual input of IP addresses, which might pose challenges for non-technicians. Further, a connection to the DS client has to be established via REST over HTTPS, and the needed R libraries for DS applications have to be installed via a command-line interface (CLI) until the new station is ready for use [23].
The on-boarding process for a vantage6 station, a PHT-inspired technology, (so-called nodes) requires a priorly installed Docker daemon since vantage6 is a container-based infrastructure [22]. Moncada-Torres et al. state that the station administrator uses a CLI to start and configure the node’s core, which can be done using the well-established python package installer pip (https://docs.vantage6.ai/installation/node, accessed on 18 February 2022) [22]. Vantage6 further provides a CLI wizard for the node configuration (https://docs.vantage6.ai/usage/running-the-node/configuration, accessed on 18 February 2022), where all necessary information has to be provided by the user-such as server address, API key, or private key location for the encryption. Regarding the security protocol, the mandatory API key has to be exchanged between the server administrator and node manager. Vantage6 combines multiple nodes within one institution as organisation (https://docs.vantage6.ai/usage/preliminaries, accessed on 18 February 2022). According to their documentation, all nodes in the same organisation need to share the same private key. Therefore, also the private keys have to be exchanged separately. When the node starts, the corresponding public key of the private key is uploaded to the central server, which concludes the installation.
Hewlett Packard (HP) has its own Swarm Learning (similar to DA) framework for the analysis of decentralised data [25]. Their on-boarding manual (https://github.com/HewlettPackard/swarm-learning/blob/master/docs/setup.md, accessed on 18 February 2022) states a sequence of Docker commands to be executed until the software is deployed. Lastly, a mandatory licence installation has to be conducted. In their whitepaper (https://www.hpe.com/psnow/doc/a50000344enw, accessed on 18 February 2022), they state that the on-boarding is an offline process and future participating parties need to communicate beforehand to find mutual requirements of the decentralised system.
Another framework, called Flower, has been proposed by Beutel et al. [26]. They provide wrapper functions for the communication between each data node. Similar to vantage6, the necessary software can be downloaded using the pip installer (https://flower.dev, accessed on 18 February 2022). To connect clients with the server, the wrapper functions have to be implemented by the station admins such that a mutual encryption policy and a customisable communication configuration can be established.
A more use-case-specific and ad hoc on-boarding workflow has been presented by Deist et al. [15]. They have made installation manuals online available (https://github.com/RadiationOncologyOntology/20kChallenge/wiki/Tutorial, accessed on 18 February 2022) and have provided remote support for the establishment of their data sharing network to perform distributed learning on 20,000+ lung cancer patients.
After reviewing the current state-of-the-art of DA on-boarding workflows, we have detected several potential shortcomings, which we have classified into three categories. First, some workflows do not contribute to FAIR data management or FAIRification of DA infrastructures as participating parties are not necessarily findable, for example. Therefore, each infrastructure acts as a blackbox to its users since the participating parties are not visible. Consequently, the connection information or other metadata for an institution has to be communicated through other channels to access the data. Additionally, there is a lack of automation in these workflows. Especially, the manual key exchange mechanism might pose some security risks if these are distributed within third-party channels. Further, the needed detailed configuration for some components (e.g., IP addresses, ports, certificates, secrets) might be another obstacle for non-technicians to set up a connection to the central services. Lastly, the installation or deployment should support the acceptance of the system-particularly if CLIs are involved. In this work, we address all these mentioned potential shortcomings (FAIRification, automation, and installation) and propose an on-boarding process for DA infrastructures. We hypothesise that such a seamless on-boarding contributes to an increased acceptance of the software and by fostering the FAIR principles from the very beginning, it accelerates the execution of collaborative clinical studies. In the next section, we present the workflow in more detail.

3. On-Boarding Process for Distributed Analysis

Based on the above-mentioned flaws, we formulate the following features our on-boarding service should meet:
  • FAIR: The technical solution should be an enabler for FAIR data management. Participating institutions should be findable and equipped with a basic set of metadata.
  • Secure: The mandatory key exchange mechanism has to establish a baseline level of secure communication. It should be automatically performed in dedicated channels with no user interaction to reduce the danger of security breaches.
  • Configuration time: The configuration time, which might be a bottleneck, should be significantly reduced and automated.
  • Usability: The on-boarding service should require less technical knowledge and be based on well-established technologies such that the deployment at each data premise requires less manual effort and technical expertise.
For the development of the on-boarding service, we need a DA-enabling reference architecture. At this point, we refer to one of our previous works, which presents a DA architecture following the PHT paradigm [19]. This architecture has similar components (server and client) as discussed in related work (Section 2.2) and is, therefore, suitable for the workflow development. However, before we discuss the secure on-boarding process, we sketch all important components of our reference architecture in order to provide a basic understanding to the reader.

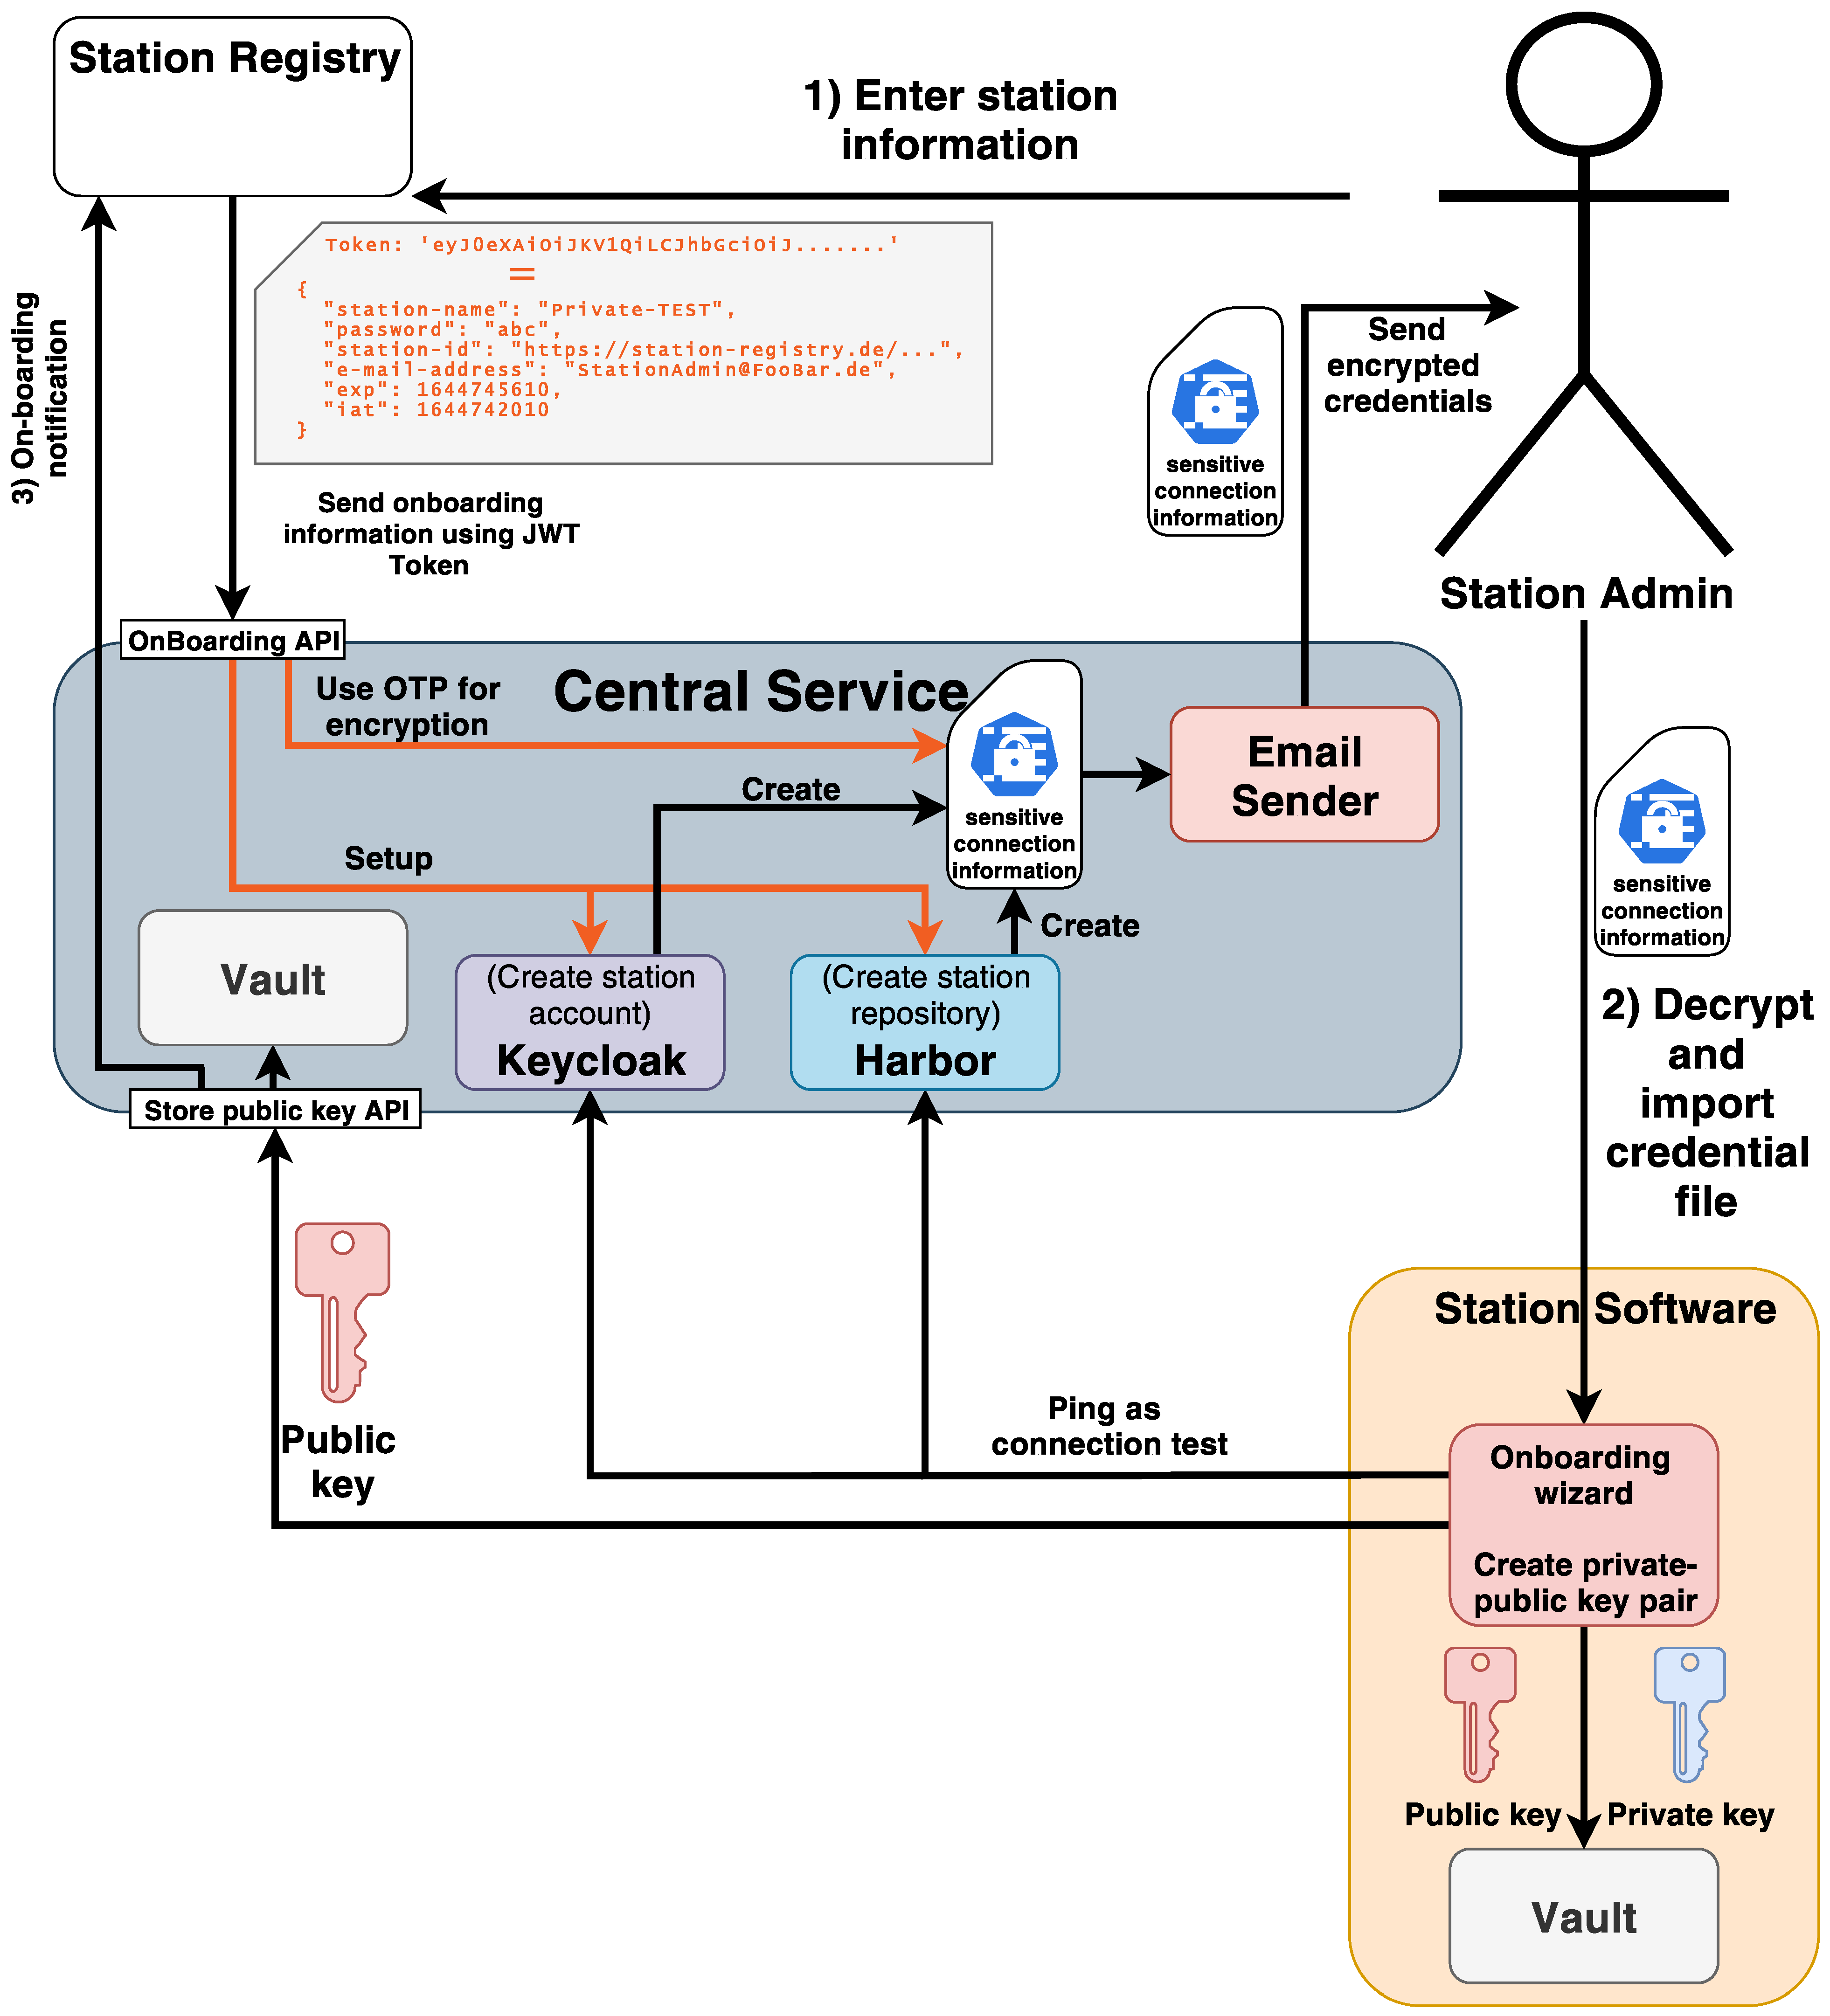
3.1. Central Service

The central service (CS) component orchestrates the train images and performs the business logic. Each station has a dedicated repository for the trains such that each image can be pulled and pushed back after the execution. In the reference architecture, this repository is managed by an open-source container registry called Harbor (https://goharbor.io, accessed on 18 February 2022). To gain access to this repository, each station needs access credentials, which are provided by another component called Keycloak (https://www.keycloak.org, accessed on 18 February 2022)—an identity and access management (IAM) provider. Additionally, Vault (https://www.vaultproject.io, accessed on 18 February 2022) is used to securely store sensitive information and secrets such as the public keys of each station. Consequently, in order to participate in this infrastructure, it is required to distribute the Keycloak credentials and the Harbor repository connection information to each station. In return, the station has to send its public key to the CS such that it can be saved in the key store (Vault) for later usage.

3.2. Station

The station software (client) is a fully-containerised application and can be accessed using a browser. Hence, a mandatory requirement is a Docker engine running on the host operating system. The installation of such an engine (https://www.docker.com/get-started, accessed on 18 February 2022) does not differ from a basic execution of a usual installer program, and therefore, no in-depth knowledge is needed. Essentially, the client software works as a remote control for the underlying Docker engine to execute the downloaded train images, which encapsulate the analysis code. To bring a station to life and set up the connection to the CS (see Section 3.1), it needs the connection credentials from the Keycloak instance and the Harbor repository address. In addition, it has to create a private/public key pair. The latter one has to be transmitted to the CS.

3.3. On-Boarding Workflow

After briefly presenting our reference architecture and its relevant components, within the next sections, we explain our on-boarding process, which has been built upon this infrastructure. Note, for the reason of simplicity, in our scenario, each institution has exactly installed one station (client). However, our approach still enables the installation of multiple stations per institution. A top-level view of the concept has been depicted in Figure 2.

3.3.1. Station Registry

As the FAIR principles have suggested (see Section 2), to make a digital asset (in our case: the station) findable, it should have an identifier and should be findable in a searchable resource. Therefore, we have decided to extend the architecture with a so-called station registry. The station registry is the leading component of the on-boarding process.
It is a web-based application that hosts all available stations characteristics and their correspondence to the institution they belong to. In this way, it is similar to the Domain Name Service (DNS) of the internet and the authority for providing a list of available stations. The CS (and other software as well) can then reuse the information about available stations to let the scientist configure the route an analysis task should take.
Therefore, the station registry is the place where new stations can be added as well as available stations are de-registered before they will be de-installed in their corresponding institutions. We combine the action to register a new station with the on-boarding process. A status (online state) reflects whether a station is already available and can be included in a distributed analysis. While all users (including any software clients) can list available stations, only registered users can modify this list, i.e., adding new, deleting available and modifying characteristics (e.g., station name) of stations.
To register a station, the station admin has to input basic information about the station, such as a responsible person, name, and contact information. Further, the station is assigned to an organisation or consortium, and one can select whether the station is publicly available or private (within the organisation). We have carefully taken into consideration that the described data model is easily extendable.
Finally, an on-boarding endpoint of a specific DA infrastructure can be selected to on-board the station to this ecosystem. Therefore, we assume that each DA ecosystem provides an on-boarding interface, which can be triggered by the station registry. This further makes our registry compatible with multiple ecosystems by simultaneously keeping all necessary information about the stations in one place. The way we have designed such an on-boarding procedure in the CS is part of the next section.

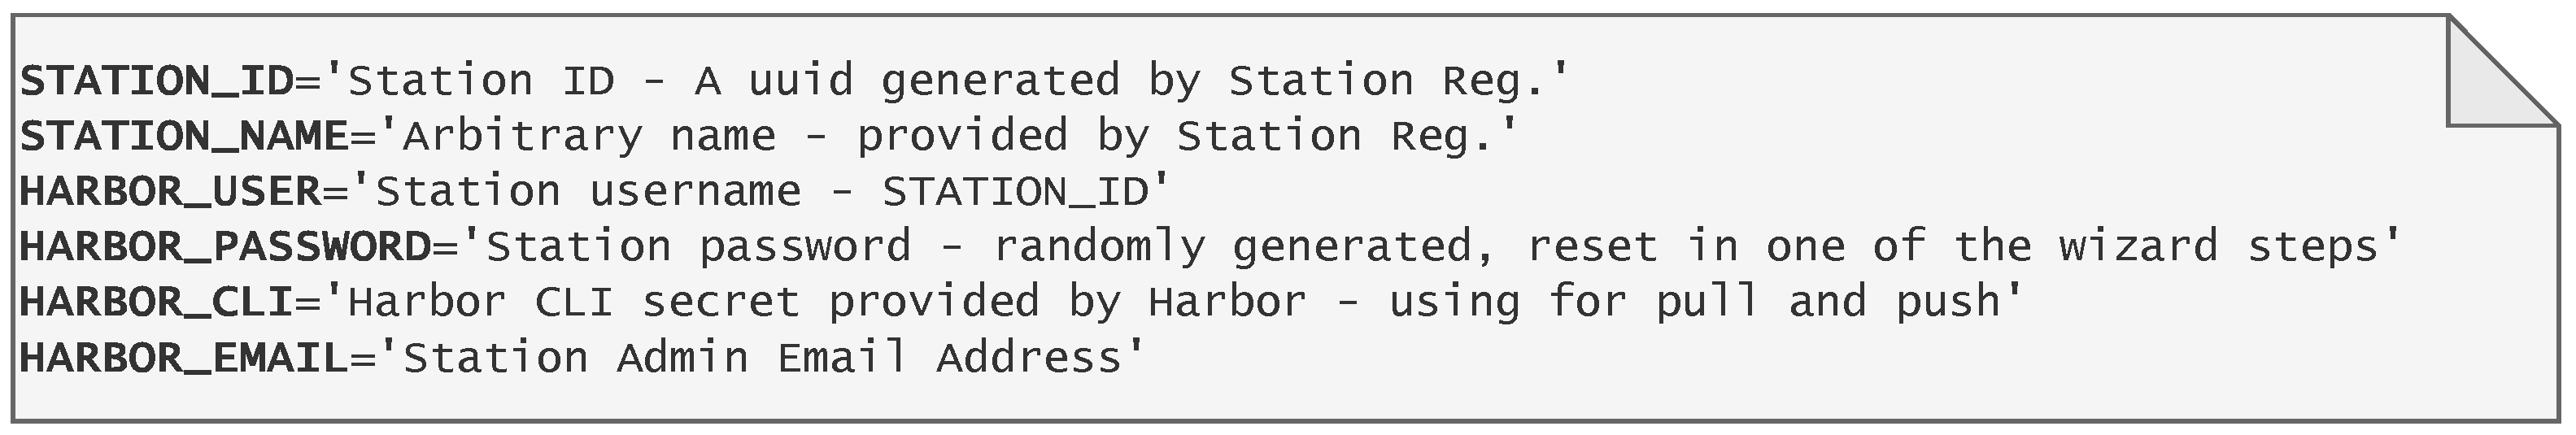
3.4. Secure Station On-Boarding

After presenting all involved components in our infrastructure, we conceptualised the secure on-boarding protocol (see Figure 2) according to some assumptions:
1.
Authorised person: We assume that each (imminent) participating institution has a dedicated and authorised person—the so-called station admin—who is responsible for the station deployment.
2.
Semi-trusted CS: During the on-boarding process, the CS orchestrates and encrypts the sensitive information (e.g., connection parameters) to the requester after creating them.
3.
Network settings: All network prerequisites have been fulfilled. This especially includes the firewall rules and port configurations.
4.
Base software: As we have mentioned earlier, the station software requires an up and running Docker engine. Since the installation of this prerequisite is negligible for the on-boarding itself, we assume that the installation has been conducted beforehand.
As we have mentioned in Section 3.3.1, the initial component for the station admin is the station registry. After providing the necessary information, the station registry generates a JSON Web Token (JWT-https://datatracker.ietf.org/doc/html/rfc7519, accessed on 18 February 2022), which is a web standard to exchange identity information between two parties, e.g., an identity provider (station registry) and a server or client (CS). Besides a header, a JWT contains a payload and a signature. An example JWT and its plain text is given in Figure 3.
In our setting, the payload contains the (meta-) information about the institution. Using the signature, the CS can verify the sender of the JWT and can perform an integrity check such that it is ensured that the message has not been modified during the transmission. After this first security layer, the CS can initiate the on-boarding by creating all necessary requirements. Note that in our case, the CS creates connection credentials for the station to operate with the CS. For this, it communicates with the IAM (Keycloak) and the repository management system (Harbor) to collect the corresponding information: connection credentials and repository address. Subsequently, the CS merges this information into a single file (configuration file). We have illustrated the configuration file in Figure 4.
At this point, we encrypt this file with a so-called one-time password (OTP), which has been provided by the station admin via the station registry. The OTP is transmitted with the JWT, which is encrypted via HTTPS. The purpose of the OTP is to bind the station credentials to the initiator of the on-boarding procedure, which introduces another layer of security and meets Assumption 1 above. Only the on-boarding initiator is able to decrypt this file. This design decision is based on our experience that asynchronous encryption (private-public key) introduces another challenge to provide a key pair for non-technicians. After the encryption, we send an on-boarding email to the station admin. The CS attaches the encrypted configuration file and station software installation scripts to this email. Since emails are part of daily businesses, we hypothesise that the usability benefits from the distribution of the configuration file using such transmission technology. After receipt of the email, the station admin executes the installation script. Since the station software is a containerised application, the local Docker engine has to download the corresponding images from publicly available repositories and has to start the instantiated containers. The duration of this process depends on the present bandwidth and power of the host computer. If the installation has been finished, the station software is accessible via a browser. We extend the base station software with a configuration wizard, which appears on first start (screenshots available online: https://github.com/sawelt/breastCancerOnboardingService, accessed on 18 February 2022). This wizard is a step-by-step guide to configuring the station and bringing it to life. First, the station admin is asked to provide the received configuration file, which can be uploaded to this tool. In order to decrypt this file, the OTP has to be entered. If the input is valid, the user is asked to set a new Keycloak password since the default password is only temporary. The wizard then automatically sets all necessary configurations, including connection credentials and parameters. In the last step, the station admin can create a public/private key pair using the station software or can provide both by using a third-party tool. After this step, the keys are stored in the local Vault engine, and the public key is sent to the CS via another API, where the public key is put into the CS Vault such that it can be used for the encryption of the analysis tasks. To guarantee the integrity of the station key, the key is signed by the private key of the station. The signature ensures that the public key of the station has not been manipulated during the transmission. Finally, the CS informs the station registry about the successful on-boarding, and the indicator for station availability in the station registry turns from red to green.
After the implementation of this procedure, we evaluate and test our work with a real-world use case. For this, we aim to conduct a data use case for DA, which is the second main contribution of this work. The use case is part of the next section.

4. Distributed Model Training in a Clinical Study

With this secure on-boarding procedure, we invited several institutions around Germany, in particular, the University Medical Centers of Aachen (UKA), Cologne (UKK), and Leipzig (UKL), as well as the University Medical Center Goettingen (UMG), Mittweida University of Applied Sciences (HSM), and the Institute for Medical Informatics, Statistics and Epidemiology (IMISE) at the Leipzig University, to jointly run an analysis procedure. We firstly introduce the data, describe the method and the setup before we show and discuss the obtained results. Note that we have made all experimental artefacts and additional data visualisations online available (https://github.com/sawelt/breastCancerOnboardingService, accessed on 18 February 2022). Note that this study showcases an exemplary clinical study, which has been conducted to evaluate the mentioned on-boarding service with real-world institutions. The application of hyper-parameter tuning or alternative predictive models has played a minor role in this study.

4.1. Data Set and Characteristics

For a proof-of-concept, we reused the publicly available data set Diagnostic Wisconsin Breast Cancer Database. This data set contains data samples taken from 569 patients. While the sample data is anonymized, i.e., it does not contain characteristics allowing to identify the patient, each sample is differentiated from others and, hence, identified by using a unique identifier. Besides the pseudonymized identifier, the samples are described by 31 attributes (also called features), including the diagnosis (malignant or benign) and the morphological characteristics of cell nuclei, e.g., radius, texture, perimeter, area, smoothness, compactness, concavity, number of concave portions, symmetry and fractal dimension. These features have been derived from digitized images taken by fine needle aspirate (FNA) of a breast mass. Instead of the raw images, this descriptive data is provided and available for further analysis and algorithm development. All samples are described by a cancer state feature, classifying the samples set into 357 benign and 212 malignant samples. Taking the goal of the analysis to classify samples into both classes, benign and malignant, using the provided sample features, this cancer state feature is the label that is used to train and evaluate the developed classification model.
We initially conduct an exploratory data analysis on the full data set to obtain a first impression of the dependencies between each feature. Since each data item is described by a 30 dimensional feature vector, we applied a principal component analysis (PCA) on the full data set to describe the data with a subset of features by simultaneously retain as much information as possible. After the PCA, we sort the principal components (PC) according to their information values (variance) and calculate the cumulative variance score as depicted in Figure 5. As Figure 5 shows, the first three PCs are sufficient to describe 80% of the variance in the initial dataset. The first three PCs are: concave points_worst, fractal_dimension_mean, and texture_worst. The threshold of 80% has been chosen arbitrarily for visualisation purposes. For a better overview, we have exemplary plotted each data point using the t-SNE algorithm according to the first three PCs in Figure 5 [27]. Additionally, this plot shows the data and feature distribution across our network of six collaborating institutions. The actual data distribution procedure is presented in the next section.

4.2. Setup

We invited six institutions (UKA, UKK, UKL, UMG, HSM, IMISE; see above) for participating in the analysis of the introduced data set. Each institution agreed and set up a single station following the on-boarding process described earlier. The PHT stations are used in the following to analyze the data in a distributed way and use this setting for different experiments.

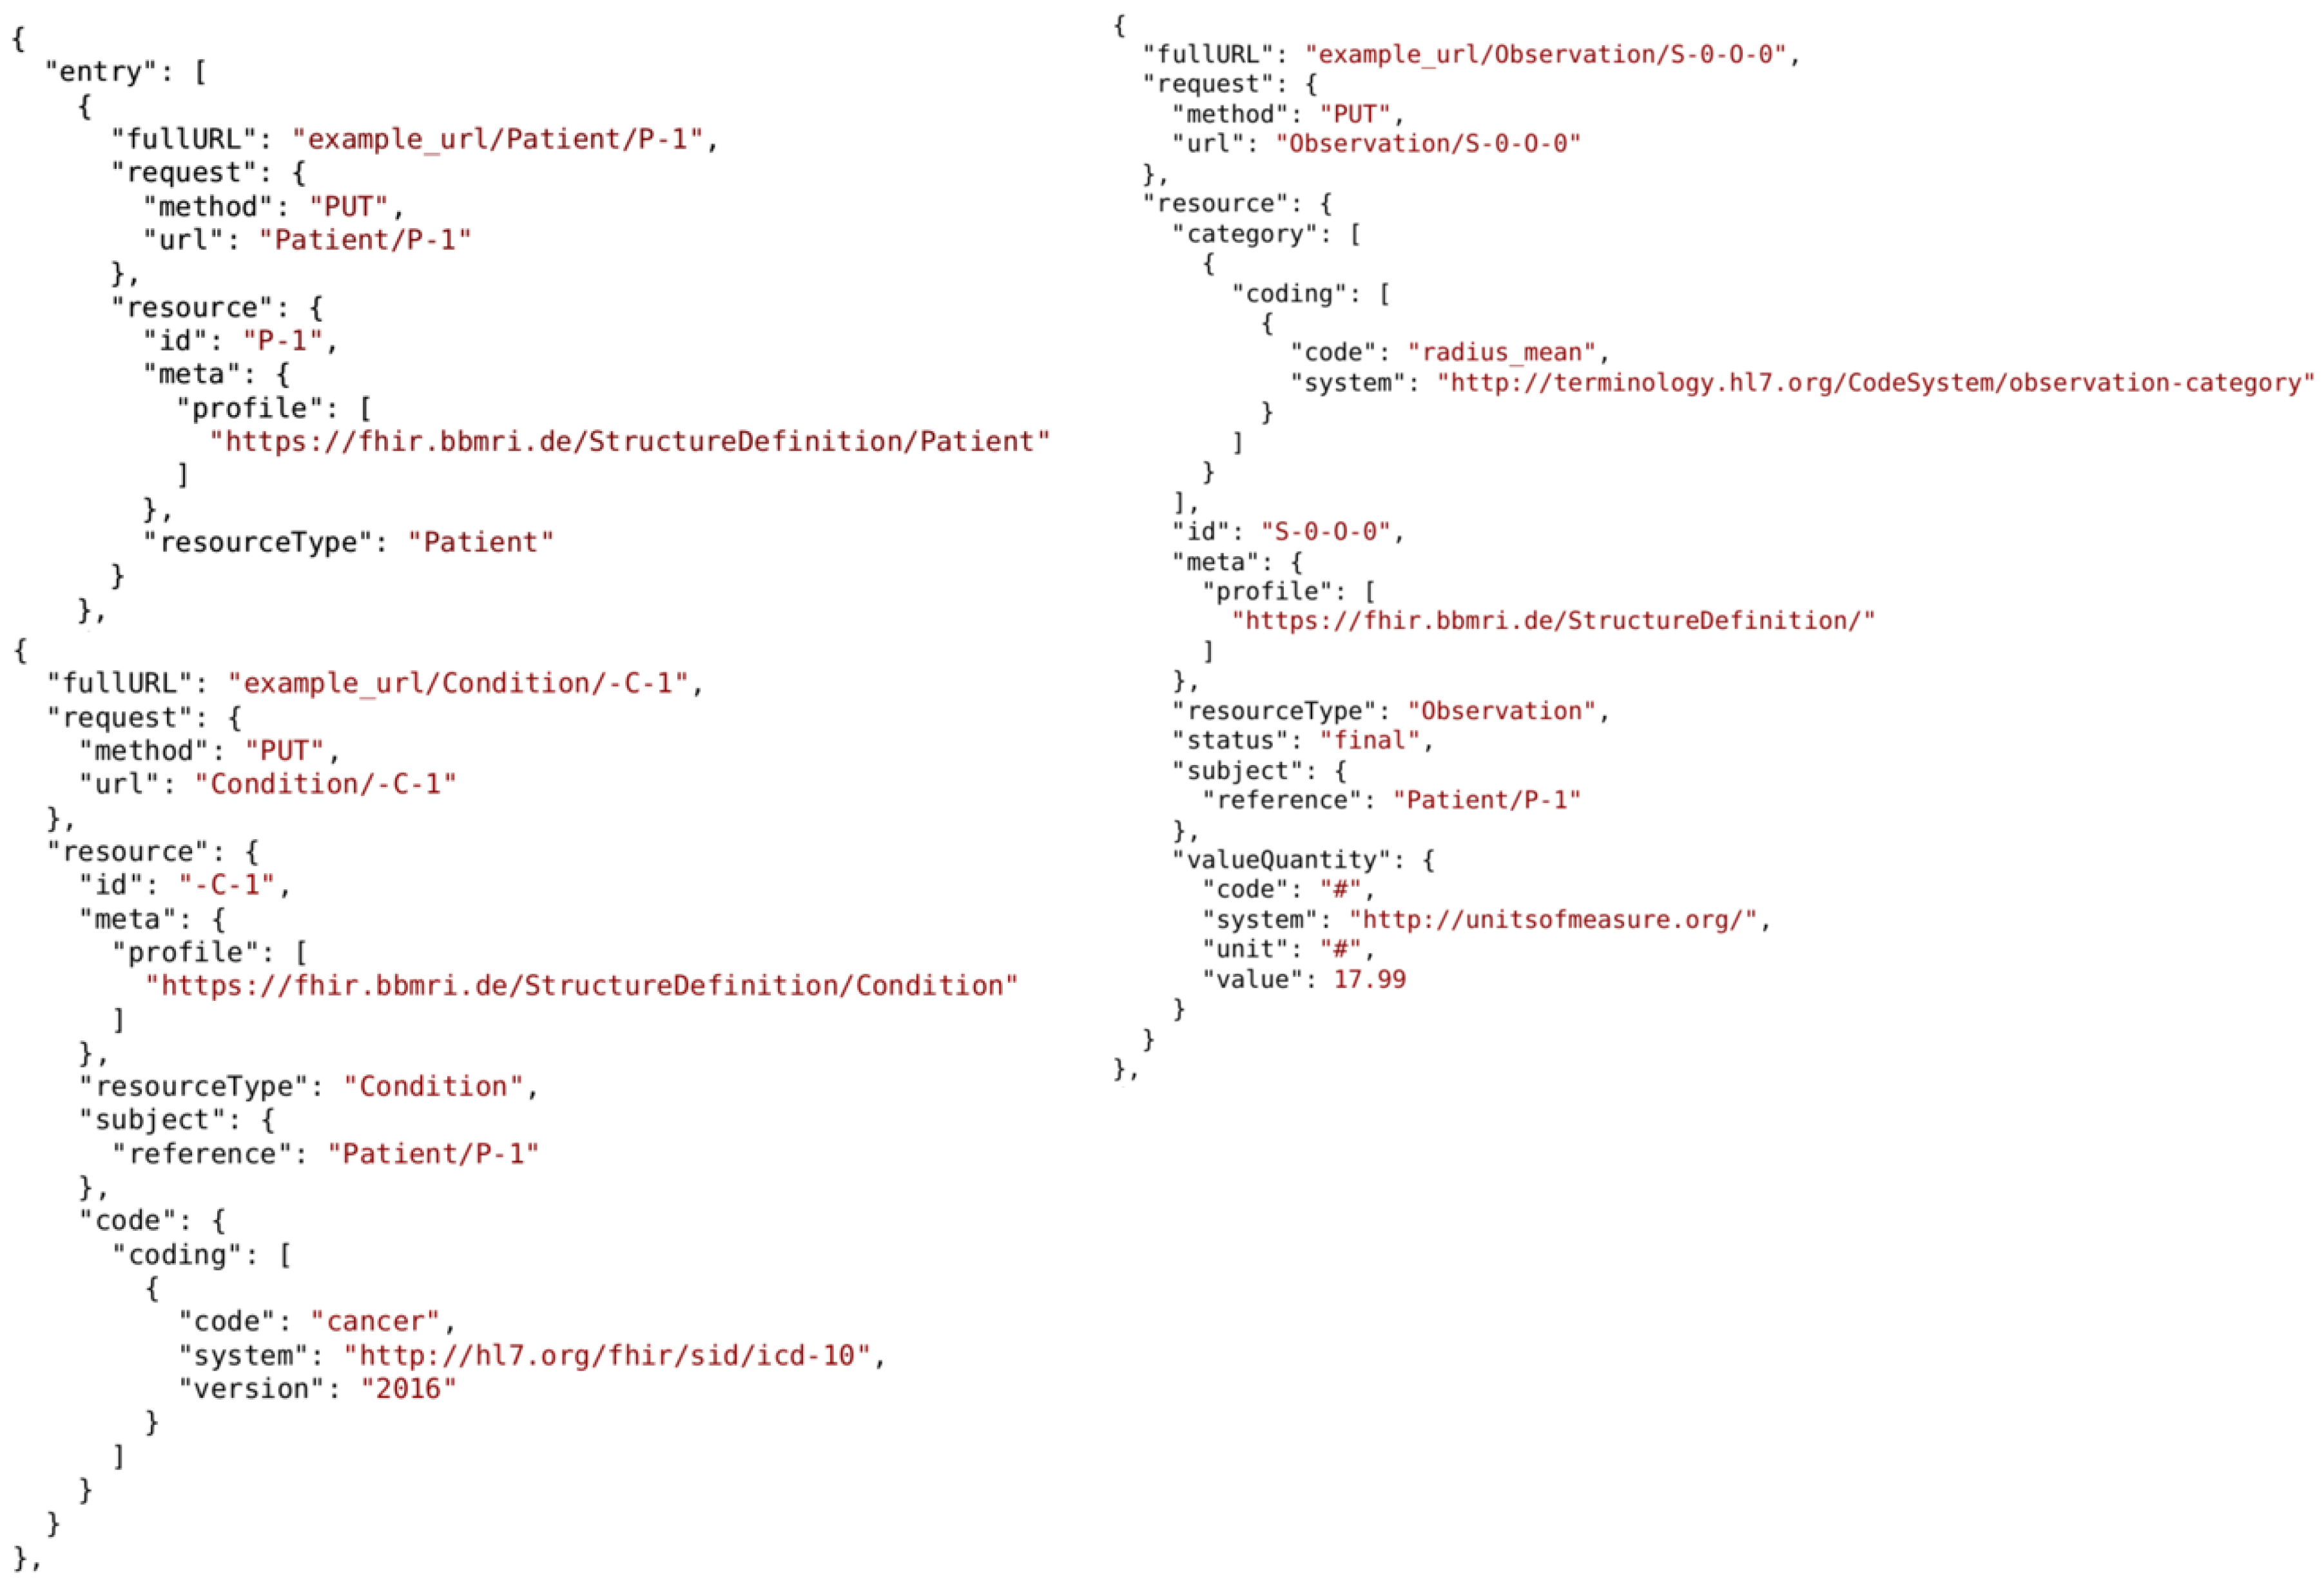
4.2.1. Data Provision

Since the Fast Healthcare Interoperability Resources HL7 (FHIR) standard is currently a well-known format for clinical structured (tabular) data and is more and more used for managing patient care data for research purposes, we set up the Blaze FHIR server (https://github.com/samply/blaze, accessed on 18 February 2022) and attach it to the PHT station at each institution [28]. The FHIR server at each institution is used to manage a specific portion of the entire data set. Next, we prepared and transformed the data set into FHIR bundles, as shown in Figure 6, which are then loaded into the FHIR servers. The FHIR bundle contains of three instances (Patient, Condition, and Observation). For each row, we create a patient, and a condition instance, and into the condition we write the label as cancer or non-cancer in the code. Furthermore, we link the condition to the patient within the subject attribute. The features and their values are written in the observation instance, i.e., for each patient, there are 30 observations. The values are in the resource instance under “valueQuantity”, and the column name is located under “category” and “code”.

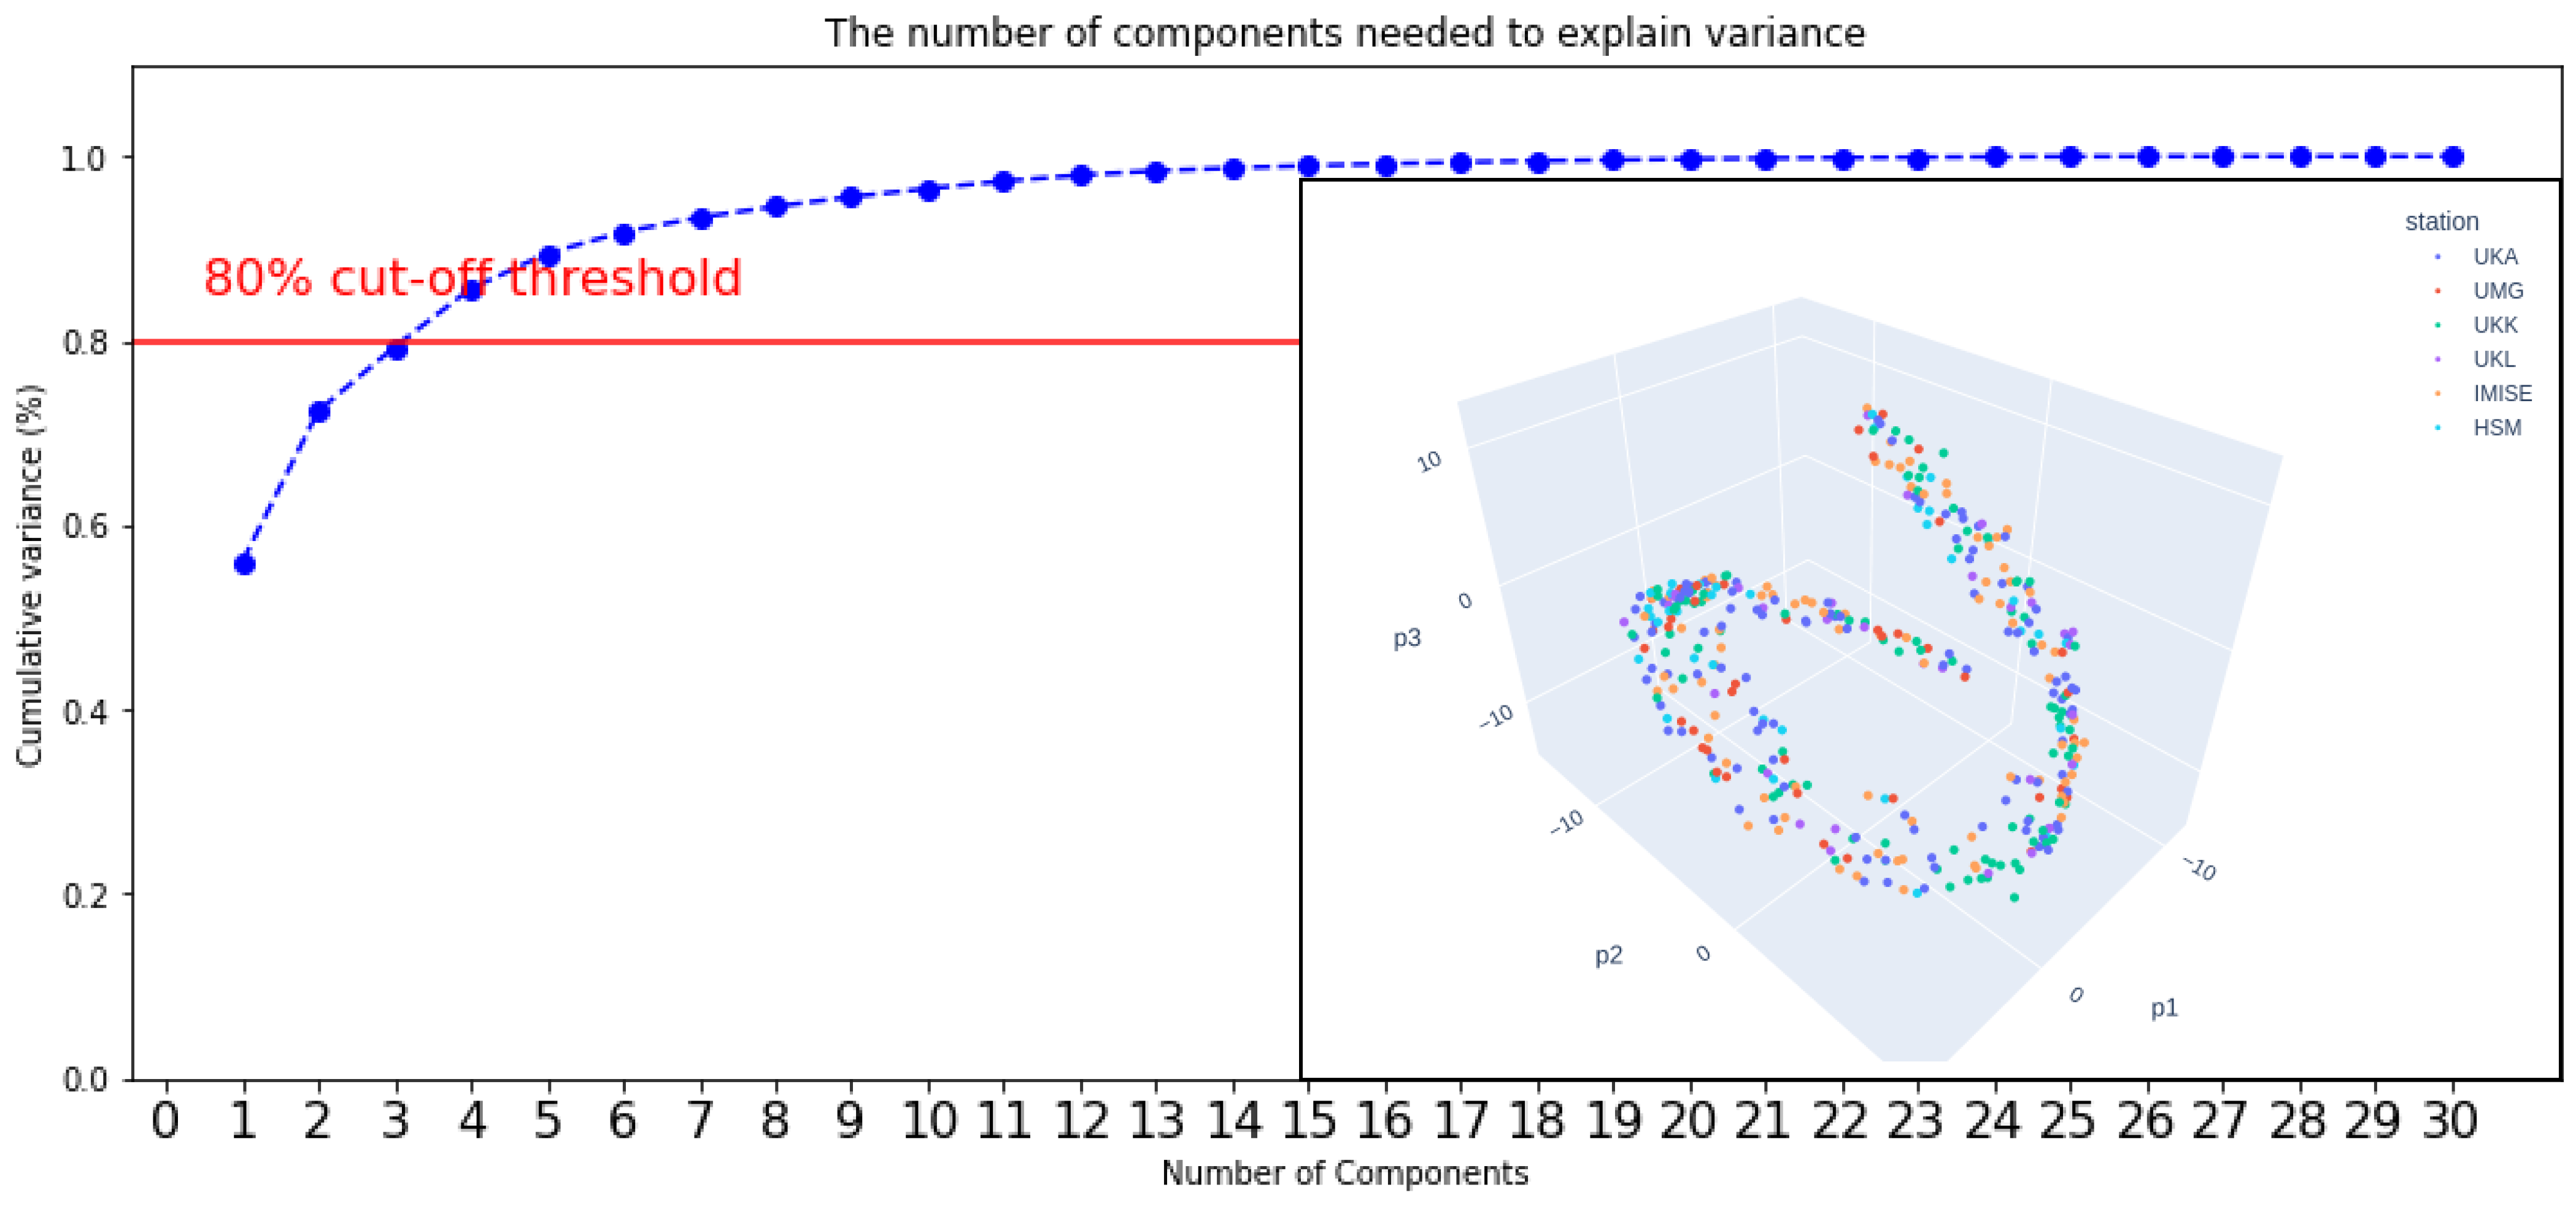
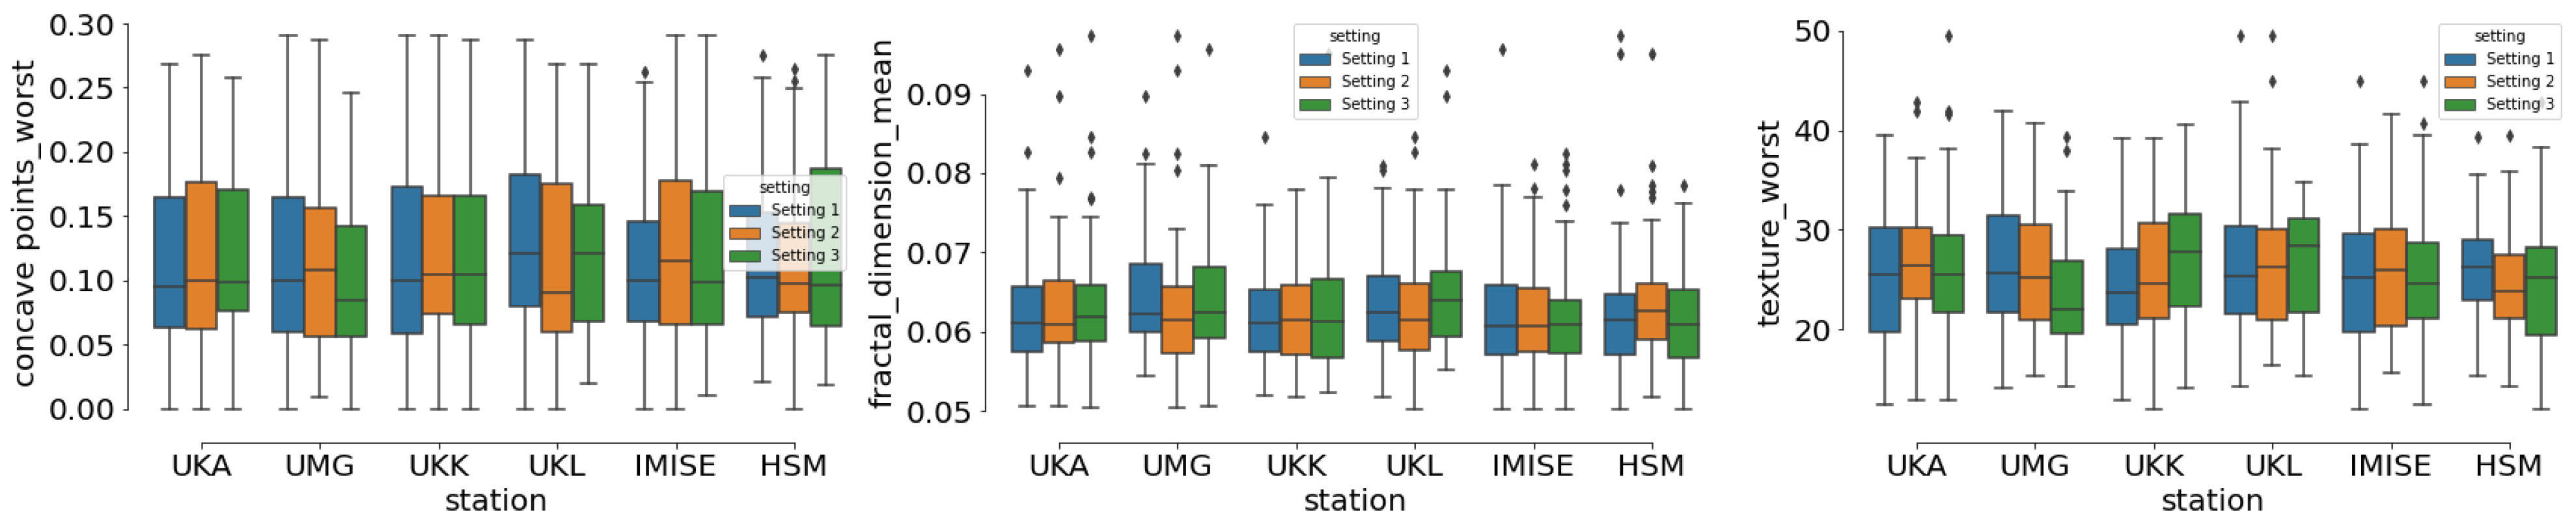
4.2.2. Data Distribution

In order to evaluate all generated models with the same data set, we first split the entire data set into a training (70%) and a test set (30%). This split is performed randomly without balancing cancer state classes over both sets. The training set is then distributed among these six Germany-wide institutions (see above). Taking distributions from an ideal scenario to a more realistic non-IID environment into account, we create three distribution settings (see Figure 7): equally-sized and balanced class distribution (Setting 1), equally-sized and unbalanced class distributions (Setting 2), and unequally-sized and unbalanced class distribution (Setting 3). Table 1 shows the distribution of cancer state classes and frequency of sample descriptions about training and test set as well as within the training set over the six stations.

4.3. Methods

One of the main obstacles of training models on the distributed breast cancer database is the insufficient training data on each site. To tackle this problem, we investigate the effectiveness of the model training on synthetic data. Our goal is to compare the performances of models trained on real or synthetic data and investigate whether the synthetic model training can replace its real counterpart in our setting. Especially, since the usage of synthetic data can, to some degree, resolve privacy or legal issues. The generation of synthetic data is carried out via a Generative Adversarial Network (GAN)-based architecture [29]. GAN-based algorithms consist of a generator and a discriminator that attempt to generate synthetic data and discriminate between synthetic and real data in a cyclic (adversarial) process. The starting point is real data for the framework. The generator produces synthetic data from noisy data, and the discriminator tries to distinguish between the data outcome of the generator and the real data. The output of the discriminator is used to improve the performance of the generator. In our case, we use a GAN extension named conditional GAN (CGAN) [30]. Here, we use the information about the labels as secondary information for the generator and discriminator to improve the quality of the synthetic data. The CGANs are created and trained with 5000 iterations separately at each station on the available local training data and then generate the synthetic data independently. To investigate whether the quantity of synthetic data has an effect on the ML model performance, we conducted experiments using synthetic data in different quantities, i.e., the same size as available real data at each station (S) and 1000 synthetic data samples at each station (S1000).
For all analyses, we developed a logistic regression model with a 64-dimensional hidden layer activated by the sigmoid function to distinguish malignant from benign breasts (M = 1, B = 0). The stochastic gradient descent (SGD) optimizer with a learning rate of 0.01 and weight decay of 0.0005 is used for training the ML model. For comparison, we run the single-site training (SST—training of one model at each station only), institutional incremental learning (IIL—training of one single model and visiting each station once) and cyclic institutional incremental learning (CIIL—training of one single model and visiting each station multiple times periodically) [13]. We trained the model for 600 epochs in SST, while 100 epochs per institution in IIL, and 10 cycles and 10 epochs in CIIL. All algorithms have been produced using the Python (version 3.6) programming language. The ML model is implemented using the PyTorch framework and we additionally utilized libraries SyncFHIRClient (https://github.com/beda-software/fhir-py.git, accessed on 18 February 2022) for FHIR queries.

4.4. Results

To quantitatively measure the performance, six common metrics are used: accuracy, balanced accuracy, precision, recall, F1-score and Mathews correlation coefficient. Accuracy describes overall systematic errors but can be biased by quantity skewness of malignant and benign cases. Balanced accuracy is an arithmetic mean of the accuracy of both classes existing in the use case. Precision (positive predictive value) presents the proportion of malignant predictions that was actually correct, while recall (also known as sensitivity) indicates how many of the malignant cases were detected. F1-score is the harmonic mean of the precision and recall. Another measurement for examine the quality of a binary classification is the Matthews correlation coefficient. Table 2, Table 3 and Table 4 show the results in three distribution settings from ideal scenario to more practical scenarios in the real world, respectively. We have additionally performed the experiments four times and build the average and the corresponding standard deviation. However, we have not found any recognisable variation in the experiment outcomes since the deviations are negligible (Table 2, Table 3 and Table 4).
Setting 1. For SST, the model trained on real IID data has achieved on average (standard deviations in brackets) 92.5 (±0.006)%, 91.2 (±0.007)%, 91.3 (±0.009)%, 89.3 (±0.009)%, 90.0 (±0.008), and 84.5 (±0.013) in accuracy, balance accuracy, precision, recall, F1-score and Matthews correlation coefficient, respectively, and we observe similar performance for IIL and CIIL (Table 2). Nevertheless, we experience an inconsistent relationship between precision and recall, when synthetic data is involved (S and S1000). In some cases, the precision is significantly higher than the recall. We explain this behaviour with the information abstraction ability of the synthetic data generator. The models trained on the synthetic data might lose some information, therefore, cannot detect all positive samples in the ground truth (test set). The resulting model has a more strict behaviour, therefore, it predicts more carefully, which yields a small false-positive rate (high precision) but a higher false-negative rate (low recall).
Setting 2. With the increase in realistic non-IID environment, we can observe the performance degradation and higher variances in SST, i.e., 91.4 (±0.007)%, 91.1 (±0.007)%, 88.7 (±0.01)%, 90.1 (±0.01)%, 88.7 (±0.009)%, 82.6 (±0.014)% in Table 3 (Setting 2). Furthermore, CIIL outperforms IIL in the non-IID environment although IIL has a higher precision (100%) on real-world data than CIIL. However, the relatively low recall of 78.9% indicates a higher number of false-negative predictions and a reduced generalisation ability while the model trained with CIIL is more stable with respect to both quality metrics. Regarding the experiments involving synthetic data (S and S1000), we see a more stable behaviour in the model performance with respect to the recall. Due to the unbalanced class distribution, the precision highly varies in case (S). This indicates the influence of the class distribution on synthetic data generation. However, the more synthetic data is involved (S1000), the more stable is the model’s precision.
Setting 3.Table 4 shows the results of our third setting: 93.0 (±0.008)%, 92.5 (±0.008)%, 91.1 (±0.012)%, 90.8 (±0.012)%, 90.6 (±0.010)%, 85.4 (±0.016)% which means that the performance of model is highly dependent on the underlying data quality. IIL and CIIL perform similarly. When we involve synthetic data, IIL produces a better model than CIIL. Further, we observe the same stability in recall as in Setting 2 (Table 3)-with one exception SST (UMG). Additionally, we detect the same varying behaviour in precision (S). If we train the model on more synthetic data (S1000), we also find a continuous precision score of around 80%, which is less fluctuating.
Overall, synthetic data can not achieve the same results as real data while training on a single site (SST). For IIL and CIIL, the model trained with synthetic data in a large generation size achieved higher accuracy, recall and F1-score but lower precision, especially in a non-IID environment. Our experiments show that the data generation is also influenced by the present data bias at each institution and cannot alleviate its influence on the model training. Nevertheless, the more synthetic data is involved the more stable the model performance across each institution. In the next section, we will discuss the role of the on-boarding service in this study.

5. Discussion

In this section, we discuss our insights about the on-boarding procedures derived from our case study (Section 4). After revisiting the FAIR principles in the next Section 5.1, we focus on the on-boarding routine itself Section 5.2. Its potential limitations are discussed in Section 5.3.

5.1. FAIRification

As we have mentioned above, one of our main objectives has been to contribute to the FAIRification process of DA infrastructures. For this, we have proposed a central station registry, which initiates the actual on-boarding on a technical level. Since the definition of Findable includes the introduction of a searchable resource, we argue that the station registry, which captures all participating institutions in one central platform, is a suitable component to make stations findable. Additionally, this design decision has another effect on the on-boarding. We have designed the station registry as an essential component of the on-boarding workflow. This implies that the integration of a new institution is not feasible without prior registration of the station. This guarantees that the recently generated digital asset (station) is always linked to a searchable resource in the registry using a globally unique identifier for example. Furthermore, our station registry provides a core set of metadata to describe each institution, which is the first step towards transparency of the DA ecosystems. In particular, this holds for new researchers who want to participate in the network. They can explore the station list(s) or create a new consortium and invite other institutions to share their data. Having the station identifier, the researcher is able to define a route in order to analyse the provided data. This contributes to the accessibility of each station—or more precisely: the data provided by the station. Regarding accessibility, the FAIR definition also requires that metadata is retrievable, even when the data collections are no longer available. In other words, an archiving functionality is needed. Partially, we enable archiving by using online/offline indicators for stations: If a station is currently unavailable, it is not accessible for analyses but its metadata is still persistent and searchable in the station registry.
In our study, we have not investigated the interoperability and reusability part of our on-boarding service. However, we argue that the station registry is also compatible with other ecosystems as far as there are corresponding interfaces for an on-boarding workflow. Since our design decisions are based on REST/HTTP(S) and JWT, we involve well-established communication standards. Additionally, we have not focused on a usage licensing and detailed provenance yet although information about the station administration has to be provided, which gives base information about the data provenance. Nevertheless, the used data model and the workflow are extendable to meet the I&R requirements.

5.2. On-Boarding

As we have mentioned earlier, our on-boarding procedure has been evaluated in a data analysis study with six data sharing institutions to prove its ability to foster collaborations between data premises. The evaluation has been conducted with different host OS and network settings which gives us a broad overview of its applicability. One of the main drawbacks of the state-of-the-art has been the lack of automatism during the configuration of a new analysis endpoint. The consequence is the increased deployment time which has a direct impact on the duration of the clinical study. Using our workflow, each partner has on-boarded the endpoint within less than 15 min. Further, our exemplary clinical study—as described above in Section 4—has covered around one month. The only partially comparable number we have found in the literature has been presented by Deist et al. [15]. They have stated that they connected eight healthcare institutes in five countries within four months. To what extent these numbers are comparable remains open but even this presented ad hoc approach has required multiple user interactions showing the need for automated configurations. During the installation, we have experienced no crucial problems during the deployment of the station software and all stations have been brought to life in a timely manner. One advantage has been the OS-independence of the actual software since our analysis endpoint component is fully dockerised. Therefore, each station admin had the freedom to pick any software (and hardware) which meet the local regulations and preferences. Especially, the installation wizard for the configuration has the benefit that one-to-one support did not occur in our scenario. As an exception, the build-in connectivity check to the CS has detected firewall issues at two institutions, which, however, were resolved efficiently. Despite the successful case study and the decentral deployment of software, our approach could exhibit some limitations, which are discussed in the next section.

5.3. Limitations

In our approach, we mainly brought the findability of institutions into focus. This means that the actual data set provision, which is not part of the presented workflow, has not been taken into account. Consequently, a researcher is indeed able to find data sharing institutions in a DA network but the provided datasets are not visible. However, according to the FAIR principles, our station registry is easily extendable to describe datasets. During the case study, we made manuals for the actual data source deployment available. Further, an in-depth search is also not possible due to the limited metadata set for each institution. Therefore, there is a need for more detailed metadata items. A potential bottleneck of our approach might be the usage of personalised OTPs and incorrect email addresses. Although the OTPs are an efficient solution to guarantee that only the station admin can on-board the station, it poses the risk that the OTPs could be forgotten and the on-boarding procedure has to be repeated.

6. Conclusions and Future Work

In this work, we have presented an on-boarding workflow for DA infrastructures and a sample case study involving six different institutions using the mentioned on-boarding functionality. After reviewing the on-boarding methodologies of related DA implementations, we have derived multiple potential shortcomings of the state-of-the-art, which might hinder institutions to share their data. First, they do not sufficiently contribute to FAIR data management. Especially, institutions are not findable in this highly distributed network of data-sharing partners. This circumstance constitutes a major obstacle for researchers and data analysts trying to conduct clinical trials. Second, most of these approaches exhibit an overhead of manual configuration and a lack of automatism until the necessary software is installed to support the technical on-boarding. Usually, the configuration includes the provision of connection information (e.g., IP addresses) to the central services, the usage of CLIs, and the exchanges of secrets such as private and public keys for the encryption through alternative ways. Particularly, the latter poses potential risks if security information is shared using non-dedicated communication channels.
Therefore, our main objective has been the development of an on-boarding procedure to overcome all these mentioned challenges. We have started the development by using a reference DA architecture (the PHT), which has served as a base implementation. Upon this, we have built our new on-boarding service. We have introduced a new component, called station registry, which represents a central authority for the registration of new stations. New data sharing stations can register themselves to be visible to others. For the registration, the station registry provides a basic set of metadata describing each data premise. After the registration, the actual on-boarding procedure is activated. The central orchestration service component of our base implementation prepares all necessities a station needs to be on-boarded. Besides the setup in the CS itself (e.g., repositories, user accounts), the CS prepares a configuration file with all necessary configuration items. This file is encrypted using a personalised password and is sent via email to the station admin. Finally, we have extended the CS counterpart, the station software, with an on-boarding and configuration wizard, which performs the setup for the station admin in a semi-automated way using the received configuration file. During the whole development process, we have ensured that the workflow is compatible with common communication standards such as REST, JWT, HTTP(S) or even email.
We have evaluated our work in an exemplary collaborative clinical study with six institutions across Germany using open-source breast cancer data, which represents the second contribution of this work. Each partner has used the on-boarding workflow and has provided the dataset for the analyses. We have found that our workflow is indeed an efficient and seamless method to on-board a data-sharing institution to a network. Hence, we have been able to reduce the deployment time and brought each station to life more rapidly due to the no longer required configuration at the station side. In conclusion, we reason that our on-boarding process alleviates the technological barriers to participating in a collaborative data-sharing network.

Future Work

In future work, we intend to extend the data model at the station registry such that the institution can be described in more detail. Initial work has already been made to enhance the station registry with respect to metadata about datasets such that these are also FAIR. Since our station registry is compatible with different on-boarding APIs, we want to evaluate our service with multiple APIs offered by other DA ecosystems (multiple CS) or even other DA technologies. We see potential to even improve our functionality by restricting the contact email (used for the on-boarding) of the station admin to pre-defined and trusted domains as another layer of security. For further improvements and evaluation, we plan to involve the on-boarding service in additional case studies.

Author Contributions

Conceptualization: S.W. (Sascha Welten), M.J., L.N. and T.K.; Software: M.J., L.N. and T.K.; Validation: L.H., M.A. and Y.M.; Data curation: L.H., M.A. and Y.M.; Writing—original draft preparation: S.W. (Sascha Welten), T.K., S.W. (Sven Weber), Y.M. and L.H.; Writing—review and editing: S.W. (Sascha Welten), M.J., L.N., S.W. (Sven Weber), Y.M., K.T., Y.U.Y., M.L. and T.K.; Visualization: S.W. (Sascha Welten) and Y.M.; Supervision: S.D. and O.B.; Project administration: Y.U.Y.; Funding acquisition: S.D. and O.B. All authors have read and agreed to the published version of the manuscript.

Funding

This work was supported by the German Ministry for Research and Education (BMBF) as part of the SMITH consortium (S.W. (Sascha Welten), L.N., Y.M., M.J., Y.U.Y., S.W. (Sven Weber), S.D., O.B., and T.K. grant no. 01ZZ1803K and WI 1605/10-2 for IMISE). This work was conducted jointly by RWTH Aachen University, Fraunhofer FIT, and the Leipzig University Medical Center as part of the PHT and Go FAIR implementation network, which aims to develop a proof-of-concept information system to address current data reusability challenges occurring in the context of so-called data integration centres that are being established as part of ongoing German Medical Informatics BMBF projects.

Institutional Review Board Statement

Not applicable.

Informed Consent Statement

Not applicable.

Data Availability Statement

Publicly available datasets were analyzed in this study. This data can be found here: https://archive.ics.uci.edu/ml/datasets/Breast+Cancer+Wisconsin+%28Diagnostic%29, accessed on 18 February 2022.

Acknowledgments

We thank all participants for their contribution during our evaluation including six different institutions: Sarah Geihs, Sarah Kreutzke (both UK Aachen), Muhammad Adnan, Ana Groenke (both UK Cologne), Kais Tahar, Dagmar Krefting (UM Goettingen), Maximilian Jugl (HS Mittweida), Matthias Löbe, Ronny Dathe (IMISE Leipzig), and Lars Hempel (UK Leipzig).

Conflicts of Interest

The authors declare no conflict of interest. The funders had no role in the design of the study; in the collection, analyses, or interpretation of data; in the writing of the manuscript, or in the decision to publish the results.

Abbreviations

The following abbreviations are used in this manuscript:
DADistributed Analytics
MLMachine Learning
INImplementation Networks
DSDataSHIELD
SMPCSecure Multi-Party Computation
PHTPersonal Health Train
CSCentral Service
CLICommand Line Interface
HPHewlett Packard
IAMIdentity and Access Management
DNSDomain Name Service
JWTJSON Web Token
OTPOne-Time-Password
FNAFine Needle Aspirate
FHIRFast Healthcare Interoperability Resources
GANGenerative Adversarial Network

References

  1. Balicer, R.D.; Cohen-Stavi, C. Advancing Healthcare Through Data-Driven Medicine and Artificial Intelligence. In Healthcare and Artificial Intelligence; Nordlinger, B., Villani, C., Rus, D., Eds.; Springer International Publishing: Cham, Switzerland, 2020; pp. 9–15. [Google Scholar] [CrossRef]
  2. Alyass, A.; Turcotte, M.; Meyre, D. From big data analysis to personalized medicine for all: Challenges and opportunities. BMC Med. Genom. 2015, 8, 33. [Google Scholar] [CrossRef] [PubMed] [Green Version]
  3. Deo, R.C. Machine learning in medicine. Circulation 2015, 132, 1920–1930. [Google Scholar] [CrossRef] [PubMed] [Green Version]
  4. Geifman, N.; Bollyky, J.; Bhattacharya, S.; Butte, A.J. Opening clinical trial data: Are the voluntary data-sharing portals enough? BMC Med. 2015, 13, 280. [Google Scholar] [CrossRef] [PubMed] [Green Version]
  5. Sidey-Gibbons, J.A.M.; Sidey-Gibbons, C.J. Machine learning in medicine: A practical introduction. BMC Med. Res. Methodol. 2019, 19, 64. [Google Scholar] [CrossRef] [PubMed] [Green Version]
  6. Giger, M.L. Machine Learning in Medical Imaging. J. Am. Coll. Radiol. 2018, 15, 512–520. [Google Scholar] [CrossRef]
  7. Rieke, N.; Hancox, J.; Li, W.; Milletari, F.; Roth, H.; Albarqouni, S.; Bakas, S.; Galtier, M.N.; Landman, B.; Maier-Hein, K.; et al. The Future of Digital Health with Federated Learning. NPJ Digit. Med. 2020, 3, 119. [Google Scholar] [CrossRef]
  8. Rosenblatt, M.; Jain, S.H.; Cahill, M. Sharing of Clinical Trial Data: Benefits, Risks, and Uniform Principles. Ann. Intern. Med. 2015, 162, 306–307. [Google Scholar] [CrossRef]
  9. Sheller, M.J.; Reina, G.A.; Edwards, B.; Martin, J.; Bakas, S. Multi-Institutional Deep Learning Modeling Without Sharing Patient Data: A Feasibility Study on Brain Tumor Segmentation. In Brainlesion: Glioma, Multiple Sclerosis, Stroke and Traumatic Brain Injuries. BrainLes (Workshop); Springer: Cham, Switzerland, 2019; Volume 11383, pp. 92–104. [Google Scholar] [CrossRef]
  10. Sheller, M.J.; Edwards, B.; Reina, G.A.; Martin, J.; Pati, S.; Kotrotsou, A.; Milchenko, M.; Xu, W.; Marcus, D.; Colen, R.R.; et al. Federated learning in medicine: Facilitating multi-institutional collaborations without sharing patient data. Sci. Rep. 2020, 10, 12598. [Google Scholar] [CrossRef]
  11. Welten, S.; Neumann, L.; Yediel, Y.U.; da Silva Santos, L.O.B.; Decker, S.; Beyan, O. DAMS: A Distributed Analytics Metadata Schema. Data Intell. 2021, 3, 528–547. [Google Scholar] [CrossRef]
  12. Beyan, O.; Choudhury, A.; van Soest, J.; Kohlbacher, O.; Zimmermann, L.; Stenzhorn, H.; Karim, M.R.; Dumontier, M.; Decker, S.; da Silva Santos, L.O.B.; et al. Distributed Analytics on Sensitive Medical Data: The Personal Health Train. Data Intell. 2020, 2, 96–107. [Google Scholar] [CrossRef]
  13. Chang, K.; Balachandar, N.; Lam, C.; Yi, D.; Brown, J.; Beers, A.; Rosen, B.; Rubin, D.L.; Kalpathy-Cramer, J. Distributed deep learning networks among institutions for medical imaging. J. Am. Med. Inform. Assoc. 2018, 25, 945–954. [Google Scholar] [CrossRef] [PubMed] [Green Version]
  14. Shi, Z.; Zhovannik, I.; Traverso, A.; Dankers, F.J.W.M.; Deist, T.M.; Kalendralis, P.; Monshouwer, R.; Bussink, J.; Fijten, R.; Aerts, H.J.W.L.; et al. Distributed radiomics as a signature validation study using the Personal Health Train infrastructure. Sci. Data 2019, 6, 218. [Google Scholar] [CrossRef] [PubMed] [Green Version]
  15. Deist, T.M.; Dankers, F.J.W.M.; Ojha, P.; Scott Marshall, M.; Janssen, T.; Faivre-Finn, C.; Masciocchi, C.; Valentini, V.; Wang, J.; Chen, J.; et al. Distributed learning on 20,000+ lung cancer patients—The Personal Health Train. Radiother. Oncol. 2020, 144, 189–200. [Google Scholar] [CrossRef] [PubMed] [Green Version]
  16. Wilkinson, M.D.; Dumontier, M.; Aalbersberg, I.J.; Appleton, G.; Axton, M.; Baak, A.; Blomberg, N.; Boiten, J.W.; da Silva Santos, L.B.; Bourne, P.E.; et al. The FAIR Guiding Principles for scientific data management and stewardship. Sci. Data 2016, 3, 160018. [Google Scholar] [CrossRef] [PubMed] [Green Version]
  17. Jacobsen, A.; Kaliyaperumal, R.; da Silva Santos, L.O.B.; Mons, B.; Schultes, E.; Roos, M.; Thompson, M. A Generic Workflow for the Data FAIRification Process. Data Intell. 2020, 2, 56–65. [Google Scholar] [CrossRef]
  18. Sinaci, A.A.; Núñez-Benjumea, F.J.; Gencturk, M.; Jauer, M.L.; Deserno, T.; Chronaki, C.; Cangioli, G.; Cavero-Barca, C.; Rodríguez-Pérez, J.M.; Pérez-Pérez, M.M.; et al. From Raw Data to FAIR Data: The FAIRification Workflow for Health Research. Methods Inf. Med. 2020, 59, e21–e32. [Google Scholar] [CrossRef]
  19. Welten, S.; Mou, Y.; Neumann, L.; Jaberansary, M.; Ucer, Y.Y.; Kirsten, T.; Decker, S.; Beyan, O. A Privacy-Preserving Distributed Analytics Platform for Health Care Data. Methods Inf. Med. 2022. [Google Scholar] [CrossRef]
  20. Gaye, A.; Marcon, Y.; Isaeva, J.; LaFlamme, P.; Turner, A.; Jones, E.M.; Minion, J.; Boyd, A.W.; Newby, C.J.; Nuotio, M.L.; et al. DataSHIELD: Taking the analysis to the data, not the data to the analysis. Int. J. Epidemiol. 2014, 43, 1929–1944. [Google Scholar] [CrossRef] [Green Version]
  21. Zhao, C.; Zhao, S.; Zhao, M.; Chen, Z.; Gao, C.Z.; Li, H.; An Tan, Y. Secure Multi-Party Computation: Theory, practice and applications. Inf. Sci. 2019, 476, 357–372. [Google Scholar] [CrossRef]
  22. Moncada-Torres, A.; Martin, F.; Sieswerda, M.; Van Soest, J.; Geleijnse, G. VANTAGE6: An open source priVAcy preserviNg federaTed leArninG infrastructurE for Secure Insight eXchange. In Proceedings of the AMIA Annual Symposium, Online, 14–18 November 2020; American Medical Informatics Association: Bethesda, MD, USA, 2020; Volume 2020, pp. 870–877. [Google Scholar]
  23. Wilson, R.C.; Butters, O.W.; Avraam, D.; Baker, J.; Tedds, J.A.; Turner, A.; Murtagh, M.; Burton, P.R. DataSHIELD—New directions and dimensions. Data Sci. J. 2017, 16, 21. [Google Scholar] [CrossRef]
  24. Mou, Y.; Welten, S.; Jaberansary, M.; Ucer Yediel, Y.; Kirsten, T.; Decker, S.; Beyan, O. Distributed Skin Lesion Analysis Across Decentralised Data Sources. Stud. Health Technol. Inform. 2021, 281, 352–356. [Google Scholar] [CrossRef] [PubMed]
  25. Warnat-Herresthal, S.; Schultze, H.; Shastry, K.L.; Manamohan, S.; Mukherjee, S.; Garg, V.; Sarveswara, R.; Händler, K.; Pickkers, P.; Aziz, N.A.; et al. Swarm learning for decentralized and confidential clinical machine learning. Nature 2021, 594, 265–270. [Google Scholar] [CrossRef] [PubMed]
  26. Beutel, D.J.; Topal, T.; Mathur, A.; Qiu, X.; Parcollet, T.; de Gusmão, P.P.; Lane, N.D. Flower: A friendly federated learning research framework. arXiv 2020, arXiv:2007.14390. [Google Scholar]
  27. van der Maaten, L.; Hinton, G. Visualizing Data using t-SNE. J. Mach. Learn. Res. 2008, 9, 2579–2605. [Google Scholar]
  28. Bender, D.; Sartipi, K. HL7 FHIR: An Agile and RESTful approach to healthcare information exchange. In Proceedings of the 26th IEEE International Symposium on Computer-Based Medical Systems, Porto, Portugal, 20–22 June 2013; pp. 326–331. [Google Scholar]
  29. Goodfellow, I.; Pouget-Abadie, J.; Mirza, M.; Xu, B.; Warde-Farley, D.; Ozair, S.; Courville, A.; Bengio, Y. Generative adversarial nets. Adv. Neural Inf. Process. Syst. 2014, 27, 2672–2680. [Google Scholar]
  30. Mirza, M.; Osindero, S. Conditional generative adversarial nets. arXiv 2014, arXiv:1411.1784. [Google Scholar]
Figure 1. High-level overview of the PHT infrastructure. The Central Service (CS) orchestrates the so-called analysis train from station to station. Each station pulls the train from a dedicated repository in CS and executes the analysis after the decryption. After saving the results (red dots), the train is pushed back to the CS, and the same procedure happens for succeeding stations until the last station is reached.
Applsci 12 04336 g001
Figure 2. Overview of the on-boarding service and its interaction with the DA infrastructure. First, the responsible person (station admin) for the station has to provide (meta-) information about the prospective station. After the registration, the station registry triggers the on-boarding procedure in the CS. The output of this procedure is an encrypted file containing connection credentials for the station to communicate with the CS. For the encryption, the procedure uses the OTP priorly provided by the station admin. This file is sent via an email service. After receipt, the file can be decrypted using the OTP and on-boarding wizard for the station software. Using the wizard, the admin can create key pairs for future use in the DA infrastructure. The keys are send to the CS followed by a connection test (ping).
Applsci 12 04336 g002
Figure 3. Example of a JWT. In our scenario, we use a JWT to transmit the station on-boarding information. The token consists of a header (orange), the payload (pink), and a signature (blue). The payload includes, for example, the station name and, especially, the one-time-password (OTP), which is later used for the configuration file encryption. The signature is used to validate the integrity of the JWT.
Applsci 12 04336 g003
Figure 4. Configuration file for the station. After setting up all necessary configuration items, the CS merges the information into one file. This information enables a station to connect to the central services such as the repository or IAM.
Applsci 12 04336 g004
Figure 5. Cumulative variance (y axis) of the sorted PCs (x axis). This plot demonstrates that the first three PCs are sufficient to describe 80% of the data variance-in other words: By keeping three components, there is only an information loss of 20%. The bottom right t-SNE plot shows the feature distribution of the first three PCs amongst each participating institution: UKA, UKK, UKL, UMG, HSM, IMISE.
Applsci 12 04336 g005
Figure 6. Mapping data from Diagnostic Wisconsin Breast Cancer Database into FHIR resources (i.e., Patient, Observation and Condition). For each record, the features describing characteristics of the cell nuclei are written into the Observation and the diagnosis is written into Condition. Both are referring to a Patient.
Applsci 12 04336 g006
Figure 7. Feature distributions of the three principal components concave points_worst, fractal_dimension_mean, and texture_worst over six institutions (UKA, UKK, UKL, UMG, HSM, IMISE). In our experiments, we evaluated the model performance in distribution settings: (Setting 1) equally-sized and balanced class distribution, (Setting 2) equally-sized and unbalanced class distribution, and (Setting 3) unequally-sized and unbalanced class distribution.
Applsci 12 04336 g007
Table 1. Class distributions over the six Germany-wide institutions (UKA, UKK, UKL, UMG, HSM, IMISE), where setting 1: equal sized and balanced class distribution; setting 2: equal sized and unbalanced class distribution; and setting 3 unequal sized and unbalanced class distribution. The meaning of the abbreviations are: malignant (M) or benign (B).
InstitutionsSetting 1Setting 2Setting 3
UKA66 (B: 41, M: 25)66 (B: 40, M: 26)112 (B: 72, M: 40)
UMG66 (B: 41, M: 25)66 (B: 45, M: 21)42 (B: 32, M: 10)
UKK66 (B: 41, M: 25)66 (B: 39, M: 27)89 (B: 53, M: 36)
UKL66 (B: 41, M: 25)66 (B: 42, M: 24)31 (B: 18, M: 13)
IMISE68 (B: 45, M: 23)68 (B: 37, M: 31)86 (B: 53, M: 33)
HSM66 (B: 41, M: 25)66 (B: 47, M: 19)38 (B: 22, M: 16)
Test set171 (B: 107, M: 64)171 (B: 107, M: 64)171 (B: 107, M: 64)
Table 2. Results in IID setting (equally-sized and balanced class distribution). The meaning of the abbreviations are: real-world data (R), synthetic data (S) and synthetic data with the generation size of 1000 (S1000).
MethodsAccuracyBal. AccuracyPrecisionRecallF1-ScoreMatt. Cor. Coef.
R/S/S1000R/S/S1000R/S/S1000R/S/S1000R/S/S1000R/S/S1000
SST
(UKA)
92.7/90.9/93.1
±0.008/0.003/0.006
90.9/88.4/93.9
±0.008/0.003/0.004
96.4/97.1/86.4
±0.014/0.011/0.011
83.6/78.1/96.9
±0.009/0.000/0.000
89.5/86.6/91.3
±0.011/0.004/0.006
84.5/80.9/86.1
±0.017/0.008/0.010
SST
(UMG)
92.1/85.4/90.1
±0.008/0.020/0.008
90.1/87.5/89.8
±0.010/0.021/0.007
96.3/73.2/85.4
±0.001/0.022/0.016
82.0/96.1/88.7
±0.020/0.027/0.008
88.6/83.1/87.0
±0.012/0.023/0.010
83.3/72.7/79.0
±0.016/0.041/0.017
SST
(UKK)
91.4/89.5/92.1
±0.007/0.000/0.003
89.5/87.8/92.0
±0.009/0.000/0.005
94.2/89.7/88.0
±0.009/0.000/0.001
82.0/81.2/91.4
±0.016/0.000/0.009
87.7/85.2/89.7
±0.011/0.000/0.005
81.6/77.3/83.3
±0.016/0.000/0.008
SST
(UKL)
93.7/94.0/93.9
±0.003/0.015/0.008
91.6/94.3/94.5
±0.004/0.014/0.006
100/ 89.4/ 88.0
±0.000/0.024/0.016
83.2/95.3/96.9
±0.008/0.013/0.000
90.8/92.3/92.2
±0.005/0.018/0.009
87.0/87.5/87.4
±0.006/0.030/0.014
SST
(IMISE)
93.3/94.7/95.5
±0.003/0.005/0.003
91.0/93.8/95.2
±0.005/0.005/0.004
100/ 95.5/ 93.8
±0.000/0.008/0.000
82.0/90.2/94.1
±0.009/0.008/0.008
90.1/92.8/94.0
±0.005/0.007/0.004
86.1/88.7/90.3
±0.007/0.010/0.006
SST
(HSM)
92.7/91.1/93.1
±0.003/0.003/0.006
91.2/91.8/92.4
±0.005/0.004/0.007
94.8/83.8/92.0
±0.001/0.009/0.001
85.2/94.5/89.5
±0.009/0.016/0.015
89.7/88.8/90.7
±0.005/0.004/0.008
84.4/81.9/85.3
±0.007/0.007/0.012
IIL92.8/93.6/95.3
±0.007/0.011/0.005
91.2/94.5/94.9
±0.009/0.010/0.005
95.6/86.6/94.1
±0.010/0.019/0.008
84.8/98.0/93.4
±0.015/0.008/0.008
89.9/91.9/93.7
±0.011/0.013/0.006
84.7/87.1/90.0
±0.016/0.021/0.010
CIIL92.4/93.7/93.9
±0.005/0.009/0.003
90.6/94.3/94.5
±0.005/0.009/0.003
95.9/87.6/87.9
±0.009/0.012/0.007
83.2/96.9/96.9
±0.008/0.013/0.000
89.1/92.0/92.2
±0.007/0.011/0.004
83.8/87.2/87.4
±0.011/0.018/0.006
Table 3. Results in non-IID setting (equally-sized and unbalanced class distribution). The meaning of the abbreviations are: real-world data (R), synthetic data (S) and synthetic data with the generation size of 1000 (S1000).
MethodsAccuracyBal. AccuracyPrecisionRecallF1-ScoreMatt. Cor. Coef.
R/S/S1000R/S/S1000R/S/S1000R/S/S1000R/S/S1000R/S/S1000
SST
(UKA)
92.4/90.1/90.6
±0.010/0.000/0.010
90.6/88.6/89.8
±0.010/0.010/0.010
95.5/89.8/88.4
±0.010/0.000/0.010
83.6/82.8/86.3
±0.020/0.010/0.020
89.2/86.2/87.3
±0.010/0.010/0.010
83.8/78.6/79.9
±0.020/0.010/0.020
SST
(UMG)
92.0/90.5/89.5
±0.010/0.010/0.010
89.3/90.9/91.3
±0.010/0.020/0.010
99.5/83.8/78.8
±0.010/0.020/0.020
78.9/92.6/98.4
±0.010/0.030/0.000
88.0/87.9/87.5
±0.010/0.020/0.010
83.3/80.4/80.1
±0.010/0.030/0.020
SST
(UKK)
93.1/92.1/94.7
±0.000/0.010/0.000
91.8/92.8/94.9
±0.000/0.010/0.000
94.8/85.1/91.1
±0.000/0.010/0.010
86.3/95.7/95.3
±0.010/0.010/0.000
90.4/90.1/93.1
±0.000/0.010/0.010
85.3/84.0/88.9
±0.010/0.020/0.010
SST
(UKL)
92.1/91.7/94.2
±0.000/0.000/0.010
90.1/90.4/94.3
±0.000/0.000/0.010
96.3/92.0/90.0
±0.000/0.010/0.020
82.0/85.2/94.9
±0.010/0.010/0.010
88.6/88.4/92.4
±0.010/0.000/0.020
83.3/82.1/87.7
±0.010/0.010/0.030
SST
(IMISE)
95.2/93.0/95.9
±0.000/0.010/0.000
95.4/91.4/95.7
±0.000/0.010/0.000
91.5/95.6/94.2
±0.010/0.010/0.010
96.1/85.2/94.9
±0.010/0.020/0.010
93.7/90.1/94.6
±0.000/0.010/0.010
89.9/85.0/91.3
±0.010/0.020/0.010
SST
(HSM)
91.2/86.8/83.8
±0.000/0.010/0.020
88.3/89.2/86.7
±0.010/0.010/0.010
100/ 74.6/ 70.2
±0.000/0.020/0.020
76.6/98.4/98.4
±0.010/0.000/0.000
86.7/84.9/82.0
±0.010/0.010/0.010
81.9/75.8/71.2
±0.010/0.020/0.020
IIL92.1/88.9/87.3
±0.000/0.000/0.000
89.5/90.8/89.5
±0.000/0.000/0.000
100/ 77.8/ 75.2
±0.000/0.010/0.000
78.9/98.4/98.4
±0.010/0.000/0.000
88.2/86.9/85.3
±0.010/0.000/0.000
83.7/79.1/76.5
±0.010/0.010/0.000
CIIL92.3/92.3/91.1
±0.000/0.010/0.010
90.3/92.9/92.5
±0.000/0.010/0.010
96.4/85.6/81.8
±0.010/0.020/0.010
82.4/95.3/98.0
±0.010/0.010/0.010
88.8/90.2/89.2
±0.000/0.020/0.010
83.6/84.2/82.7
±0.010/0.030/0.010
Table 4. Results in non-IID setting (unequally-sized and unbalanced class distribution). The meaning of the abbreviations are: real-world data (R), synthetic data (S) and synthetic data with the generation size of 1000 (S1000).
MethodsAccuracyBal. AccuracyPrecisionRecallF1-ScoreMatt. Cor. Coef.
R/S/S1000R/S/S1000R/S/S1000R/S/S1000R/S/S1000R/S/S1000
SST
(UKA)
92.5/91.4/92.7
±0.010/0.010/0.010
90.3/91.1/92.2
±0.010/0.010/0.010
98.6/87.5/90.2
±0.020/0.010/0.010
81.2/89.8/90.2
±0.010/0.020/0.010
89.1/88.6/90.2
±0.010/0.010/0.010
84.4/81.7/84.4
±0.020/0.020/0.020
SST
(UMG)
88.6/93.4/91.2
±0.000/0.010/0.010
84.8/92.4/91.0
±0.000/0.010/0.010
100.0/ 93.8/ 86.9
±0.000/0.020/0.020
69.5/88.3/90.2
±0.010/0.020/0.020
82.0/90.9/88.5
±0.010/0.020/0.020
76.7/85.9/81.5
±0.010/0.020/0.030
SST
(UKK)
92.7/96.8/94.2
±0.010/0.010/0.010
91.1/96.7/93.9
±0.010/0.010/0.010
95.2/95.0/91.5
±0.010/0.010/0.010
84.8/96.5/93.0
±0.030/0.010/0.020
89.7/95.7/92.2
±0.020/0.010/0.010
84.4/93.2/87.6
±0.020/0.020/0.020
SST
(UKL)
94.7/93.1/94.2
±0.010/0.010/0.010
94.1/92.2/95.0
±0.010/0.010/0.010
94.4/93.1/87.5
±0.010/0.020/0.020
91.4/88.3/98.4
±0.010/0.020/0.000
92.9/90.6/92.7
±0.010/0.010/0.010
88.7/85.3/88.3
±0.010/0.020/0.020
SST
(IMISE)
94.2/91.4/94.7
±0.020/0.010/0.000
93.0/92.5/94.7
±0.020/0.010/0.000
95.7/83.0/91.7
±0.020/0.020/0.010
88.3/96.9/94.5
±0.040/0.010/0.020
91.8/89.4/93.1
±0.030/0.020/0.000
87.5/82.9/88.9
±0.040/0.030/0.000
SST
(HSM)
92.1/88.7/94.0
±0.000/0.010/0.000
90.9/90.7/93.5
±0.000/0.000/0.000
92.4/77.5/92.5
±0.010/0.010/0.010
85.9/98.4/91.4
±0.000/0.000/0.010
89.1/86.7/91.9
±0.000/0.010/0.000
83.0/78.9/87.2
±0.010/0.010/0.010
IIL93.3/90.2/95.6
±0.000/0.010/0.000
92.2/91.9/95.6
±0.000/0.010/0.000
93.8/86.0/93.1
±0.010/0.020/0.010
87.9/98.4/95.3
±0.010/0.000/0.010
90.7/88.3/94.2
±0.000/0.010/0.000
85.6/81.3/90.7
±0.010/0.020/0.010
CIIL93.0/93.7/94.6
±0.010/0.000/0.010
91.4/94.6/95.0
±0.010/0.000/0.000
95.6/86.9/89.5
±0.010/0.010/0.010
85.2/98.0/96.9
±0.020/0.010/0.000
90.1/92.1/93.1
±0.010/0.000/0.010
85.0/87.4/88.8
±0.020/0.010/0.010
Publisher’s Note: MDPI stays neutral with regard to jurisdictional claims in published maps and institutional affiliations.

