1. Introduction
The concept of virtual acoustics includes a series of computer and acoustic signal processing techniques that allow to study and recreate the acoustic behavior of a room. Virtual acoustics has proven to be a very effective tool for studying heritage enclosure against different variables [
1,
2]. However, there is no specific tool for studying the acoustic behavior of an open space with heritage interest. To solve this challenge, different authors have studied the applicability of the tools provided by the acoustics in rooms in the study of open and semi-open heritage soundscapes [
3,
4,
5]. In this sense, Álvarez et al. studied the characteristic loudness of various Roman theater stages using virtual acoustics, a tool commonly used in the acoustic study of rooms [
6,
7,
8,
9]. In the same way, Berardi et al. performed a virtual reconstruction of the historical acoustics of the Theatrum Tectum of Pompeii [
10,
11] and Fazenda and Drumm performed a reconstruction of the acoustic sound field of Stonehenge based on measurements taken at a full-size replica [
12]. For his part, Lubman analyzed acoustic echoes around the Mayan temple of Kukulkan at Chichen Itza, Mexico [
13]. Also of interest is the research carried out by Azevedo et al., in which they used auralization to recreate the entire soundscape of a specific event, in this case, John Donne’s 1622 gunpowder plot sermon at Paul’s Cross, outside St. Paul’s Cathedral in London, as it was prior to the fire of 1666 [
14].
Following the line of these investigations, in the present study, virtual acoustics is applied to acoustically characterize the environment of the Water Tribunal of the Plain of Valencia. This event, declared Intangible cultural heritage of Humanity in 2009 by UNESCO, is the oldest-existing justice institution in Europe [
15]. The sessions of the Water Tribunal of the Plain of Valencia take place every Thursday under the Door of the Apostles of the Cathedral of Valencia, which is an excellent sample of the late Gothic of the Valencian Golden Age [
16]. It is a soundscape of great heritage value where the transmission of the word is a preferential factor.
The purpose of this work is the analysis of the acoustic conditions in the environment of the Water Tribunal of the Plain of Valencia and its soundscape, characterizing the main sources in this environment to serve as an objective record of the cultural heritage event. This study is intended to contribute to the knowledge for researchers and practitioners in outdoor cultural heritage events.
The methodology followed for this work, in the acoustic measurement, is based on the requirements of ISO-3382-1 [
17] and some open perspectives in ISO 12913 [
18,
19,
20]. The acoustic simulation was carried out with ODEON and CATT-Acoustic software. As a novelty, this research has proven convenient to perform the calibration of the acoustic model with the parameters C80 and C50 instead of with T30, because they turned out to be more stable parameters in the singular environment studied, in contrast with the usual results in closed rooms [
21]. A comparison of the results obtained with both acoustics software was carried out to analyze their applicability in the acoustic study of open spaces. For the auralization of event sound, an anechoic recording of recited text during sessions was made. In addition, to give more precision to auralization, the real source of the event was characterized, which is the voice of the bailiff who recites the text. For this, the anechoic chamber located in Universitat Politècnica de València was used. As a result of process, the acoustic and visual simulation of the surroundings of the Water Tribunal of the Plain of Valencia were obtained. Using this simulation, the soundscape has been characterized using the protocol established by Mitchell et al. [
22].
The paper is developed as follows: After this introductory section, which motivates the work and explains the context,
Section 2 explains the methodology and materials used which make an exposure of the different data collection (that is, scan of the environment, outdoor acoustic measurements, calibration and simulation of the environment, sound source characterization and auralization, and a survey for subjective soundscape evaluation).
Section 3 is oriented to explain the results obtained and analyze them in the context of this cultural heritage event (acoustic analysis, sound source characterization, combination of the soundwalk with its visualization, and analysis of the results of the survey). Finally,
Section 4 summarizes the main results of this work.
2. Materials and Methods
2.1. Data Collection
In this research, virtual acoustics were applied in the study of Water Tribunal, a heritage event that takes place in Plaça de la Verge (Virgin’s Square) in Valencia (Spain). The Water Tribunal is an ancient institution dedicated to regulating and settling disputes in the management of water resources in the irrigation channels of Valencia and surrounding areas. The rulings of this old tribunal have legal validity in the field of environmental law on irrigation water in the Valencian territory, and constitute a part of the old Valencian Civil Law that is currently being recovered in the field of jurisprudence.
2.1.1. Geometric Data Collection
Due to the uniqueness of the environment, geometric data collection was carried out with a scanning technique using a FARO Laser scanner Focus 3D S120 (from FARO) [
23]. A total of eight scans were performed, processed, and linked using Scene software (from FARO) [
24]. The final outcome was a cloud of environmental points that was exported to AutoCAD software (from AutoDESK) [
25] for the acoustic and visual modeling. The 3D scans were made in the environment where the Water Tribunal takes place. Some measurements were also made with a laser distance meter in the place of the Apostles’ Door at the Cathedral. These measurements were compared in the model to ensure the precision of the scan. Additional measurements of the Virgin’s Square and Miguelete Street, necessary to perform the characterization, were obtained from its planimetry.
2.1.2. Acoustic Data Collection
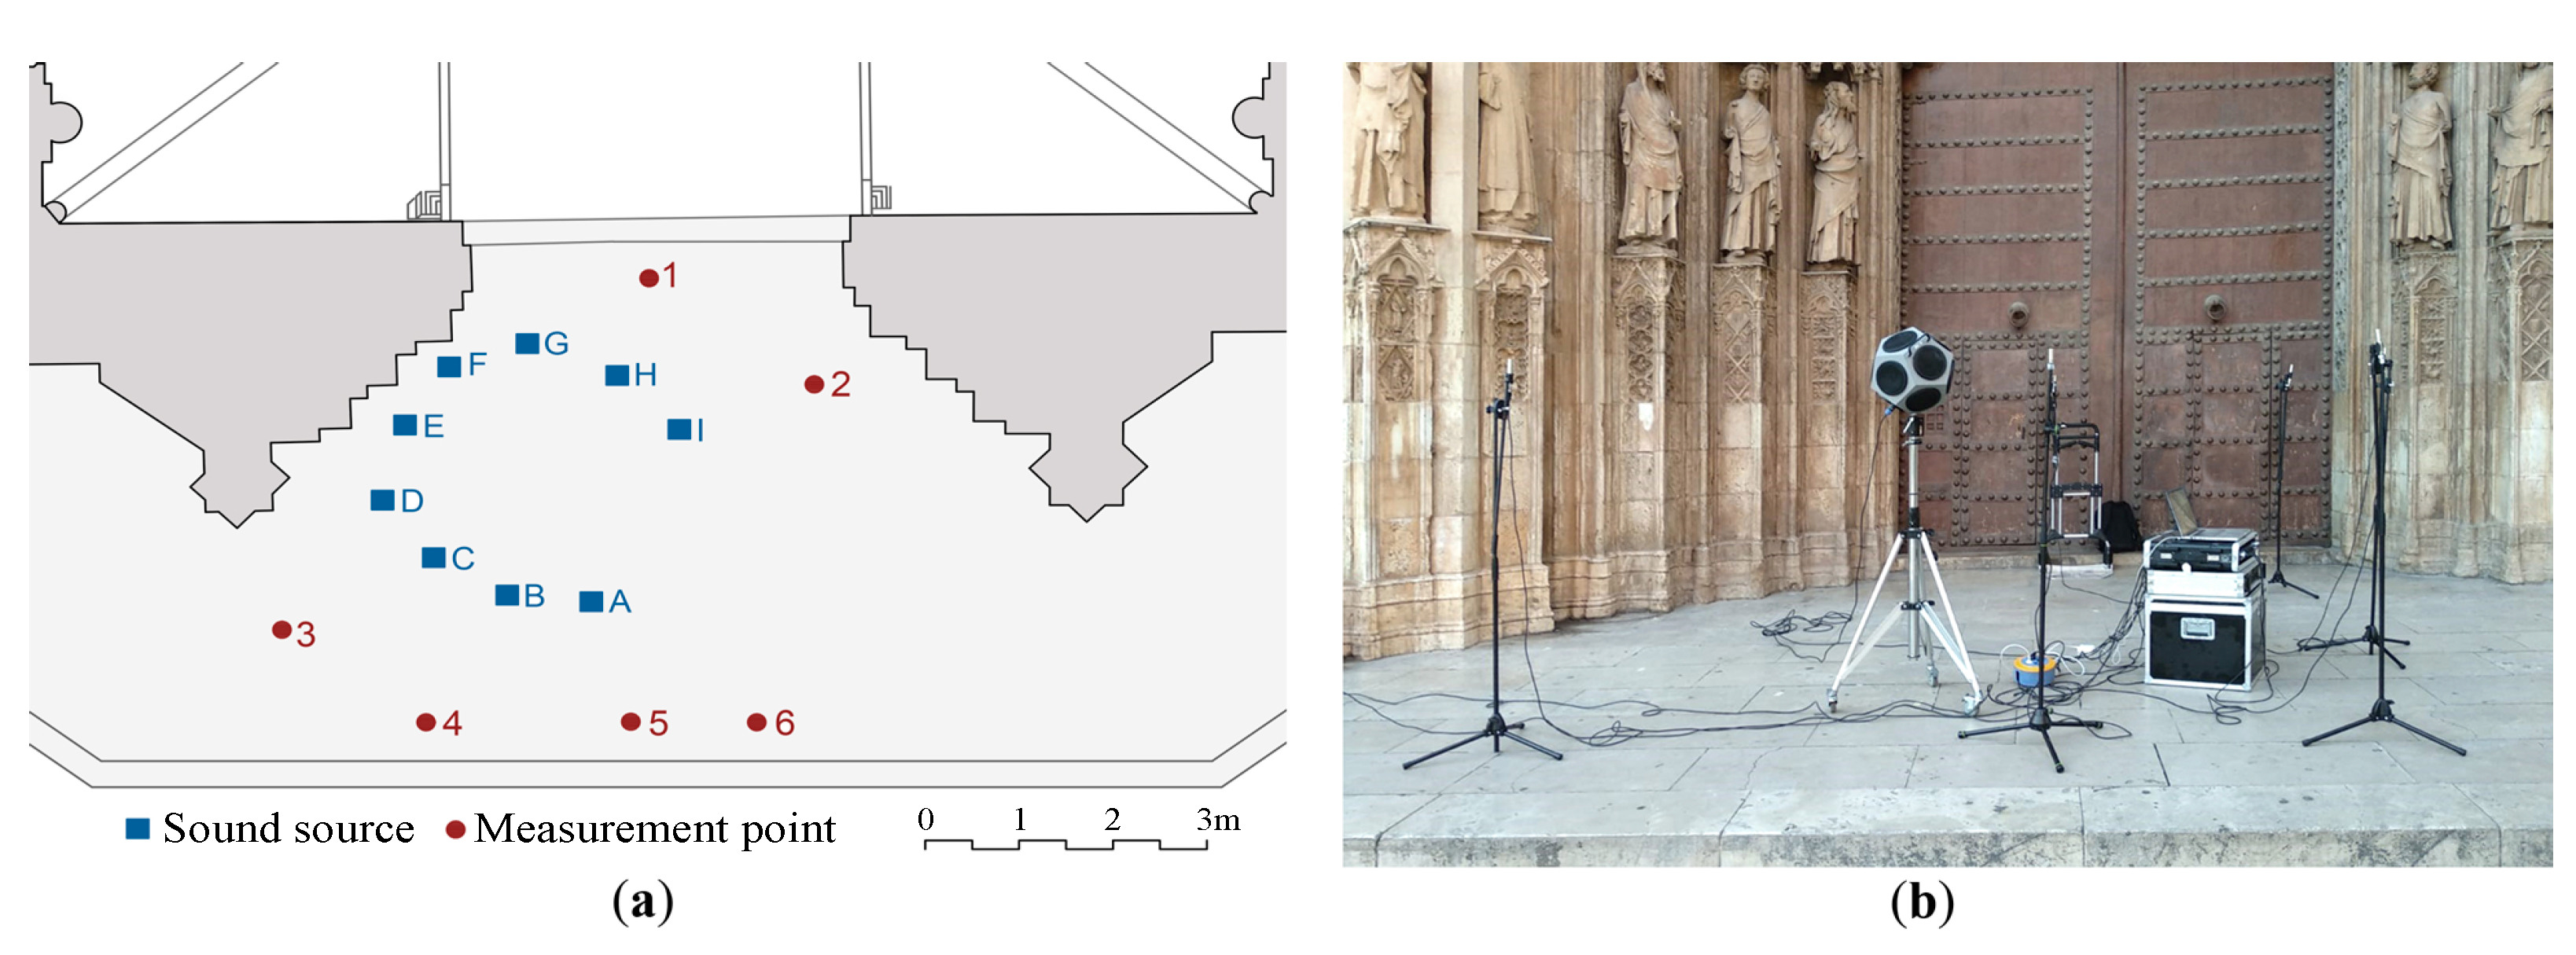
The methodology followed in the acoustic measurements follows ISO-3382-1 [
17] specifications. In total, nine positions of the source were established, corresponding to the location of the bailiff (source A) and the seats of each of the members of the Water Tribunal (sources B–I). The receivers were positioned in six different places; two receivers located inside the Door of the Apostles and four receivers facing the Virgin’s Square, as shown in
Figure 1.
For acoustic measurement, a sound emission equipment consisting of a model DO12 omnidirectional dodecahedral sound (from 1 dB) source and a model M-1000 amplifier (from Inter-M) were used. To record the sound emission, Behringer C2 model omnidirectional microphones were used. In addition, an 8-channel multichannel sound card was used, of which we used one channel to emit the sweep and another 6 were used to register the sweep in the environment.
Table 1 shows the specific characteristics of the measurement equipment used. Using a sweep signal, recordings were made with all the microphones to subsequently obtain impulsive response (IR) of the sound space.
Table 1 shows the specific characteristics of the measurement equipment used.
2.2. Acoustic Simulation
2.2.1. Acoustic Model Building and Calibration
For the acoustic simulation, a simplified model of the environment of the Water Tribunal was used, which includes the Door of the Apostles, Virgin’s Square, and Miguelete Street. From the 3D scans and the planimetry, a wireframe of the environment was raised using AutoCAD. This software allows working comfortably with both plans and the generated point cloud. The wireframe model was exported to Sketchup software, where the correctly oriented model surfaces were generated and layered based on actual materials. In order to work later with CATT-Acoustics [
26] and ODEON [
27] software, the model was closed with surfaces representing the open field, to which 100% absorbent material was applied in the acoustic simulation process.
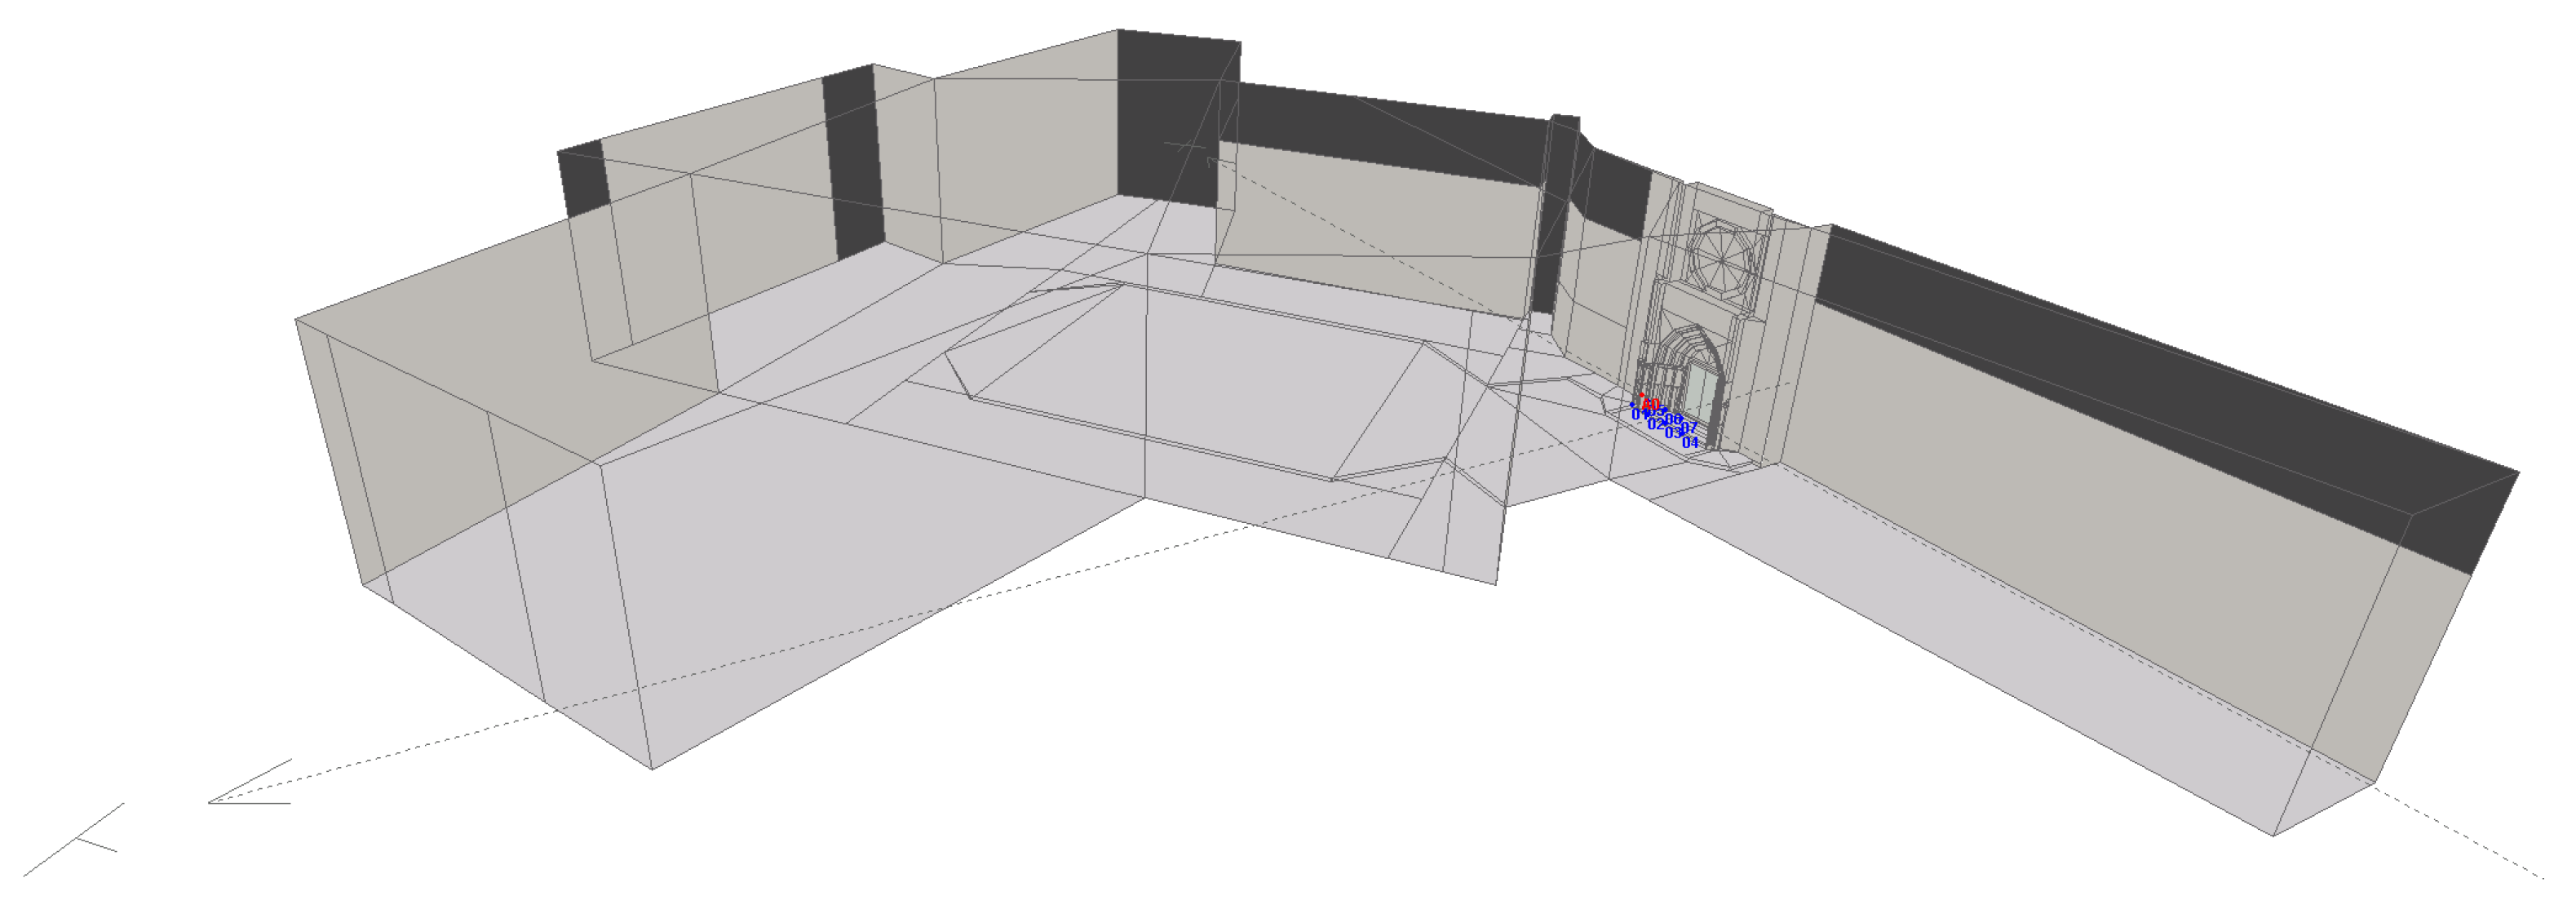
Figure 2 shows final acoustic model, made up of 516 surfaces and with a volume of 150,865 m
; it also shows the sound source—in red color—and the first receivers (the location of the judges)—in blue color.
The usual procedure for calibrating an acoustic model of a room is to include the absorption and diffusion of the materials used in such a way that the simulated reverberation time coincides with or is very close to that which is experimentally determined. In numerous studies, the adjustment of the average at frequencies from 500 to 1000 Hz of reverberation time (T30) was followed as a calibration procedure, in such a way that the experimental average and the simulated average are not more than 1 just noticeable difference (JND) (5%) away, that is, at the perceptual level, no difference can be seen. This procedure is considered adequate because the T30 practically does not vary in a room. In the modeling of the acoustic space where the Water Tribunal is performed, it was observed that an adjustment similar to that performed in a closed room is not adequate, since there is a greater variation in parameters such as the T30 and the early decay time (EDT). However, it was observed that in this type of environment the parameters clarity up to 80 ms (C80) and clarity up to 50 ms (C50) show less variation. For this reason, the calibration of the model with C80 (musical clarity) and C50 (speech clarity) was considered adequate.
The acoustic simulation was carried out with the different software, CATT-Acoustics and ODEON, with the aim of studying the applicability of this type of tool in the study of open and semi-open heritage environments.
2.3. Auralization
Once the acoustic model is calibrated, one can start the auralization of the environment under study. “Auralization is the process of rendering audible, by physical or mathematical modeling, the sound field of a source in a space, in such a way as to simulate the binaural listening experience at a given position in the modeled space” [
28]. The auralization was carried out through the convolution of an in situ recording of a session of the Water Tribunal with the binaural impulsive response of the environment (BRIR). For this, the received power at each reception point was calculated with ODEON software to have it as a reference. The calculated power was applied to auralization, so that it establishes the appropriate attenuation due to distance and reverb at each point. In the process, it was necessary to reduce recording background noise by 3 dB. The anechoic recording used corresponds to the speech of the bailiff when he calls for the members of the different irrigation ditches and it was captured in the characterization of the sound source.
Sound Source Characterization
The bailiff was characterized as a sound source in the anechoic chamber of the School of Architects at the Polytechnic University of Valencia. By incorporating the created source into the acoustic model instead of a generic speech source, a higher degree of precision is achieved in sound auralization.
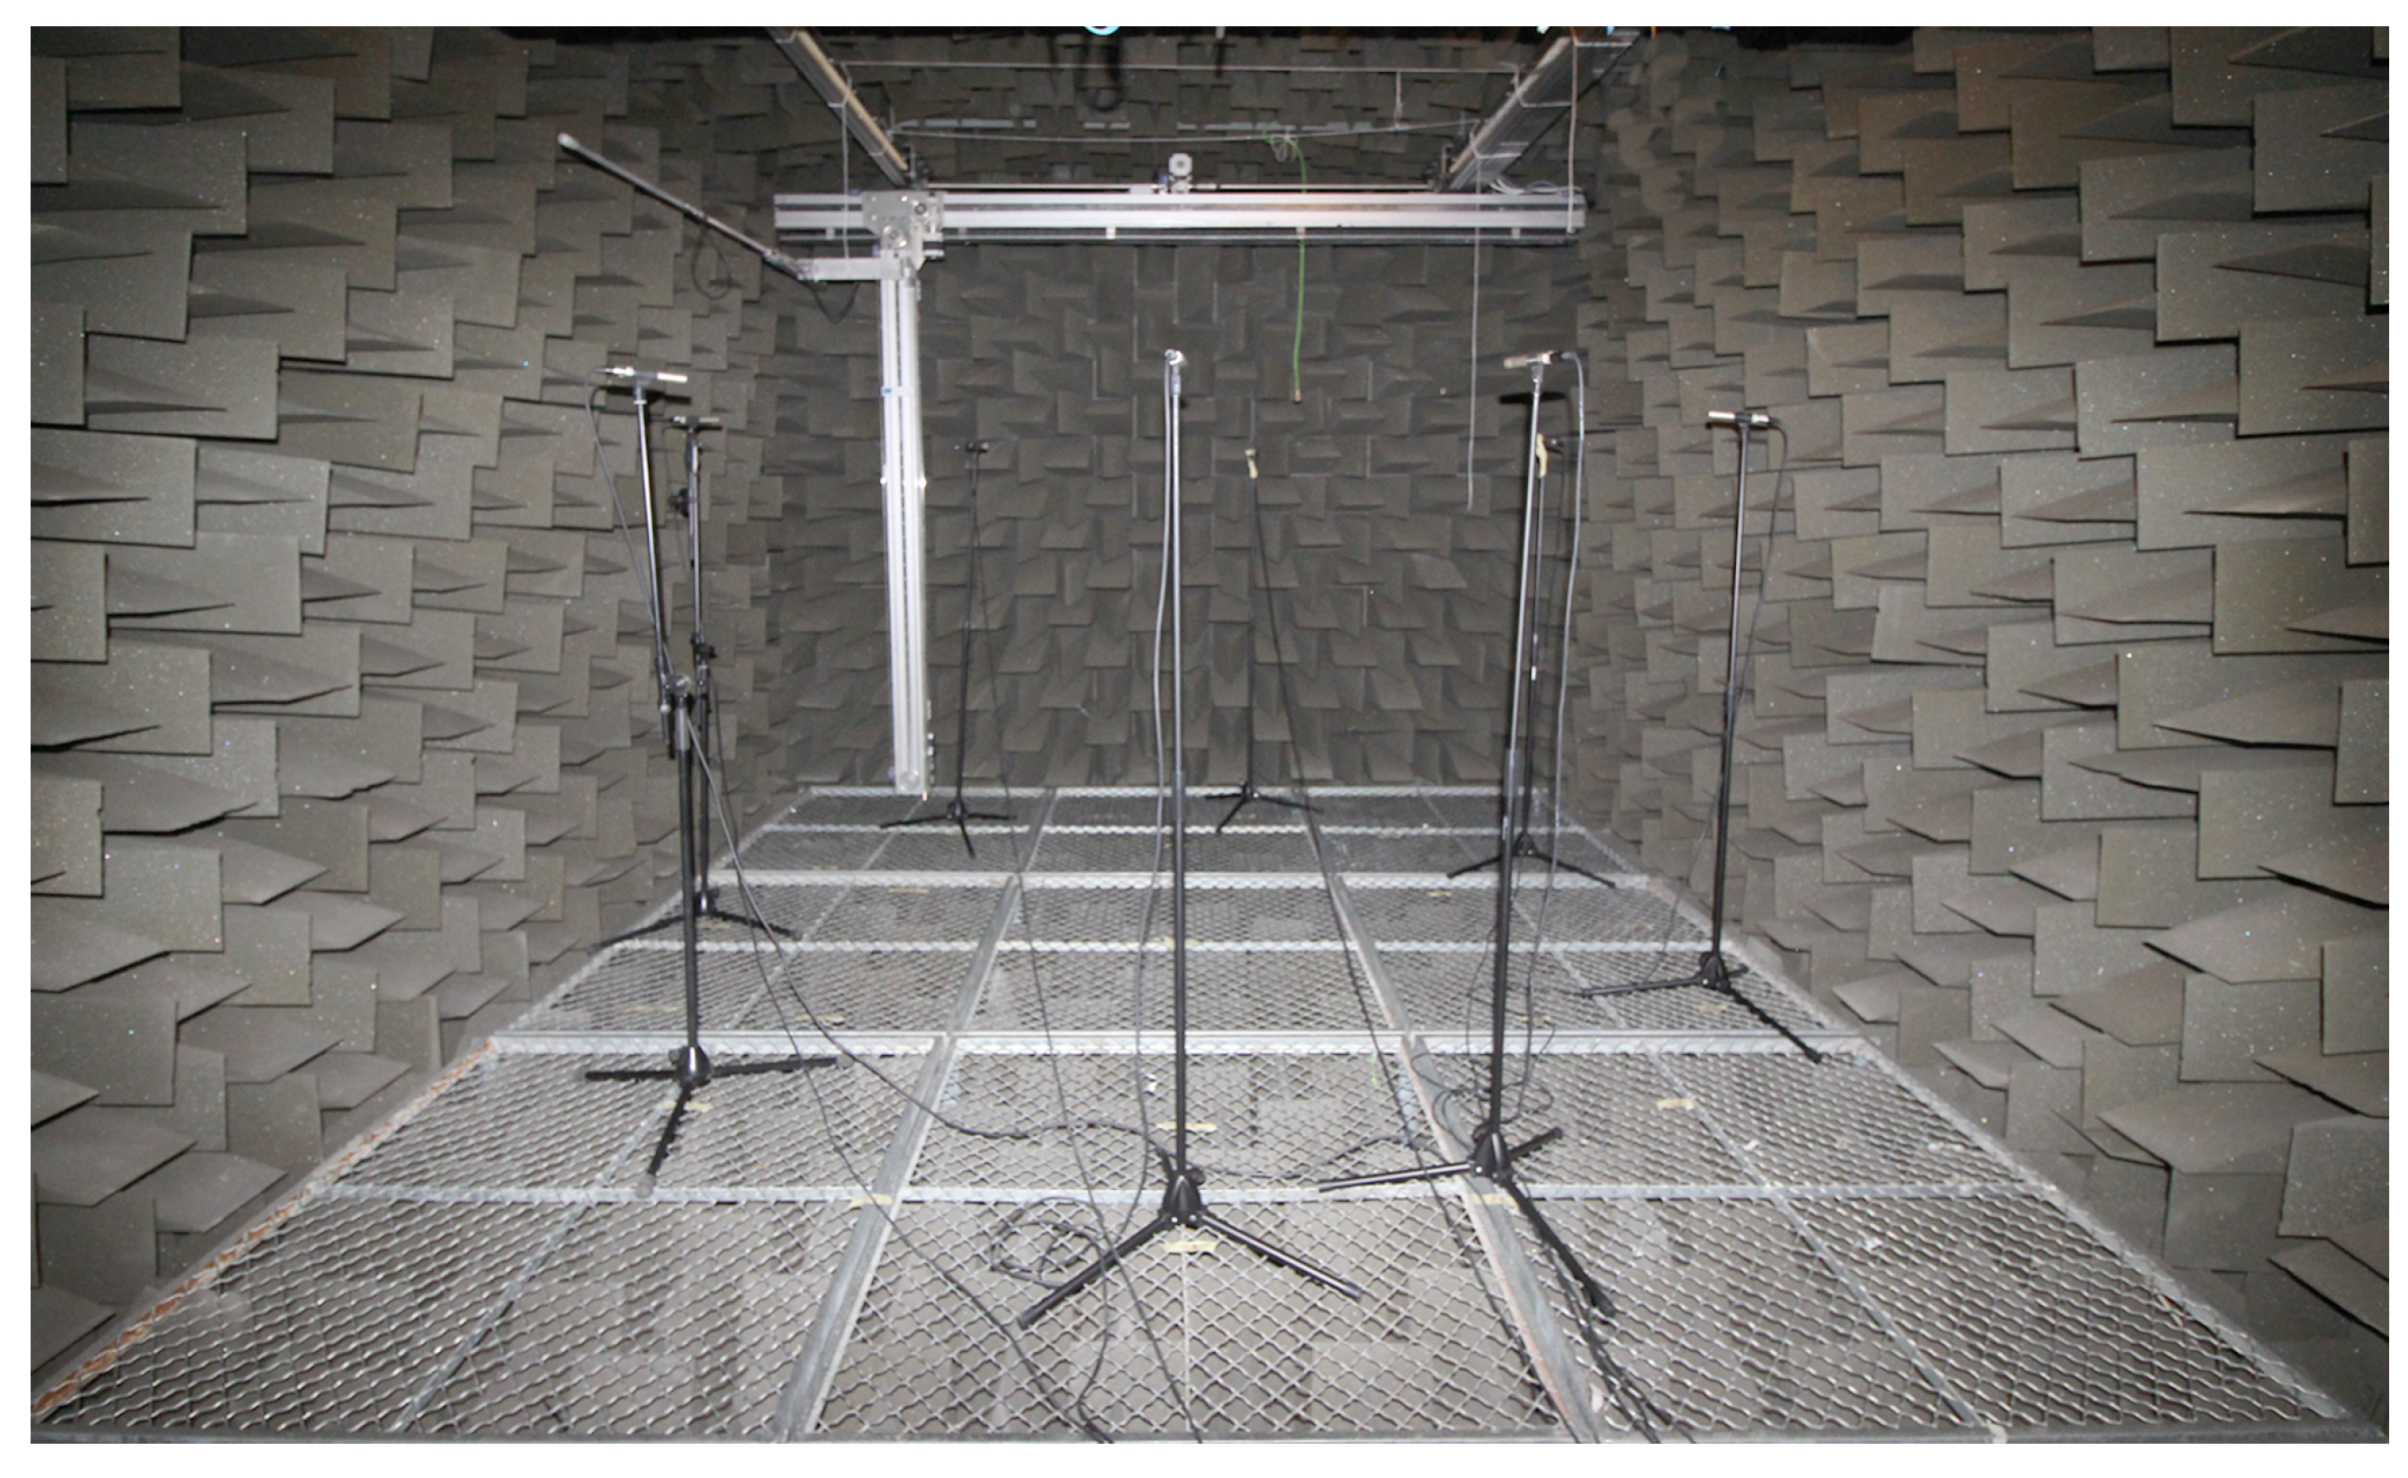
The dimensions of the anechoic chamber are 5.97 m × 5.6 m × 2.83 m and, as shown in
Figure 3, there is a metallic floating floor. The bailiff makes a speech calling for the members of the different irrigation ditches in the area of the city of Valencia.
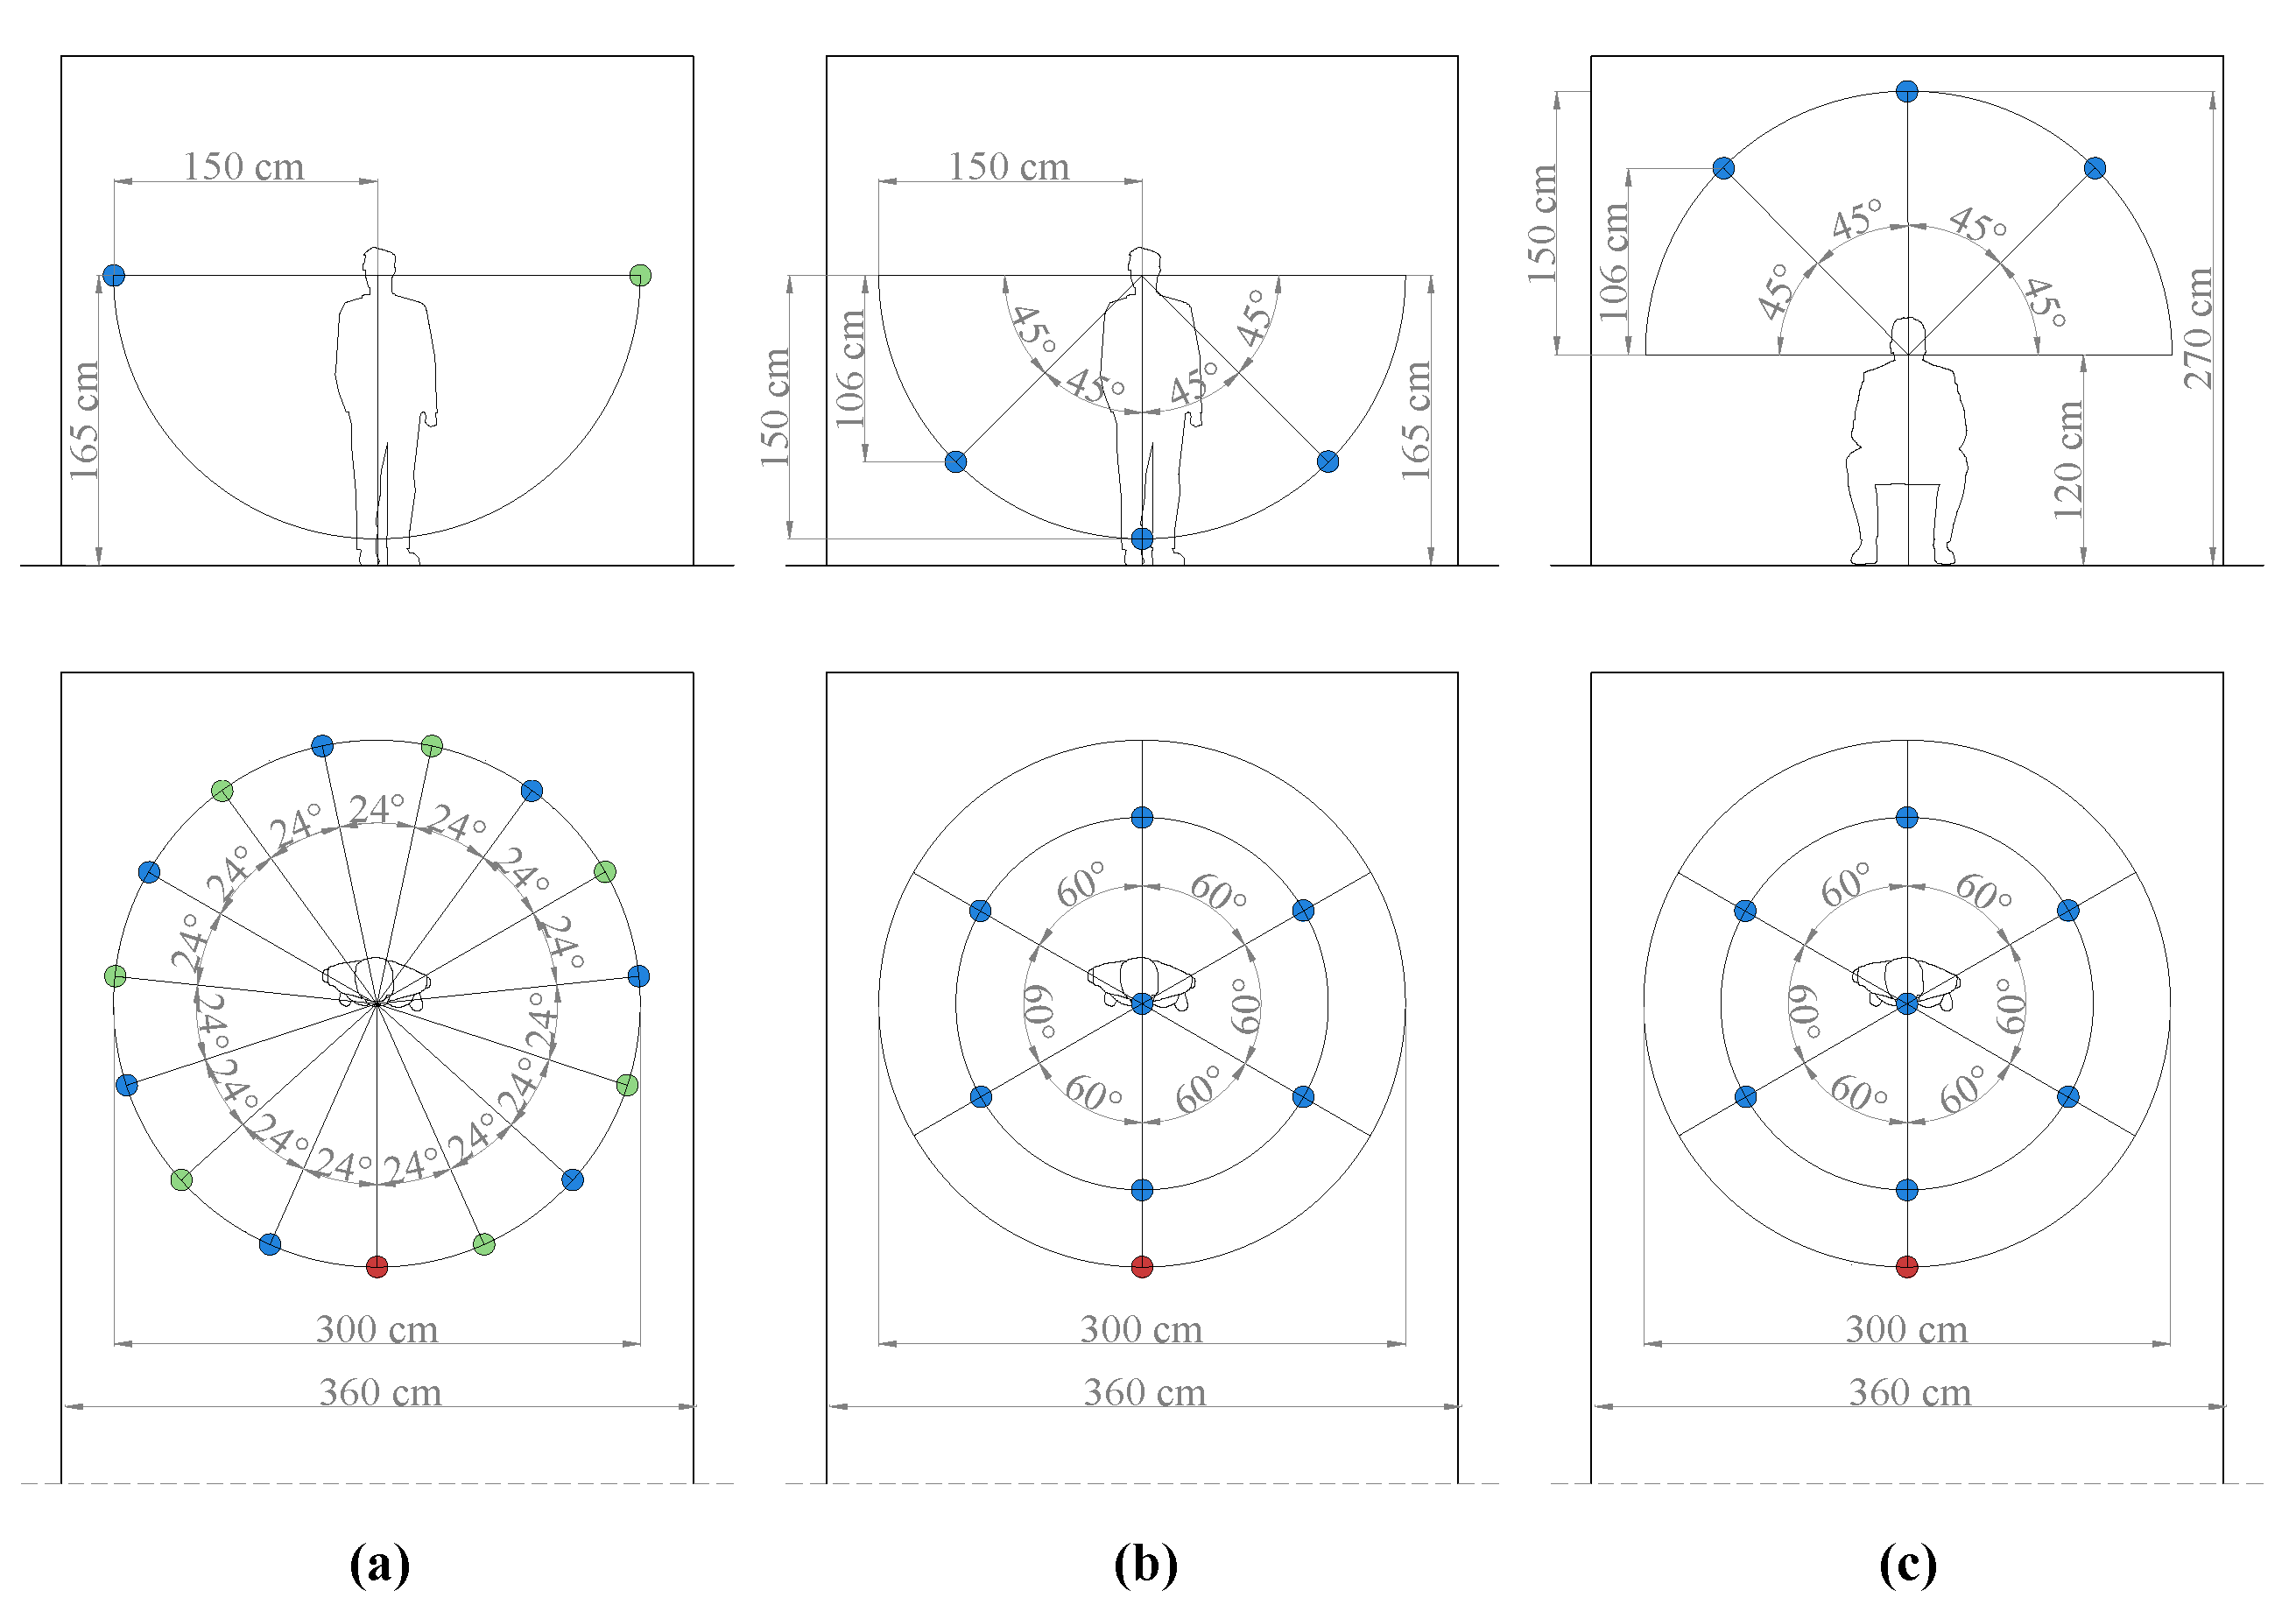
Figure 4 shows the schematic setup of the microphones at different levels to measure the speech of the bailiff.
The anechoic recording was made by registering the bailiff’s speech at the different heights of the microphones shown, forming a hemisphere, with a 8-channel recording audio interface (Presonus Audio Box 1818 VSL 24 Bit/96 K/USB 2.0 Recording Interface). In order to obtain these recordings, an 8 s logarithmic sweep signal, with three repetitions, was reproduced in the environment with the omnidirectional sound source, and processed to obtain the average impulse response. This impulse response was further processed with Matlab to obtain band values for each of the referenced main acoustic parameters. From the anechoic recordings and using Matlab v2021a software (from Mathworks), the average sound pressure levels were evaluated for each direction.
Figure 3 shows the anechoic chamber with the microphones at the height of the mouth of the speaker (corresponding to measure 1 and 2 in
Figure 4).
2.4. Visual Simulation
For visual simulation, a geometric model with a higher level of detail than that used in the acoustic simulation was used to give it a more realistic appearance. A 3D model was developed in AutoCAD software using measurements and planimetry of the environment. Once the model was finished, it was exported to 3DS Max software to carry out the texturing, a process that consists of applying its texture to each plane of the model according to the real environment (stone, marble, wood, etc).
Complete simulation of the environment is achieved by combining the real sound obtained by auralization with the visual simulation. For this, a virtual tour is established where the viewer can see and hear the same as if they were in the real environment. In this way, a model is obtained where both image and sound correspond to reality.
2.5. Public Survey
In this study, a study of the subjective response is also carried out; a study of the subjective response associated with the soundscape of the Water Tribunal was been carried out. This was performed by applying the so-called Swedish protocol for determining the quality of the soundscape. The Swedish Soundscape-Quality Protocol was first proposed by O. Axelsson et al. [
29,
30,
31]. The work of Cain et al. [
32] further extended the previous contribution, which later became the basis for the two-dimensional model in the ISO 12913-3:2019 [
20]. The survey of this protocol evaluates the perceived emotional quality using eight adjectives: pleasant, unpleasant, active/with many active sources or events, relaxed/with few active sources or events, exciting, monotonous, calm, exciting, and noisy [
29,
30,
31,
33,
34]. On the other hand, it also asks for information on some social aspects (gender and age). For this survey, a Google form with the survey (
https://docs.google.com/forms/d/e/1FAIpQLSd0PypVKfaVX9m5b8PlHPZUxOjN1KMnRCKZ_c69nP1VweKSrA/viewform, accessed on 12 April 2022) was developed to allow a quick collection of data from the respondents.
As the survey was offered and tested over the Internet, the hearing abilities of the participants were not checked. The test was presented as a Google Form, with the recommendation to be used with headphones. The evaluation of the soundscape can be described with a circumplex model [
35].
The test signal was a simulated video as a soundscape walk from the middle of the Plaça de la Verge (Virgin’s Square) to the location where the Water Tribunal is placed. The audio rendering is the dynamic auralization of the bailiff’s voice with 25 impulse responses simulated in the ODEON’s acoustic model.
3. Results and Analysis
3.1. Soundscape Acoustics
In the singular soundscape studied, the reverberation parameters T30 and EDT present a greater variation, depending on the location of the source and receivers, than the energy parameters C80 and C50, in contrast to the usual results in rooms and closed spaces.
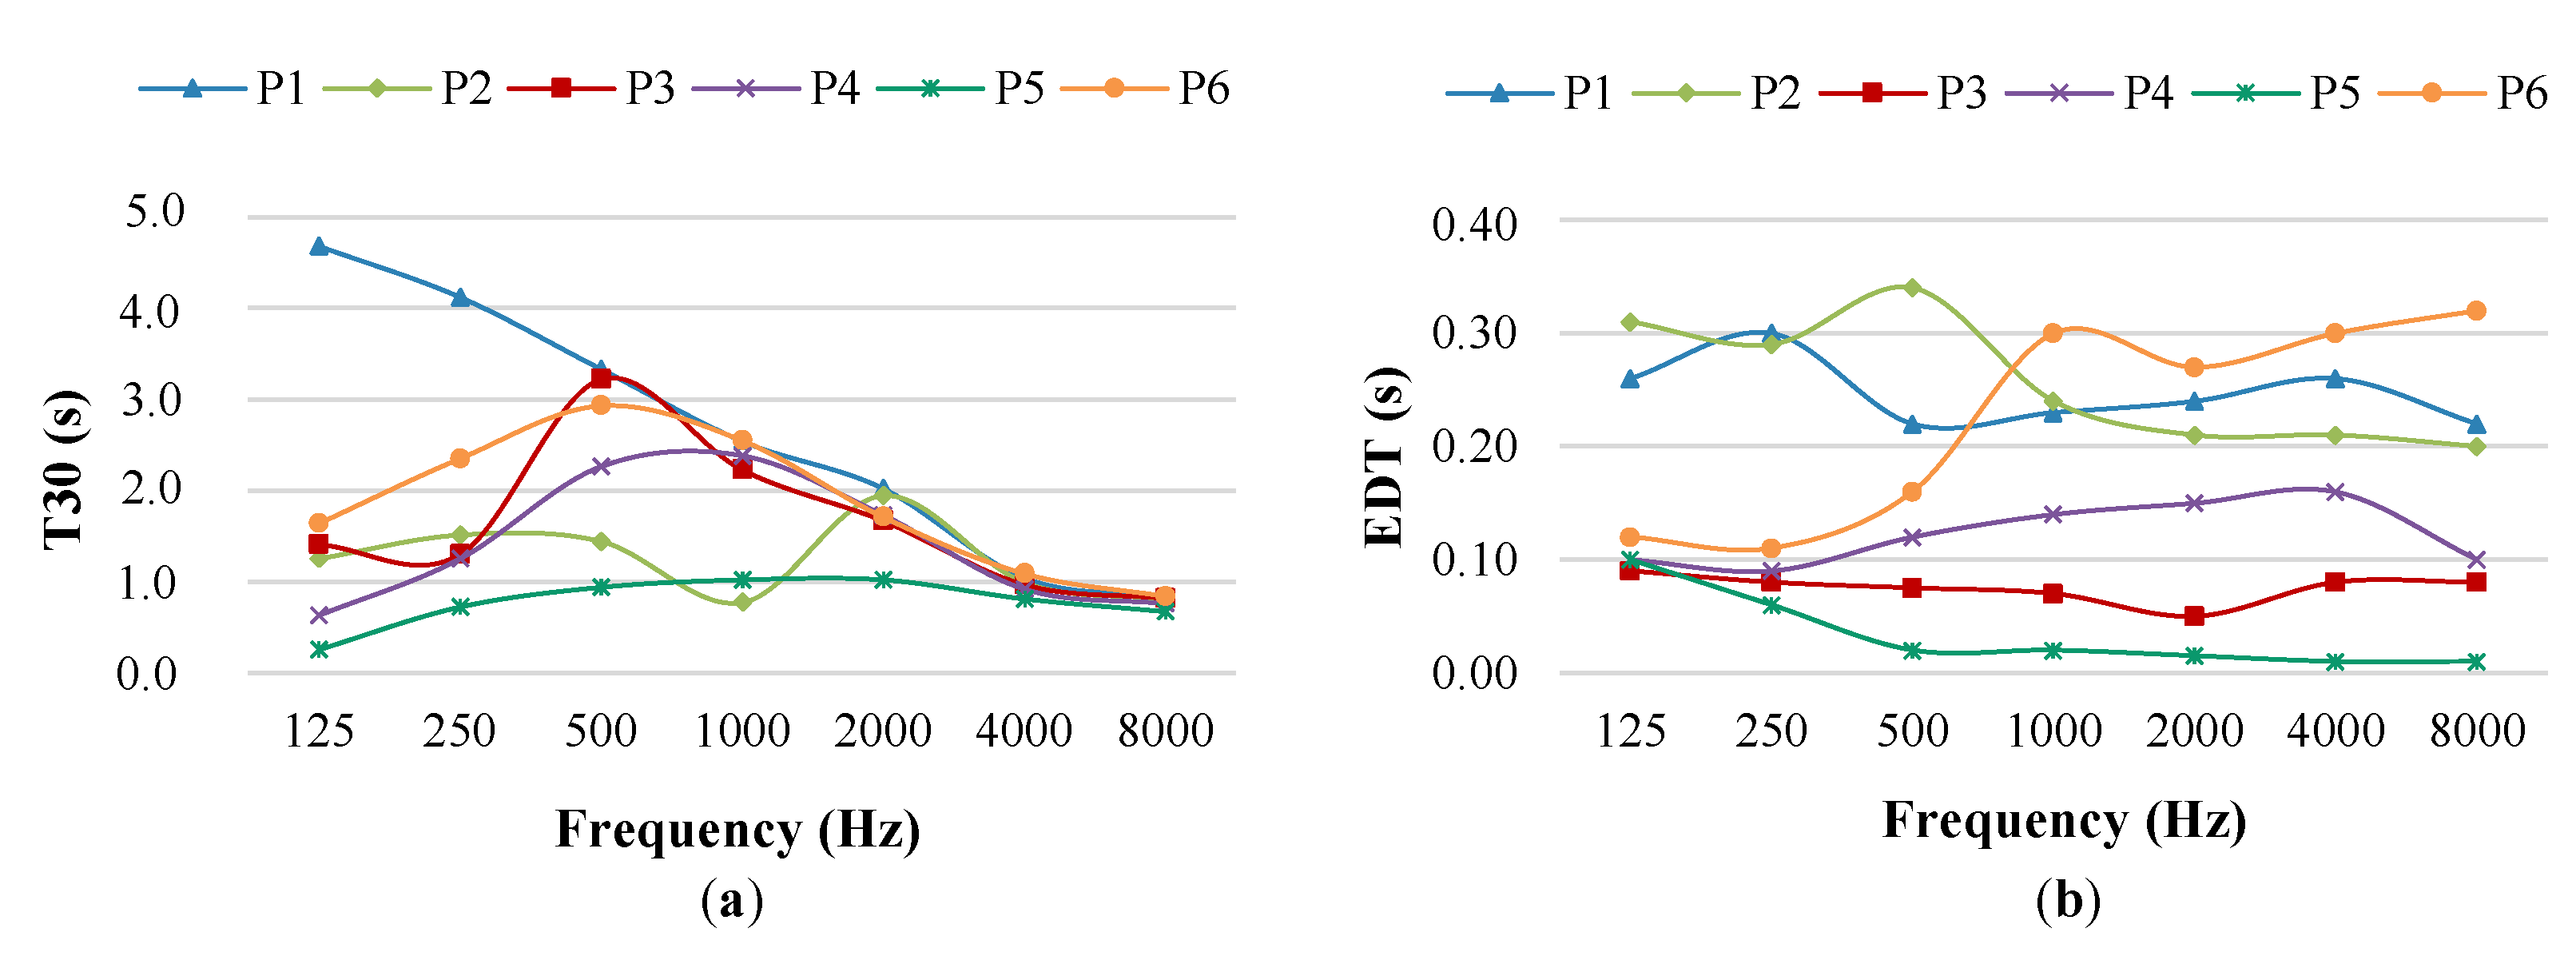
Figure 5 shows the variation of T30 and EDT in the measurement made with source A (bailiff), depending on the location of the receiver.
Figure 6 shows the variation of C80 and C50 in the measurement made with source A (bailiff), depending on the location of the receiver.
3.2. Just Noticeable Difference (JND)
For the calibration of the acoustic model, the absorption coefficients indicated in
Table 2 were established depending on the type of material, taking as reference the values obtained by Vorländer through standardized tests [
36]. As previously stated, a 100% absorbent material was applied to the surfaces representing free field.
Regarding the dispersion coefficients, in this study, three levels were established, based on the roughness of the materials, as established in
Table 3. The values of these coefficients were adjusted during the calibration process of acoustic model. In this environment, the degree of detail of the decoration of the Door of the Apostles is of special importance, which notably increases the dispersion of these surfaces.
The validation of the acoustic model was performed using the JND of parameters C80 and C50. The ISO 3382-1 [
17] standard sets the JND for parameter C80 to 1 dB. However, there are authors who have determined higher values of this threshold from experimental studies. Ahearn et al. established a JND of
dB for parameter C80 [
37]. Höhne et al. placed the JND for C80 in real sound fields around 2.5 dB [
38], results that were confirmed by Witew by using synthetic sound fields [
39]. Regarding parameter C50, the standard does not indicate a specific value of the JND differential threshold. However, there are experimental studies that have analyzed the minimum differences of this parameter in order to be perceived by the human ear. Bradley et al. estimated a JND of 1.1 dB, with an increase of approximately 3 dB being necessary to create an easily detectable improvement in everyday situations [
40]. With all this, it is important to note that today there is no definitive consensus accepted by the entire scientific community [
41]. Taking into account the investigations analyzed, in this study, the JND for the parameters C80 and C50 were established at 2.5 dB for the calibration of the acoustic model.
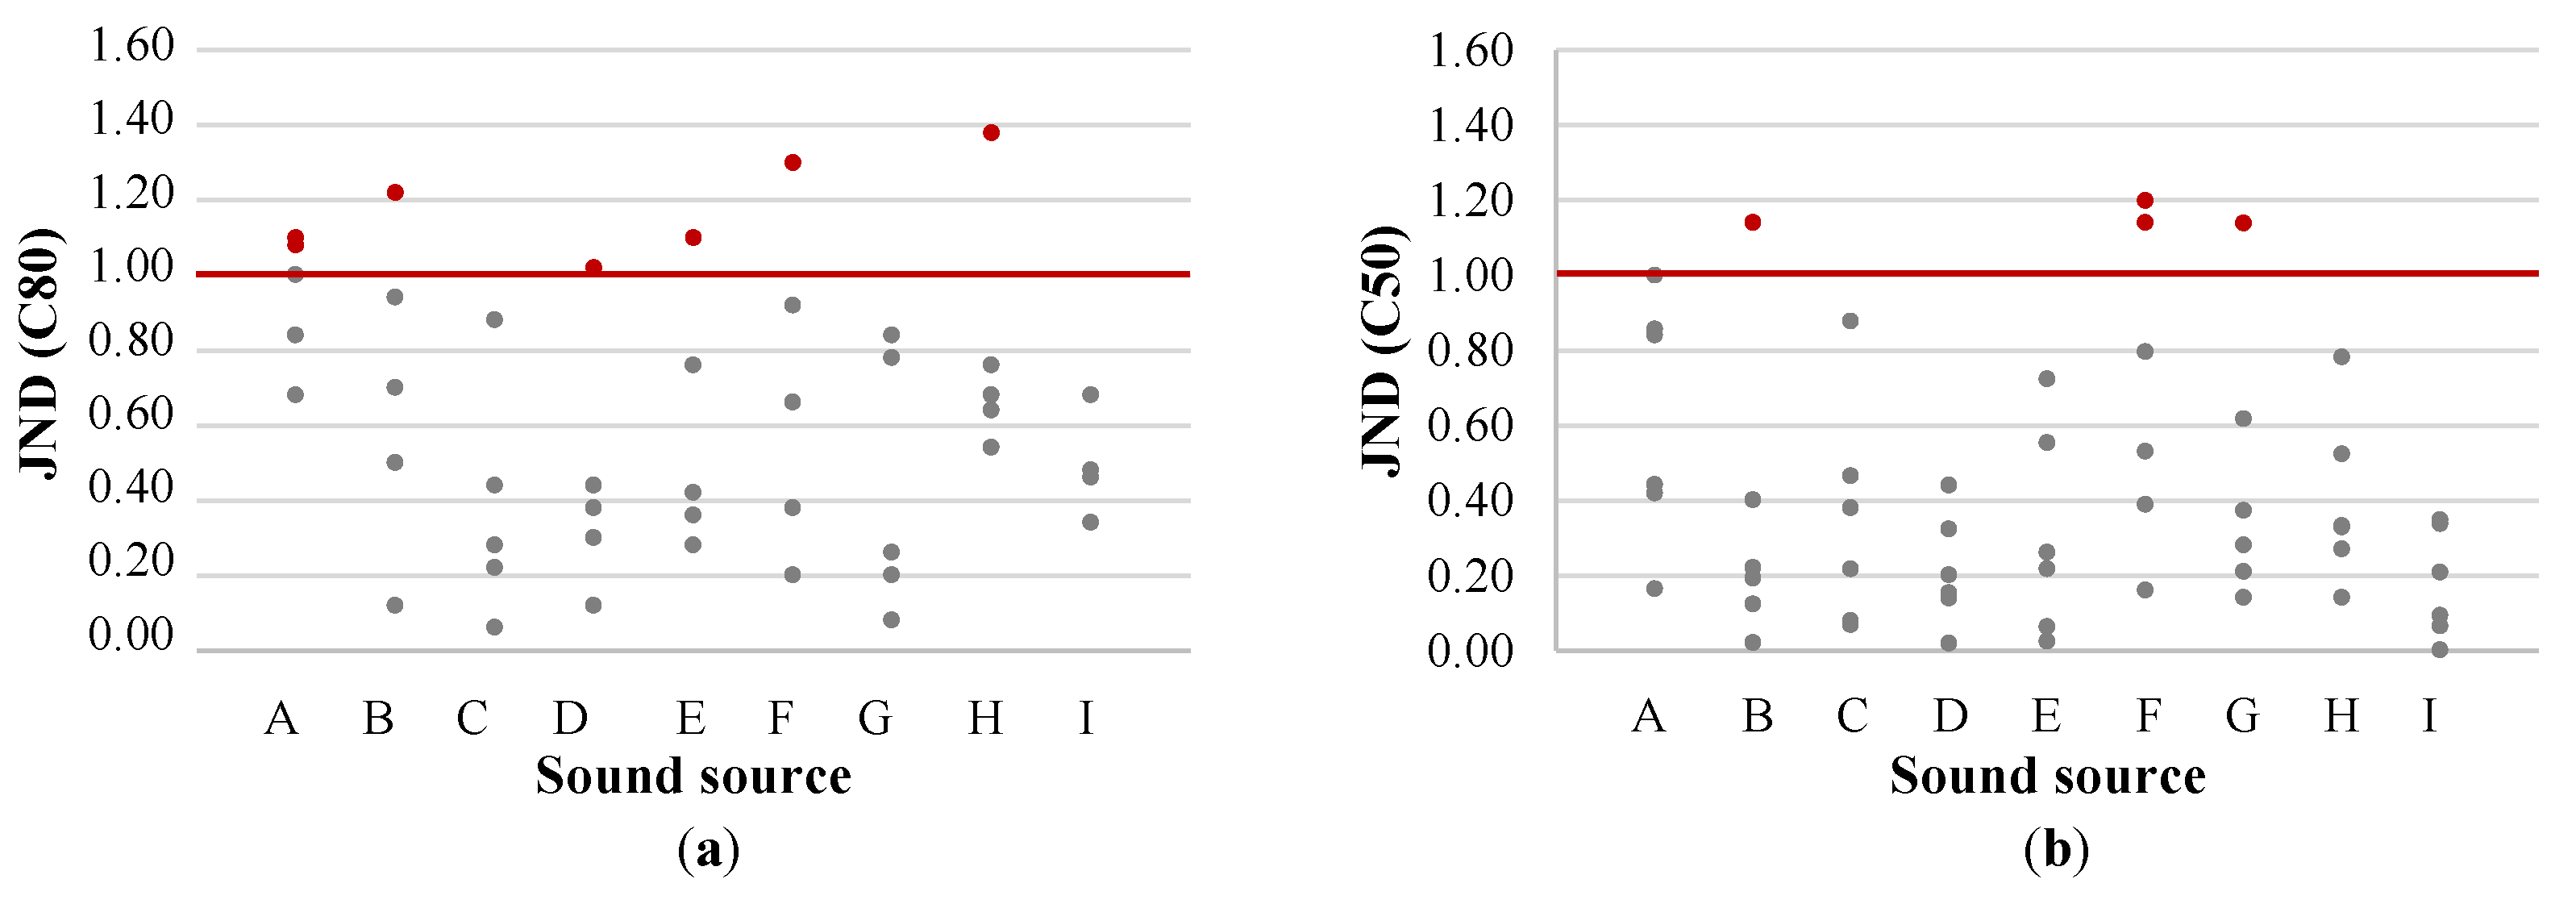
Comparing measurement with ODEON simulation for all points, for parameter C80, we found that 87% of measuring points have a JND equal to or less than unity, the most unfavorable value being 1.38. For parameter C50, said percentage is 93%, all values being below 1.2. In average values, JND of both parameters is less than unity, taking for C80 the value of 0.59 and for C50 the value of 0.40.
Figure 7 shows the dispersion of the JDN values of C80 and C50 with ODEON simulation for each of the sound sources (A–I). The locations of the different judges of the different irrigation ditches correspond to the letters B to I in
Figure 1a. These locations correspond to the measurements taken in the cultural heritage environment. The location of the bailiff is next to the position of A.
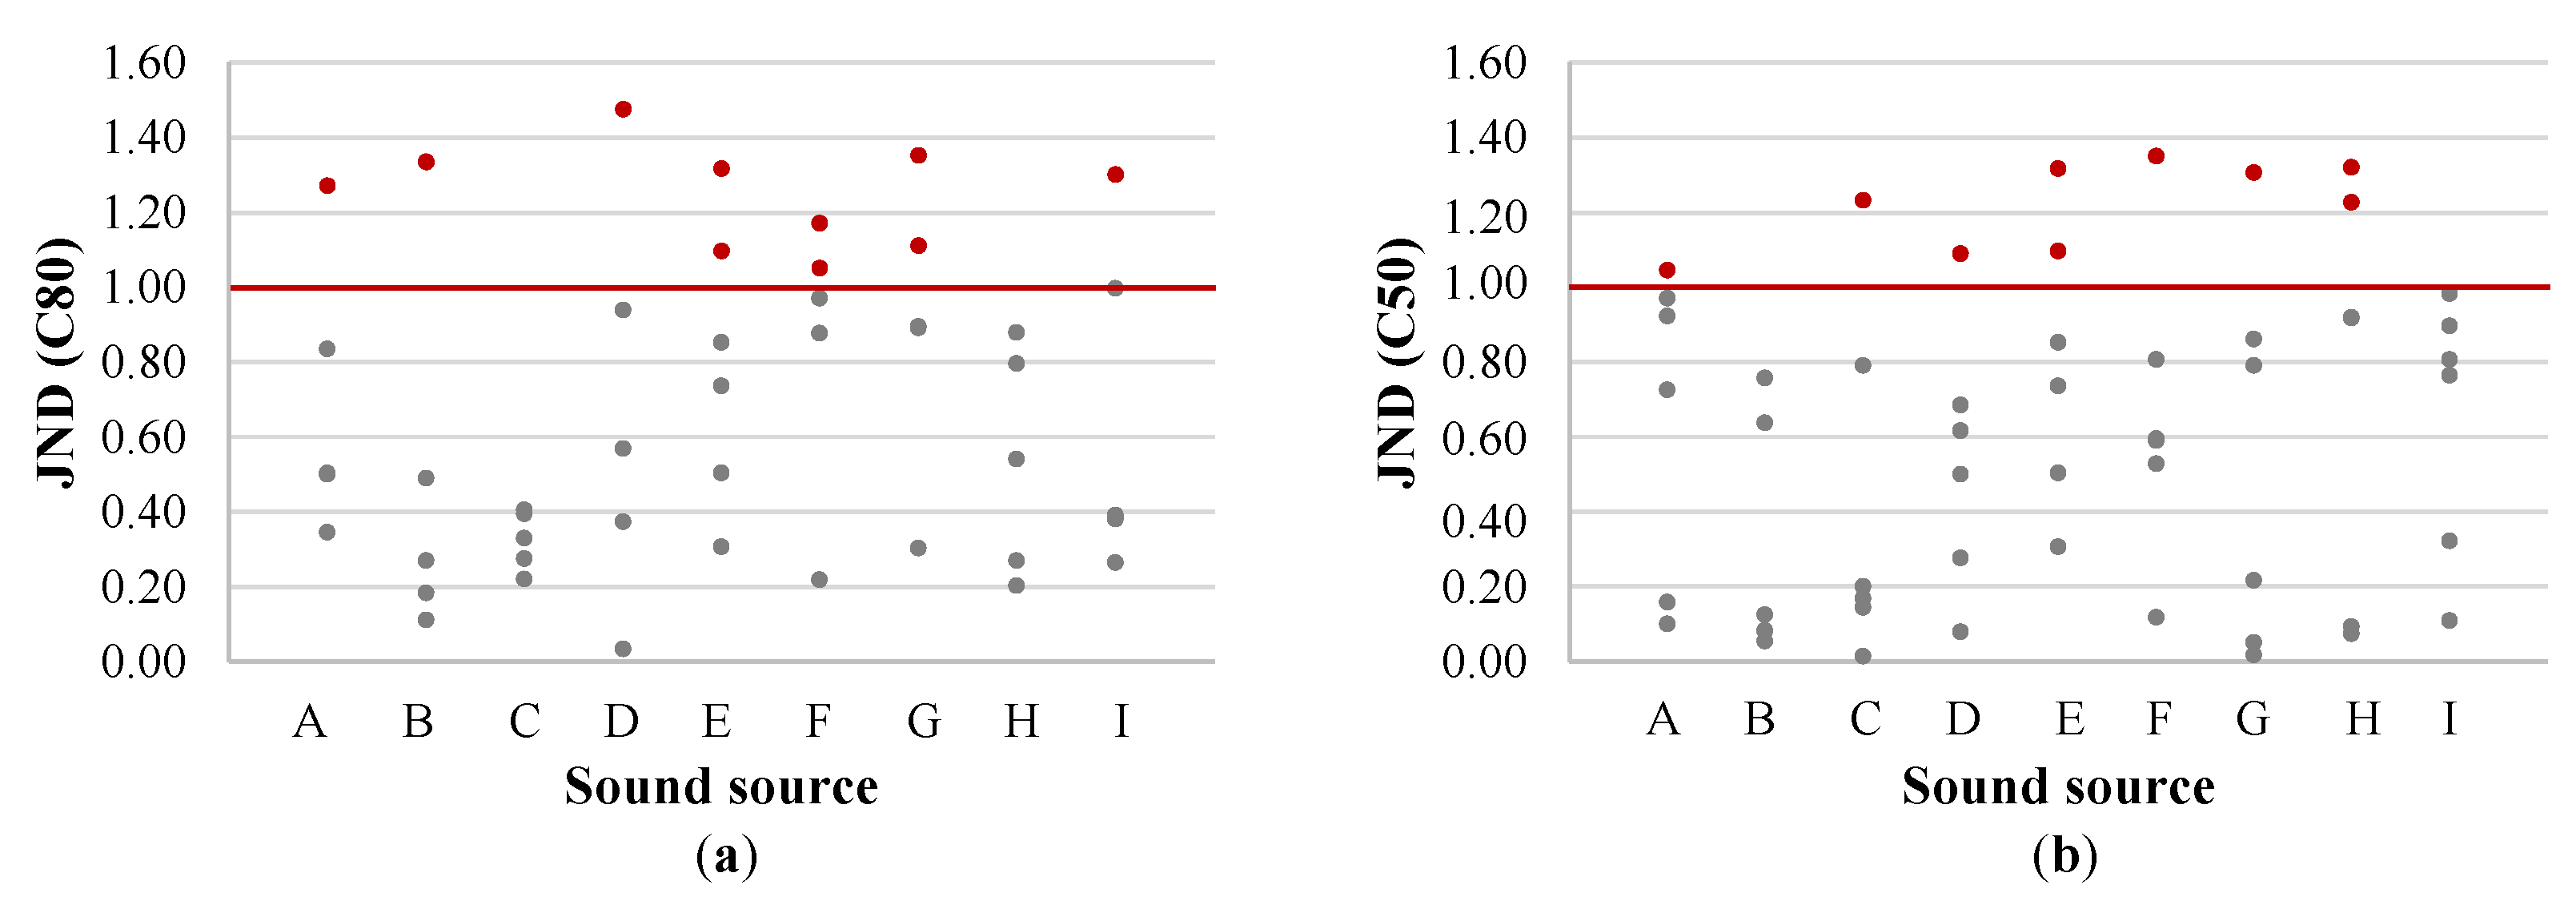
Comparing the measurement with the simulation in CATT-Acoustic, for parameter C80 we find that 81% of measuring points have a JND equal to or less than one, presenting the most unfavorable value at this point (1.47). For parameter C50, said percentage is 83%, the most unfavorable value being 1.35. In average values, JND of both parameters is less than unity, taking for C80 the value of 0.67 and for C50 the value of 0.56.
Figure 8 shows the dispersion of the JND values of C80 and C50 with CATT-Acoustic simulation for each of the sound sources (A–I).
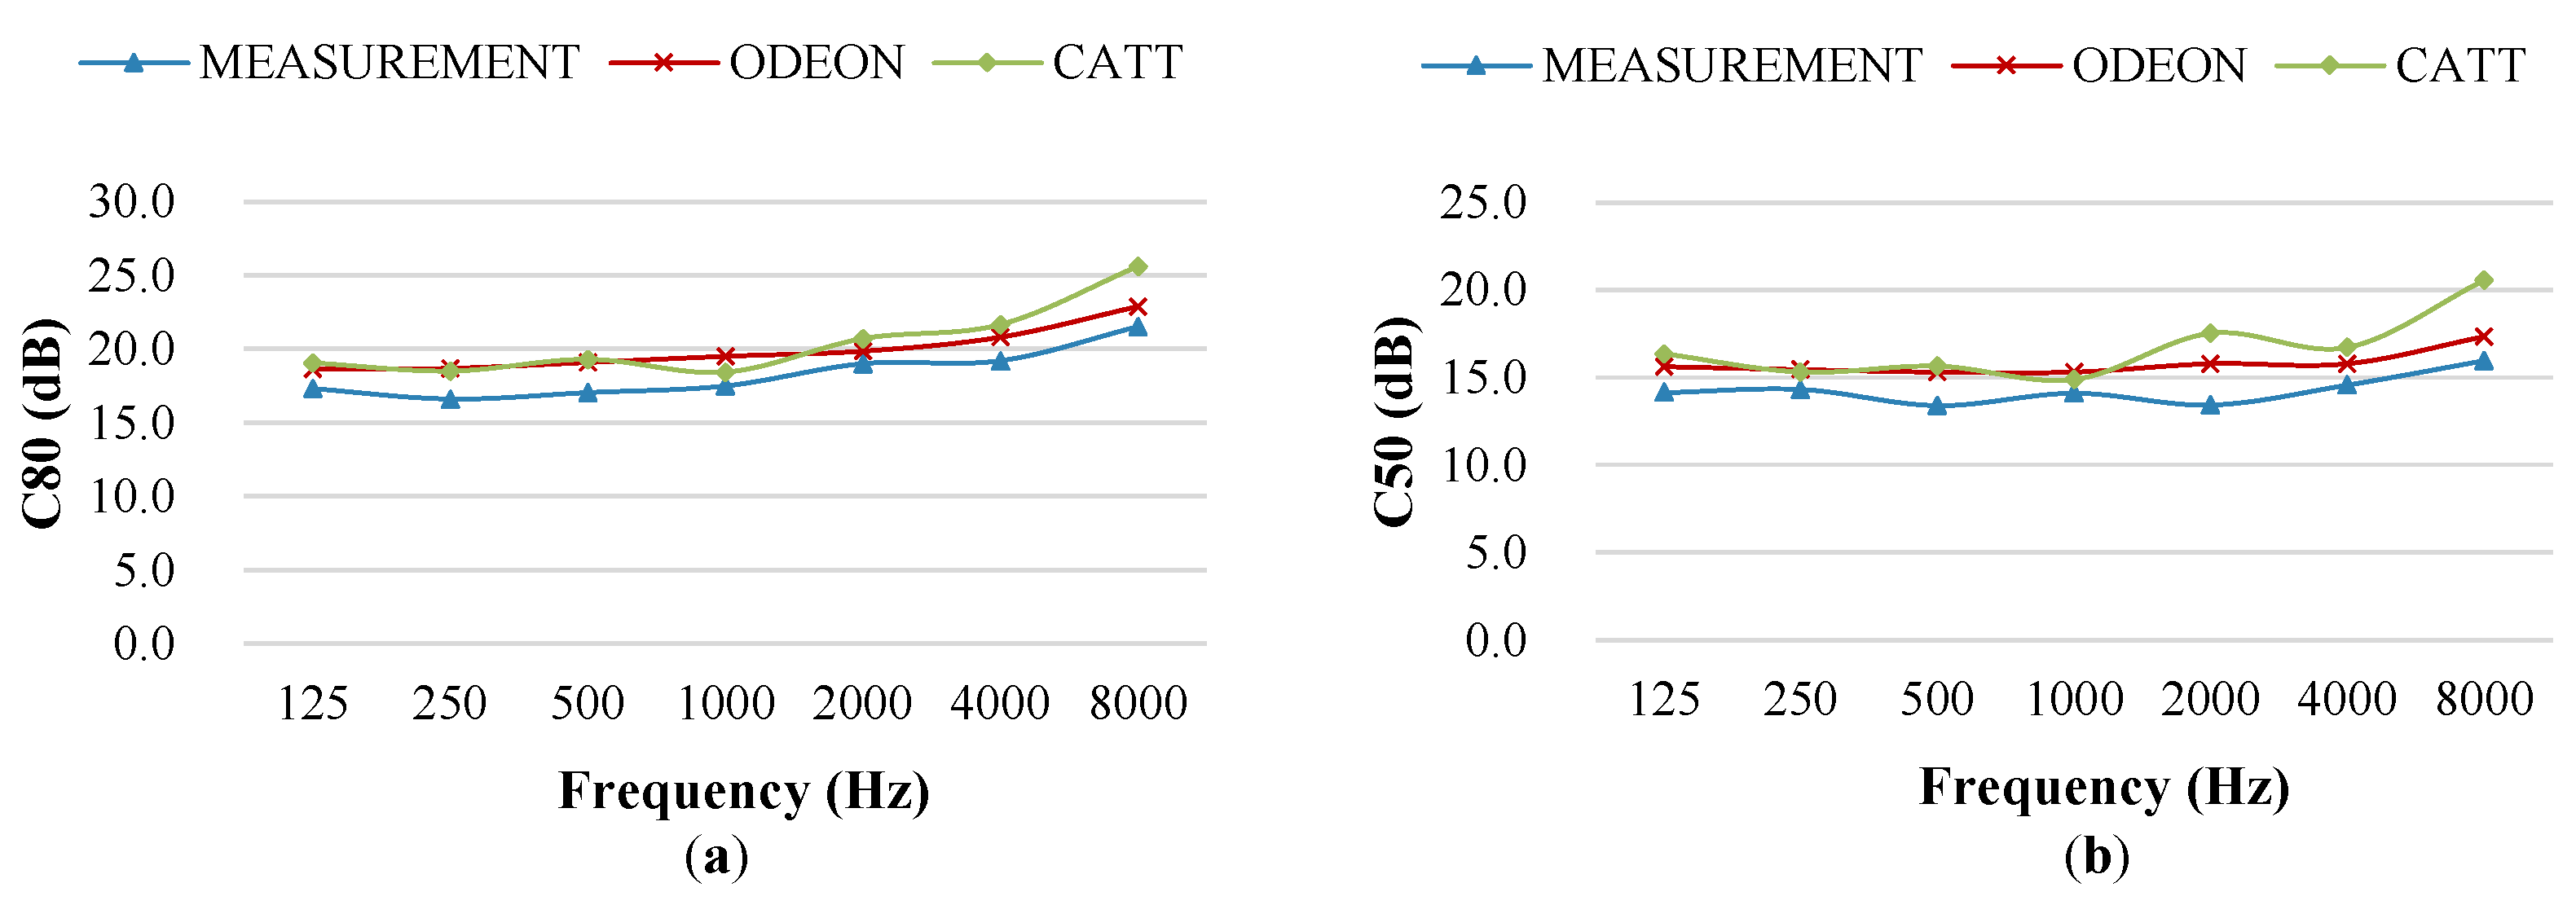
Figure 9 shows a comparison between measurement and simulations with ODEON and CATT-Acoustic of C80 and C50 average values obtained with sound source A. In these representations it can be seen how both pieces of acoustic software adequately reproduce the behavior of C80 and C50 in the singular acoustic environment studied.
In view of the results obtained, the calibration of the acoustic model in both software, ODEON and CATT-Acoustics, is considered valid, presenting the ODEON simulation best JND values.
3.3. Statistical Analysis of Results
The results obtained in the measurement and in the simulations with the ODEON and CATT-Acoustic software were analyzed by means of a statistical study of the correlations between the different elements and a global reliability analysis.
This reliability analysis is based on the (Pearson) correlation, the Cronbach’s alpha coefficient, and the intraclass correlation index between acoustic parameters obtained for measurements and for simulations.
The Cronbach’s alpha (
) is a coefficient used to measure the reliability of a measurement scale, but as there is no p-value associated to allow hypothesis rejection of scale reliability, we cannot use it as a rule of thumb. However, the closer it is to its maximum value, which is 1, the greater the reliability of the scale [
42]. In addition, the intraclass correlation index (ICC) is a descriptive statistic that can be used when quantitative measurements are made on units that are organized into groups. It describes how strongly units in the same group resemble each other. Sometimes, it is perceived as a type of correlation, but unlike most of the other correlation measures, it operates on data structured as groups, rather than data structured as paired observations [
42].
Below is the comparative analysis performed for time parameters T30 and EDT, and energy parameters C80 and C50.
3.3.1. T30 and EDT
Table 4 shows the correlations between the measurement and the simulations with ODEON and CATT-Acoustics of the temporal parameters T30 and EDT. In the case of T30, both simulations show a moderate correlation with the measurement (ODEON 0.534 and CATT-Acoustics 0.576), while there is a very high correlation between both simulations (0.870). For EDT, the ODEON simulation shows a moderate correlation with the measurements (0.544), while the correlation between the CATT-Acoustic simulation and the measurement is low (0.285). On the other hand, the simulations between both pieces of software have a moderate correlation (0.519).
In
Figure 10, the dispersion by frequencies of T30 and EDT is observed as a function of the location of the source at the measurement point 1. For parameter T30, the measurement results are those that represent a greater dispersion, while simulation results with ODEON turn out to be the most stable. Furthermore, a decrease in dispersion can be observed in medium and high frequencies both in the measurement and in both simulations. In the case of EDT, simulation results with CATT-Acoustics represent the greatest dispersion, while simulation results with ODEON remain the most stable.
Table 5 shows the reliability statistic and the interclass correlation for T30 and EDT. The internal consistency of T30 is good (
), while that of EDT is questionable (
). On the other hand, T30 presents an interclass correlation coefficient with a substantial degree of agreement (
), while the degree of agreement for EDT is regular (
).
3.3.2. C80 and C50
Table 6 shows the correlations between the measurement and the simulations with ODEON and CATT-Acoustics of energy parameters C80 and C50. In the case of C80, a high correlation is observed between the measurements and the simulation with ODEON (0.728) and between both simulations (0.777). However, the correlation between measurement and simulation with CATT-Acoustic is moderate (0.558). For the C50 parameter, a moderate correlation is observed both between the measurements and the simulations (ODEON 0.643 and CATT-Acoustic 0.524), and between both simulations (0.683).
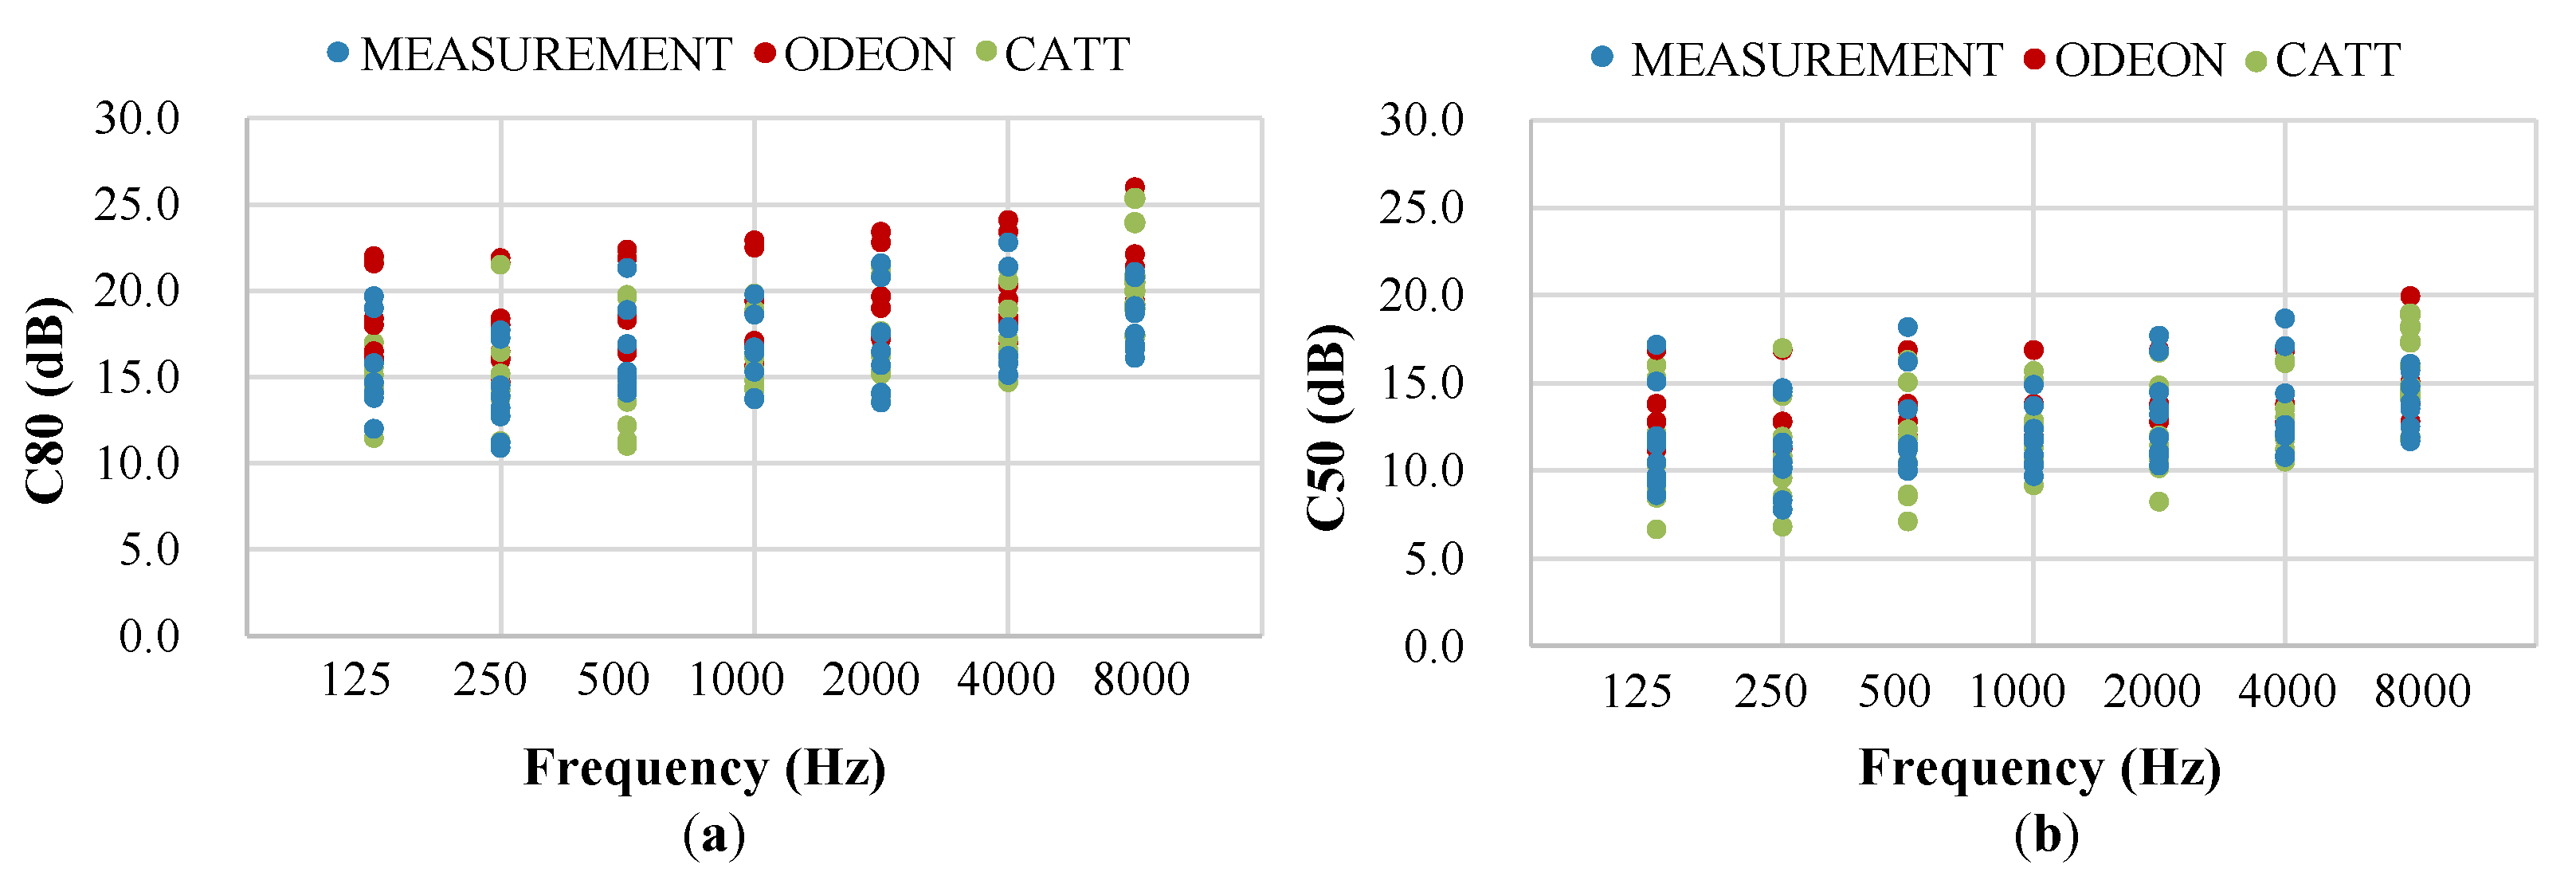
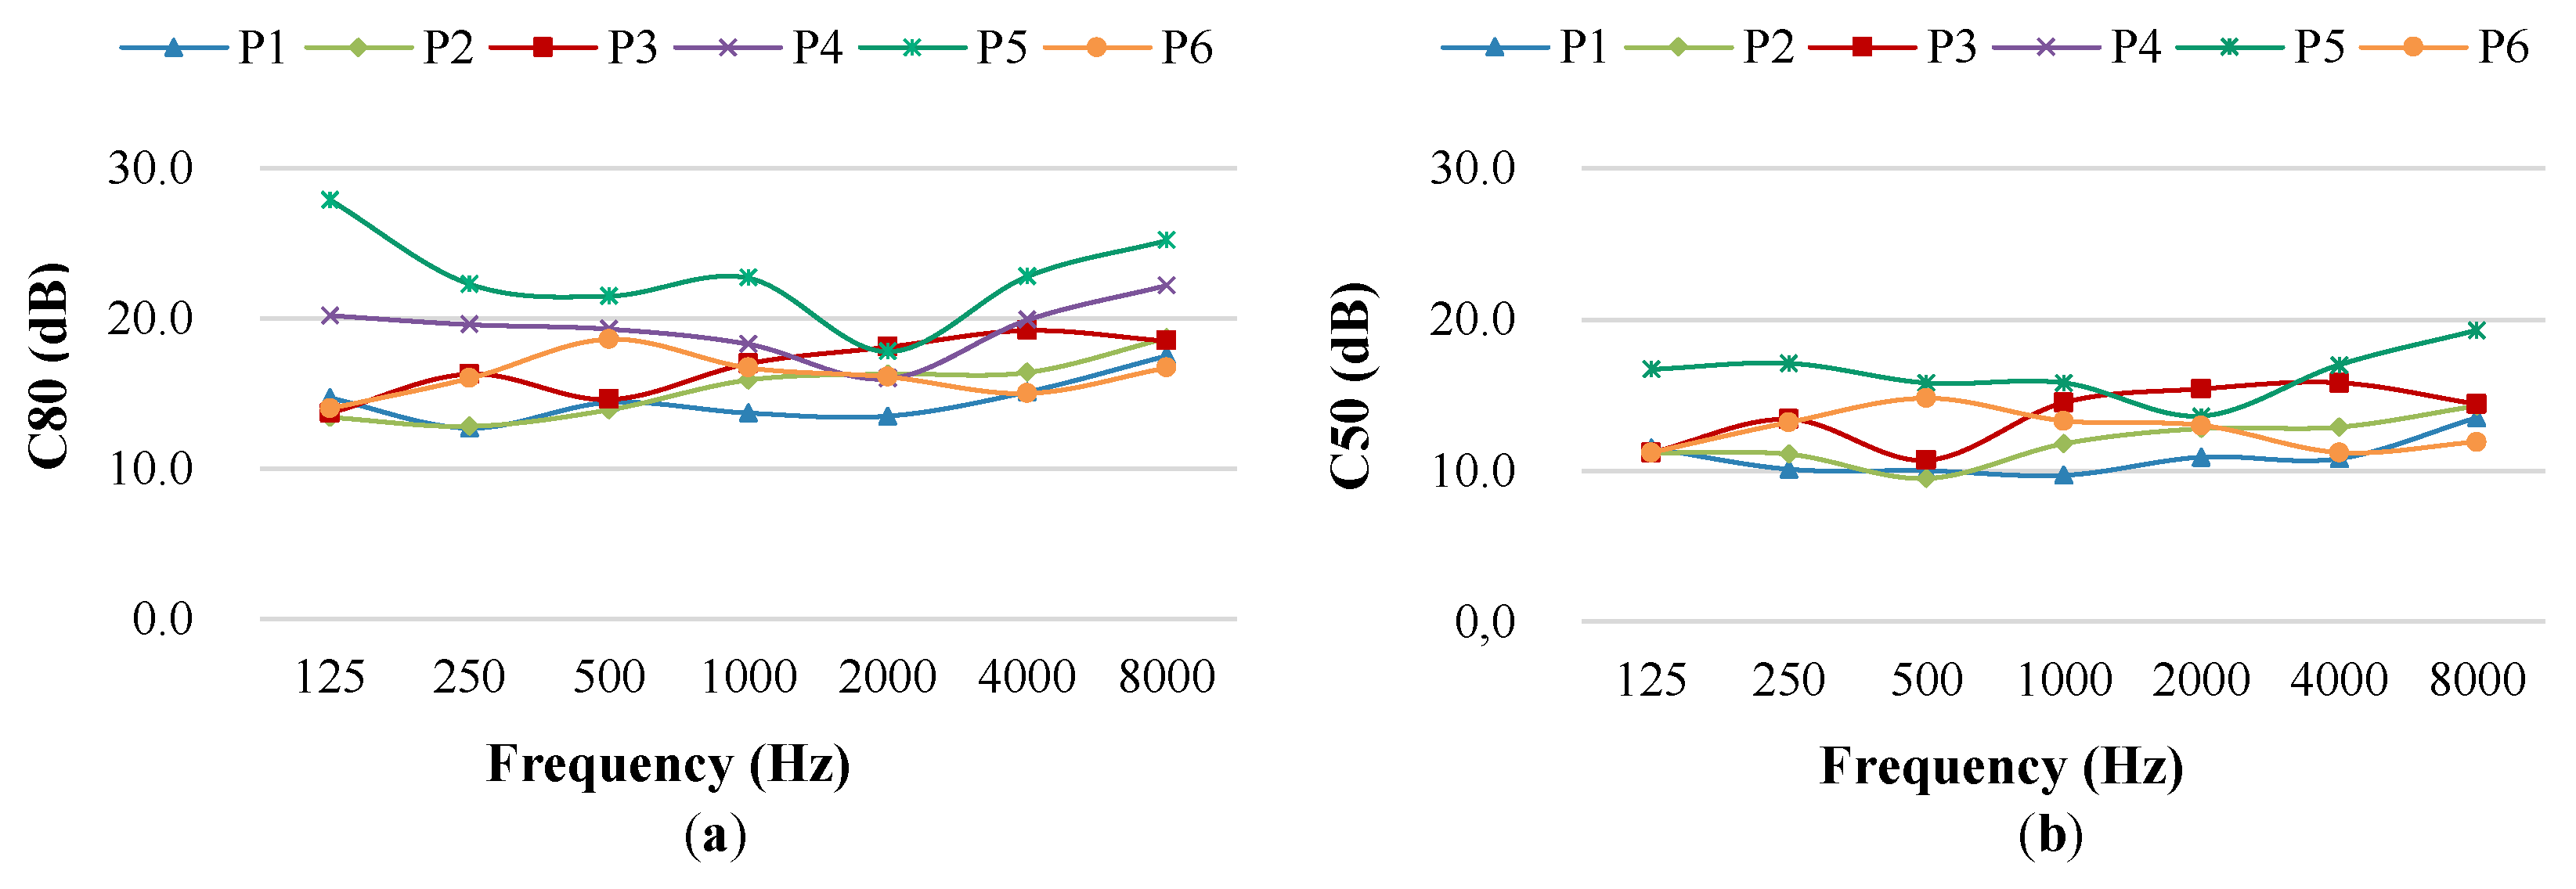
Figure 11 shows the variation by frequencies of C80 and C50 as a function of the location of the source for the measurement point 1. In this case, both measurements and simulations present a lower dispersion compared to the results obtained for T30 and EDT.
Table 7 shows the reliability statistic and the interclass correlation for C80 and C50. The internal consistency in both cases is good (
). On the other hand, C80 presents an interclass correlation coefficient with a substantial degree of agreement (
), while the degree of agreement for C50 is moderate (
).
3.3.3. Sound Source Measurement
After the recordings in the anechoic chamber and the evaluation of the sound pressure levels (SPL) at each direction (explained in
Section 2.2.1), an interpolation (with
splines) was applied in order to obtain the SPL every 10 degrees, in accordance with the procedure used by ODEON software and following the orientation of the maximum value (red point in
Figure 4).
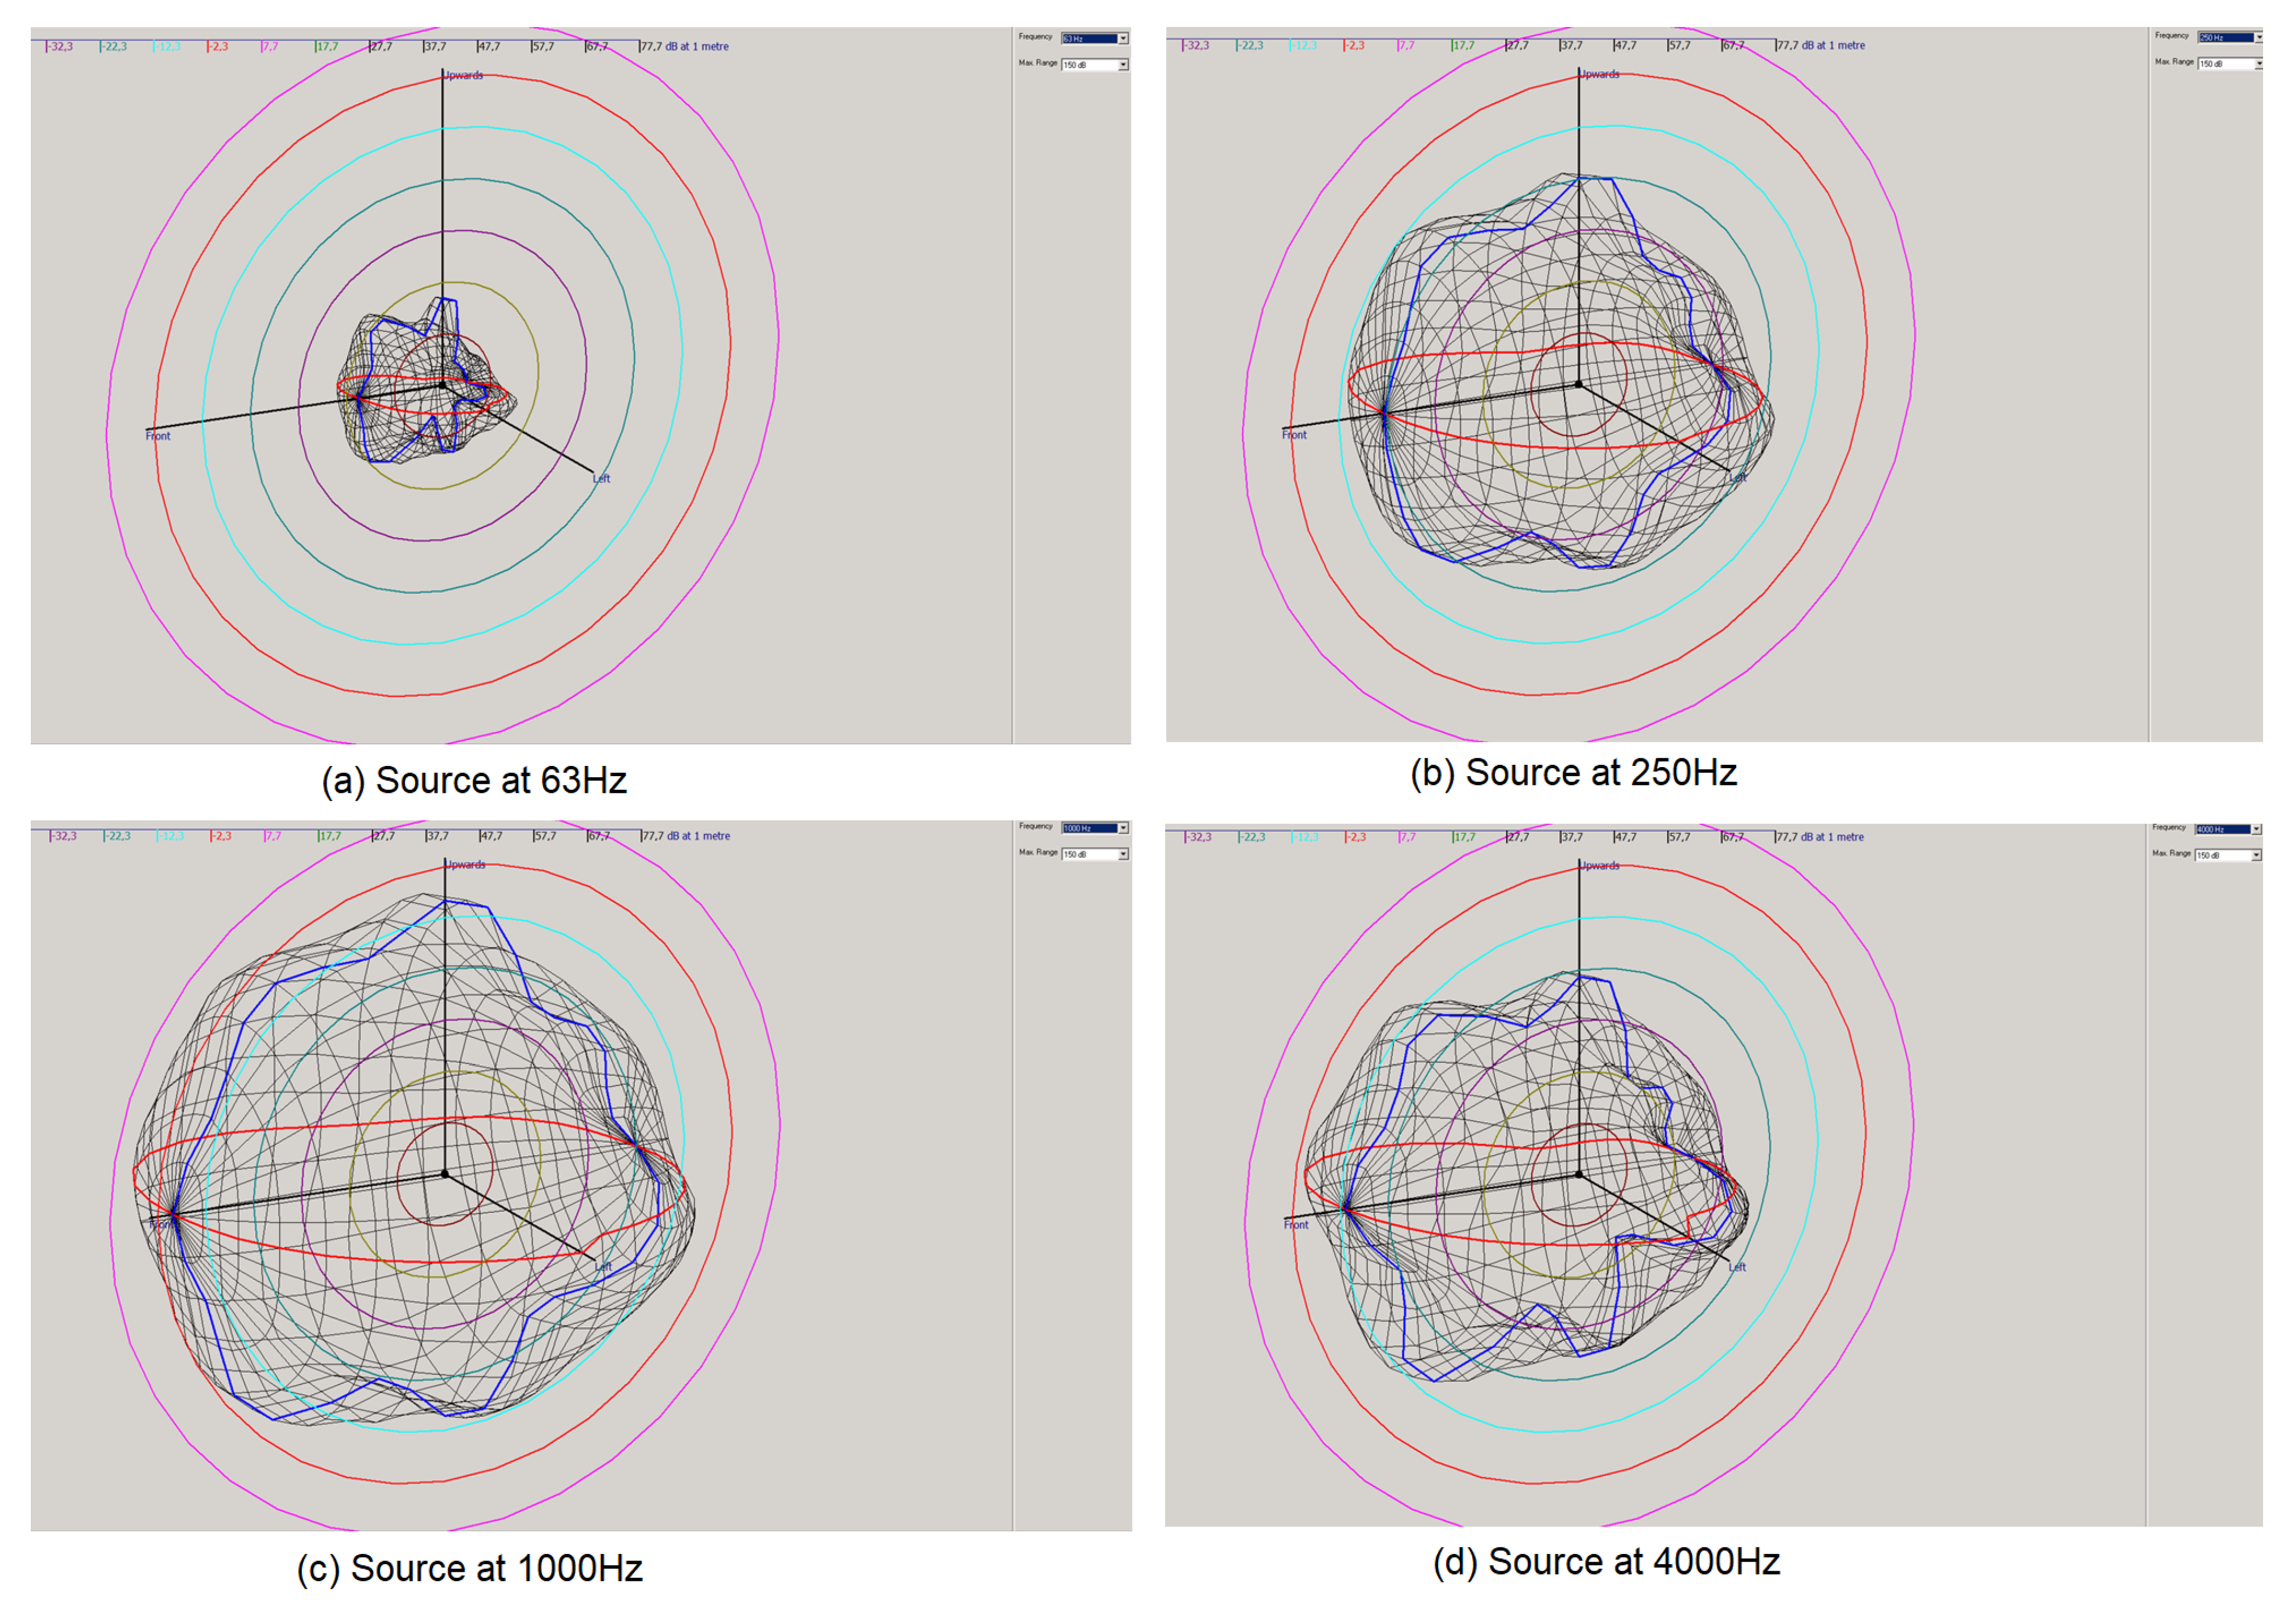
Figure 12 shows the 3D sound source diagram for different frequencies in ODEON software (the sound source in ODEON format (that is SO8) and CLF format can be downloaded from
http://github.com/ACUSVIRT/Tribunal, accessed on 12 April 2022). After the calibration of the model with an omnidirectional source, the auralization was achieved with the bailiff’s sound source.
3.4. Visual Simulation
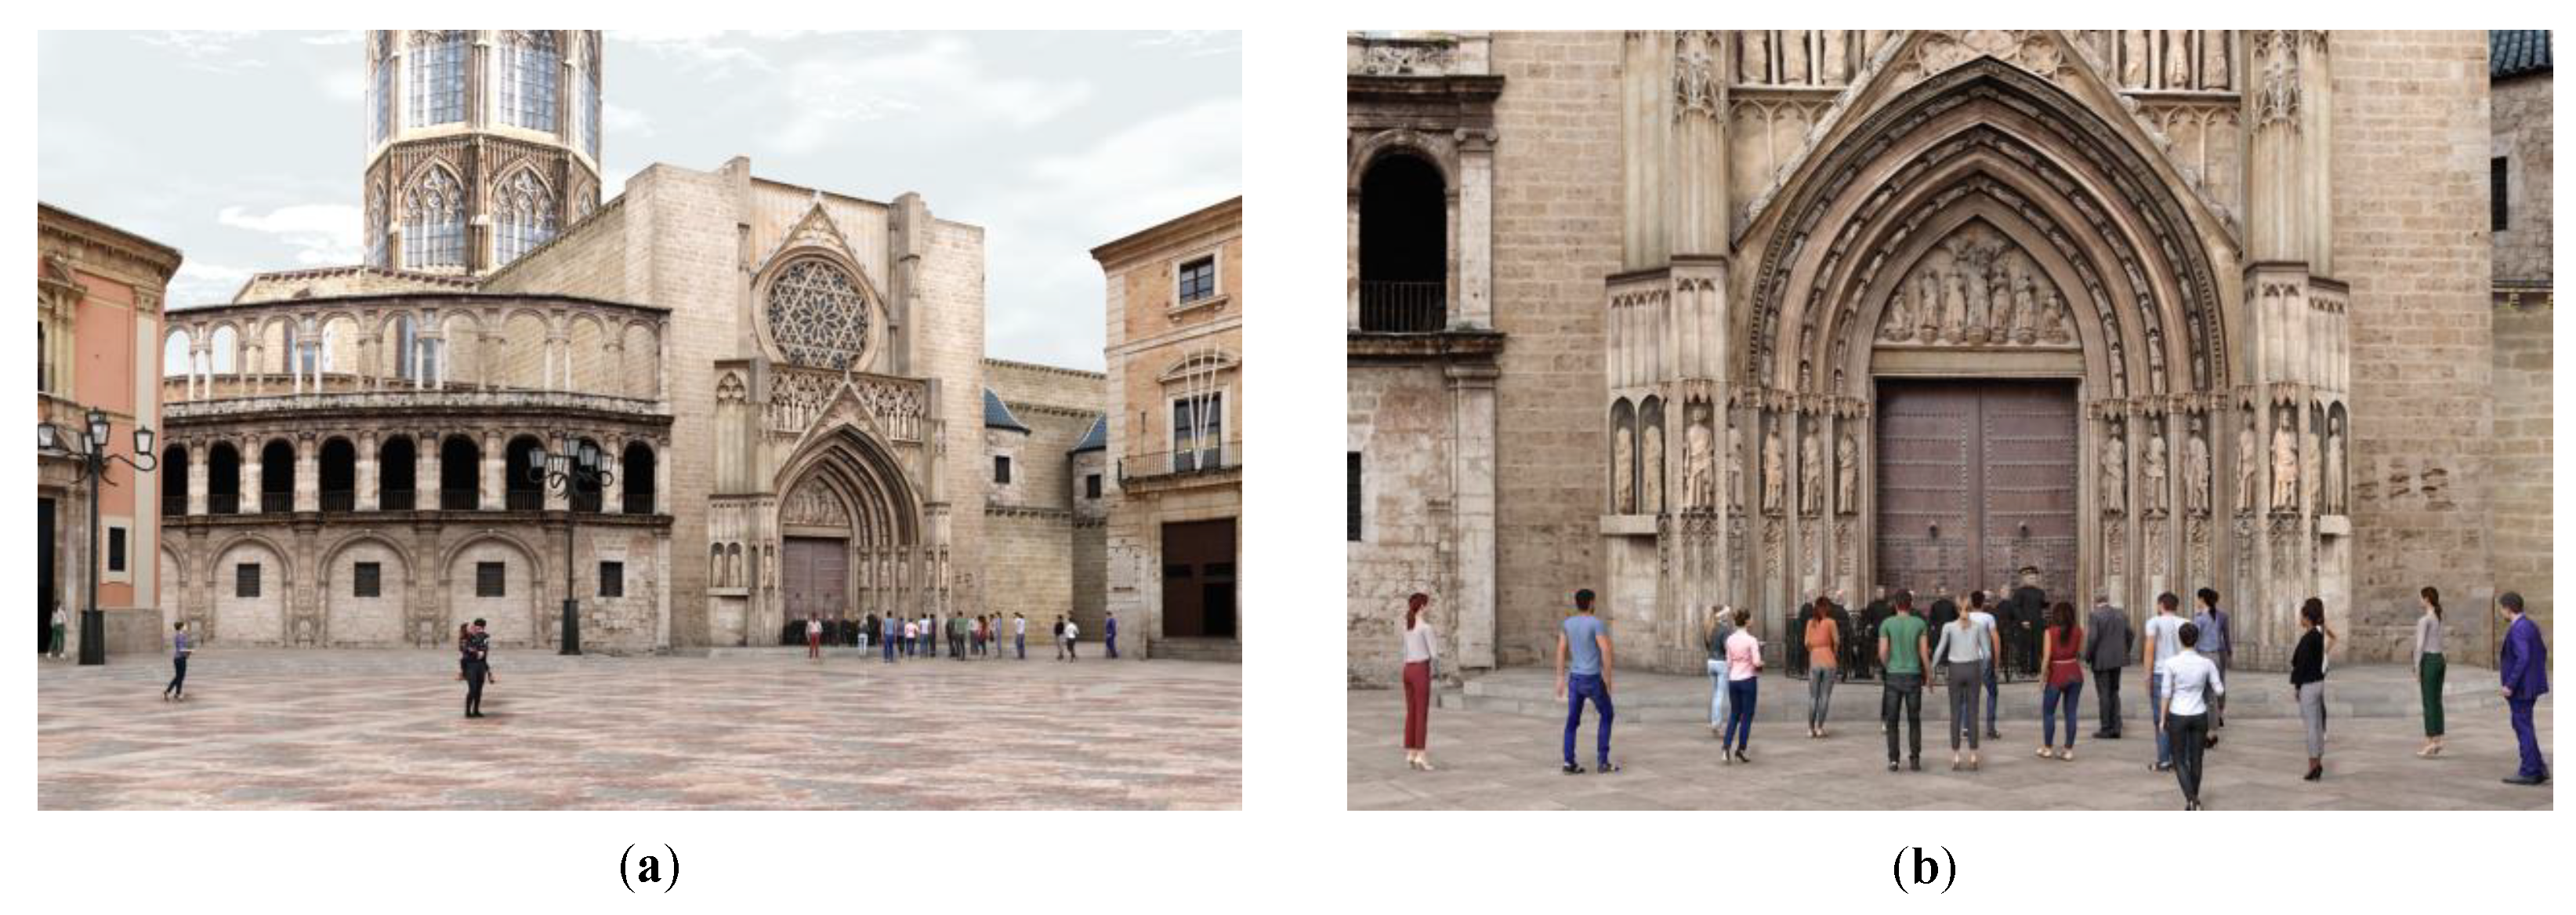
In
Figure 13, a view of the final result of the visual simulation is shown. To give the simulation more realism, 3D models of people were incorporated to represent the members of the Water Tribunal and the spectators. With the aim of disseminating the study carried out, you can enjoy the virtual tour of the environment of the Water Tribunal on the official page of the Virtual Acoustics Research Group (ACUSVIRT) [
43].
3.5. Psychoacoustic Parameters
Taking into account the results and code obtained by Pastor et al. in [
44], the audio signal generated after the auralization was processed to compute the psychoacoustic parameters (that is, loudness, sharpness, roughness, fluctuation strength, and tonality—together with the Zwicker’s psychoacoustic annoyance) with a specific software programmed in Matlab [
45].
Table 8 summarizes the computed values for the average value and standard deviation for the different parameters.
These values can be related to the subjective response evaluated with the public survey based on the Swedish Soundscape Quality Protocol. In our case, a total of 30 surveys were carried out, 61.5% of which were conducted by men and 38.5% by women. In addition, the information on the age ranges of the respondents corresponded to those under 30 years of age (7.7%), between 30 and 50 years of age (34.6%), and over 50 years of age (57.7%). The statistical mode value of the description of the global soundscape is good (2), with average equal to 2.3 and standard deviation equal to 1.2, while the statistical mode value in the evaluation of the appropriateness of the global soundscape to the perceived environment is very appropriate (4), with average value equal to 3.4 and standard deviation equal to 1.1.
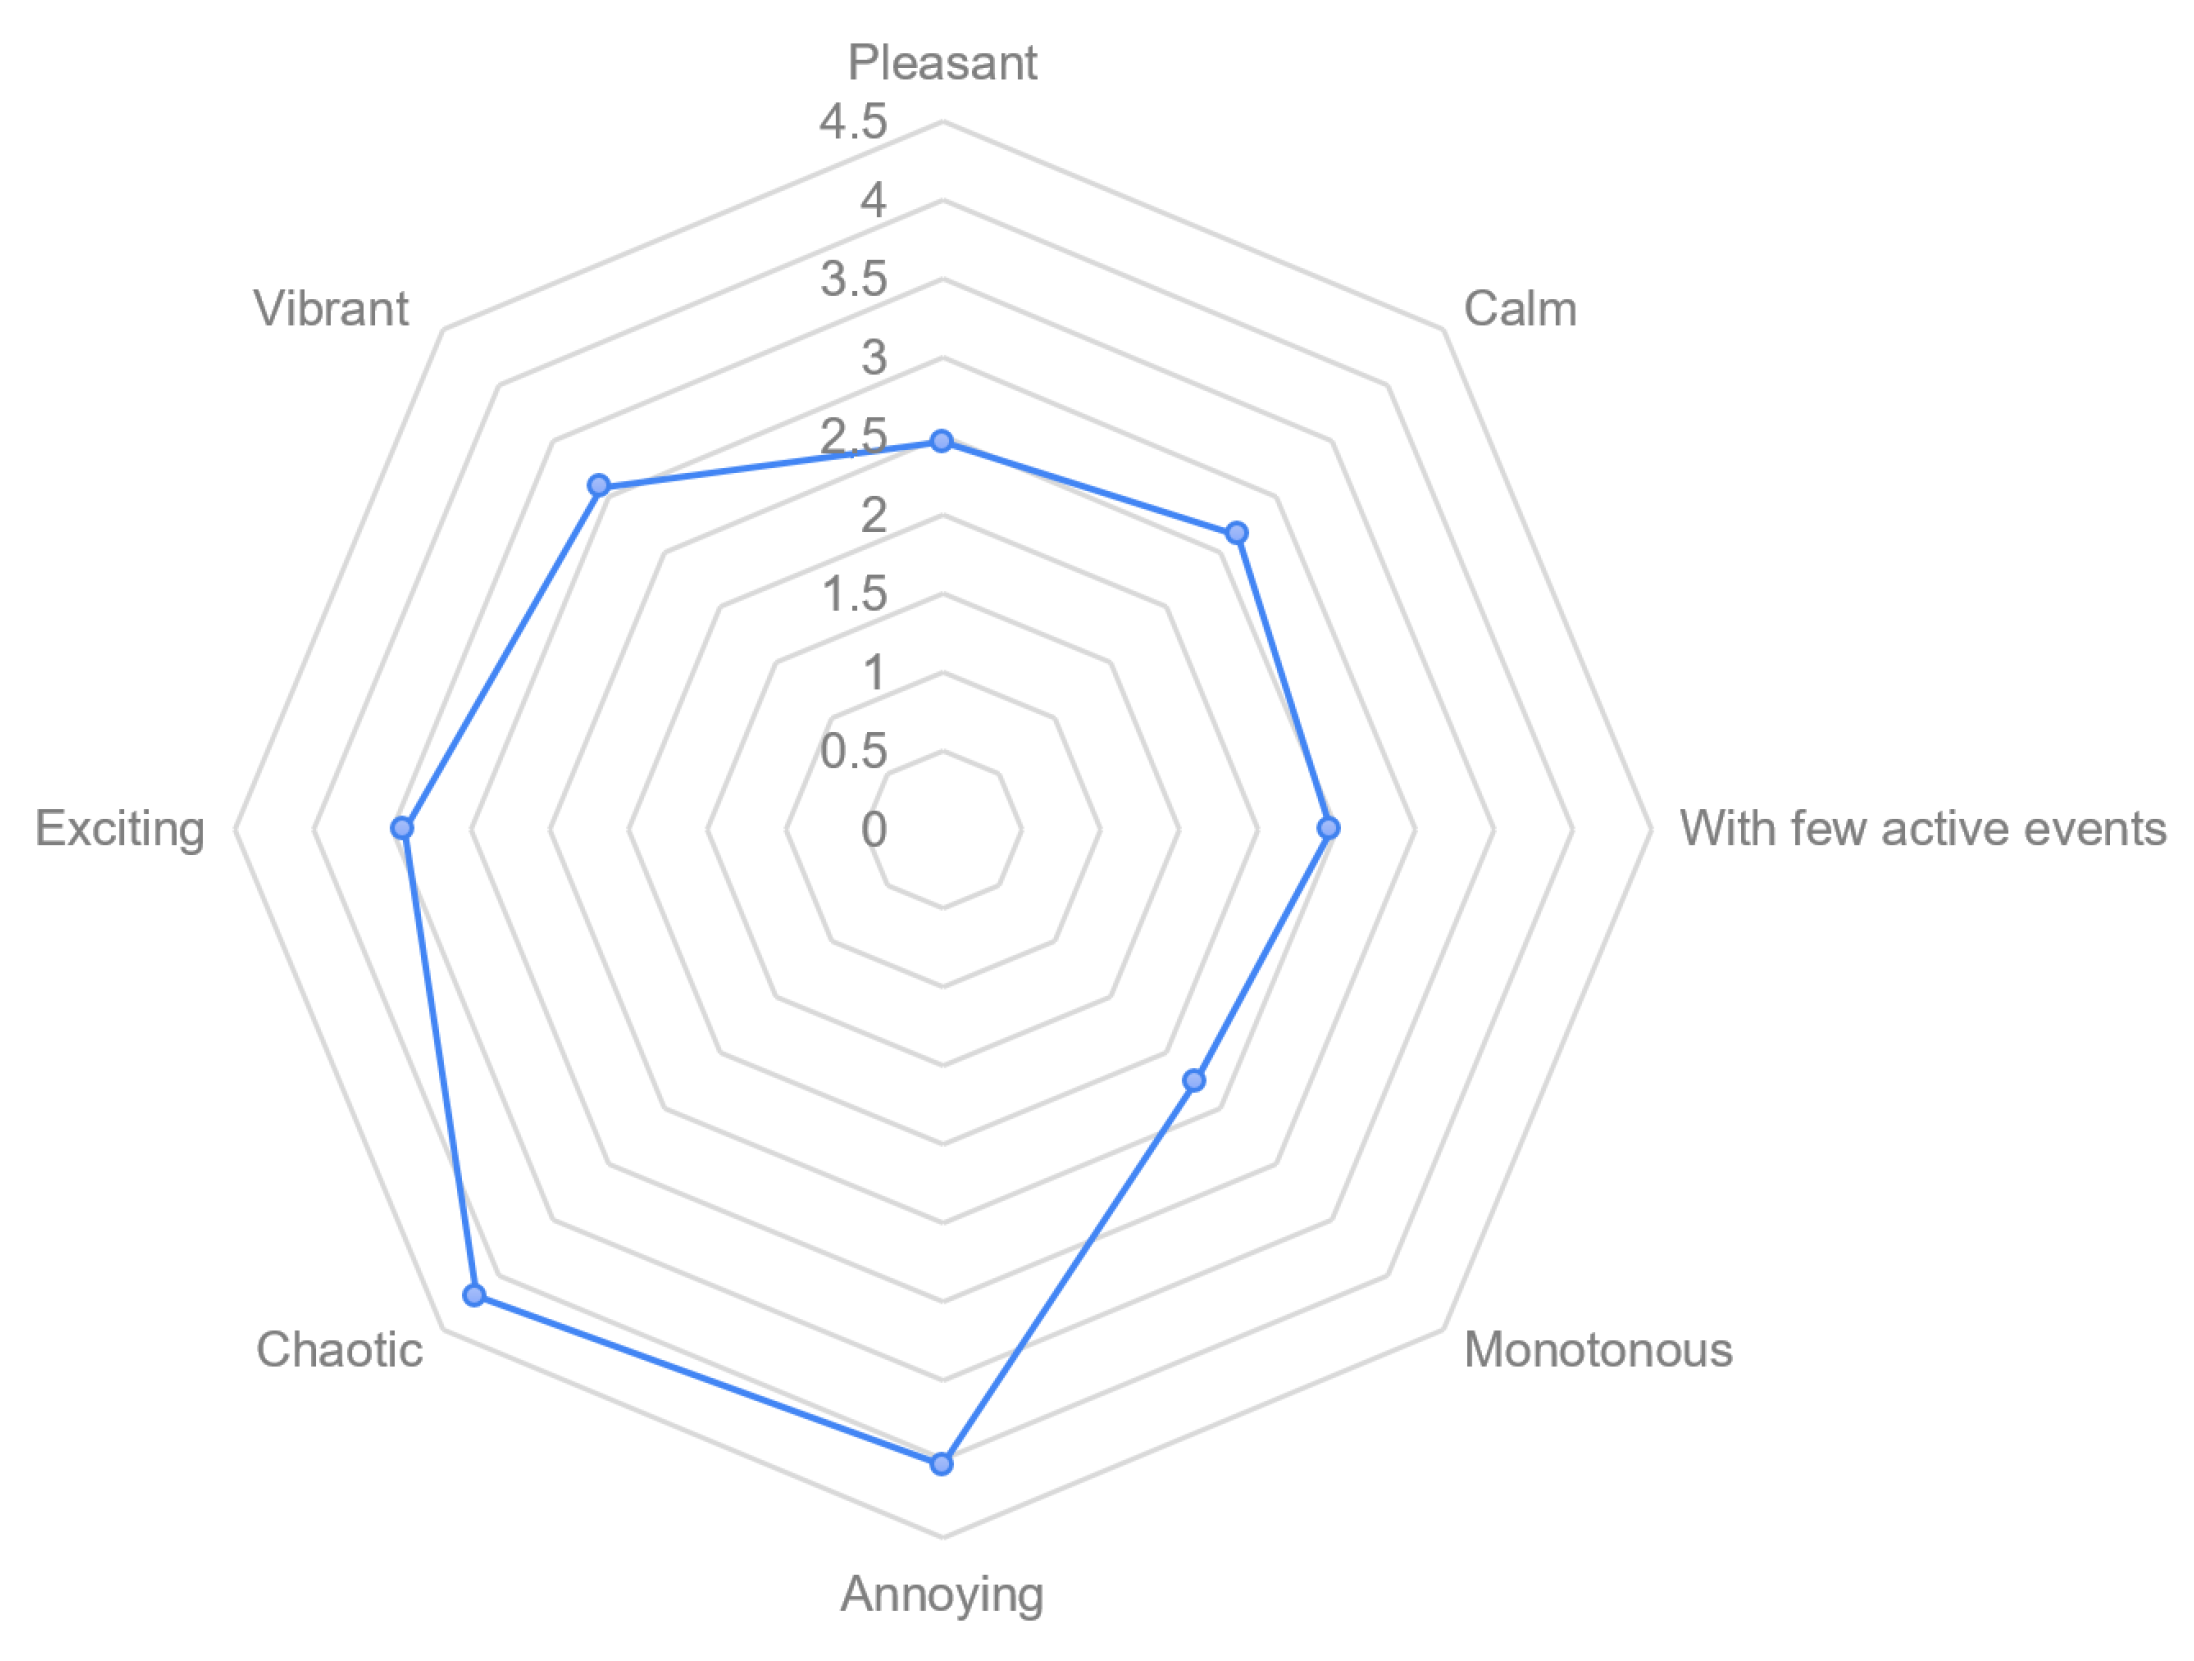
Figure 14 shows the overall averages of the subjective ratings (on a scale of 1 to 5, where 1 is “strongly agree” and 5 is “strongly disagree”) for each of the respondents’ perceived soundscape ratings. This figure shows that, in general, although listeners perceive the soundscape as little annoying (4.03/1.37), little chaotic (4.19/1.05), and slightly exciting (3.42/1.27) due to the perceived reverberation, they interpret it as monotonous (2.26/1.25) and little active (2.46/1.48) as the auralized event just presents one main sound source, which is the bailiff, but with the interpolated reverberation in each position. Therefore, the environment is perceived as somehow pleasant (2.46/1.24) due to the ambient reverberation that does not allow the source to be perceived properly at some points.
According to the average value of the psychoacoustic annoyance obtained in
Table 8 compared with the results shown in [
44,
45], we found that the results in the survey are in good accordance with the subjective perception, qualified as “little annoying”.
4. Conclusions
In view of the data obtained, the calibration carried out on the acoustic model in both pieces of software, ODEON and CATT-Acoustic, is considered valid, presenting the ODEON simulation with better JND values. These results show the applicability of the tools and procedures used in closed spaces for the acoustic study of open and semi-open heritage environments, being necessary to make certain adaptations. For the acoustic simulation it was necessary to lift a closed model in which a 100% absorbent material was applied to the surfaces representing the free field. This procedure was satisfactory, in line with results obtained in similar investigations carried out in open and semi-open environments [
6,
7,
8,
9,
10,
46,
47].
In case of the Water Tribunal environment, it was convenient to perform the calibration with the energy parameters C80 and C50, given that the temporal parameters T30 and EDT present a greater variation depending on the location of the source and the receivers, in contrast with the usual results in rooms and closed rooms [
21]. The simulations carried out with both pieces of software adequately reproduce the behavior of the temporal parameters C80 and C50. On the other hand, it can be observed that the results of the T30 and EDT parameters better fit the measurement at medium and high frequencies, while at low frequencies there is a higher variation, which is in agreement with the results obtained by Paini et al. in his acoustic study undertaken in an open environment [
47].
The measurement of the bailiff source, together with its application to the acoustic environment of the Plaça de la Verge (Virgin Square) in Valencia, allowed us to obtain a dynamic auralization which was combined with the images of a pathway in the square, and the result was a video which was presented with the soundscape survey. The soundscape perception was evaluated through this survey containing the so-called Swedish protocol. With this survey, applied to 30 listeners, we found that the environment was appreciated just as a little chaotic and annoying, due to the reverberation, but quite pleasant as the main source is highly appreciated in the auralization.
In this research, the application of virtual acoustics in the study of an open environment of great heritage value was deepened. As a result, an analysis of the acoustic behavior of this unique environment was performed. Likewise, the acoustic and visual simulation of the surroundings of the Water Tribunal of the Plain of Valencia was obtained, disseminated on the official page of the Virtual Acoustics Research Group of Universitat Politècnica de València [
43], which allows anyone to enjoy the acoustics and architecture of this unique environment from anywhere.This is especially interesting in the current health emergency situation caused by COVID-19, offering the possibility of remote tourism. Likewise, if, in the future, the soundscape suffers alterations of any kind, a detailed compendium of visual and sound information on its current state would be available, which would guarantee its conservation and allow future generations to enjoy and study it.
As a future line of research, it is proposed to delve into the generation of interactive acoustic and visual models in open environments, in which the viewer can move freely, listening and observing the same as if they made a face-to-face visit. Currently, work is being carried out on the development of interactive acoustic and visual models using the Unity software.


 ,
, 


