Abstract
This study takes an approach to reliability-based topology optimization (RBTO) for 3D structures by applying an expansion of smoothing evolutionary structural optimization (SESO) and sequential element rejection and admission (SERA) for three-dimensional optimization. In the search for the stable optimal solution, and a more reliable structure, we present a performance index with the ability to monitor the evolutionary optimization procedure and adopt the filtering scheme usually applied in solid isotropic material with penalization (SIMP). The limit state functions are the maximum displacement constraints imposed in the topology optimization procedure and a structure’s performance control; a comparative analysis of the deterministic topology optimization (DTO) with the RBTO models is also explored. The obtained results suggest the importance of using the RBTO concept in 3D structures as part of the design analysis process.
1. Introduction
In the last decade, researchers related to topology optimization (TO) for 3D elastic analysis using Matlab code have addressed evolutionary optimization methods, such as solid isotropic microstructure with penalization (SIMP), including extensions for various load cases, continuation strategy, the synthesis of compatible mechanisms, and heat conduction problems considering a compliance minimization problem, as presented by Liu and Tovar [1], and bi-directional evolutionary structural optimization (BESO) by Xie [2]. In addition, the 3D methodologies proposed by Zegard and Paulino [3,4] for the soil structure and the TOPslicer tool, respectively, both developed in Matlab, generate suitable results for additive manufacturing. In their study, Gebremedhen and Woldemicahel [5] provided a mathematical model of stress-based topology optimization for three-dimensional optimization problems using SIMP. In the approach proposed in [6], the large-scale topology optimization for 3D elastic problem parallel computation is used in combination with domain decomposition. The equilibrium equations are solved by a preconditioned conjugate gradient algorithm, and the optimization is then performed using sequential convex programming. The TO procedure proposed in [7] presents 100-line Python code for general 3D topology optimization. It was developed for compliance minimization with a volume constraint using the bi-directional evolutionary structural optimization (BESO) method. The TO formulation presented in [8] includes simplified additive manufacturing (AM). The author demonstrated the procedure involving compliance minimization, self-frequency maximization, and flexible mechanism design.
In the search for achieving a structure’s best performance, parametric or topological optimization can be applied by using the deterministic or heuristic procedure. In the sense of the first case, several works have been proposed recently, such as Refs. [9,10,11,12] which proposed novel methodologies for parameter optimization of antennas. In the case of the heuristic sense, evolutionary structural optimization (ESO) is a well-known procedure that seeks, by removing or adding material in the structure domain, to satisfy the design constraints. Thus, the search for stable, lightweight structures with low production costs and high performance becomes an important task for the industry that seeks technological competitiveness with little environmental impact due to the scarcity of material resources. Therefore, structural designs present uncertain variables, such as Young’s modulus, yield stress, allowable stress, external loads, geometry, manufacturing error, etc. Deterministic topology optimization (DTO) cannot evaluate these uncertainties during the iterative procedure. To achieve these conditions, reliability-based topology optimization (RBTO) arises, which seeks the optimal topology under probabilistic constraints and has the ability to incorporate these variables during the optimization procedure to achieve a level of structural reliability. Researchers of Refs. [13,14,15,16,17,18,19,20,21,22,23] addressed RBTO using the first-order reliability method (FORM) with two more traditional approaches, the reliability index approach (RIA) and performance measure approach (PMA), over different methodologies, in general using a double-loop, single-loop or hybrid procedure. The work of [9] applied the reliability analysis for the optimization of antenna systems with the classical Monte Carlo procedure. Ref. [16] initiated the hybrid approach, and it consists of a sequence of reliability and deterministic optimization analyses. Initially, the chosen random variables are modified as deterministic quantities according to the most probable point (MPP) obtained from the reliability index and the sensitivity analysis for the objective function (OF) regarding the random variables, which are used in the deterministic optimization procedure to obtain the optimal topology.
The RBTO analysis for 3D structures proposed by [24] is performed using BESO and the stochastic response surface method (SRSM) to determine the limit state functions’ approximations. In their research, Ref. [25] focused on developing RBTO on a structure that is used to design joints and connections for building applications under uncertainty considerations. The procedure is performed by integrating the TO algorithm, reliability analysis, random vibration analysis, additive manufacturing, computer simulations, and parametric design. In addition, they proposed an investigation of the potential of topologically optimized 3D-printed hybrid materials. López et al. [26] proposed a decoupled reliability-based design optimization method that is implemented in an internal computational code combined with external optimization to assess the RBTO problem. The goal is to obtain a new structural scheme with at least the same stiffness as the optimal setting provided by the DTO approach. Both structures undergo the same reliability-based parametric optimization process, considering the target reliability index from the previous RBTO with the same probabilistic information.
In more recent applications, several works can be cited on structural analysis, using the RBTO method, such as in [27,28,29] wherein plane stress analysis is performed by different approaches. Even construction process [30], dynamic or seismic aspects and effects with structural analysis on wind farm, brick and reinforced concrete structures are evaluated in the works [31,32,33,34] by optimization methods.
In the present study, we applied the RBTO analysis using evolutionary methods, such as ESO, SESO, SERA and SIMP, using the approach of [16], where the design variables are the structure’s geometry, load, elasticity module and the volume, since the latter is an explicit function of geometry. The limit state functions are the structure’s performance index, maximum displacement and maximum compliance. The displacement is obtained using the Kolmogorov–Smirnov test, and it is imposed as a constraint in the optimization procedure. In addition, we used the Jacobi preconditioned conjugate gradient (PCG) method to solve the linear system generated in the equilibrium equation at each iteration. As the mechanical behavior, the stress constraints, or better, the tractions, are assumed on the part of the boundary, and they are called Neumann-type constraints (free or prescribed tractions). In the RBTO formulation, the sensibility analysis is evaluated by the performance index (PI), for which it is taken into account the minimization, the compliance or the strains, so stress constraints are not prescribed in this sense.
As known, evolutionary optimization methods present mathematical deficiencies in guaranteeing the global optimum, but the designs achieved by the present applied methods are viable for manufacturing, as already proved by several works. In addition, these intrinsic deficiencies are potentialized when integrated with reliability procedures. However, the insertion of the PI as a limit state function aims to monitor the stable mechanical behavior of the structure, represents a sufficient criterion for the RBTO analysis, and, associated with displacement and volume constraints, provides good configurations that are more reliable than deterministic topologies for the same weight. The most important novelties of this article are the expansion of the SERA and SESO methods for the RBTO analysis of 3D elastic structures considering the PI as the limit state function. Furthermore, an expansion of the algorithm proposed by [16] for 3D analysis with the inclusion of seven random variables is evaluated.
The remaining of the article is organized as follows: Section 2 presents the proposed evolutionary methods and their formulation for the compliance minimization problem, the hexahedral finite element filtering scheme, the sensitivity calculation, and the convergence criterion. Section 3 presents the RBTO analysis, its general formulation for the proposed methods, the failure probability, and the performance index. Section 4, Section 5 and Section 6 present, respectively, numerical examples, discussion and the conclusion.
2. Evolutionary Methods
The ESO method, proposed by [35] and reviewed by [36], and the SESO proposed by [37], are based on evolutionary procedures and have been used for structural optimization. The concept behind these methods is the removal of inefficient material from a structure during the iterative procedure. The SESO procedure is bidirectional because it allows the removal and addition of elements from the structure. The elements that meet the rejection criterion are removed from the domain of the structure, organized in growing order and grouped. The p% of the groups with lower compliance is removed and (1−p%) returned to the structure, smoothing the ESO procedure; its removal heuristic is unidirectional, that is, it removes all elements that meet the removal criteria. Another evolutionary method that this study presents is the SERA proposed by [38,39], which also has a bidirectional nature. However, the SERA method has two separate criteria for removing and adding domain elements, allowing to change the status from “virtual” to “real” and vice versa. In this way, the final topology is built with all the real material present in the structure. The optimization process of these methods involves several selections, such as the choice of the rejection rate (RR) and the evolution rate (ER). On the other hand, in a finite element analysis (FEA), the designer must decide on the mesh size and the type of element used. The result of the three-dimensional elastic analysis of the DTO is the used evolutionary methods proposed in this study for a comparative analysis with the RBTO models. The difference between the optimal topologies suggests that the RBTO model for 3D structures be run as part of the design analysis process.
2.1. Topology Optimization Formulation
A TO problem can be defined as a binary problem in which the objective is the best material distribution in the solution domain, achieving the given criteria, previously established, maximizing/minimizing a predefined OF. ESO, SERA and SESO are TO methods that seek the optimal topology, maximizing the stiffness of the structure, simultaneously removing and/or adding elements on each iteration. Thus, TO problem to maximize the stiffness of a structure, i.e., minimize compliance—which minimizes the work performed by external forces—can be written as
where is the OF; is the vector of binary design variables as in a common discrete problem; is the i-th design variable whose values are 1 and 0, respectively, for the solid element and void element; N is the total number of finite elements; and are the global force and generalized displacement vectors, respectively; is the global stiffness matrix; is the total volume of the structure with being the volume of the structure in iteration; and is the imposed value of the volume constraint. The volume constraint and the constraint that ensures the equilibrium of the structure are defined in Equation (1). For a complete understanding of the aforementioned methods, see [40].
2.2. Filter Scheme
The presented article by [41] studies the effect of key formulations of the TO problem on the design performance, focusing on sensitivity analysis using the implementation of mathematical programming techniques in MATLAB software. Basically, the mesh independence filter works to avoid numerical instabilities, such as checkerboard, mesh dependence and local minima [42]. To solve these problems, researchers, such as those of [43], have proposed regularization techniques. Therefore, in mathematical terms, spatial filters are additional constraints on the formulation of an optimization problem. With an increase in the radius value, the gradients are restricted to smaller values, where the transition between solid (material) and void (no material) becomes smoother, generating more elements with intermediate compliance. The procedure’s sensitivity to the radius choice is strongly perceived when it assumes a very large value, because the design variables’ gradients would be limited to such small variance rates that the optimization problem would not have a solution for the proposed initial condition. One of the most common approaches is the use of density filters proposed by [44], whose function can be written as
where N is the number of elements neighboring the element with volume , and is the weighted average of the neighboring elements to with as its weighting factor defined as
With the sphere’s radius R, see Figure 1, it has as its center element , and is the distance between the elements ( and centers), and it is given by
where and are, respectively, the elements and centers’ coordinates.
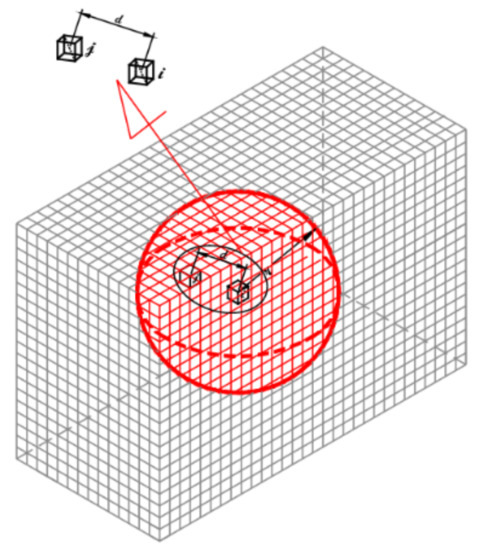
Figure 1.
Spatial filter.
2.3. Sensibility Number
In general, when an element is removed, it naturally reduces the stiffness of a structure and, correspondingly, it increases the strain energy. To achieve this goal by removing the element, it is obviously more effective to withdraw the element that has the lowest sensitivity value so that the increase in compliance is minimal. Thus, a sensitivity analysis is performed as part of the optimization process to provide information on the OF’s sensitivity to small changes in the design variables. Therefore, the filtered element is incorporated into the optimization procedure, and the modified SIMP method’s elasticity modulus, Equation (5), and that of the ESO, SERA, and SESO methods, Equation (6), are given:
Thus, it is possible to determine the sensitivity of the (filtered) element in the SESO, SERA, and ESO methods, which is given by the expression
where is the nodal displacement vector and is the initial stiffness matrix, both for the i-th element. For the SIMP method,
2.4. Convergence Criterion
The optimization process is convergent, and the stopping criterion can be activated as the variation of the OF the last iterations according to Equation (9), by [2].
where is the current iteration number, and is the structural compliance in the k-th iteration. The integer number , implying that the change in the mean compliance over the last 10 iterations is acceptably small. This criterion was introduced in the code, indicated by [2], with or smaller.
3. Reliability-Based Topology Optimization
In the service life of the engineering design, variations may inevitably exist in material properties and geometry, as well as external loads, due to the inherent uncertainty of nature. Therefore, the DTO, without considering these input uncertainties, may not reasonably represent the level of structural reliability. Thus, RBTO analysis can achieve the optimal topologies with the effects of uncertain variables explicitly considered through the reliability.
3.1. Failure Probability
The concept of structural safety is linked to the capacity of a given structure to withstand the various actions imposed on it during its service life, while also satisfying the functional conditions for its construction. Thus, the safety of a structure can be defined based on the probability that one of the failure states will occur during its service life. For a given design rule, the basic random variables are defined by their joint probability distribution associated with some expected parameters. The vector of random variables is here denoted by Y. Thus, the probability of a structure failure can be written as
where is the joint probability density function (PDF) of the random variables, is the failure probability, calculated by the probability density function’s integral according to Equation (10), and represents the constraints imposed on the probability. If , this indicates the failure region, and indicates the failure surface as a limit state function. Figure 2 displays the probability integrations in Equation (10) for the joint PDF for random variables which is the two-dimensional case. The contours are projections of the surface of on the y1–y2 plane.
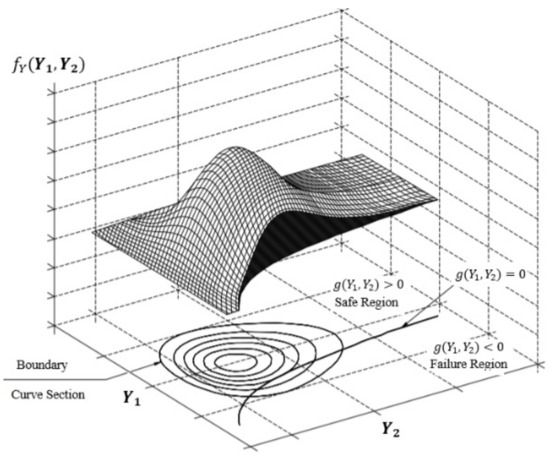
Figure 2.
Probability Integration, adapted from [45].
Ref. [46] defines the reliability index, β, as the minimum distance from the source surface to the failure in the space of the standard normalized distribution, and the MPP as a point corresponding to the minimum distance. FORM is used to estimate the failure probability by approximating the limit state function. FORM involves the process of obtaining the MPP on the failure surface and the concept of linearizing the limit state function. If the curvature of the failure surface at MPP is not large, FORM can provide an accurate reliability index. Therefore, the failure probability can be expressed as
where is the standard normal distribution. The reliability index can be determined by finding the minimum distance to the failure surface in the space of the standard normal distribution [47]. A transformation is introduced to map the original random vector X to a standard, uncorrelated normal vector, Figure 3.
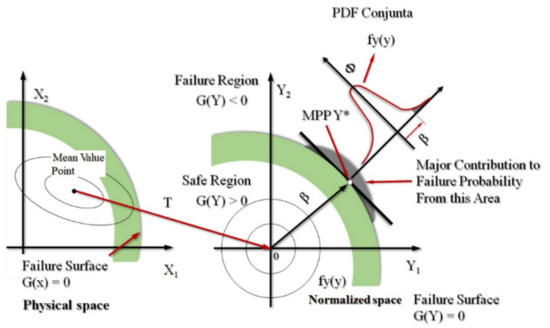
Figure 3.
Transformation T and FORM, adapted from [48].
3.2. General Formulation
RBTO analysis can be interpreted as a problem that finds an optimal topology under probabilistic constraints so that it becomes reliable for these uncertainties. The general form of an RBTO problem is described as follows:
where is the j-th uncertain variable, is the system’s probability of success, is the target probability of success, and is the limit state function (performance function). Design variables and M are the numbers of random variables. Applying the performance measure approach (PMA) to Equation (12) for the general case leads to
where is the target reliability index for success.
3.3. Performance Index and RBTO Formulation for Evolutionary Methods
The defined performance function is the structure performance index (PI) proposed by [49], which has the ability to monitor the optimization process and is given by
where is the initial compliance, is the structure’s initial volume, and and are, respectively, the compliance and the volume at the k-th iteration. Function can be written as
The design variables are the finite element dimensions of the discretization of the structure’s domain, but the random variables are the external loads and the geometric dimensions of that structure. To control the topologies obtained by the RBTO model, the reliability index is introduced, see [46], with a normalized vector u, which, in the case of a normal distribution, is calculated as follows:
In general, considering the normal distribution law, the standard deviation can be related to the mean using , where is a given coefficient. Furthermore, let us define the deterministic design variables as the mean value of the random variables . The minimization of the reliability problem can be expressed by
Equation (17) applied to the proposed RBTO model for ESO and SESO can be expressed as
The volume is consider a random variable because it depends directly on the structure’s geometric dimensions. is the prescribed volume. The RBTO model used for SIMP is the same as the one presented by [16]. We highlight only that the design variables in this case are the finite element densities of the domain, and the procedure is not discrete as in the other models presented in this study. The RBTO for the SERA that also has the element density as design variables can be expressed by
where represents the density of each finite element.
4. Numerical Examples
4.1. Example 1—Cantilever Beam
The ESO, SERA, SESO and SIMP methods are used to perform a RBTO analysis in a 3D cantilever beam. This structure’s dimensions, Figure 4, are length , height and thickness . The material properties are Young’s modulus , and Poisson’s ratio of . The load of is applied to the center of the free end. The domain is discretized with 200,000 eight-node hexahedral finite elements.
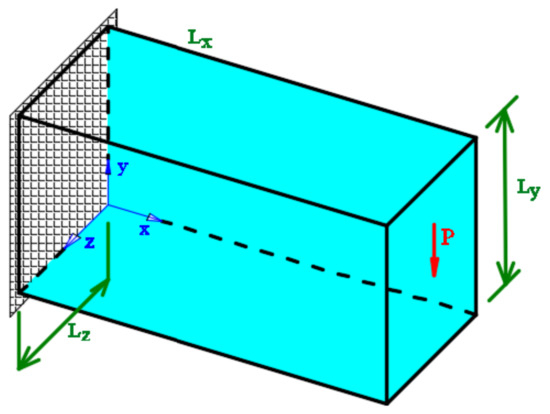
Figure 4.
Design domain.
All random variables are considered with normal distribution and standard deviation of 10% of the average value. The limit state functions are defined as the PI for the structure and the difference between the allowable displacements and the prescribed displacement, imposed as constraints in the topological analysis. The prescribed displacement is obtained from the DTO analysis by calculating the average displacement ( and standard deviation of the maximum allowed displacements using the Kolmogorov–Smirnov test. This test’s statistics quantifies a distance between the empirical distribution function of the sample (allowed displacements) and the cumulative distribution function of the reference distribution. In this article, the cumulative standard normal distribution function is used. Thus, an empirical sample is used,, of the maximum displacements from the DTO analysis to define the displacements’ limit values. Thus, in the RBTO analysis, the prescribed values for the average displacement as the maximum allowable displacement in the TO procedure is used. It is noteworthy that a stopping criterion is used that compares the difference between the allowed and prescribed displacements with the standard deviation obtained from the Kolmogorov–Smirnov test in the RBTO procedure.
Figure 5 shows the contour graphics for a plane section, the optimal topology for the DTO, and the surface graphics to illustrate the main differences between the presented models. The average displacement is considered in this case. Additionally, Figure 5 shows the contour graphics, optimal topologies, and surface graphics for the 3D cantilever beam, using a target reliability index, , which corresponds to a failure probability of 0.135% for the RBTO analysis of the presented evolutionary procedures. Figure 6a–c shows the optimal topologies presented, respectively, by ESO, SERA and SESO. These configurations are similar, although the design variable in SERA is the element density, while, in ESO and SESO, the variables are the extended fixed domain finite elements. These results can be compared with those presented by [24], using the standard response surface method (SRSM). The optimal topology achieved by SIMP, Figure 6d, is different from the other formulations because convergence occurs at intermediate densities in a continuous optimization process unlike the other formulations that have a discrete procedure.
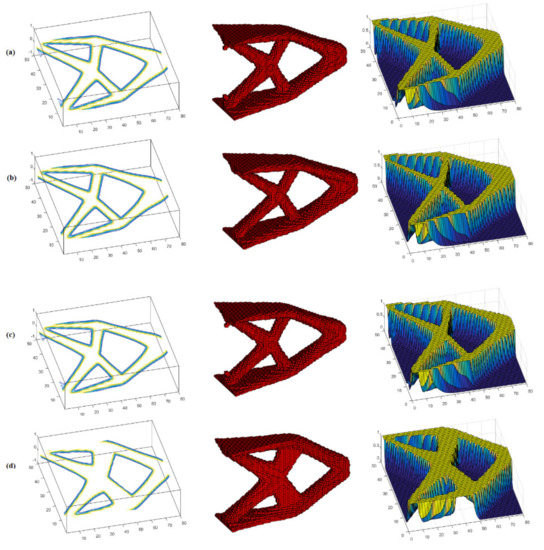
Figure 5.
DTO: contour, topology and surface: (a) ESO, (b) SERA, (c) SESO and (d) SIMP.
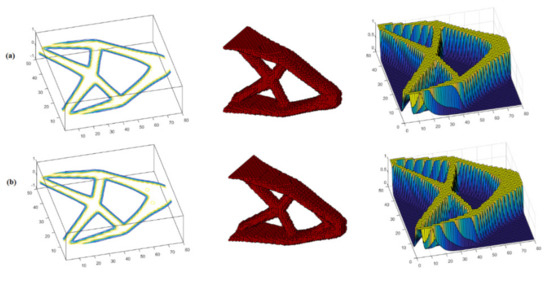
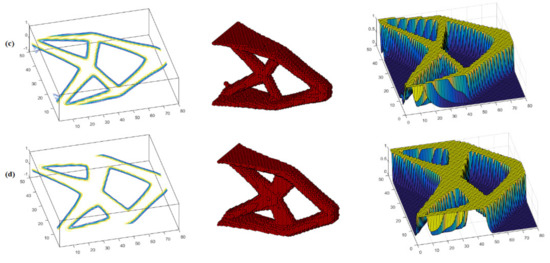
Figure 6.
RBTO: contour, topology and surface: (a) ESO, (b) SERA, (c) SESO and (d) SIMP.
For the 3D results’ comparison, the volumes, displacements, OF, and computation time due to each method, for the cantilever, are listed in Table 1. From the comparison of the RBTO with the DTO of the 3D cantilever beam, note that the optimal RBTO volume is about 15.38% smaller than the SRSM method proposed by [24].

Table 1.
Reliability-based topology optimization using evolutionary methods.
It is worth highlighting that ESO, SERA and SESO converge to the same value of the OF in the DTO and RBTO analyses and are computationally more efficient than SIMP, respectively, 16.3% and 11.4% on average. In the RBTO analysis, the PMA converges with 9 iterations in all cases, while the optimal topology is reached at iteration 41. In the classical RBTO methodology, there is a total of 369 iterations until convergence.
Figure 7 shows the graphics of the structure’s performance during the optimization procedure in each case studied. It is verified that the PI has the ability to monitor the iterative process because a peak in the OF, probably due to the breakage of a bar in the structure and/or the removal of many elements at once, causes a sharp drop in this structure’s performance. Therefore, at this point, it is necessary that the designer has a critical eye with the ability to assess whether the structure is collapsing or not. In the example analyzed, there is a peak in the OF, but the structural performance is not compromised because the PI value is not less than 1. It is also observed that for the peak in the SERA, the OF is smoother than in ESO and SESO. This can be explained by observing the material removal and addition heuristics used by SERA, that is, in the region where the compliance is high, there is the addition of “virtual” elements, softening the OF’s behavior, and consequently, the structure’s performance.
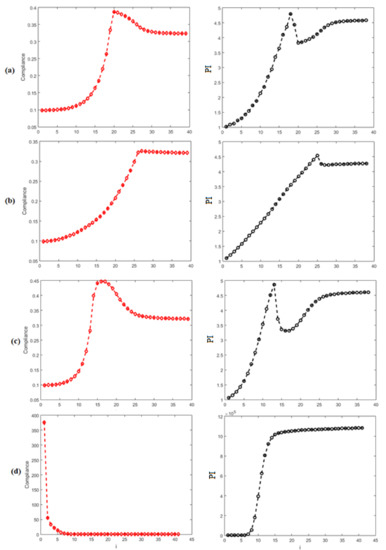
Figure 7.
Objective function and performance index (PI): (a) ESO, (b) SERA, (c) SESO and (d) SIMP.
4.2. Example 2—MBB Beam
We performed the RBTO analysis using ESO, SESO, SERA and SIMP evolutionary methods for a MBB-3D beam with a minimum radius of 1.5. The dimensions shown in Figure 8 are length , height and thickness . The design domain is discretized with 48,000 8-node hexahedral finite elements. Material properties are a Young’s modulus of 100 E3, and a Poisson’s ratio of 0.3. The load applied at the center of the top face is 100 N. It is worth highlighting that symmetry is not used for this problem.
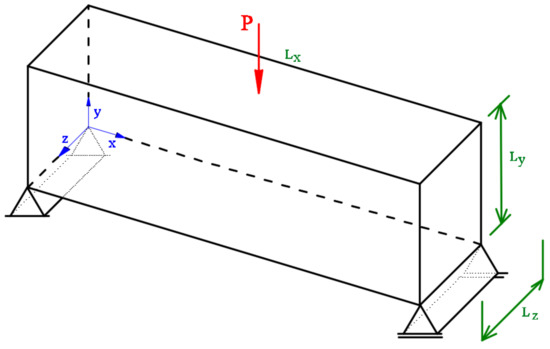
Figure 8.
Design domain.
The Figure 9 shows the optimal topology obtained using the DTO based on the evolutionary methods, presenting a side and a front view. The displacements of this analysis are used to calculate the prescribed average displacement applied in the RBTO. The ESO, SERA, and SESO methods have similar optimal configurations, with small differences in their optimal topology, as can be seen in the front view in Figure 9. SIMP proposes a different and more complex topology for manufacturing than other methods. Furthermore, in all case studies, the SIMP model has the highest value for the OF. However, it is worth noting that the SIMP model presents greater stability during the iterative process. During the optimization procedure, it starts from high compliance, and the function is always decreasing without jumps, while in the other methods, compliance presents at least one peak during the optimization process. The answer may lie in the removal heuristics of each method or in the fact that ESO, SERA, and SESO methods are discretized.
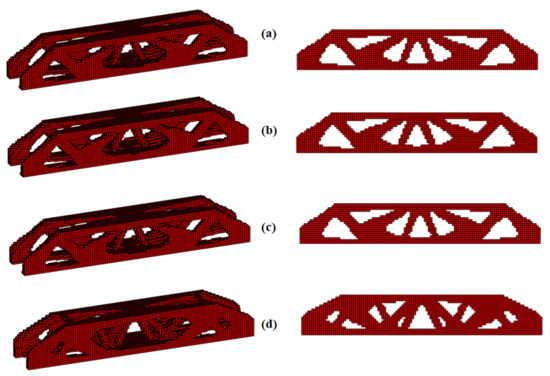
Figure 9.
Optimal topology (DTO)—side view and front view: (a) ESO, (b) SERA, (c) SESO and (d) SIMP.
For the RBTO model, parameters relating to geometry, load, and volume are assembled into the averages vector given by . Given that the standard deviations’ values are , the random vector Y is normally distributed and given by (). Thus, when the reliability analysis is completed, satisfying the constraints, the optimal values of the normalized vector are obtained, which lead to the input random vector . The limit state functions are the same as defined in Equation (20), with displacement equal to . Figure 10 illustrates the optimal topologies for the MBB-3D beam, using the proposed RBTO analysis with , which corresponds to a failure probability of . In addition, it presents surface graphics that provide greater clarity for identifying small topological differences.
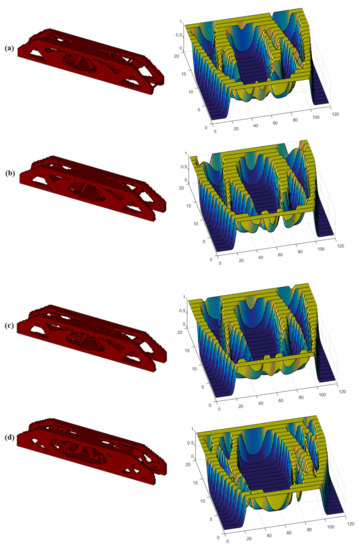
Figure 10.
Optimal topology (RBTO), side view and surface: (a) ESO, (b) SERA, (c) SESO and (d) SIMP.
The ESO, SERA and SESO methods allow the removal of elements with low compliance to improve the structure’s performance. Thus, a characteristic performance curve for this continuum structure is shown in Figure 11. The weight of a structure is gradually reduced during the optimization process as the compliance increases. In this way, the characteristic curve of a structure’s performance during the optimization process can be expressed by the structure’s weight and its strain energy [50]. Therefore, in the RBTO analysis, the optimized structure’s performance provides a designer with valuable information on the structural design. It not only indicates whether the optimized design is feasible, but the optimized design’s success for stiffness.
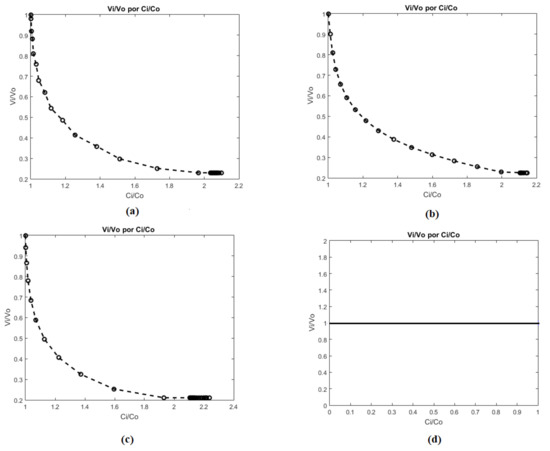
Figure 11.
Performance characteristic curve for structures with compliance constraints: (a) ESO, (b) SERA, (c) SESO and (d) SIMP.
When analyzing the above curves, Figure 11b, the designer should note that the optimal structure achieved with a compliance 20% higher than the initial compliance, in the graphic , is obtained with an approximate volume . Therefore, a volume of less than 48%, for example, , is below the curve and therefore violates the compliance constraint, , because it requires compliance 45% higher than the initial one. So, this structural design is not feasible because there is a lack of material to complete it. On the other hand, projecting the compliance ratio, , to a point above the curve, , verified that the amount of volume is more than sufficient for the design’s execution, that is, the design is viable but it is oversized.
Therefore, the ESO, SERA and SESO structural optimization methods can be used as a tool to improve the performance of structures that are oversized while saving material. In Figure 10, such structures satisfy the design conditions, which are not oversized, and have provided a considerable material saving.
In SIMP, this process is continuous. The topology evolves by continuously changing the elasticity modulus. Since the prescribed volume remains constant during the iterative process, the performance’s characteristic curve is a straight line (Figure 11d). Therefore, the design is feasible above the curve, but it is oversized because the volume used is larger than necessary to carry out the design (Figure 9d). On the other hand, below the curve, the design is not feasible, and it is underestimated because there is not enough material to carry it out. This is a SIMP advantage since its convergence meets the Karush–Kuhn–Tucker optimality conditions during the entire iterative process.
For the RBTO-3D analysis results’ comparison, the volumes, displacements, objective function, and computation time due to each method, for the MBB beam, are listed in Table 2.
Table 2.
Reliability-based topology optimization using evolutionary methods.
4.3. Example 3—MBB beam
Consider the MBB beam problem (Figure 8); the maximum deflection is given by
where E is the material’s elasticity modulus, I is the inertia moment, P is the applied load, and L is the span length. The average values and standard deviations of the random variables are given in Table 2. Thus, the failure criterion can be assumed as
The limit state in the function of L can be obtained with a substitution of Equations (21) into (22), resulting in
Table 3 shows the mean and standard deviation values of the normally distributed random variables used in the RBTO analysis.
Table 3.
Random variables for the MBB beam.
The SESO method is used to perform the MBB beam’s reliability analysis and to assess the influence of the target reliability index and the new uncertain variables on the optimal configuration. In particular, the DTO SESO’s optimal configuration is compared with RBTO SESO, and the compliance and displacement values, and , respectively, resulting from this analysis, are defined as boundary constraints in the RBTO analysis. Thus, the problem can be defined as
Figure 12 displays the optimal RBTO SESO settings. It is possible to see clearly that the optimal settings are different when compared to the DTO, see Figure 9, as they present fewer bars. This shows that the proposed approach can produce a more reliable structure compared to DTO when uncertainties are considered. Note also that in the MBB beam’s design, when the , that is, a failure probability it takes only seven iterations to reach convergence in the reliability calculation. Thus, the proposed approach only needs to evaluate the finite element analysis (FEA) 68 times, while the traditional RBTO method needs to process FEA 476 times. Therefore, the proposed approach is shown to have high efficiency.
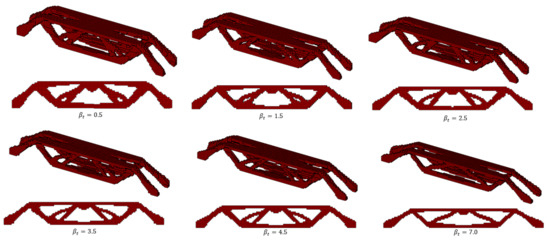
Figure 12.
Optimal topologies for different reliability indexes.
Figure 13 shows the graphic of the and compliance RBTO variation as a function of the target reliability index. Based on the graphic, it can state that the design produced by the RBTO analysis is more rigid than that of the DTO, that is, as the reliability index increases, . Therefore, the lower the compliance, the higher the stiffness. In deterministic structural optimization, the designer aims to reduce the construction cost without worrying about the effects of uncertainties in materials, geometry, and loading. Thus, it is important for designers to consider uncertainties in the design realization to balance minimizing costs and maximizing reliability.
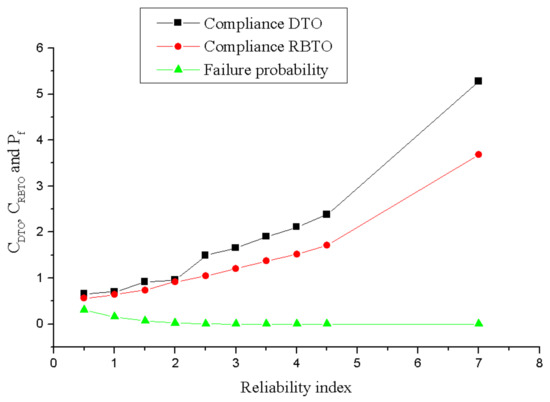
Figure 13.
Variation of DTO and RBTO compliance as a reliability index function.
4.4. Example 4—An Optimal Bridge
The optimization of a bridge-type structure with the deck at the top was studied by [51]. The dimensions of the design domain, the loading conditions, and the boundary conditions are given in Figure 14. The material properties are considered to be . To ensure that pressure is applied over the entire top surface, a solid section of 1.5 m thick is defined as a non-projectable layer. The design aims to maximize the stiffness subject to a prescribed volume of .
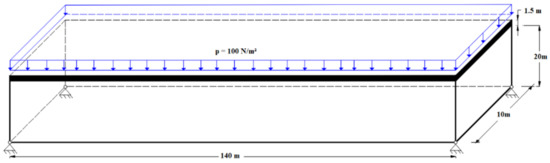
Figure 14.
Design domain, loading and boundary conditions for a bridge, where the solid section denotes the non-designable material.
From the DTO results, for each method proposed in this study, the OF’s maximum value is obtained, which is a reciprocal measure of the stiffness and quantifies the structure’s energy. The next step is to include the uncertainties in the geometry, loading, and volume (structure dimensions’ function) and define the RBTO problem, whose target is to obtain a minimum volume design as rigid as the DTO design when the uncertainties are considered. This problem requires the assessment of probabilistic constraints, which are expressed in terms of the boundary state function G, defined as
where is the DTO’s compliance in the optimal setting, and is the volume fraction. Generally, denotes a safe region where corresponds to a failure region. The probabilistic constraints induce the RBTO to obtain a structural framework at least as rigid as the one provided by the DTO, assuming a target . Consequently, the RBTO problem is formulated as indicated by Equation (26):
where P [·] is the probability operator.
The initial design parameters are given in Table 4, where nelx (length), nely (height), and nelz (width) represent the structure’s geometry, P, which represents the external load distributed on the bridge deck, and they are considered random variables with normal distribution, while the material properties have constant distribution.
Table 4.
Parameters related to the design domain.
Table 5 shows the proposed approach’s efficiency by comparing the variation in the number of iterations to achieve convergence in the reliability calculation procedure and the number of iterations involved in the TO procedure. In addition, it shows that finite element analysis (FEA), with this formulation, has a lower computational cost than that used in traditional RBTO.
Table 5.
Efficiency of the proposed approach for different reliability indices.
Figure 15 displays the optimal topologies achieved by the proposed algorithms using . Note that the volume found in the RBTO analysis is , which means a 9% reduction compared to the DTO analysis. However, the optimal topologies found by ESO, SESO and SERA are similar but different when compared to the optimal topology presented by the SIMP technique.
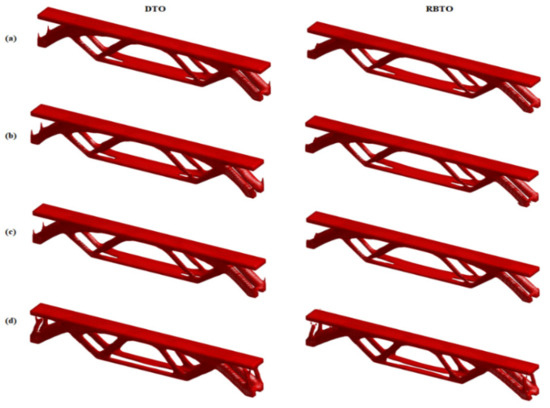
Figure 15.
Optimal topologies for DTO and RBTO: (a) ESO, (b) SERA, (c) SESO and (d) SIMP.
For the 3D results’ comparison, the volumes, displacements, OF and computation time due to each method, for the bridge, are listed in Table 6.
Table 6.
Reliability-based topology optimization using evolutionary methods.
The RBTO formulation of [16] is adapted to the three-dimensional RBTO analysis. In this example, two studies are performed: (1) random variables—geometry, volume and applied force (the same as considered by the authors); and (2) random variables—geometry, volume, force, with the inclusion of the elasticity modulus, and compliance. The first analysis compared to the DTO design shows a decrease in structural mass. However, it can notice an increase in the structure’s compliance. In this sense, the design obtained by DTO is more rigid than the one proposed by RBTO analysis. Figure 16a shows the graphic of force by the structure’s failure probability and Figure 16b illustrates the volume and force random variables by reliability index . It is important to point out that produces geometry effects on the structure because dimensions and volume are random variables with normal distribution. Therefore, increasing this index causes a reduction in volume, an increase in strength (absolute value), and a lower failure probability.
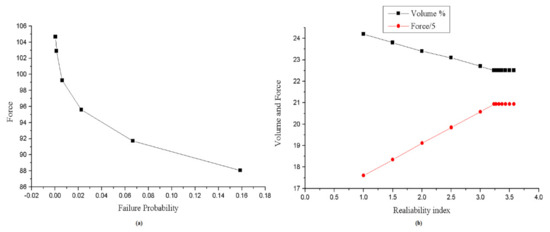
Figure 16.
Graphics: (a) force by failure probability and (b) volume and force by reliability index.
It is possible to affirm that the limit state function used by [16] was not based on real failure criteria for the structure because only geometric dimensions and applied loads are considered as uncertainties [52]. The second analysis proposes to incorporate the uncertainties regarding material property and structure compliance to make the analysis more realistic. In this analysis, compared to the DTO design, a decrease in the structural mass, volume, strength and compliance is noted (Figure 17). In this sense, the proposed RBTO algorithm defines a more rigid design than that proposed by the DTO analysis.
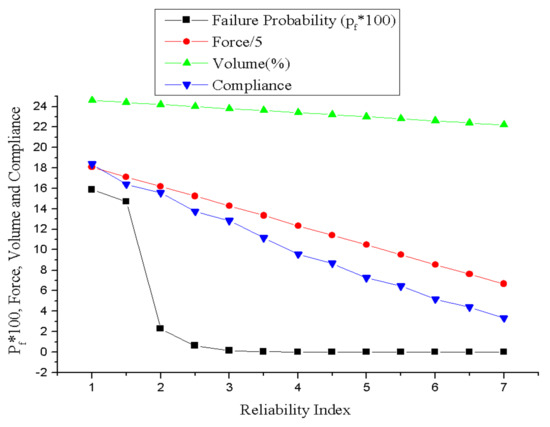
Figure 17.
Failure probability and random variables by reliability index.
5. Discussion
This study shows the RBTO analysis for different evolutionary optimization methods, in particular, the implementation of SESO and SERA for this type of analysis. The numerical examples show that the procedure has several advantages:
- (1)
- Insertion of the preconditioner for solving the linear system provided efficiency in computational memory, allowing large-scale problems to be solved.
- (2)
- The probabilistic analysis loop is fully decoupled from the optimization loop for easy code implementation, making the computational cost much lower than DTO analysis.
- (3)
- The compliance constraints, displacement, performance index, and limit state functions, when used, are inserted into the OT loop in a simple way.
To highlight the importance of the reliability analysis, that is, the insertion of uncertainties into the TO procedure, the elasticity modulus and the inertia moment were inserted into the algorithm as uncertain variables, considering them normal distributions with standard deviation equal to 10% of the average value, taking the reliability analysis more realistically, for which it is possible to highlight the following:
- (1)
- The MBB beam’s DTO analysis has a reliability index, , which means that the optimal structure has a failure probability equal to , achieved when the displacement constraint is violated.
- (2)
- The RBTO analysis produces optimal topologies with lower volume and more rigidity than those proposed by DTO, as already described in this study.
- (3)
- The results showed that a change in the target reliability index changes the optimized topology in two ways: the division of the members and the members’ spacing in the structure. These trends are observed when the reliability index .
6. Conclusions
The proposed RBTO structure provides an efficient way for the designer to obtain optimal design solutions that satisfy probabilistic constraints. This analysis considers a characteristic performance curve in which the designer has the opportunity to make a reliable and more economical structural design. The evolutionary methods ESO, SESO and SERA proved to be efficient in the RBTO analysis, presenting robust and feasible structures for projects. The optimal topologies presented by SIMP are quite different from those presented by ESO, SESO and SERA, which are similar to each other. The final volume obtained, by using the RBTO procedure, are smaller than the final ones in the DTO procedure. In addition, the presented performance index is able to monitor the optimization procedure in the RBTO analysis. It is worth noting the use of a stopping criterion that compares the difference between the allowed and prescribed displacements with the standard deviation obtained from the Kolmogorov–Smirnov test in the RBTO procedure.
Author Contributions
The authors have been working together for over 9 years, and the tasks in this article were developed as follows: (1) H.L.S.—Implemented SERA-3D and SESO-3D programs in Matlab code. Responsible for writing and structuring the article. (2) V.S.A.—Implemented the coupling of the SERA and SESO codes with the reliability analysis. Responsible for reviewing the article. Participated in the data analysis of the numerical examples in the article. (3) F.d.A.d.N.—Contributions to the preparation of the article: reading, review and suggestions for examples. (4) V.D.D.A.—Implemented ESO-3D and participated in the data analysis of the numerical examples in the article. (5) L.d.O.N.—Suggested and wrote the discussion section and participated in the review of the article. All authors have read and agreed to the published version of the manuscript.
Funding
CNPq (National Council of Scientific and Technological Development)-405993/2018-8, 315632/2020-8, FAPESP (Sao Paulo State Research Foundation)—2016/02327-5, Federal University of Ouro Preto (UFOP)—23109.004080/2019-88. Instituto Federal de Educação, Ciência e Tecnologia de Minas Gerais (IFMG).
Institutional Review Board Statement
Not applicable.
Data Availability Statement
Not applicable.
Acknowledgments
The authors are grateful to the Federal Institute of Science and Technology of Minas Gerais, the Federal University of Ouro Preto (UFOP), Fapemig, CNPq (National Council of Scientific and Technological Development) and Sao Paulo State Research Foundation (FAPESP) under Grant Numbers 23109.004080/2019-88, 405993/2018-8 and 2016/02327-5 for their financial support to this research.
Conflicts of Interest
The authors declare no conflict of interest.
References
- Liu, K.; Tovar, A. An efficient 3D topology optimization code written in Matlab. Struct. Multidiscip. Optim. 2014, 50, 1175–1196. [Google Scholar] [CrossRef] [Green Version]
- Huang, X.; Xie, Y.M. Bi-directional evolutionary topology optimization of continuum structures with one or multiple materials. Comput. Mech. 2009, 43, 393–401. [Google Scholar] [CrossRef]
- Zegard, T.; Paulino, G.H. GRAND3—ground structure based topology optimization for arbitrary 3D domains using MATLAB. Struct. Multidiscip. Optim. 2015, 52, 1161–1184. [Google Scholar] [CrossRef]
- Zegard, T.; Paulino, G.H. Bridging topology optimization and additive manufacturing. Struct. Multidiscip. Optim. 2016, 53, 175–192. [Google Scholar] [CrossRef]
- Gebremedhen, H.S.; Woldemicahel, D.E.; Hashim, F.M. Three-dimensional stress-based topology optimization using SIMP method. Int. J. Simul. Multidiscip. Des. Optim. 2019, 10, A1. [Google Scholar] [CrossRef]
- Borrvall, T.; Petersson, J. Large-scale topology optimization in 3D using parallel computing. Comput. Methods Appl. Mech. Eng. 2001, 190, 6201–6229. [Google Scholar] [CrossRef]
- Zuo, Z.H.; Xie, Y.M. A simple and compact Python code for complex 3D topology optimization. Adv. Eng. Softw. 2015, 85, 1–11. [Google Scholar] [CrossRef]
- Langelaar, M. Topology optimization of 3D self-supporting structures for additive. Addit. Manuf. 2016, 12, 60–70. [Google Scholar] [CrossRef] [Green Version]
- Pietrenko-Dabrowska, A.; Koziel, K.; Al-Hasan, M. Expedited Yield Optimization of Narrow- and Multi-Band Antennas Using Performance-Driven Surrogates. IEEE Access 2020, 8, 2169–3536. [Google Scholar] [CrossRef]
- Pietrenko-Dabrowska1, A.; Koziel, S. Globalized parametric optimization of microwave components by means of response features and inverse metamodels. Sci. Rep. 2021, 11, 1–18. [Google Scholar]
- Koziel, S.; Pietrenko-Dabrowska, A. Expedited feature-based quasi-global optimization of multi-band antenna input characteristics with Jacobean variability tracking. IEEE Access 2020, 8, 83907–83915. [Google Scholar] [CrossRef]
- Tomasson, J.A.; Pietrenko-Dabrowska, A.; Koziel, S. Expedited Globalized Antenna Optimization by Principal Components and Variable-Fidelity EM Simulations: Application to Microstrip Antenna Design. Electronics 2020, 9, 673. [Google Scholar] [CrossRef] [Green Version]
- Maute, K.; Frangopol, D.M. Reliability-based design of MEMS mechanisms by topology optimization. Comp. Struct. 2003, 81, 813–824. [Google Scholar] [CrossRef]
- Allen, M.; Raulli, M.; Maute, K.; Frangopol, D.M. Reliability-based analysis and design optimization of electrostatically actuated MEMS. Comp. Struct. 2004, 82, 1007–1020. [Google Scholar] [CrossRef]
- Kang, J.; Kim, C.; Wang, S. Reliability-based topology optimization for electromagnetic systems. COMPEL: Int. J. Comput. Math. Elec. Electron. Eng. 2004, 23, 715–723. [Google Scholar] [CrossRef]
- Kharmanda, G.; Olhoff, N.; Mohamed, A.; Lemaire, M. Reliability based topology optimization. Struct. Multidiscip. Optim. 2004, 26, 295–307. [Google Scholar] [CrossRef]
- Kim, C.; Wang, S.; Rae, K.; Moon, H.; Choi, K.K. Reliability-based topology optimization with uncertainties. J. Mech. Sci. Technol. 2006, 20, 494–504. [Google Scholar] [CrossRef]
- Guest, J.K.; Igusa, T. Structural optimization under uncertain loads and nodal locations. Comput. Methods Appl. Mech. Eng. 2008, 198, 116–124. [Google Scholar] [CrossRef]
- Rozvany, G.I.N. Exact analytical solutions for benchmark problems in probabilistic topology optimization. In Proceedings of the EngOpt 2008—International Conference on Engineering Optimization, Rio de Janeiro, Brazil, 1–5 June 2008. [Google Scholar]
- Lógó, J.; Ghaemi, M.; Rad, M.M. Optimal topologies in case of probabilistic loading: The influence of load correlation. Mech. Based Des. Struct. Mach. 2009, 37, 327–348. [Google Scholar] [CrossRef]
- Luo, Y.; Kang, Z.; Luo, Z.; Li, A. Continuum topology optimization with non-probabilistic reliability constraints based on multi-ellipsoid convex model. Struct. Multidiscip. Optim. 2009, 39, 297–310. [Google Scholar] [CrossRef]
- Chen, S.; Chen, W.; Lee, S. Level set based robust shape and topology optimization under random field uncertainties. Struct. Multidiscip. Optim. 2010, 41, 507–524. [Google Scholar] [CrossRef]
- Jalalpour, M.; Guest, J.K.; Igusa, T. Reliability-based topology optimization of trusses with stochastic stiffness. Struct. Saf. 2013, 43, 41–49. [Google Scholar] [CrossRef] [Green Version]
- Eom, Y.S.; Yoo, K.S.; Park, J.Y.; Han, S.Y. Reliability-based topology optimization using a standard response surface method for three-dimensional structures. Struct. Multidiscip. Optim. 2011, 43, 287–295. [Google Scholar] [CrossRef]
- Chun, J.; Park, D.; Lee, J. TOPO-Joint: Reliability-based topology optimization for 3D-printed building joints. In Proceedings of the 13th International Conference on Applications of Statistics and Probability in Civil Engineering, ICASP, Seoul, Korea, 26–30 May 2019. [Google Scholar]
- López, C.; Baldomir, A.; Hernández, S. The relevance of reliability-based topology optimization in early design stages of aircraft structures. Struct. Multidiscip. Optim. 2018, 57, 417–439. [Google Scholar] [CrossRef]
- Silva, G.A.; Beck, A.T. Reliability-based topology optimization of continuum structures subject to local stress constraints. Struct. Multidiscip. Optim. 2018, 57, 2339–2355. [Google Scholar] [CrossRef]
- Kharmanda, G.; Gowid, S.; Shokry, A. Reliability-based topology optimization using inverse optimum safety factor approaches. Alex. Eng. J. 2020, 59, 4577–4592. [Google Scholar] [CrossRef]
- Chun, J. Reliability-Based Design Optimization of Structures Using Complex-Step Approximation with Sensitivity Analysis. Appl. Sci. 2021, 11, 4708. [Google Scholar] [CrossRef]
- Pouraminian, M.; Ghaemian, M. Shape optimisation of concrete open spandrel arch bridges. Građevinar 2015, 67, 1177–1185. [Google Scholar]
- He, Z.C.; Wu, Y.; Li, E. Topology optimization of structure for dynamic properties considering hybrid uncertain parameters. Struct. Multidiscip. Optim. 2018, 57, 625–638. [Google Scholar] [CrossRef] [Green Version]
- Pérez-Rúa, J.A.; Lumbreras, S.; Ramos, A.; Cutululis, N.A. Reliability-based topology optimization for offshore wind farm collection system. Wind Energy 2022, 25, 52–70. [Google Scholar] [CrossRef]
- Pouraminian, M.; Pourbakhshian, S.; Yousefzadeh, H.; Farsangi, E.N. Reliability-based linear analysis of low-rise RC frames under earthquake excitation. J. Build. Pathol. Rehabil. 2021, 6, 1–8. [Google Scholar] [CrossRef]
- Pouraminian, M. Multi-hazard reliability assessment of historical brick minarets. J. Build. Pathol. Rehabil. 2022, 7, 1–12. [Google Scholar] [CrossRef]
- Xie, Y.M.; Steven, G.P. A simple evolutionary procedure for structural optimization. Comput. Struct. 1993, 49, 885–896. [Google Scholar] [CrossRef]
- Ghabraie, K. The ESO method revisited. Struct. Multidiscip. Optim. 2015, 51, 1211–1222. [Google Scholar] [CrossRef]
- Simonetti, H.L.; Almeida, V.S.; Oliveira Neto, L. A smooth evolutionary structural optimization procedure applied to plane stress problem. Eng. Struct. 2014, 75, 248–258. [Google Scholar] [CrossRef]
- Rozvany, G.I.N.; Querin, O. Sequential Element Rejections and Admissions (SERA) Method: Applications to Multiconstraint Problems. In Proceedings of the 10th AIAA/ISSMO Multidisciplinary Analysis and Optimization Conference, Albany, NY, USA, 30 August–1 September 2004. [Google Scholar]
- Loyola, R.A.; Querin, O.M.; Jiménez, A.G.; Gordoa, C.A. A sequential element rejection and admission (SERA) topology optimization code written in Matlab. Struct. Multidiscip. Optim. 2018, 58, 1297–1310. [Google Scholar] [CrossRef]
- Simonetti, H.L.; Almeida, V.S.; das Neves, F.D.A.; Almeida, V.D.D. Topology Optimization for Elastic Analysis of 3D Structures using Evolutionary Methods. In Proceedings of the XL Ibero-Latin-American Congress on Computational Methods in Engineering, ABMEC, Natal, Brazil, 11–14 November 2019. [Google Scholar]
- Sotola, M.; Marsalek, P.; Rybansky, D.; Fusek, M.; Gabriel, D. Sensitivity analysis of key formulations of topology optimization on an example of cantilever bending beam. Symmetry 2021, 13, 712. [Google Scholar] [CrossRef]
- Bendsøe, M.P.; Sigmund, O. Topology Optimization—Theory, Methods and Applications; Springer: Berlin/Heidelberg, Germany, 2003. [Google Scholar]
- Sigmund, O.; Peterson, J. Numerical instabilities in topology optimization: A survey on procedures dealing with checkerboards, mesh-dependencies and local minima. Struct. Optim. 1998, 16, 68–75. [Google Scholar] [CrossRef]
- Bruns, T.E.; Tortorelli, D.A. Topology optimization of non-linear elastic structures and compliant mechanisms. Comput. Methods Appl. Mech. Eng. 2001, 190, 3443–3459. [Google Scholar] [CrossRef]
- Du, X. First and second order reliability methods. In Lectures Notes in Probabilistic Engineering Design; University of Missouri: Rolla, MO, USA, 2005. [Google Scholar]
- Hasofer, A.M.; Lind, N.C. An exact and invariant first order reliability format. J. Eng. Mech. Div. Proc. ASCE 1974, 100, 111–121. [Google Scholar] [CrossRef]
- Choi, S.K.; Grandhi, R.V.; Canfield, R.A. Reliability-Based Structural Design; Springer: New York, NY, USA, 2006. [Google Scholar]
- Choi, K.K.; Yu, X.; Chang, K.H. A Mixed Design Approach for Probabilistic Structural Durability. In Proceedings of the Sixth AIAA/USAF/NASA/ISSMO Symposium on Multidisciplinary Analysis and Optimization, Bellevue, WA, USA, 4–6 September 1996. [Google Scholar]
- Liang, Q.Q. Performance-Based Optimization: A Review. Adv. Struct. Eng. 2007, 10, 739–753. [Google Scholar] [CrossRef] [Green Version]
- Liang, Q.Q. Performance-Based Optimization of Structures: Theory and Applications; CRC Press: Boca Raton, FL, USA, 2004. [Google Scholar]
- Cui, C.; Ohmori, H.; Sasaki, M. Computational Morphogenesis of 3D Structures by Extended ESO Method. J. Int. Assoc. Shell Spat. Struct. IASS 2003, 44, 51–61. [Google Scholar]
- Mozumder, C.; Patel, N.; Tillotson, D.; Renaud, J.; Tovar, A. An Investigation of Reliability-Based Topology Optimization. In Proceedings of the 11th AIAA/ISSMO Multidisciplinary Analysis and Optimization Conference, Portsmouth, VA, USA, 6–8 September 2006; p. 7058. [Google Scholar]
Publisher’s Note: MDPI stays neutral with regard to jurisdictional claims in published maps and institutional affiliations. |
© 2022 by the authors. Licensee MDPI, Basel, Switzerland. This article is an open access article distributed under the terms and conditions of the Creative Commons Attribution (CC BY) license (https://creativecommons.org/licenses/by/4.0/).