
EEG Oscillatory Power and Complexity for Epileptic Seizure Detection

 ,
,
Abstract
:1. Introduction
2. Materials and Methods
2.1. Dataset
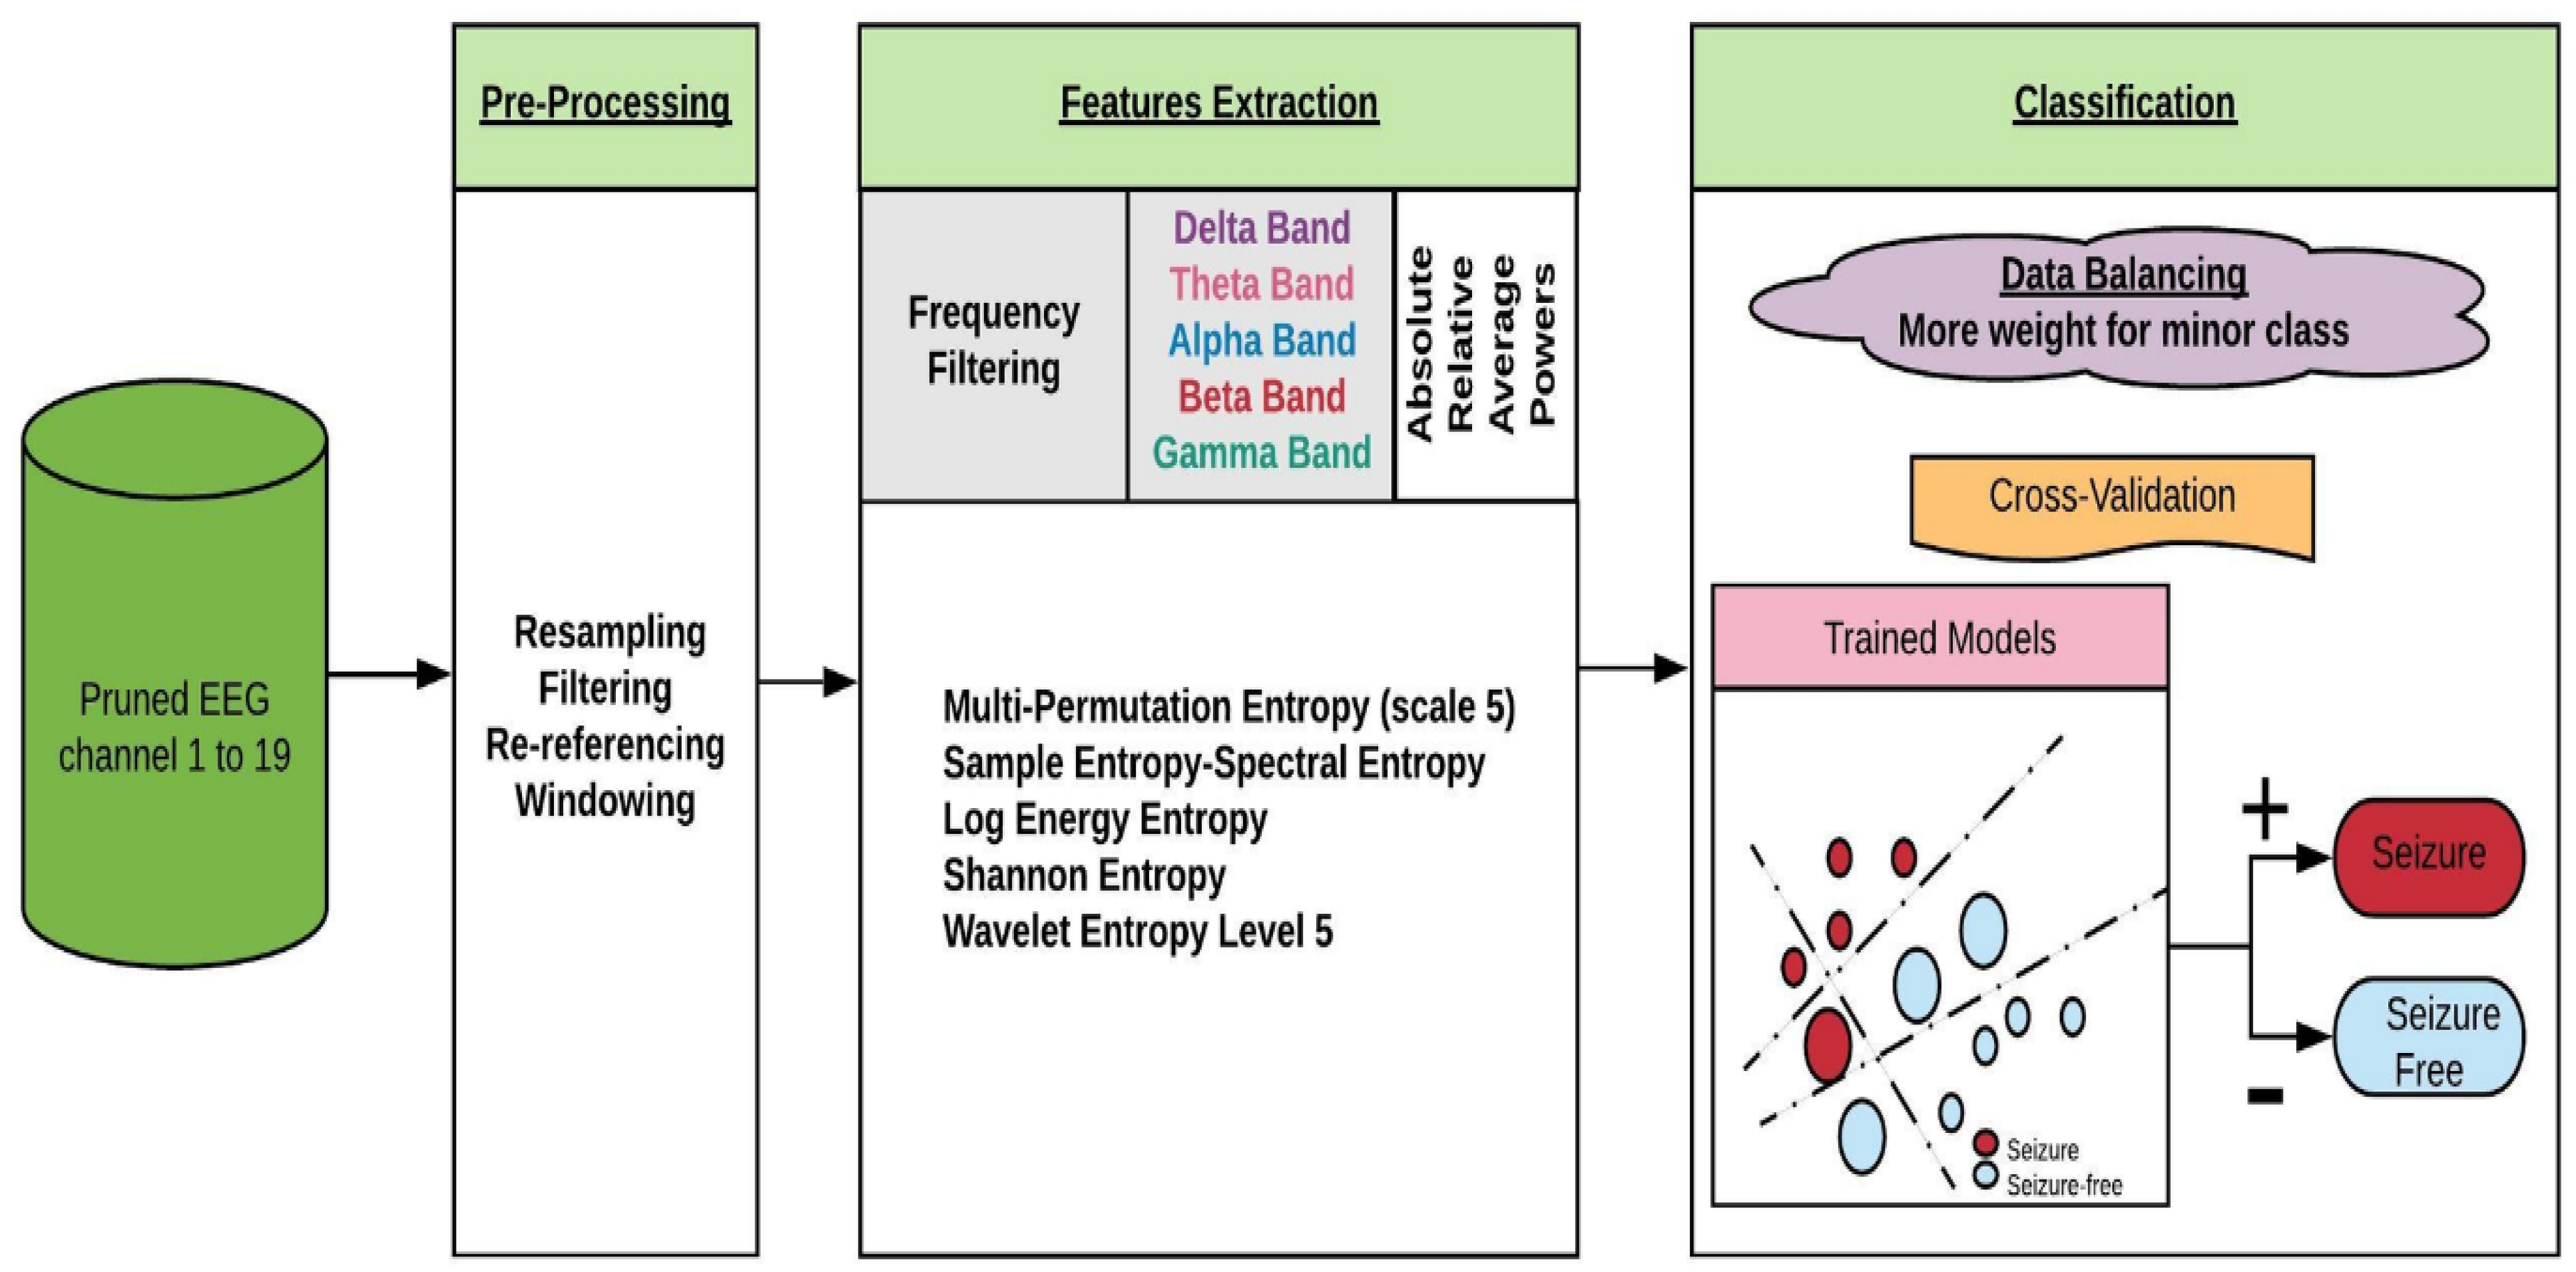
2.2. Methodology
2.2.1. Pre-Processing
2.2.2. Feature Extraction
2.2.3. Training and Evaluation
3. Results
3.1. Univariate Data Analysis
3.2. Performance of Group of Features Extracted from All Channels without Feature Selection
3.3. Performance of Group of Features Extracted from All Channels with Feature Selection
3.4. Performance of Classifiers with Features Extracted from One Channel at a Time
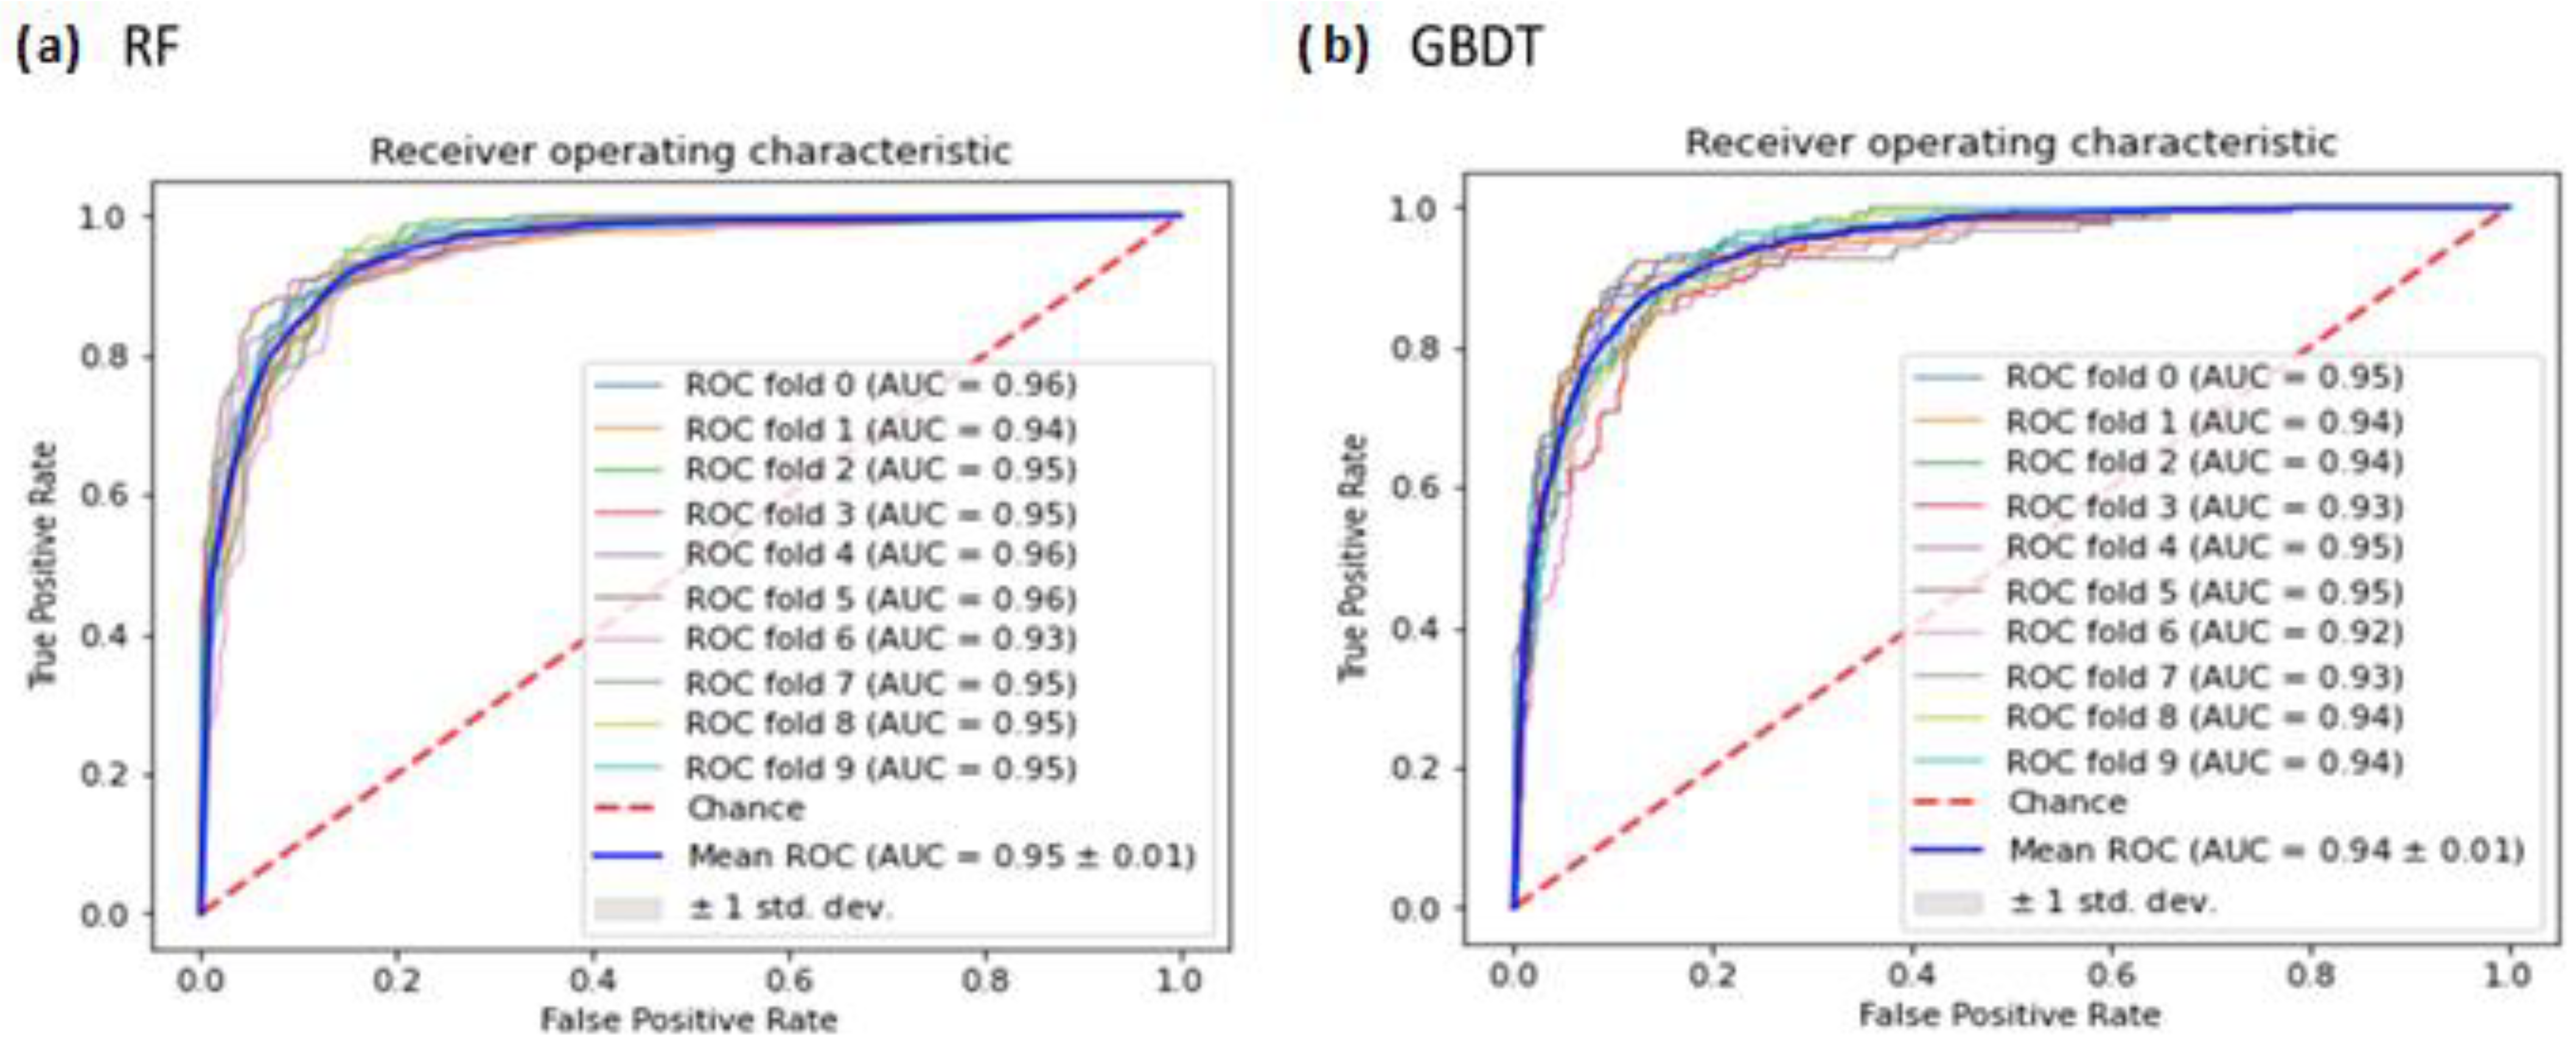
3.5. ROC Analysis of RF and GBDT Classifiers
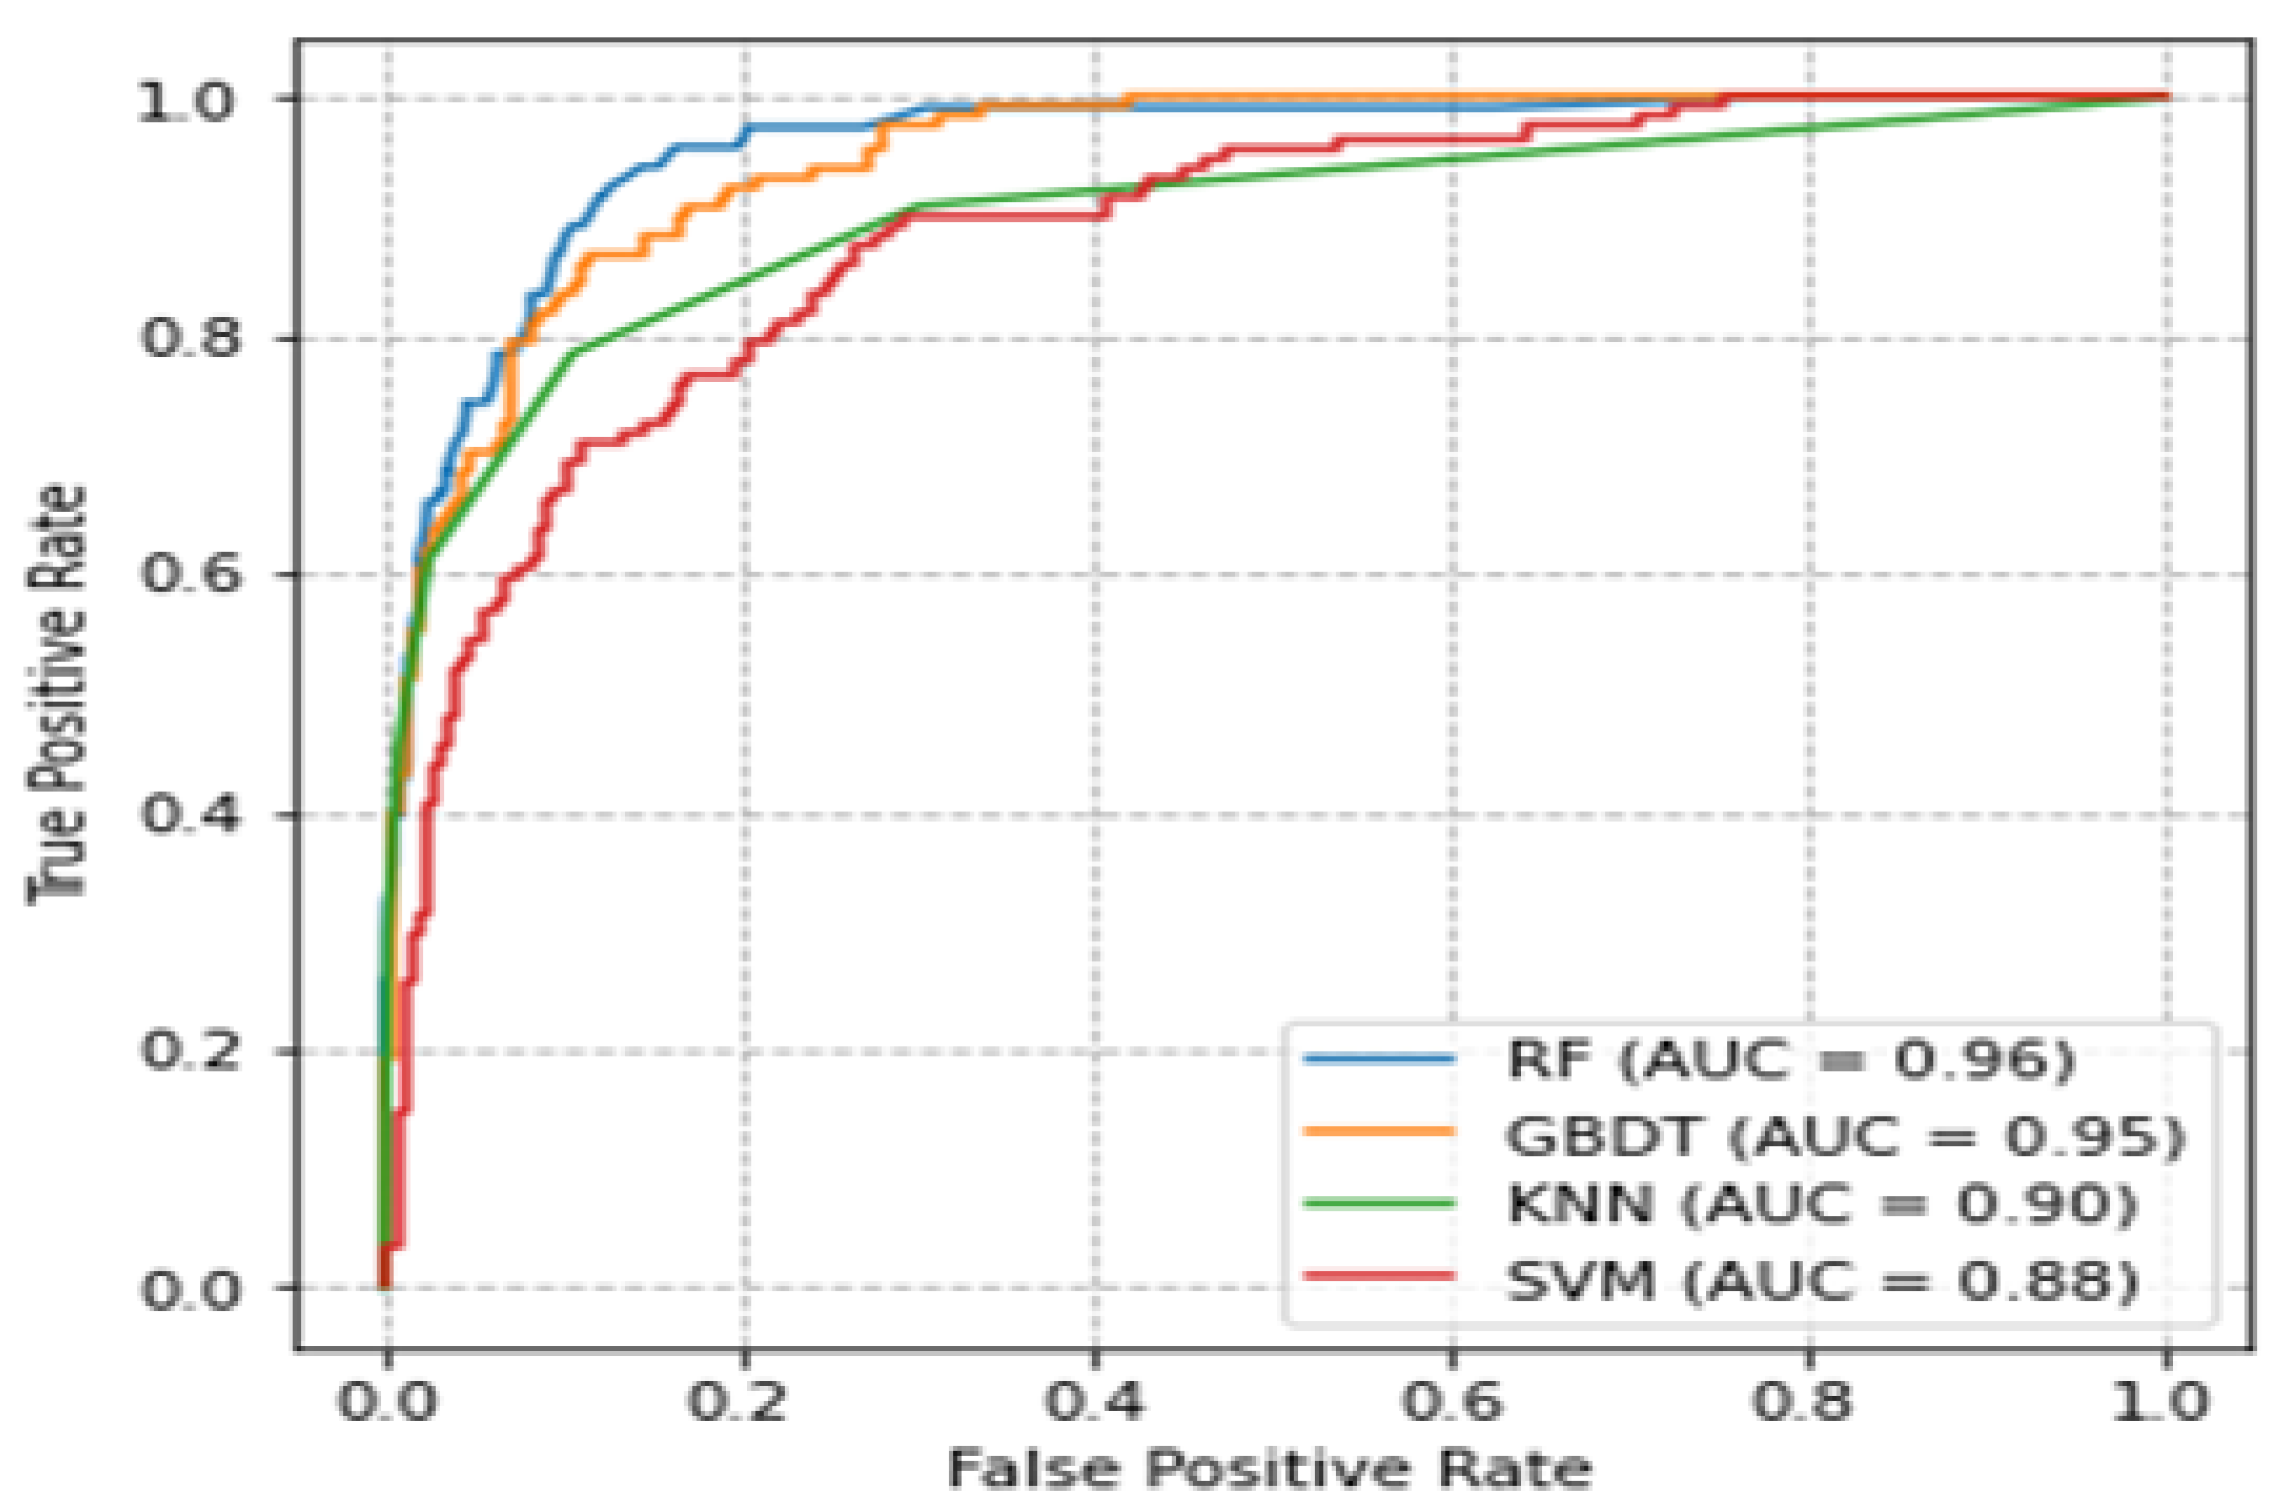
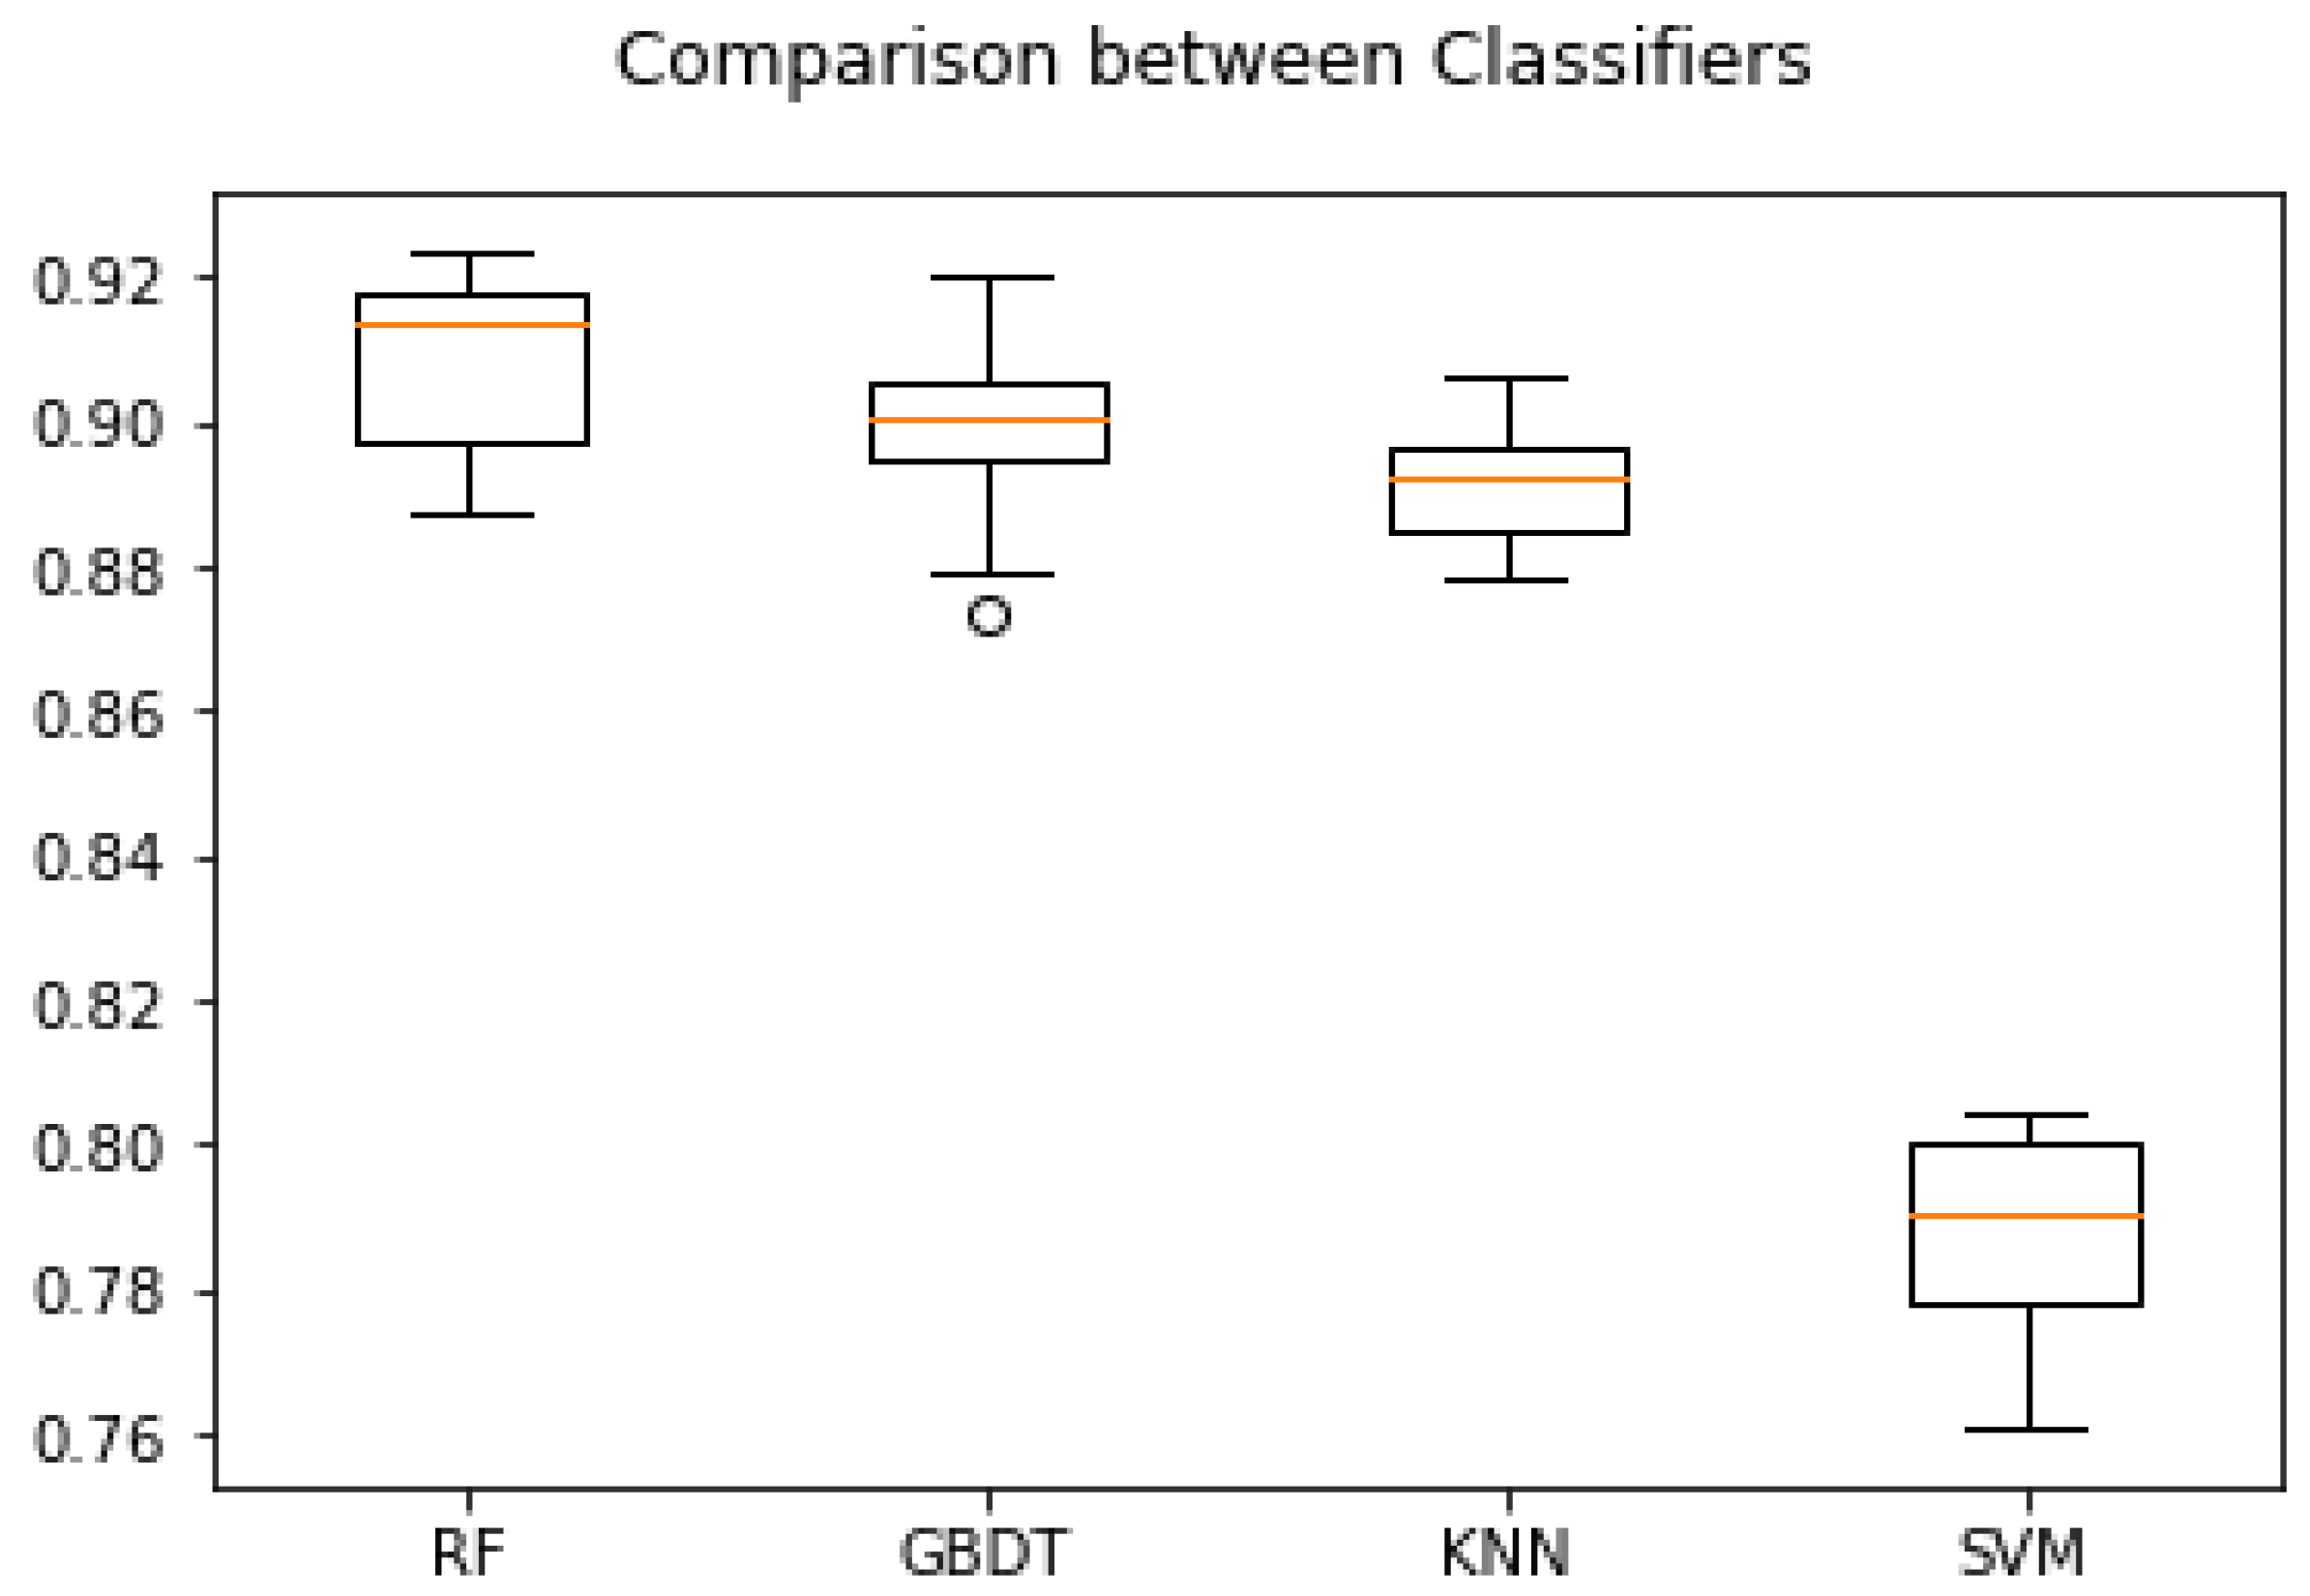
3.6. Comparison of ROC Curves and Accuracies of Classifiers
4. Discussion
5. Conclusions
Author Contributions
Funding
Institutional Review Board Statement
Informed Consent Statement
Data Availability Statement
Conflicts of Interest
References
- Alam, S.M.S.; Bhuiyan, M.I.H. Detection of Seizure and Epilepsy Using Higher Order Statistics in the EMD Domain. IEEE J. Biomed. Health Inform. 2013, 17, 312–318. [Google Scholar] [CrossRef] [PubMed]
- Martis, R.J.; Acharya, U.R.; Tan, J.H.; Petznick, A.; Yanti, R.; Chua, C.K.; Ng, E.Y.; Tong, L. Application of Empirical Mode Decomposition (Emd) for Automated Detection of Epilepsy using Eeg Signals. Int. J. Neural Syst. 2012, 22, 1250027. [Google Scholar] [CrossRef]
- Birjandtalab, J.; Heydarzadeh, M.; Nourani, M. Automated EEG-Based Epileptic Seizure Detection Using Deep Neural Networks. In Proceedings of the 2017 IEEE International Conference on Healthcare Informatics (ICHI 2017), Park City, UT, USA, 23–26 August 2017; pp. 552–555. [Google Scholar]
- Harlalka, V.; Puntambekar, V.P.; Raviteja, K.; Mahalakshmi, P. Detection of Epileptic Seizure Using Wavelet Analysis based Shannon Entropy, Logarithmic Energy Entropy and Support Vector Machine. Int. J. Eng. Technol. 2018, 7, 935–939. [Google Scholar] [CrossRef]
- Kumar, Y.; Dewal, M.L.; Anand, R.S. Wavelet entropy based EEG analysis for seizure detection. In Proceedings of the 2013 IEEE International Conference on Signal Processing, Computing and Control (ISPCC 2013), Solan, India, 26–28 September 2013. [Google Scholar]
- Sharma, R.; Pachori, R.B. Classification of epileptic seizures in EEG signals based on phase space representation of intrinsic mode functions. Expert Syst. Appl. 2015, 42, 1106–1117. [Google Scholar] [CrossRef]
- Tzallas, A.T.; Tsipouras, M.G.; Fotiadis, D.I. Epileptic Seizure Detection in EEGs Using Time–Frequency Analysis. IEEE Trans. Inf. Technol. Biomed. 2009, 13, 703–710. [Google Scholar] [CrossRef]
- Tzallas, A.T.; Tsipouras, M.G.; Fotiadis, D.I. Automatic Seizure Detection Based on Time-Frequency Analysis and Artificial Neural Networks. Comput. Intell. Neurosci. 2007, 2007, 080510. [Google Scholar] [CrossRef] [PubMed]
- Raghu, S.; Sriraam, N.; Kumar, G.P. Classification of epileptic seizures using wavelet packet log energy and norm entropies with recurrent Elman neural network classifier. Cogn. Neurodynamics 2017, 11, 51–66. [Google Scholar] [CrossRef] [PubMed] [Green Version]
- Jemal, I.; Mitiche, A.; Mezghani, N. A Study of EEG Feature Complexity in Epileptic Seizure Prediction. Appl. Sci. 2021, 11, 1579. [Google Scholar] [CrossRef]
- Kannathal, N.; Choo, M.L.; Acharya, U.R.; Sadasivan, P. Entropies for detection of epilepsy in EEG. Comput. Methods Programs Biomed. 2005, 80, 187–194. [Google Scholar] [CrossRef]
- Acharya, U.R.; Fujita, H.; Sudarshan, V.K.; Bhat, S.; Koh, J.E. Application of entropies for automated diagnosis of epilepsy using EEG signals: A review. Knowl. Based Syst. 2015, 88, 85–96. [Google Scholar] [CrossRef]
- Orosco, L.; Laciar, E.; Correa, A.G.; Torres, A.; Graffigna, J.P. An epileptic seizures detection algorithm based on the empirical mode decomposition of EEG. In Proceedings of the 31st Annual International Conference of the IEEE Engineering in Medicine and Biology Society: Engineering the Future of Biomedicine, EMBC 2009, Minneapolis, MN, USA, 3–6 September 2009; pp. 2651–2654. [Google Scholar]
- Acharya, U.R.; Molinari, F.; Sree, S.V.; Chattopadhyay, S.; Ng, K.-H.; Suri, J.S. Automated diagnosis of epileptic EEG using entropies. Biomed. Signal Process. Control. 2012, 7, 401–408. [Google Scholar] [CrossRef] [Green Version]
- Sharma, R.; Pachori, R.B.; Acharya, U.R. Application of Entropy Measures on Intrinsic Mode Functions for the Automated Identification of Focal Electroencephalogram Signals. Entropy 2015, 17, 669–691. [Google Scholar] [CrossRef]
- Li, J.; Yan, J.; Liu, X.; Ouyang, G. Using Permutation Entropy to Measure the Changes in EEG Signals during Absence Seizures. Entropy 2014, 16, 3049–3061. [Google Scholar] [CrossRef] [Green Version]
- Wendling, F.; Bartolomei, F.; Bellanger, J.-J.; Bourien, J.; Chauvel, P. Epileptic fast intracerebral EEG activity: Evidence for spatial decorrelation at seizure onset. Brain 2003, 126, 1449–1459. [Google Scholar] [CrossRef] [Green Version]
- Shantha Selva Kumari, R.; Prabin Jose, J. Seizure detection in EEG using time frequency analysis and SVM. In Proceedings of the 2011 International Conference on Emerging Trends in Electrical and Computer Technology, ICETECT 2011, Nagercoil, India, 23–24 March 2011; pp. 626–630. [Google Scholar]
- Ridouh, A.; Boutana, D.; Bourennane, S. EEG Signals Classification Based on Time Frequency Analysis. J. Circuits Syst. Comput. 2017, 26, 1750198. [Google Scholar] [CrossRef]
- Myers, M.H.; Jolly, E.; Li, Y.; de Jongh Curry, A.; Parfenova, H. Power Spectral Density Analysis of Electrocorticogram Recordings during Cerebral Hypothermia in Neonatal Seizures. Ann. Neurosci. 2017, 24, 12–19. [Google Scholar] [CrossRef] [PubMed] [Green Version]
- Zhang, Z.; Parhi, K.K. Seizure detection using regression tree based feature selection and polynomial SVM classification. In Proceedings of the 2015 37th Annual International Conference of the IEEE Engineering in Medicine and Biology Society (EMBC), Milan, Italy, 25–29 August 2015; pp. 6578–6581. [Google Scholar]
- Bandarabadi, M.; Teixeira, C.; Rasekhi, J.; Dourado, A. Epileptic seizure prediction using relative spectral power features. Clin. Neurophysiol. 2015, 126, 237–248. [Google Scholar] [CrossRef]
- Chen, J.; Zhou, X.; Jin, L.; Lu, Q.; Sun, H.; Liu, Q.; Huang, Y. Can Spectral Power Be Used as a Candidate Seizure Marker of the Periodic Discharges Pattern? Front. Neurol. 2021, 12, 642669. [Google Scholar] [CrossRef]
- Subha, D.P.; Joseph, P.K.; Acharya, R.; Lim, C.M. EEG Signal Analysis: A Survey. J. Med. Syst. 2010, 34, 195–212. [Google Scholar] [CrossRef]
- Kotsiantis, S.B. Supervised machine learning: A review of classification techniques. Informatica 2007, 31, 249–268. [Google Scholar]
- Fu, K.; Qu, J.; Chai, Y.; Dong, Y. Classification of seizure based on the time-frequency image of EEG signals using HHT and SVM. Biomed. Signal Process. Control 2014, 13, 15–22. [Google Scholar] [CrossRef]
- Temko, A.; Thomas, E.; Marnane, W.; Lightbody, G.; Boylan, G. EEG-based neonatal seizure detection with Support Vector Machines. Clin. Neurophysiol. 2011, 122, 464–473. [Google Scholar] [CrossRef] [Green Version]
- Gómez, C.; Arbeláez, P.; Navarrete, M.; Alvarado-Rojas, C.; Le Van Quyen, M.; Valderrama, M. Automatic seizure detection based on imaged-EEG signals through fully convolutional networks. Sci. Rep. 2020, 10, 21833. [Google Scholar] [CrossRef] [PubMed]
- Aarabi, A.; Wallois, F.; Grebe, R. Automated neonatal seizure detection: A multistage classification system through feature selection based on relevance and redundancy analysis. Clin. Neurophysiol. 2006, 117, 328–340. [Google Scholar] [CrossRef]
- Shoeb, A.H. Application of Machine Learning to Epileptic Seizure Onset Detection and Treatment. Ph.D. Thesis, Mass NSL of Technology, Massachusetts Institute of Technology, Cambridge, MA, USA, 2009. [Google Scholar]
- Khan, Y.U.; Rafiuddin, N.; Farooq, O. Automated seizure detection in scalp EEG using multiple wavelet scales. In Proceedings of the 2012 IEEE International Conference on Signal Processing, Computing and Control (ISPCC 2012), Solan, India, 15–17 March 2012. [Google Scholar]
- Yuan, Q.; Zhou, W.; Liu, Y.; Wang, J. Epileptic seizure detection with linear and nonlinear features. Epilepsy Behav. 2012, 24, 415–421. [Google Scholar] [CrossRef] [PubMed]
- Williamson, J.R.; Bliss, D.W.; Browne, D.W.; Narayanan, J.T. Seizure prediction using EEG spatiotemporal correlation structure. Epilepsy Behav. 2012, 25, 230–238. [Google Scholar] [CrossRef] [Green Version]
- Patnaik, L.; Manyam, O.K. Epileptic EEG detection using neural networks and post-classification. Comput. Methods Programs Biomed. 2008, 91, 100–109. [Google Scholar] [CrossRef]
- González Otárula, K.A.; Mikhaeil-Demo, Y.; Bachman, E.M.; Balaguera, P.; Schuele, S. Automated seizure detection accuracy for ambulatory EEG recordings. Neurology 2019, 92, e1540–e1546. [Google Scholar] [CrossRef]
- Marín, M.R.; Martínez, I.V.; Bermúdez, G.R.; Porfiri, M. Integrating old and new complexity measures toward automated seizure detection from long-term video EEG recordings. iScience 2021, 24, 101997. [Google Scholar] [CrossRef]
- Shum, J.; Friedman, D. Commercially available seizure detection devices: A systematic review. J. Neurol. Sci. 2021, 428, 117611. [Google Scholar] [CrossRef]
- Koren, J.; Hafner, S.; Feigl, M.; Baumgartner, C. Systematic analysis and comparison of commercial seizure-detection software. Epilepsia 2021, 62, 426–438. [Google Scholar] [CrossRef]
- Bruno, E.; Viana, P.F.; Sperling, M.R.; Richardson, M.P. Seizure detection at home: Do devices on the market match the needs of people living with epilepsy and their caregivers? Epilepsia 2020, 61, S11–S24. [Google Scholar] [CrossRef] [PubMed]
- Obeid, I.; Picone, J. The Temple University Hospital EEG Data Corpus. Front. Neurosci. 2016, 10, 196. [Google Scholar] [CrossRef] [PubMed] [Green Version]
- Shah, V.; von Weltin, E.; Lopez, S.; McHugh, J.R.; Veloso, L.; Golmohammadi, M.; Obeid, I.; Picone, J. The Temple University Hospital Seizure Detection Corpus. Front. Neuroinformatics 2018, 12, 83. [Google Scholar] [CrossRef]
- Ochal, D.; Rahman, S.; Ferrell, S.; Elseify, T.; Obeid, I.; Picone, J. The Temple University Hospital EEG Corpus: Annotation Guidelines. Inst. Signal Inf. Process. Rep. 2020, 1, 1–28. [Google Scholar]
- Kursa, M.B. Robustness of Random Forest-based gene selection methods. BMC Bioinform. 2014, 15, 8. [Google Scholar] [CrossRef] [Green Version]
- Detti, P.; De Lara, G.Z.M.; Bruni, R.; Pranzo, M.; Sarnari, F.; Vatti, G. A Patient-Specific Approach for Short-Term Epileptic Seizures Prediction through the Analysis of EEG Synchronization. IEEE Trans. Biomed. Eng. 2019, 66, 1494–1504. [Google Scholar] [CrossRef]
- Breiman, L. Random forests. Mach. Learn. 2001, 45, 5–32. [Google Scholar] [CrossRef] [Green Version]
- Friedman, J.H. Greedy function approximation: A gradient boosting machine. Ann. Stat. 2001, 29, 1189–1232. [Google Scholar] [CrossRef]
- Pereira, F.; Mitchell, T.; Botvinick, M. Machine learning classifiers and fMRI: A tutorial overview. NeuroImage 2009, 45, S199–S209. [Google Scholar] [CrossRef] [Green Version]
- Sharma, R.; Pachori, R.B.; Sircar, P. Seizures classification based on higher order statistics and deep neural network. Biomed. Signal Process. Control 2020, 59, 101921. [Google Scholar] [CrossRef]
- Tibdewal, M.N.; Dey, H.R.; Mahadevappa, M.; Ray, A.; Malokar, M. Multiple entropies performance measure for detection and localization of multi-channel epileptic EEG. Biomed. Signal Process. Control 2017, 38, 158–167. [Google Scholar] [CrossRef]
- Biau, G.; Scornet, E. A random forest guided tour. TEST 2016, 25, 197–227. [Google Scholar] [CrossRef] [Green Version]
- Speiser, J.L.; Miller, M.E.; Tooze, J.; Ip, E. A comparison of random forest variable selection methods for classification prediction modeling. Expert Syst. Appl. 2019, 134, 93–101. [Google Scholar] [CrossRef]
- Tsipouras, M.G. Spectral information of EEG signals with respect to epilepsy classification. EURASIP J. Adv. Signal Process. 2019, 2019, 10. [Google Scholar] [CrossRef] [Green Version]
- Pérez-Elvira, R.; Oltra-Cucarella, J.; Carrobles, J.; Teodoru, M.; Bacila, C.; Neamtu, B. Individual Alpha Peak Frequency, an Important Biomarker for Live Z-Score Training Neurofeedback in Adolescents with Learning Disabilities. Brain Sci. 2021, 11, 167. [Google Scholar] [CrossRef]


| Number | |
|---|---|
| Total patients (female) | 341 (188 F) |
| Patients with seizure (female) | 133 (72 F) |
| Sessions | 886 |
| Files | 7634 |
| Seizure files | 1780 |
| Seizure-free files | 5854 |
| Total duration in hours | 655.36 |
| Type | Features | Category |
|---|---|---|
| Complexity measures | Sample entropy Logarithmic entropy Wavelet entropy | Information theory |
| Spectral entropy | ||
| Shannon entropy | ||
| Permutation entropy | ||
| Oscillatory power | Absolute power relative power (delta, theta, alpha, beta, gamma) | Frequency domain |
| Features | Seizure-Free (Mean ± Std) | Seizure (Mean ± Std) | p-Value |
|---|---|---|---|
| Shannon entropy | 0.242 ± 0.125 | 0.1556 ± 0.095 | 6.159 × 10⁻¹⁵ |
| Sample entropy | 0.279 ± 0.132 | 0.199 ± 0.118 | 1.760 × 10−96 |
| Spectral entropy | 0.288 ± 0.143 | 0.203 ± 0.123 | 2.193 × 10−95 |
| Log energy entropy | 0.320 ± 0.152 | 0.217 ± 0.139 | 7.184 × 10⁻¹¹ |
| Wavelet entropy | 0.262 ± 0.125 | 0.181 ± 0.112 | 6.657 × 10⁻¹¹ |
| Multi-permutation 1 | 0.267 ± 0.122 | 0.196 ± 0.117 | 1.212 × 10−80 |
| Multi-permutation 2 | 0.296 ± 0.145 | 0.207 ± 0.129 | 4.130 × 10−98 |
| Multi-permutation 3 | 0.275 ± 0.130 | 0.194 ± 0.125 | 3.050 × 10−90 |
| Multi-permutation 4 | 0.291 ± 0.141 | 0.196 ± 0.123 | 3.467 × 10⁻¹² |
| Features | Band | Seizure-Free (Mean ± Std in mV) | Seizure (Mean ± Std in mV) | p-Value |
|---|---|---|---|---|
| Absolute | Delta | 0.89 ± 0.02 | 0.87 ± 0.03 | 5.694 × 10−124 |
| power | Theta | 0.89 ± 0.02 | 0.87 ± 0.03 | 1.156 × 10−129 |
| Alpha | 0.89 ± 0.02 | 0.87 ± 0.03 | 7.125 × 10−133 | |
| Beta | 0.90 ± 0.02 | 0.87 ± 0.04 | 9.067 × 10−133 | |
| Gamma | 0.90 ± 0.02 | 0.87 ± 0.04 | 3.423 × 10−133 | |
| Relative | Delta | 0.88 ± 0.02 | 0.86 ± 0.03 | 8.007 × 10−132 |
| power | Theta | 0.88 ± 0.02 | 0.53 ± 0.04 | 9.594 × 10−128 |
| Alpha | 0.25 ± 0.16 | 0.15 ± 0.11 | 7.173 × 10−145 | |
| Beta | 0.26 ± 0.15 | 0.16 ± 0.11 | 1.367 × 10−129 | |
| Gamma | 0.27 ± 0.14 | 0.19 ± 0.11 | 1.344 × 10−93 |
| Classifiers | RF | GBDT | SVM | K-NN | ||||||||
|---|---|---|---|---|---|---|---|---|---|---|---|---|
| Features | AUC% | F% | ACC% | AUC% | F% | ACC% | AUC% | F% | ACC% | AUC% | F% | ACC% |
| Complexity measures | 95 ± 01 | 91.05 | 90.68 | 93 ± 01 | 89.86 | 89.48 | 79 ± 03 | 71.44 | 73.57 | 85 ± 02 | 88.92 | 87.90 |
| Oscillatory power | 95 ± 01 | 91.33 | 90.95 | 94 ± 01 | 90.68 | 90.40 | 88 ± 02 | 79.29 | 80.65 | 89 ± 02 | 89.67 | 88.73 |
| Complexity and power | 95 ± 01 | 91.41 | 91.07 | 94 ± 01 | 90.95 | 90.67 | 86 ± 02 | 77.24 | 78.72 | 88 ± 02 | 90.09 | 89.16 |
| Classifiers | RF | GBDT | SVM | K-NN | ||||||||
|---|---|---|---|---|---|---|---|---|---|---|---|---|
| Features | AUC% | F% | ACC% | AUC% | F% | ACC% | AUC% | F% | ACC% | AUC% | F% | ACC% |
| Complexity measures | 87 ± 02 | 88.65 | 86.00 | 83 ± 03 | 87.13 | 84.52 | 81 ± 03 | 73.09 | 75.07 | 84 ± 02 | 88.80 | 87.47 |
| Oscillatory power | 94 ± 01 | 90.07 | 89.60 | 93 ± 01 | 89.56 | 89.21 | 91 ± 01 | 81.73 | 82.96 | 88 ± 02 | 89.50 | 88.43 |
| Complexity and power | 94 ± 01 | 90.76 | 90.30 | 94 ± 01 | 89.76 | 89.43 | 90 ± 01 | 80.63 | 81.92 | 88 ± 02 | 90.04 | 89.07 |
| RF | GBDT | |||||
|---|---|---|---|---|---|---|
| Channel | AUC% | F% | ACC% | AUC% | F% | ACC% |
| FP1 | 91 ± 01 | 87.27 | 86.41 | 88 ± 01 | 85.63 | 84.85 |
| FP2 | 94 ± 01 | 89.78 | 89.38 | 92 ± 01 | 88.09 | 87.70 |
| F3 | 79 ± 03 | 88.15 | 83.86 | 73 ± 03 | 87.50 | 82.78 |
| F4 | 80 ± 02 | 87.82 | 83.39 | 73 ± 02 | 87.44 | 81.89 |
| F7 | 90 ± 02 | 88.47 | 87.02 | 88 ± 02 | 87.07 | 85.55 |
| F8 | 78 ± 03 | 87.86 | 81.70 | 73 ± 03 | 86.90 | 81.00 |
| Fz | 80 ± 02 | 88.05 | 83.78 | 73 ± 02 | 87.76 | 81.25 |
| C3 | 92 ± 01 | 88.66 | 88.08 | 90 ± 01 | 87.15 | 86.76 |
| C4 | 88 ± 01 | 86.43 | 85.55 | 87 ± 01 | 85.05 | 84.82 |
| Cz | 88 ± 01 | 85.96 | 85.11 | 87 ± 01 | 85.10 | 84.61 |
| T3 | 92 ± 01 | 89.00 | 88.36 | 89 ± 01 | 86.34 | 85.66 |
| T4 | 86 ± 02 | 86.64 | 84.14 | 85 ± 02 | 84.77 | 83.28 |
| T5 | 91 ± 01 | 87.60 | 86.94 | 89 ± 01 | 86.25 | 85.71 |
| T6 | 92 ± 01 | 88.20 | 87.52 | 89 ± 01 | 86.06 | 85.41 |
| P3 | 90 ± 01 | 87.75 | 86.91 | 87 ± 01 | 85.43 | 84.69 |
| P4 | 90 ± 01 | 88.22 | 87.00 | 87 ± 01 | 86.66 | 85.00 |
| Pz | 94 ± 01 | 89.96 | 89.51 | 92 ± 01 | 88.16 | 87.72 |
| O1 | 80 ± 02 | 88.19 | 84.33 | 73 ± 02 | 87.83 | 81.63 |
| O2 | 85 ± 02 | 88.13 | 85.25 | 80 ± 03 | 86.32 | 83.27 |
Publisher’s Note: MDPI stays neutral with regard to jurisdictional claims in published maps and institutional affiliations. |
© 2022 by the authors. Licensee MDPI, Basel, Switzerland. This article is an open access article distributed under the terms and conditions of the Creative Commons Attribution (CC BY) license (https://creativecommons.org/licenses/by/4.0/).
Share and Cite
Abou-Abbas, L.; Jemal, I.; Henni, K.; Ouakrim, Y.; Mitiche, A.; Mezghani, N. EEG Oscillatory Power and Complexity for Epileptic Seizure Detection. Appl. Sci. 2022, 12, 4181. https://doi.org/10.3390/app12094181
Abou-Abbas L, Jemal I, Henni K, Ouakrim Y, Mitiche A, Mezghani N. EEG Oscillatory Power and Complexity for Epileptic Seizure Detection. Applied Sciences. 2022; 12(9):4181. https://doi.org/10.3390/app12094181
Chicago/Turabian StyleAbou-Abbas, Lina, Imene Jemal, Khadidja Henni, Youssef Ouakrim, Amar Mitiche, and Neila Mezghani. 2022. "EEG Oscillatory Power and Complexity for Epileptic Seizure Detection" Applied Sciences 12, no. 9: 4181. https://doi.org/10.3390/app12094181
APA StyleAbou-Abbas, L., Jemal, I., Henni, K., Ouakrim, Y., Mitiche, A., & Mezghani, N. (2022). EEG Oscillatory Power and Complexity for Epileptic Seizure Detection. Applied Sciences, 12(9), 4181. https://doi.org/10.3390/app12094181