Article

Global Cost and Carbon Impact Assessment Methodology for Electric Vehicles’ PV-Powered Charging Station

AVENUES, Université de Technologie de Compiègne, Centre Pierre Guillaumat-CS 60319, 60203 Compiègne, France
*
Author to whom correspondence should be addressed.
Appl. Sci. 2022, 12(9), 4115; https://doi.org/10.3390/app12094115
Submission received: 31 March 2022 / Revised: 15 April 2022 / Accepted: 18 April 2022 / Published: 19 April 2022

Abstract

:

Featured Application

This paper focuses on a technical–economic–environmental assessment methodology, based on a life cycle assessment, of photovoltaic-powered charging stations (PVCS) dedicated for electric vehicles (EVs). The PVCS includes PV sources, charging terminals, stationary batteries’ storage, and public grid connection. The proposed methodology is detailed through two tasks. The first one is the calculation of the global cost of the PVCS under 30 years of lifespan. The second task is dedicated to the assessment of the global carbon impact of the PVCS, in addition to the different actions proposed to reduce the carbon impact compared to a charging station based only on the power grid.

Abstract

To deal with the issue of climate change by moving towards sustainable development, electric mobility is one of the most beneficial approaches, offering users relatively low-carbon transport means. Based on a life cycle assessment, this paper investigates a calculation methodology of carbon impact and global cost for a photovoltaic-powered charging station (PVCS) for electric vehicles (EVs). The PVCS is equipped with a PV system, stationary storage, charging terminals, and connection with the power grid. This methodology has two main objectives. The first one is the estimation of the global cost of the PVCS under 30 years of lifespan, including the costs of investment, exploitation, maintenance, and externalities. The second one is the calculation and assessment of the carbon impact of the PVCS and comparing it with a grid-powered charging station (PGCS). According to the analysis of the results obtained, the carbon impact of the PV system is largely responsible for the global carbon impact of PVCS. Thus, levers of action and scenarios are proposed to reduce the global carbon impact by using more recent data and recycled materials for the most emitting elements of CO2. The proposed scenarios allowed a reduction in the carbon impact of the PVCS compared to the PGCS, where scenario 4 has the lowest carbon impact. For recent PV panels having a greatly reduced emission coefficient of 0.012 kgCO2,eq/kWh, and a recycled infrastructure, the PVCS has a 32.1% lower carbon impact than that of the PGCS.

1. Introduction

Electric vehicles (EVs) have been presented for several years as a promising solution to reduce the carbon impact of the transport sector. The latter is the main emitter of CO2 in France with 42% of total greenhouse gases (GHG) emissions, and the second emitter in the world and in the European Union with 24% and 28% of total emissions in 2018, respectively [1]. As road transport represents more than 80% of these emissions, it is remarkable that it is a priority axis for reducing GHG emissions in order to reduce the negative impact of humans on the planet and its ecosystems. However, the environmental impact of EVs is still far from neutral. In addition to the manufacturing processes for its highly emitting components, the environmental impact of these vehicles depends largely on the source of the electricity that allows them to operate. In order to limit GHG emissions related to the usage of EVs, it therefore seems advantageous to provide them with the most environmentally friendly electricity, which leads to turning to renewable energy sources, as photovoltaic (PV) [2]. EVs charging stations based on PV installations seem able to respond optimally to this challenge. However, while EVs do not directly emit CO2 when in motion, they do indirectly emit CO2 during their conception, maintenance, and recycling. Likewise, PV-powered charging stations (PVCS) do not emit CO2 when they produce electricity, but it is possible to estimate their GHG emissions considering their conception, maintenance, and recycling processes. The GHG emissions of the PVCS require an estimation methodology. There are environmental analysis methodologies such as the single-criteria “Bilan Carbone®” analysis developed by ADEME and then taken up by the Bilan Carbone association [3], the simplified carbon assessment developed by the energy regulatory commission [4], Ecoinvent database [5], ISO 14040/44 life cycle assessment (LCA) [6], as well as tools for their implementation. Despite the importance of this topic, most research works have focused on maximizing the portion of PV production in the recharge of the EVs to minimize GHG emission from energy production [7,8].
Hence, research work emphases on estimating the carbon impact related to EVs and PV installations. In [9], a feasibility study was conducted on EV charging based on PVCS, which reduces CO2 emissions and the overload on the local power grid. The study was carried out in several countries and the results demonstrate that countries with high irradiation (Australia and Brazil) are more likely to exploit the PV infrastructures to charge EVs. However, this analysis of CO2 emissions is limited to the operational phase of PVCS, where the manufacturing and end-of-life phases are excluded. Thus, total CO2 emissions are determined by adding the carbon impact of power given by PV to EV, stationary storage to EV, and EV to grid. In [10], a model for designing and optimizing a charging station based on PV panels and stationary storage for EVs was established. The study demonstrates an environmental benefit through CO2 savings estimates, but it also includes a cost analysis. However, this work involves only electric light mobility, and does not have a detailed CO2 estimation model; the embodied emissions, due to the manufacturing of the PV system components, were not considered. In [11], the environmental impact evaluation was discussed in term of CO2 emissions integrated into the green energy systems. It also emphasizes the environmental benefits estimation of their implementation in the power supply of EVs’ charging stations compared to the power grid.
Carbon emission assessment methodologies based on LCA were developed in [12] to compare the carbon impact of an EV (Tesla Model 3) and a hydrogen fuel cell vehicle (Toyota MIRAI). According to the results presented, there is a great need for transparency regarding the relevant information on the product carbon impact methodology adopted by the car manufacturers to allow the comparison of the emissions of their vehicles. This work excludes the examination of reports on the carbon impact for vehicles powered by renewable energy sources. Through LCA, the carbon impact of a battery EV and an internal combustion engine vehicle are calculated and compared under a nationwide electricity mix in China [13]. For provinces with a high share of electricity based on coal, the development of battery EVs should be encouraged. In [14], a statistical model that relates charging station infrastructure and other potential factors such as the adoption rate of rechargeable EVs in 58 counties in California was developed, where the life-cycle petroleum use, costs, and emissions, of light vehicles is studied. A modeling and comparison of two case studies from Los Angeles, California, and Detroit, Michigan for the two cities’ current energy mix in 2017 was carried out [15]. LCA evaluation was presented in this study to measure the impact of climatic temperatures and different regional energy mix on both electric and conventional vehicles. The results demonstrate that low temperatures increase GHG emissions and lead to inefficient battery charging.
This paper [16] focuses on the United Kingdom’s EVs’ charging strategy toward the goals of 2030 and 2040, i.e., vehicle-to-grid or smart charging. This study results are lower CO2 emission, higher integration of renewable energy sources, and more positive impact on the power grid. Hybrid EVs are found to be the most energy-efficient option, while EVs are found to be the least carbon-intensive vehicle option. However, the scope of this study is limited to the carbon impact of the EVs’ charging strategy.
In addition to the study of CO2 emissions from PVCS, an estimation of the global cost was discussed in the literature over the lifetime of an installation. Optimal technical sizing of the PV system and stationary storage systems for recharging EVs is critical to ensure their economic feasibility, which corresponds to sizing system components with minimum cost. In [17], an analysis of the technical and economic performances of autonomous PVCS associated with stationary battery storage is discussed using the HOMER software. In [18], an optimal configuration of PVCS is discussed economically and technically with several solar irradiation in Vietnam. The results of the study demonstrate that the irradiation is a crucial factor in choosing to install and invest in a PVCS. A sizing optimization of a PVCS with stationary storage is proposed in [19] for fast EV charging. The optimization method allows the cost of the charging station to be minimized, including the maintenance and investment costs of the PV and the storage system. A problem of sizing the EVs’ charging station, i.e., decisions on the number and types of chargers, was resolved in [20] due to an optimization framework that reduces the investment cost of the operators’ charging stations, subject to reaching a certain quality of service for their customers (EV owners).
Through the aforementioned literature review, it can be noticed that some problems have not been addressed by the existing investigations:
(1)
The previously cited references have not discussed the carbon impact of a PVCS, or the LCA is not included (estimation of the carbon emission from the manufacturing phase to the disposal of each element of the infrastructure).
(2)
In most works, the cost of building, allowing the creation and the coverage of parking places, is not included in the total cost, as well as the replacement cost of the charging terminals.
(3)
It is not moderate to estimate the global cost of the PVCS and its carbon impact separately.
(4)
Lack of approaches to reduce the CO2 emissions.
In this paper, a methodology for estimating the global cost and the carbon impact of a PVCS for EVs is detailed, with an improvement strategy in order to reduce the global carbon impact. The PVCS includes PV sources, charging terminals, stationary storage, and connection with the public grid. Therefore, this work brings the following improvements by providing:
(1)
A calculation methodology of the global cost of the PVCS, including the costs of investment, maintenance, exploitation, and externalities, to offer to the decision-maker a choice of infrastructure compatible with his spatial and budgetary constraints.
(2)
Concretely, a definition of a methodology for calculating the carbon impact of a PVCS by defining an equation, making it possible to calculate the carbon impact of each subsystem composing the PVCS, in order to assess their usefulness compared to the grid-powered charging station (PGCS), using the LCA method based on the ISO 14,067 standard. The carbon impact estimation offers to the decision-maker a choice of infrastructure compatible with his ecological constraint. In addition, it is committed to researching the most relevant carbon emission coefficient, making it possible to better assess the carbon impact of the components of each subsystem.
(3)
An identification of the levers of action, i.e., components that strongly influence the global carbon impact of PVCS, and on which it would be possible to act to reduce the carbon impact of such infrastructures. This reduction solution of the carbon impact is based on new data and recycled materials for the most emitting elements of CO2.
A numerical application of the proposed calculation methodology of the global cost and carbon impact for a case study of an installation of the PV parking shade, located in the Innovation Center of the Université de Technologie de Compiègne, has been discussed in the end of this paper, to validate the methodology and the proposed carbon impact reduction solutions. A comparison of the result with an EV charging station, similar but powered exclusively by the power grid, is proposed.
The rest of the paper is structured as follows: Section 2 describes the methodology for calculating the global cost of the PVCS, Section 3 shows the methodology for calculating the carbon impact of the PVCS, Section 4 depicts a numerical application and assessment of the global cost and the carbon impact of PVCS versus PGCS, and finally, Section 5 concludes this work and opens new perspectives.

2. Calculation Methodology of the PVCS Global Cost

In this section, the cost aspect of the PVCS is deepened. The purpose is to be able to provide the global cost of the PVCS, including the costs of investment C i , exploitation C exp , maintenance C m a i n t , and externalities E x t . This calculation methodology is detailed over a 30-year analysis period, as the average lifespan of a PV panel is 30 years. Then, the global cost C g is expressed in Equation (1):
C g = C i + C m a i n t + C exp E x t

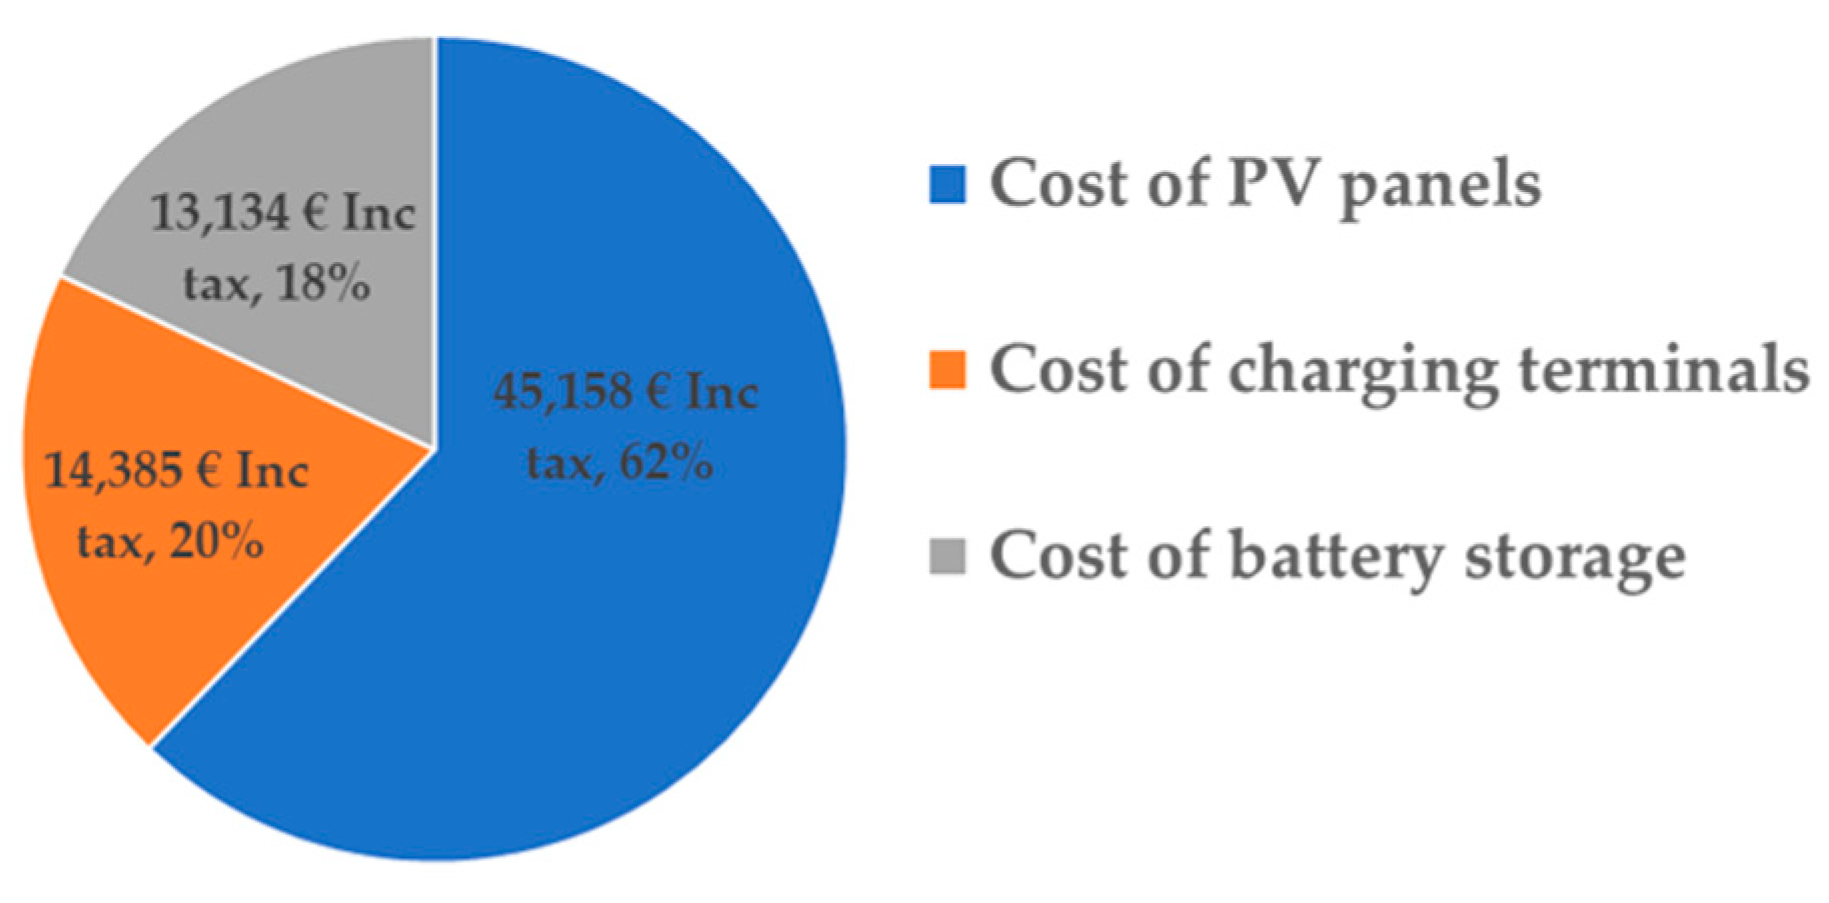
2.1. Investment Cost

The total investment cost C i for a PVCS is calculated as follows:
C i = C P V + C b a t + C t e r + C i n f r a
where C P V , C b a t , C t e r , and C i n f r a are the investment costs (€) of PV system, stationary battery, terminals, and infrastructure, respectively.
Thus, the total investment cost of the PVCS is obtained by adding the investment costs related to the entire energy chain and those of the infrastructure.

2.1.1. Energy Chain

The energy chain corresponds to all the components of the PVCS, allowing the production and distribution of electrical energy. These components are:
  • PV system (PV panels, inverter, connection wiring, installation, and construction costs);
  • Stationary storage and lithium-ion technology;
  • Charging terminals.
The investment cost of these different components is estimated following the values recovered from the technical sheets [21] and from the Batiprix costing French database [22] specific to building and public works.

PV System

The investment cost of the PV system C P V , i n v e s t includes the PV purchase cost C p u r c h a s e , P V and the cost of workforce C w f , P V . The workforce cost of the component corresponds to the expenses generated by its installation. This cost includes the PV panels, the inverter, and the connection wiring. C P V , i n v e s t is calculated as follows:
C P V , i n v e s t = ( C p u r c h a s e , P V + C w f , P V ) x y
where x is the cost coefficient and y is the sales price.
The purchase cost of the PV system is calculated as follows:
C p u r c h a s e , P V = N P V C p v , u n
where C p v , u n is the unit purchase cost for a PV system for one PV panel in €/unit and N P V is the number of PV panels of the PVCS.
Finally, the workforce cost of the PV system is calculated as follows:
C w f , P V = A P V C i m p , p v , u n
where C i m p , p v , u n is the unit cost of the implementation of the PV system in €/m2 and A P V is the area of the PV panels.

Stationary Storage

The investment cost of the stationary batteries’ storage C b a t , i n v e s t includes the batteries’ purchase cost C p u r c h a s e , b a t as well as the cost of workforce to install the batteries C w f , b a t . Thus, the investment cost of storage batteries is calculated as follows:
C b a t , i n v e s t = ( C p u r c h a s e , b a t + C w f , b a t ) x y
The costs C p u r c h a s e , b a t and C w f , b a t are expressed as follows:
{ C p u r c h a s e , b a t = C C b a t , u n C w f , b a t = N b a t C b a t , w f , u n
where C b a t , u n is the unit cost of the batteries in €/kWh excluding tax, C b a t , w f , u n is the unit cost of the installation of the battery in €/battery, C is the total capacity of the stationary batteries’ storage installed in the PVCS in kWh, and N b a t is the number of batteries.

Charging Terminals

The investment cost of the charging terminals C t e r , i n v e s t includes the cost of fast terminals C t e r , f a s t , i n v e s t and the cost of slow terminals C t e r , s l o w , i n v e s t . Thus, the investment cost of charging terminals is calculated as follows:
C t e r , i n v e s t = C t e r , f a s t , i n v e s t + C t e r , s l o w , i n v e s t
with:
{ C t e r , f a s t , i n v e s t = N t e r , f a s t C t e r , f a s t , u n C t e r , s l o w , i n v e s t = N t e r , s l o w C t e r , s l o w , u n
where C t e r , f a s t , u n and C t e r , s l o w , u n are the unit cost of the fast and slow charging terminal, respectively. N t e r , f a s t and N t e r , s l o w are the number of fast and slow charging terminals, respectively.

Infrastructure

The infrastructure corresponds to all the components of the PVCS, allowing the parking of vehicles as well as the installation of the energy chain. These components are:
  • The reinforced concrete (RC);
  • Steel, in the case of a shade PV installation typology.
RC allows the creation of parking places, and the steel is the material of the shade covering the parking places. Thus, the investment cost of the infrastructure C i n f r a , i n v e s t is calculated as a function of the cost of the RC C i n f r a , r c and the cost of the steel C i n f r a , s t e e l , as follows:
C i n f r a , i n v e s t = C i n f r a , r c + C i n f r a , s t e e l
The cost of steel C i n f r a , s t e e l is calculated according to the total mass of steel M t o t and the unit cost of steel C s t e e l , u n in €/kg as follows:
C i n f r a , s t e e l = M t o t C s t e e l , u n = ( N P P M s t e e l ) C s t e e l , u n
where M s t e e l is the mass of steel unit to make a parking place in kg/place, and N P P is the number of parking spaces.
The cost of the RC C i n f r a , r c is calculated as a function of the unit cost of RC C r c , u n in €/m3 and the total volume of RC V t o t as follows:
C i n f r a , r c = V t o t C r c , u n = ( N P P V B A ) C r c , u n
where V B A is the volume of the RC for the parking space in m3.
As observed previously, the ISO 15686 standard adds, to these investment costs, maintenance costs.

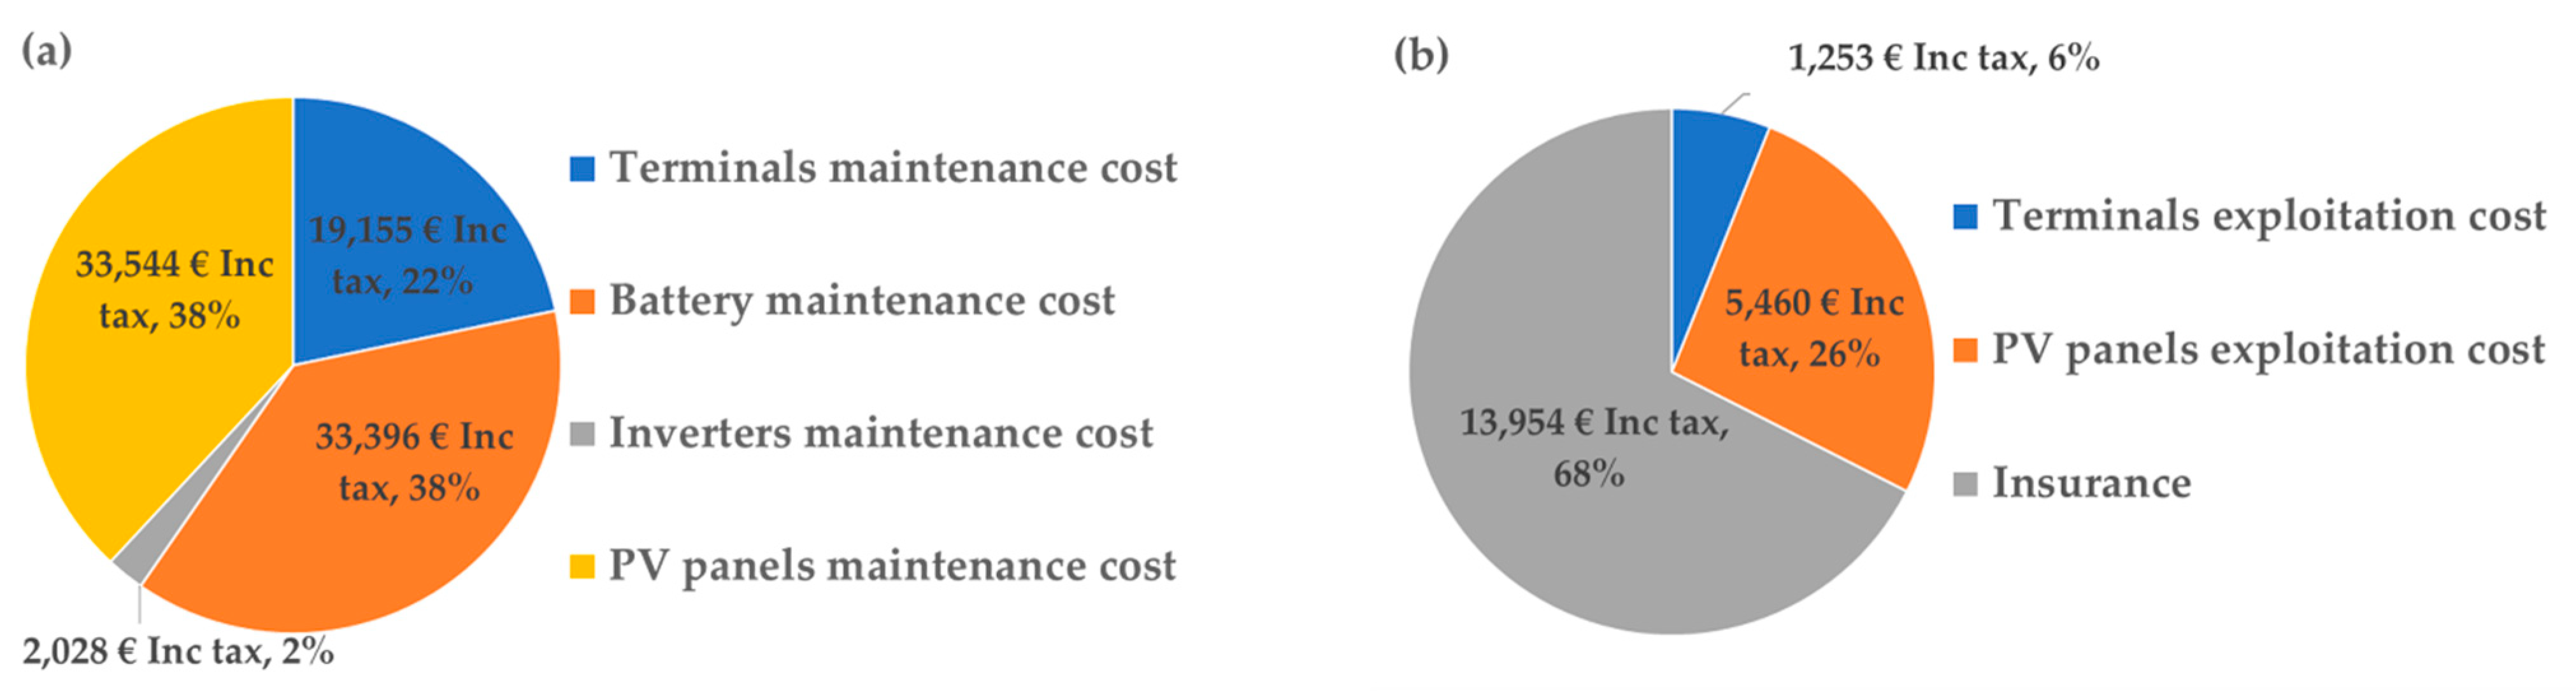
2.2. Maintenance Costs

Maintenance costs are the total costs of the workforce and material necessarily incurred and other associated costs incurred to maintain an infrastructure or its parts in a condition enabling it to perform its required functions.
For a PVCS, there are two maintenance costs:
  • Replacement cost: end-of-life components of the PVCS must be renewed;
  • Maintenance cost: cleaning and verification must be carried out on the components of the PVCS at a certain frequency.

2.2.1. Replacement Cost

The replacement cost corresponds to the expenses incurred for the renewal of components reaching the end of their life. Since the analysis period is 30 years, the aging of the concrete and steel infrastructure, or of the building on which the system is deposited, is not considered. The components to be replaced concern the PVCS energy chain, such as charging terminals, stationary batteries, and inverters. These elements must be replaced because their lifespan is shorter than the analysis period (30 years). At the end of this period, a new investment must be made by the owner of the PVCS.
The cost quantified below corresponds to the redemption prices of the various components and includes the purchase and the installation of the material, excluding taxes.

PV Panels

A lifespan of 30 years is considered for the PV panels. This lifespan is thus estimated because the manufacturer’s warranty states that the efficiency of the panels will be greater than 80% of the initial efficiency after 25 years. The assumption was therefore made that the panels are generally still usable 5 years after the end of this warranty. Since the overall cost analysis period is 30 years, there will be no replacement cost for the PV panels.

Inverter

It is considered that one inverter is installed on the PVCS. An inverter has an average lifespan of 15 years [23]. As the analyzed period is 30 years, a replacement will be necessary for this component. The replacement number of the inverter r i n v can be calculated using Equation (13) according to the analysis period in years (q = 30 years) and the lifespan of the inverter q i n v :
r i n v = q q i n v 1
Then, to obtain the replacement cost of the inverter C r e p l , i n v , the following equation will be used:
C r e p l , i n v = C r e p l , i n v , u n P p r i n v
where C r e p l , i n v , u n is the unit replacement cost of the inverter in €/kWp and P p is the total installed power in kWp.
C r e p l , i n v , u n includes the purchase of materials and the manpower of the installation of the inverter.

Stationary Storage

The replacement cost of the stationary storage installed on the PVCS is estimated in this section. With a lifespan q b a t of 10 years and during 30 years as the analysis period, two replacements will be necessary for the stationary batteries. The number of replacements r b a t of the batteries can be expressed using the equation below:
r b a t = q q b a t 1
To obtain the replacement cost of the battery, the following equation will be used:
C r e p l , b a t = C r e p l , b a t , u n C r b a t
where C r e p l , b a t , u n is the unit replacement cost of the lithium-ion battery in €/kWh, including the purchase of materials and the manpower of the installation.

Charging Terminals

In this section, the method used to calculate the cost of replacing the charging terminals installed on the PVCS is detailed. As a reminder, two types of charging terminals are considered: the fast terminals placed on the ground and delivering a maximum power of 22 kW, and the slow terminals, which are suspended on a wall or pole and deliver a maximum power of 2.3 kW.
Since there is no information about the lifespan of the charging terminals (this technology is very recent), a change every 10 years is considered for both types of charging terminals.
As the analysis period is 30 years, two replacements will be necessary for these components. This value can be calculated using Equation (17), where the lifespan of the charging terminal q t e r is 10 years:
r t e r = q q t e r 1
Then, to obtain the replacement cost of the charging terminals of 2.3 kW and 22 kW, the following equations will be used:
{ C r e p l , t e r , s l o w = C t e r , s l o w , u n N t e r , s l o w r t e r C r e p l , t e r , f a s t = C t e r , f a s t , u n N t e r , f a s t r t e r
where C r e p l , t e r , s l o w and C r e p l , t e r , f a s t are the replacement costs of slow and fast charging terminals, respectively (€), including the purchase of materials and the manpower of the installation; C t e r , s l o w , u n and C t e r , f a s t , u n are the unit cost of the slow and fast charging terminal, respectively (€); and N t e r , s l o w and N t e r , f a s t are the number of slow and fast charging terminals, respectively.
From the previous calculations, it is possible to obtain the total replacement cost C r e p l of the structural components during the analysis period, as shown in the following equation:
C r e p l = C r e p l , i n v + C r e p l , b a t + C r e p l , t e r , s l o w + C r e p l , t e r , f a s t
In addition to the replacement cost, there are maintenance costs.

2.2.2. Maintenance Cost

The maintenance cost is the expense of services, such as cleaning and checking PVCS components.

PV System Maintenance

The PV system consists of the PV panels as well as the inverter. The maintenance services are diverse, varied, and consist mainly of the visual inspection of PV panels, checking and dusting of inverters, inspection of DC boxes and cables, cleaning of panels or recording of production data. According to [24], for large power installations, the maintenance cost of the PV system is estimated between 3 and 5 €/kWp. For medium PV power installations, between 36 and 500 kWp, it is estimated between 5 and 8 €/kWp. For small power installations (<36 kWp), the PV system maintenance cost is estimated between 250 and 500 €/year.

Maintenance of Charging Terminals

The total maintenance cost of terminals is defined by the following equation:
C m a i n t , t e r = C m a i n t , t e r , s l o w + C m a i n t , t e r , f a s t
Finally, the maintenance cost formula, during the analysis period q, is therefore obtained:
C m a i n t = ( C m a i n t , t e r + C m a i n t , p v , i n v ) q
In addition to these maintenance costs, there are exploitation costs.

2.3. Exploitation Costs

Exploitation costs include bills for consumed energy to operate an infrastructure as well as money spent on insurance. The cost of the consumed energy is considered zero in the case of a PVCS because this energy comes from the PV panels. However, it is recommended to have insurance that covers civil liability and damage caused by this type of infrastructure. These types of insurance costs, per year, are between 0.5 and 0.8% of the cost of the implementation work of the PVCS [25]. By taking the maximum estimation, the following equation is obtained:
C a s s = 0.0065 C i m p q
where C a s s is the cost of insurance in €, C i m p is the cost of the implementation work of a PVCS in €, q is the lifespan of PV panels in years, and the 0.0065 factor is calculated by the average between 0.5% and 0.8%.
The following section presents a method of calculating externalities, completing the approach of the global cost.

2.4. Externalities

According to ISO 15686-5, externalities are the quantifiable costs or benefits that arise when actions taken by organizations or individuals affect stakeholders other than themselves. Regarding PVCS, the externalities are the benefits provided by selling electricity and green certificates.

2.4.1. Gain by Selling Electricity

A PVCS produces electricity that will then be sold. It can be partly resold directly during its production, if the PV panels produce at the same time a user charges its vehicle. Electricity from PV panels may be also sold indirectly, when stationary storage ensure the charge of a vehicle. Finally, in the case of surplus production, the energy produced by the PV panels can be sold when it is injected into the power grid. In this study, the selling price of electricity for PV panels is the same whether it is sold for the EV charge or for the power grid injection. The gain of the electricity sale over a 30-year lifespan is defined as follows:
G r = T E a q
where T is the electricity purchase price in €/kWh, E a is the energy produced annually, and q is the lifespan of PV panels in years.

2.4.2. Gain by Sale of Green Certificates

Green certificates play a premium role in the production of green electricity. A PV power producer, here the holder of a PVCS, can sell these green certificates. The following equation indicates the quantity of the generated externality:
G c v = E a 10 3 C k e c o C v q
where G c v is the gain from the sale of green certificates in €, C k e c o is the keco coefficient, C v is the selling price of the green certificate, and q is the lifespan of the PV panels in years.

3. Calculation Methodology of the PVCS Carbon Impact

It seems important, before launching into the massive use of PVCS-type infrastructures, to evaluate their global carbon impact to assess their utility relative to an EV charging station supplied only by the power grid. A methodology to quantify this impact was therefore detailed using the LCA method based on the ISO 14067 standard [25,26].

3.1. GHG Assessment Methodology

In order to assess the carbon impact of the PVCS, a method for calculating the GHG emission has been implemented. Based on the Bilan Carbone Association and a Massive Open Online Course (MOOC) organized by Avenir Climatique [27], a calculation method for assessing the carbon impact of PVCS has been established. These databases are used to collect the carbon emission coefficients associated with each emission element of the initially considered PVCS.
The first step of this method is to define a study perimeter that sets the carbon emission limits that will be considered. Once this perimeter has been defined, the second step is to fill a data collection matrix, which contains the carbon emission coefficients associated with each emission element. These carbon emission coefficients are based on several references, including the “Ecoinvent” database [5], the study of national renewable energy laboratory in the LCA harmonization project [28], and the study presented in [29], in order to reduce the total carbon impact of the PVCS. The quantification of these carbon emission coefficients is studied in the carbon impact of a product defined in ISO 14067, and studied as part of this project.
Based on these carbon emission coefficients, it is then possible to assess the carbon impacts of the different sub-systems that made up the PVCS, such as, the PV system, the stationary storage, the charging terminals, the infrastructure related to the structure of the PVCS, and finally the electricity from the power grid, supplied in addition to that produced by the PV system. The sum of these carbon impacts constitutes the global carbon impact of the PVCS, based on the LCA approach over 30 years.

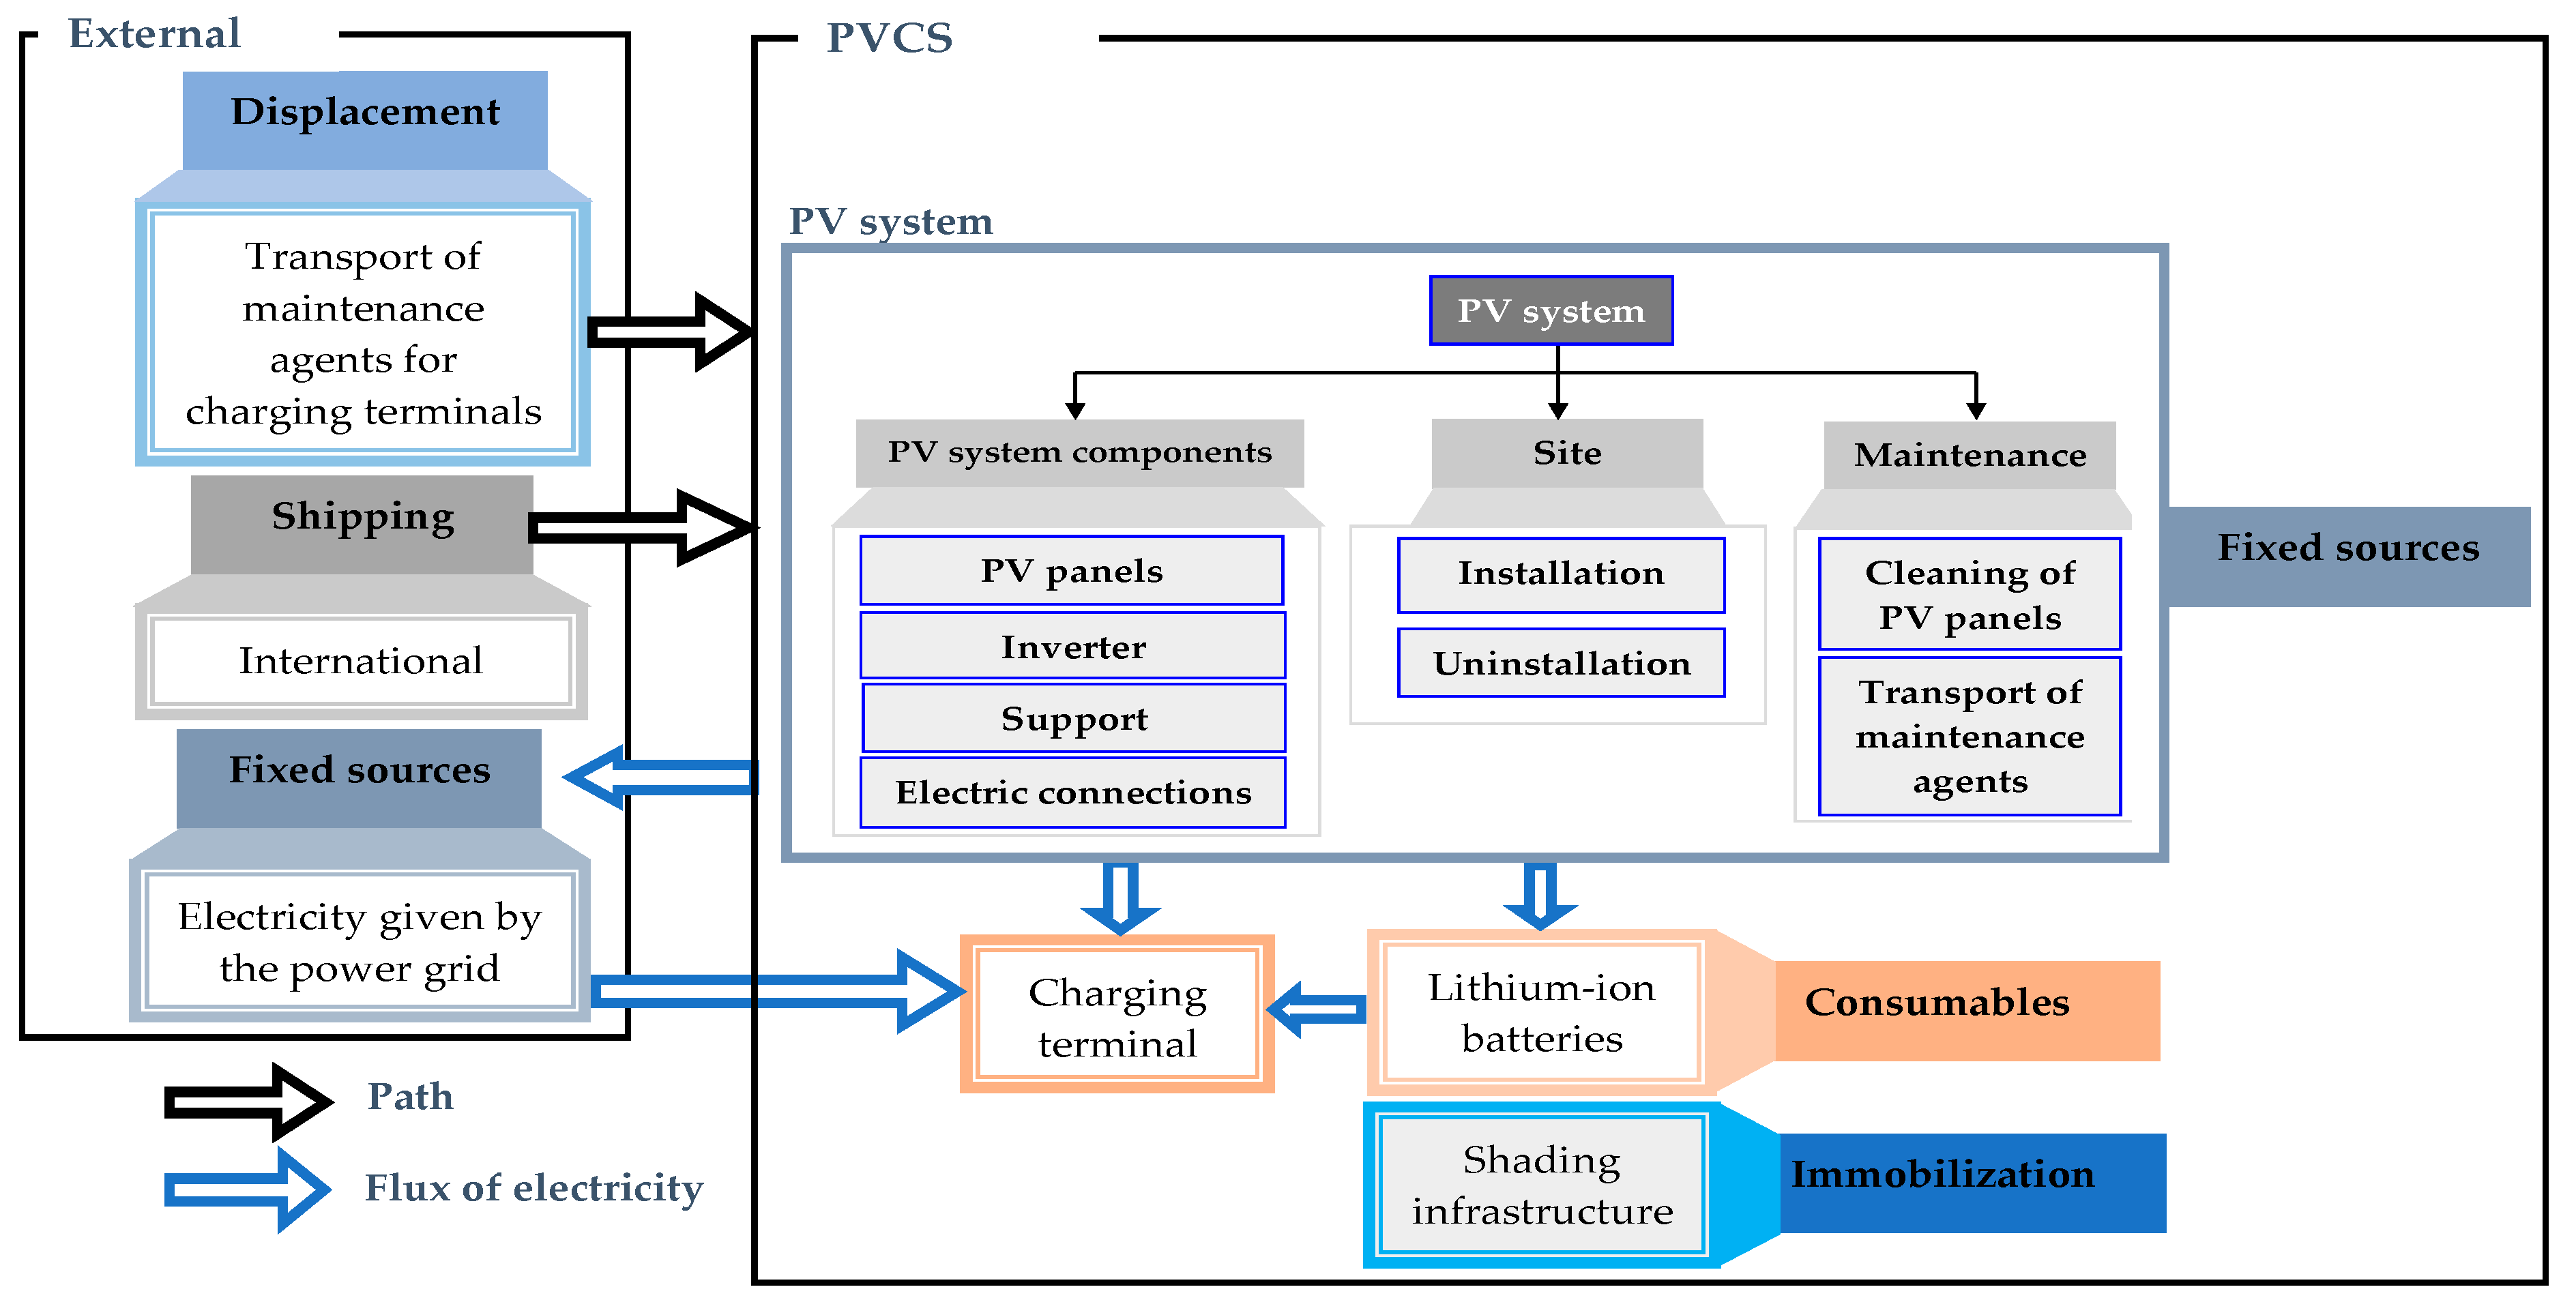
3.2. Presentation of the Study Perimeter

To carry out the GHG balance, it is first necessary to define the global perimeter of the study, in order to set a limit for the emissions to be considered. In accordance with ISO 14067, the definition of the boundaries of the system shall include all carbon emissions that may contribute significantly to the PVCS carbon impact.
Next, the global overview of the study methodology is defined by all of the GHG-emitting steps involved in the manufacturing, transportation, maintenance, and even recycling of the various components required for PVCS to function properly. Thus, the chosen global overview is shown in the diagram depicted in Figure 1.
Therefore, this perimeter considers the manufacturing and the end-of-life treatment of the components that made up the PV infrastructure, such as the charging terminals and the batteries. For the shaded-type PVCS, the materials needed to construct the immobilization related to the infrastructure are also considered. The carbon impact of work related to the installation, maintenance, and repair of the PV system and charging terminals is also considered. Finally, the carbon impact of electricity provided by the power grid is also included in the study perimeter.

3.2.1. Carbon Impact of the PV System

To calculate the carbon impacts of the PV system components, a methodology using the LCA method is detailed. As depicted in Figure 1, the total carbon impact of the PV system includes the carbon impact of the manufacturing of the PV system components, the installation and uninstallation of the PV system, and the use and maintenance.
In this study, the environmental assessment is applied according to the PV system category. The product category is the group of products with equivalent functionality. These are PV systems connected to a public low voltage, medium voltage, or high voltage power grid. These categories differ according to the maximum power of the PV system, the voltage range, and the installation of the system. They vary between product category 1 and product category 3b.
The type of PV panels selected for the global overview of this study is the monocrystalline silicon panel, the most prevalent technology in France. The carbon emissions coefficient of the PV system C O 2 , P V , s y s t (kgCO2,eq/kWh) is calculated using the following general equation:
C O 2 , P V , s y s t = I m p P V , s y s t E P V , s y s t
where E P V , s y s t is the energy produced by PV installation (kWh) during the analysis period.
The carbon impact of the PV system I m p P V , s y s t is the sum of the carbon impacts of the PV system components I m p P V , i n f r a , construction site I m p s i t e , and maintenance I m p m a i n t in kgCO2,eq, as shown in Equation (26):
I m p P V = I m p P V , i n f r a + I m p s i t e + I m p m a i n t
Each of these three carbon impacts is calculated in the same way. The equations evaluating these carbon impacts are shown below.
The I m p P V , i n f r a is calculated as follows:
I m p P V , i n f r a = I m p P V   p a n e l s + I m p i n v e r t e r + I m p s u p p o r t + I m p e l e c c n x = C O 2 , P V   p a n e l s P p + ( C O 2 , i n v e r t e r , a P i n v e r t e r + C O 2 , i n v e r t e r , b ) + C O 2 , s u p p o r t A P V + C O 2 , e l e c c n x P p
where I m p P V   p a n e l s , I m p i n v e r t e r , I m p s u p p o r t , and I m p e l e c c n x are the carbon impacts of the PV panels, the inverter, the support, and the electric connections, respectively (kgCO2,eq), C O 2 , P V   p a n e l s is the carbon emission coefficient of PV panels (kgCO2,eq/kWp), C O 2 , i n v e r t e r , a is the carbon emission coefficients of inverter a (kgCO2,eq/kVA), C O 2 , i n v e r t e r , b is the cabon emission coefficients of inverter b (kgCO2,eq), C O 2 , s u p p o r t is the carbon emission coefficient of the support (kgCO2,eq/m2), C O 2 , e l e c c n x is the carbon emission coefficient of the electric connections (kgCO2,eq/kWp), P p is the peak power of the PV installation in kWp, P i n v e r t e r is the power of inverters in kVA, and A P V is the area of PV panels in m2.
The assessment of the carbon impact of the site (installation and uninstallation) of the PV system is provided by Equation (28):
I m p s i t e = I m p i n s t a l l a t i o n + I m p u n i n s t a l l a t i o n = C O 2 , i n s t a l l a t i o n P p + C O 2 , u n i n s t a l l a t i o n P p
where I m p i n s t a l l a t i o n and I m p u n i n s t a l l a t i o n are the carbon impacts of installation and uninstallation of the PV system in kgCO2,eq, respectively, C O 2 , i n s t a l l a t i o n and C O 2 , u n i n s t a l l a t i o n are the carbon emission coefficients of installation and uninstallation of the PV system kgCO2,eq/kWp.
The maintenance carbon impact of the PV system is calculated according to the following equation:
I m p m a i n t = I m p c l e a n i n g + I m p a g t t r a n s p o r t = C O 2 , c l e a n i n g A P V + C O 2 , a g t t r a n s p o r t d q
where I m p c l e a n i n g and I m p a g t t r a n s p o r t are the carbon impacts of PV cleaning and transporting maintenance agents to the PV system in kgCO2,eq, respectively, C O 2 , c l e a n i n g is the carbon emission coefficient for cleaning PV panels in kgCO2,eq/m2, C O 2 , a g t t r a n s p o r t is the carbon emission coefficient of transporting maintenance agents to the PV system in kgCO2,eq/km, A P V is the area of PV panels in m2, d is the annual distance traveled by maintenance agents in km/year, and q is the lifespan of PV panels in years.

3.2.2. Carbon Impact of Stationary Lithium-Ion Batteries Storage

To obtain the carbon emission coefficient for Li-Ion batteries C O 2 , Li-battery (kgCO2,eq/kWh), it only remains to sum the manufacturing carbon emission coefficient C O 2 , Li-bat , m a n u f a c t with the recycling one C O 2 , Li-bat , r e c y c l . There are two recycling approaches, by hydrometallurgy and by pyrometallurgy. Therefore, this carbon emission coefficient was defined in the following equation:
C O 2 , Li-battery = C O 2 , Li-bat , m a n u f a c t + C O 2 , Li-bat , r e c y c l
Since the carbon assessment is carried out over a period of 30 years and the life of the stationary batteries is equal to 10 years, it will be necessary to multiply this carbon emission coefficient by three to obtain the carbon impact of stationary batteries over 30 years. In fact, there will be three battery generations over the analysis period, the initial generation, and two replacement generations.
Thus, the carbon impact I m p L i b a t t e r y of the stationary batteries installed in the PVCS is defined in Equation (31):
I m p L i b a t t e r y = C O 2 , L i b a t t e r y C ( r b a t + 1 )
where r b a t is the number of replacements of the batteries.

3.2.3. Carbon Impact of Charging Terminals

The carbon impact of charging terminals depends on their installation type:grounded or suspended.

Carbon Impact of Suspended Charging Terminal

For the suspended charging terminals, the carbon impact will be based on the model of the EVLink Wallbox Plus [30]. The environmental profile of this product, provided by its manufacturer Schneider Electric, presents the LCA realized on the following lifecycle phases: Materials and Manufacturing (M), Distribution (D), Installation (I), Usage (U), and End of life (E). Therefore, the carbon emission coefficient associated with the suspended charging terminal C O 2 , S u s p e n d e d C T is obtained by the equation below:
C O 2 , S u s p e n d e d C T = C O 2 , S u s p e n d e d C T , M + C O 2 , S u s p e n d e d C T , D + C O 2 , S u s p e n d e d C T , I + C O 2 , S u s p e n d e d C T , E
where C O 2 , S u s p e n d e d C T , M , C O 2 , S u s p e n d e d C T , D , C O 2 , S u s p e n d e d C T , I , and C O 2 , S u s p e n d e d C T , E are the carbon emission coefficients of Manufacturing (M), Distribution (D), Installation (I), and End of life (E), respectively (kgCO2,eq/unit).
In addition, the carbon impact of the maintenance I m p S u s p e n d e d C T , m a i n t of these charging terminals must be taken into account, which can be calculated as indicated in Equation (33), according to the carbon emission coefficient for transporting maintenance agents to the terminals in kgCO2,eq/km C O 2 , S u s p e n d e d C T , m a i n t , the annual average distance traveled by maintenance agents in km/year d , and the considered analysis period, q .
I m p S u s p e n d e d C T , m a i n t = C O 2 , S u s p e n d e d C T , m a i n t d q
Thus, the carbon impact I m p S u s p e n d e d C T of the suspended charging terminals of the PVCS is obtained based on Equation (34):
I m p S u s p e n d e d C T = C O 2 , S u s p e n d e d C T N S u s p e n d e d C T ( r t e r + 1 ) + I m p S u s p e n d e d C T , m a i n t
where N S u s p e n d e d C T is the number of suspended charging terminals, and r t e r is the number of replacements of the terminals.

Carbon Impact of Grounded Charging Terminal

Next comes the estimation of the carbon impact of the grounded charging terminals. The carbon coefficient will be detailed according to the EVLink City model [31]. Unlike the suspended charging terminal, the environmental profile of this grounded charging terminal is not provided by its manufacturer. It is assumed, therefore, that the composition of the latter is proportionally identical to that of the suspended charging terminal. The mass of the terminals and the emission coefficient of a suspended charging terminal make it possible to estimate the emission coefficient of the grounded charging terminal C O 2 , G r o u n d e d C T (kgCO2,eq/charging terminal) as follows:
C O 2 , G r o u n d e d C T = C O 2 , S u s p e n d e d C T . m G r o u n d e d C T m S u s p e n d e d C T
where m G r o u n d e d C T and m S u s p e n d e d C T are the mass of the grounded and suspended terminals, respectively (kg).
In addition, to calculate the carbon impact of the grounded charging terminal, the carbon impact of the civil engineering I m p C i v i l e n g i must also be considered, as given in Equation (36). This carbon impact will only be considered for the first generation of grounded terminals. The civil engineering necessary to install of the grounded terminals is considered as reusable during terminal replacements.
I m p C i v i l e n g i = V R C C O 2 , R C ρ C N G r o u n d e d C T
where V R C is the volume of RC required for the foundation of the grounded charging terminals in m3, ρ C is the density of concrete in kg/m3, C O 2 , R C is the RC carbon emission coefficient in kgCO2,eq/ton, and N G r o u n d e d CT is the number of suspended charging terminals.
For maintenance, the same equation is intended as for the suspended terminal.
Finally, the carbon impact I m p G r o u n d e d C T (kgCO2,eq) of the grounded charging terminals in the PVCS is defined by the following equation:
I m p G r o u n d e d C T = C O 2 , G r o u n d e d C T N G r o u n d e d C T ( r t e r + 1 ) + I m p m a i n t + I m p C i v i l e n g i
r t e r is the number of replacements of the terminals.

3.2.4. Carbon Impact of the PVCS Infrastructure

The carbon impact of the PVCS infrastructure is presented by the carbon impact of the car parking shades.
In order to obtain the desired quantities of materials used for construction of the car parking shades, the volume V R C of necessary RC for these foundations in m3 is required. This volume is expressed in the equation below:
V R C = L f o u n d a t i o n W f o u n d a t i o n H f o u n d a t i o n N p o l e s
where N p o l e s is the number of poles, and L f o u n d a t i o n , W f o u n d a t i o n , and H f o u n d a t i o n are the length, width, and the height of the RC foundation in m.
The carbon impact I m p R C , f o u n d a i o n of the RC for the foundations of Npc car parking shades is calculated according to the following equation:
I m p R C , f o u n d a t i o n = C O 2 , R C ρ c V R C N p c
where C O 2 , R C is the carbon emission coefficient of RC in kgCO2,eq/m3.
The calculation of the carbon impact I m p S t e e l of steel in the metal structure of a shade unit is expressed by Equation (40):
I m p S t e e l = m S t e e l C O 2 , S t e e l
where m S t e e l is the mass of steel of a shade unit in tons and C O 2 , S t e e l is the steel carbon emission coefficient in kgCO2,eq/ton.
Thus, the carbon impact I m p N p c _ s h a d e s (kgCO2,eq) for a shade with Npc parking places is calculated by (41) as a function of the carbon impact of the RC used for the foundation of the shades units I m p R C , f o u n d a t i o n and the carbon impact of the steel contained in the shades units I m p S t e e l :
I m p N p c _ s h a d e s = I m p R C , f o u n d + I m p S t e e l
Finally, according to the obtained results, it is possible to calculate the carbon emissions coefficient for one parking place C O 2 , s h a d e and I m p i n f r a :
{ C O 2 , s h a d e = I m p N p c _ s h a d e s m I m p i n f r a = C O 2 , s h a d e N p p

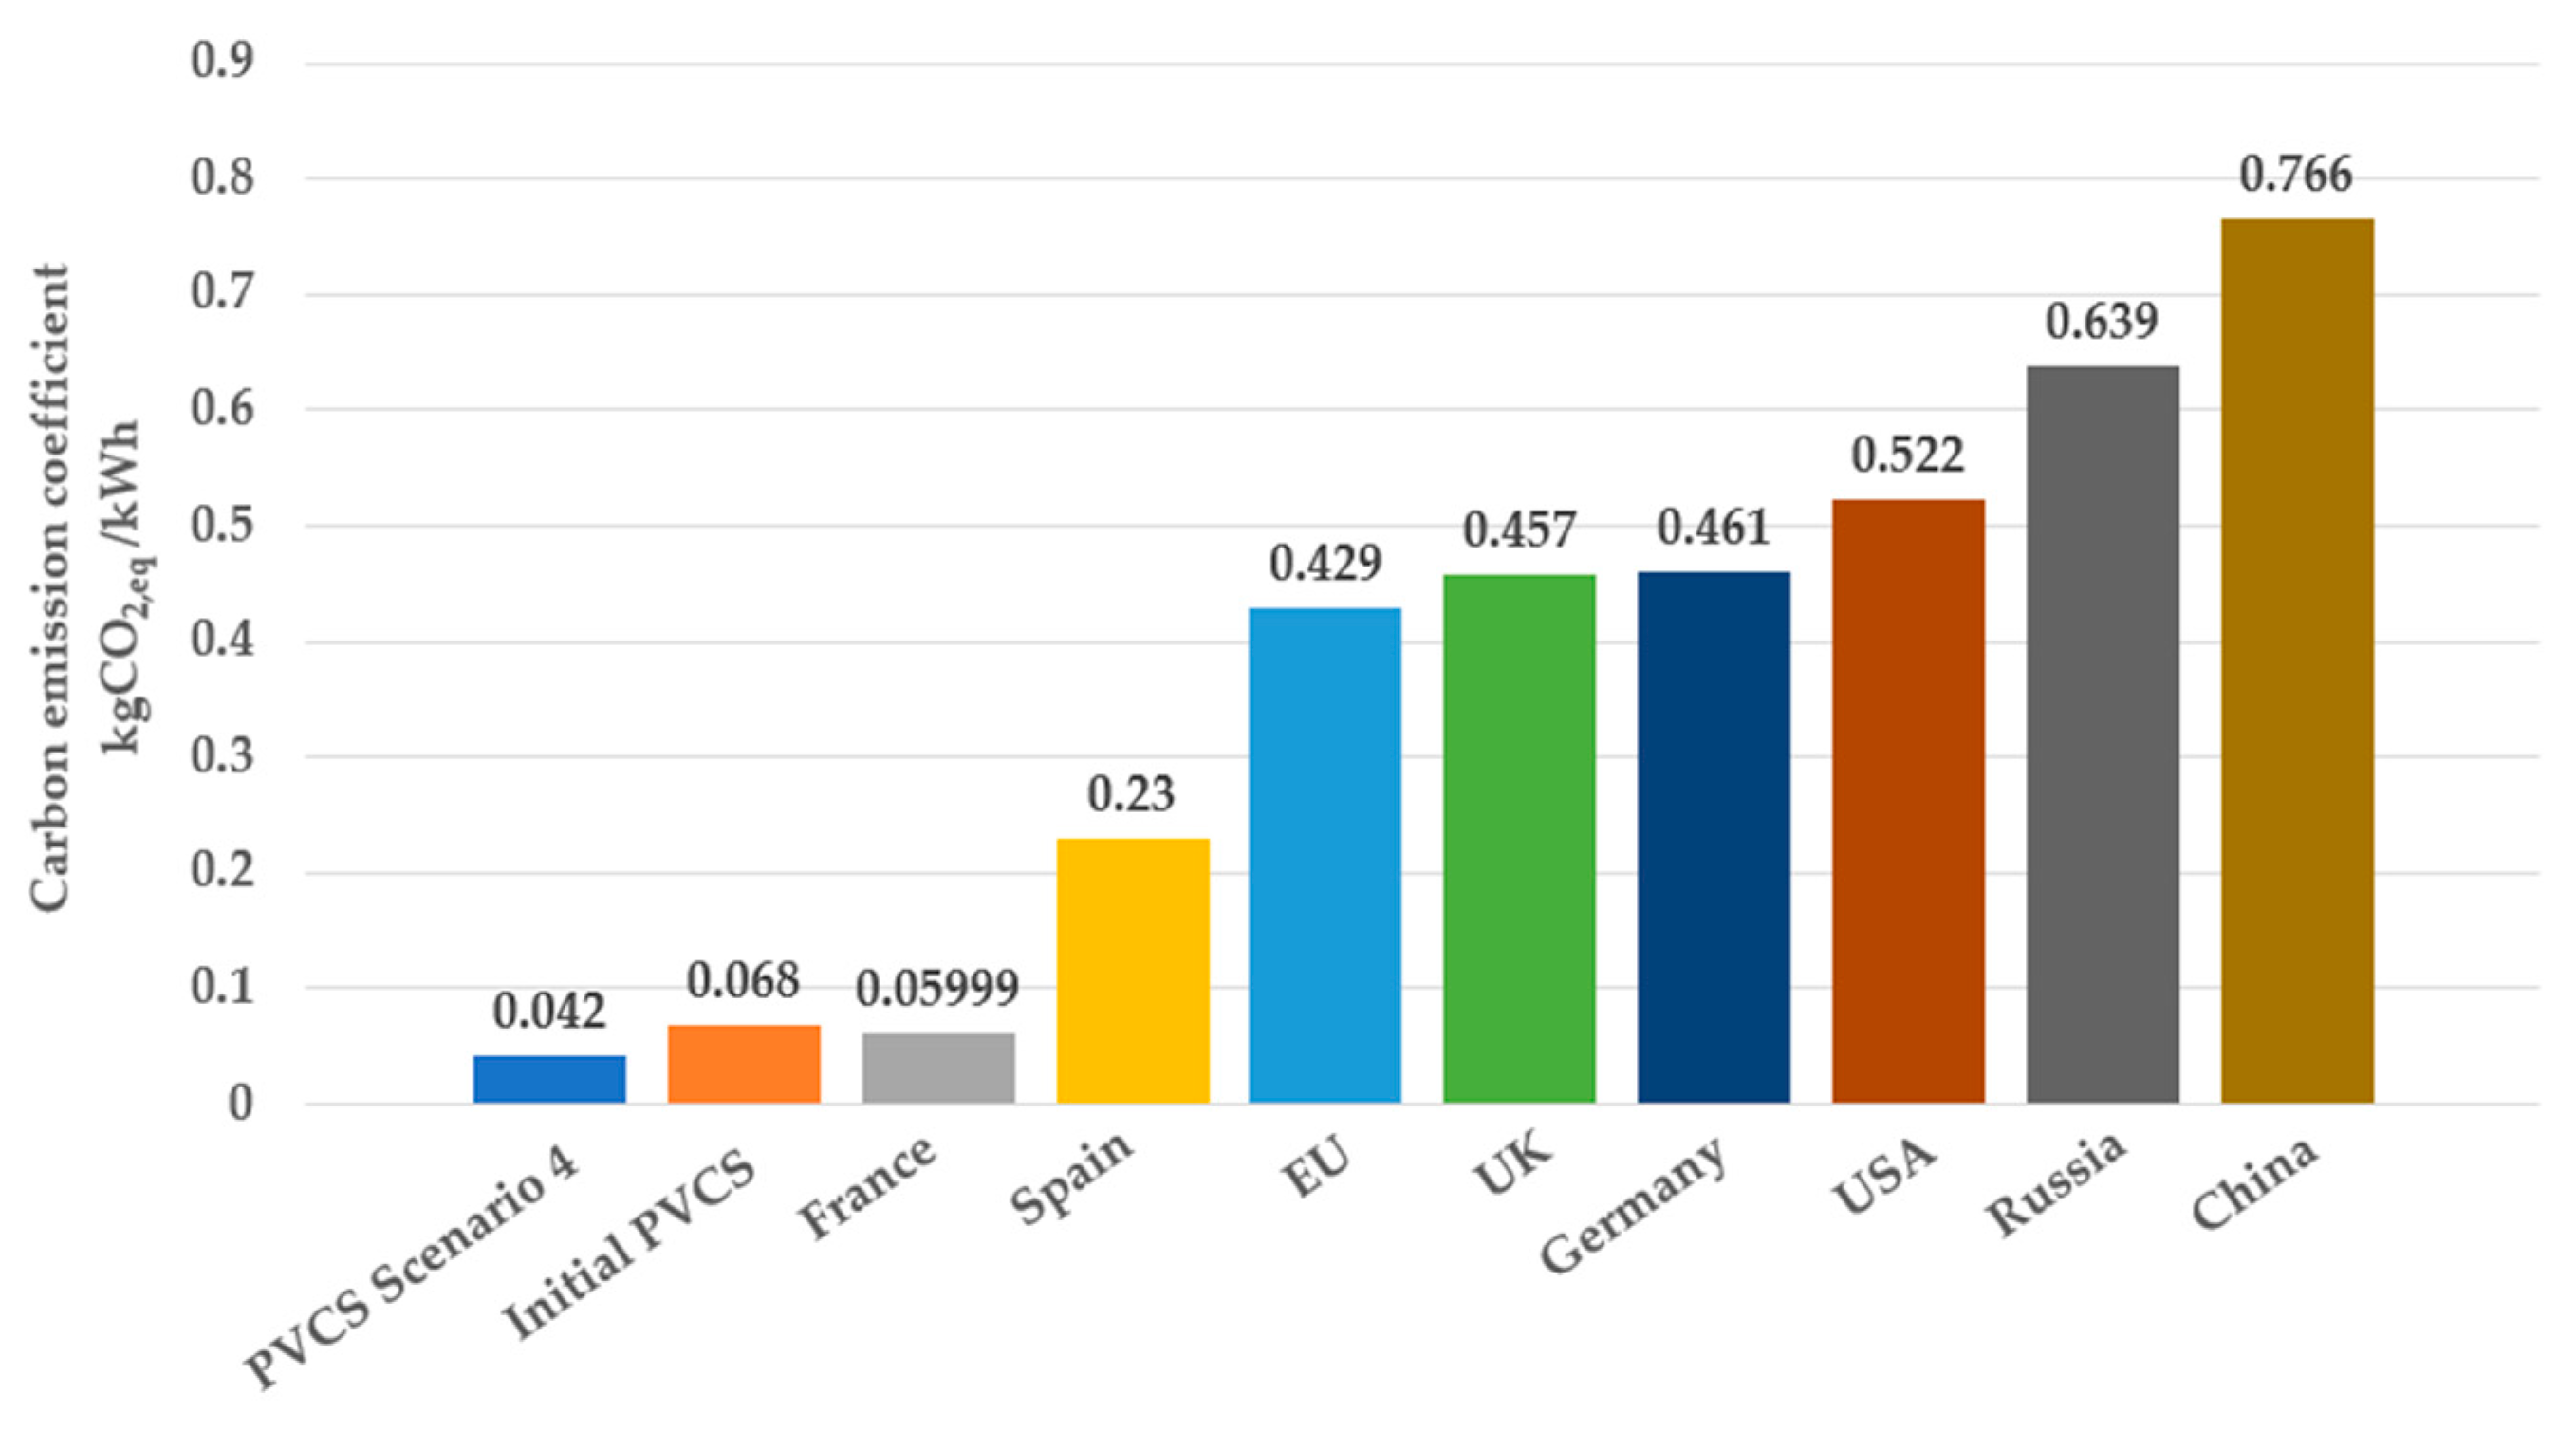
3.2.5. Carbon Impact of Electricity Provided by the Power Grid

The carbon emission coefficient of the power grid depends on the electricity production method. It represents the average emissions emitted during a year depending on the composition of the energy mix of primary energy. The entire electricity production process is considered. The main primary energies used are nuclear, hydraulic, coal, gas, etc. [32].
Each production mode has an associated carbon emission coefficient. The carbon emission coefficient of the power grid is calculated in proportion to the amount of electricity used for each type multiplied by its own emission coefficient. In France, the carbon emission coefficient C O 2 , P G of the French energy mix is 0.0599 kgCO2,eq/kWh. It should be noted that the carbon emission coefficient of the French power grid is particularly low, as most electricity is nuclear power with a carbon emission coefficient of only 0.006 kgCO2,eq/kWh. Therefore, the carbon impact I m p P G (kgCO2,eq) of the electrical energy provided by the power grid is expressed in the equation below:
I m p P G = E P G C O 2 , P G
where E P G is the energy provided by the power grid in kWh.
Now, it is possible to assess the global carbon impact of PVCS, given as the sum of the carbon impacts of the different sub-systems constituting them, as expressed in the following equation:
I m p P V C S = I m p P V + I m p L i b a t t e r y + I m p S u s p e n d e d C T + I m p G r o u n d e d C T + I m p i n f r a + I m p P G

4. Results and Analyses of the Numerical Application of Global Cost and Carbon Impact of the PVCS

The carbon impacts and costs of PVCS various components allow realizing environmental and financial reports over 30 years. Here is a calculation example and assessment of these reports for a PVCS, with the following characteristics: shade type PVCS covering five parking places for EVs, equipped with 22 kWh stationary battery storage capacity and recycled by pyrometallurgy, 28 kWp as peak power of 70 panels installed on a surface of 124 m2. The infrastructure is located in Compiègne, the north of France, with an average annual irradiation of 1309.11 kWh/m2. The installed inverter’s power is assumed to be 90% of the PV’s peak power. Based on the PVGIS website, the electricity produced and used by the PVCS during the 30 years is estimated at 1.257 GWh, where 307.476 MWh are provided by the public grid. The occupancy rate of the charging terminals is distributed bya time slot of 2 h, as follows:
  • Between 8:00 and 10:00: two EVs at 2.3 kW;
  • Between 10:00 and 12:00: one EV at 22 kW, four EVs at 2.3 kW;
  • Between 12:00 and 14:00: two EVs at 2.3 kW;
  • Between 14:00 and 16:00: one EV at 22 kW, four EVs at 2.3 kW;
  • Between 16:00 and 18:00: one EV at 22 kW, three EVs at 2.3 kW.

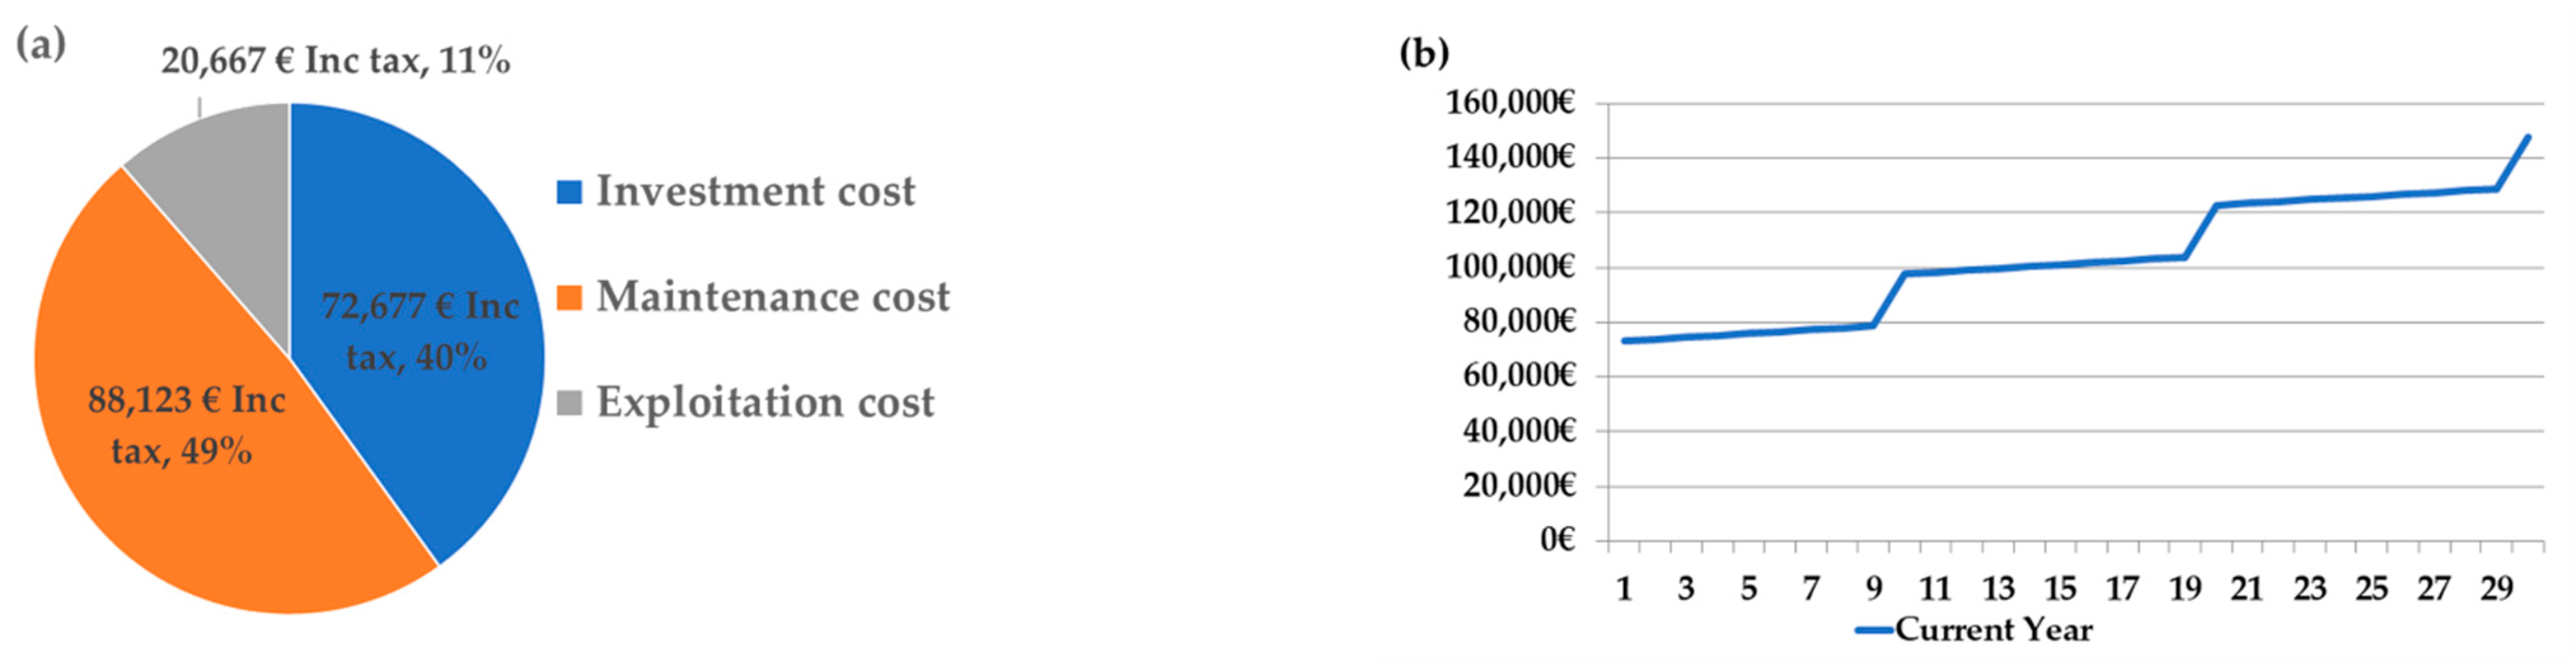
4.1. Results of the Numerical Application of the Global Cost of the PVCS

As depicted in Figure 2, the PVCS investment cost is calculated and displayed in the form of a pie chart. The total investment cost is calculated as a function of the capacity of the stationary storage, the number of PV panels, and the number of charging terminals.
As depicted in Figure 3a,b, the exploitation and maintenance costs are then calculated and displayed in the form of pie charts, respectively.
The vision from an economic point of view is then global; the stockholders are aware of the excepted cost magnitude orders over the next 30 years.
It should be noted that each cost, maintenance, or exploitation is multiplied by 30 to obtain a balance over 30 years, except the costs related to the investment of the PVCS.
Then, to address the economic part of the PVCS over 30 years, a two-sided approach has been adopted. The first, in the form of a pie chart, provides a direct overview of the various costs (investment, maintenance, and exploitation) and their distribution (Figure 4a). The second, in the form of a curve over time, provides an annual view of the cost to be invested (Figure 4b). The maintenance cost presents the most important part in the global cost.

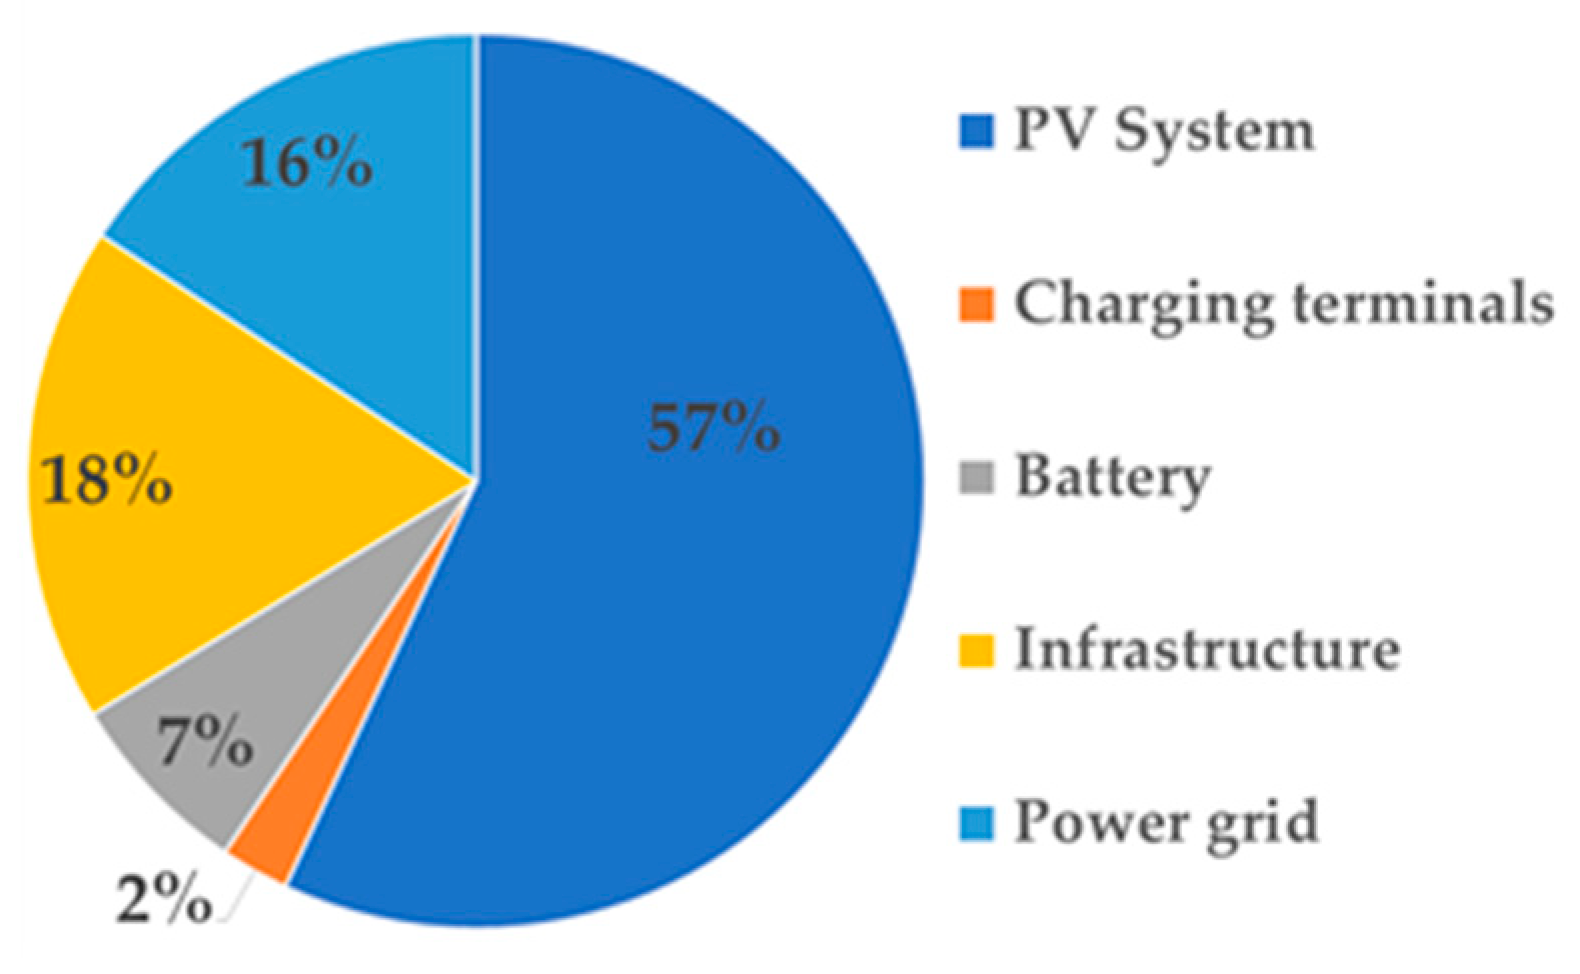
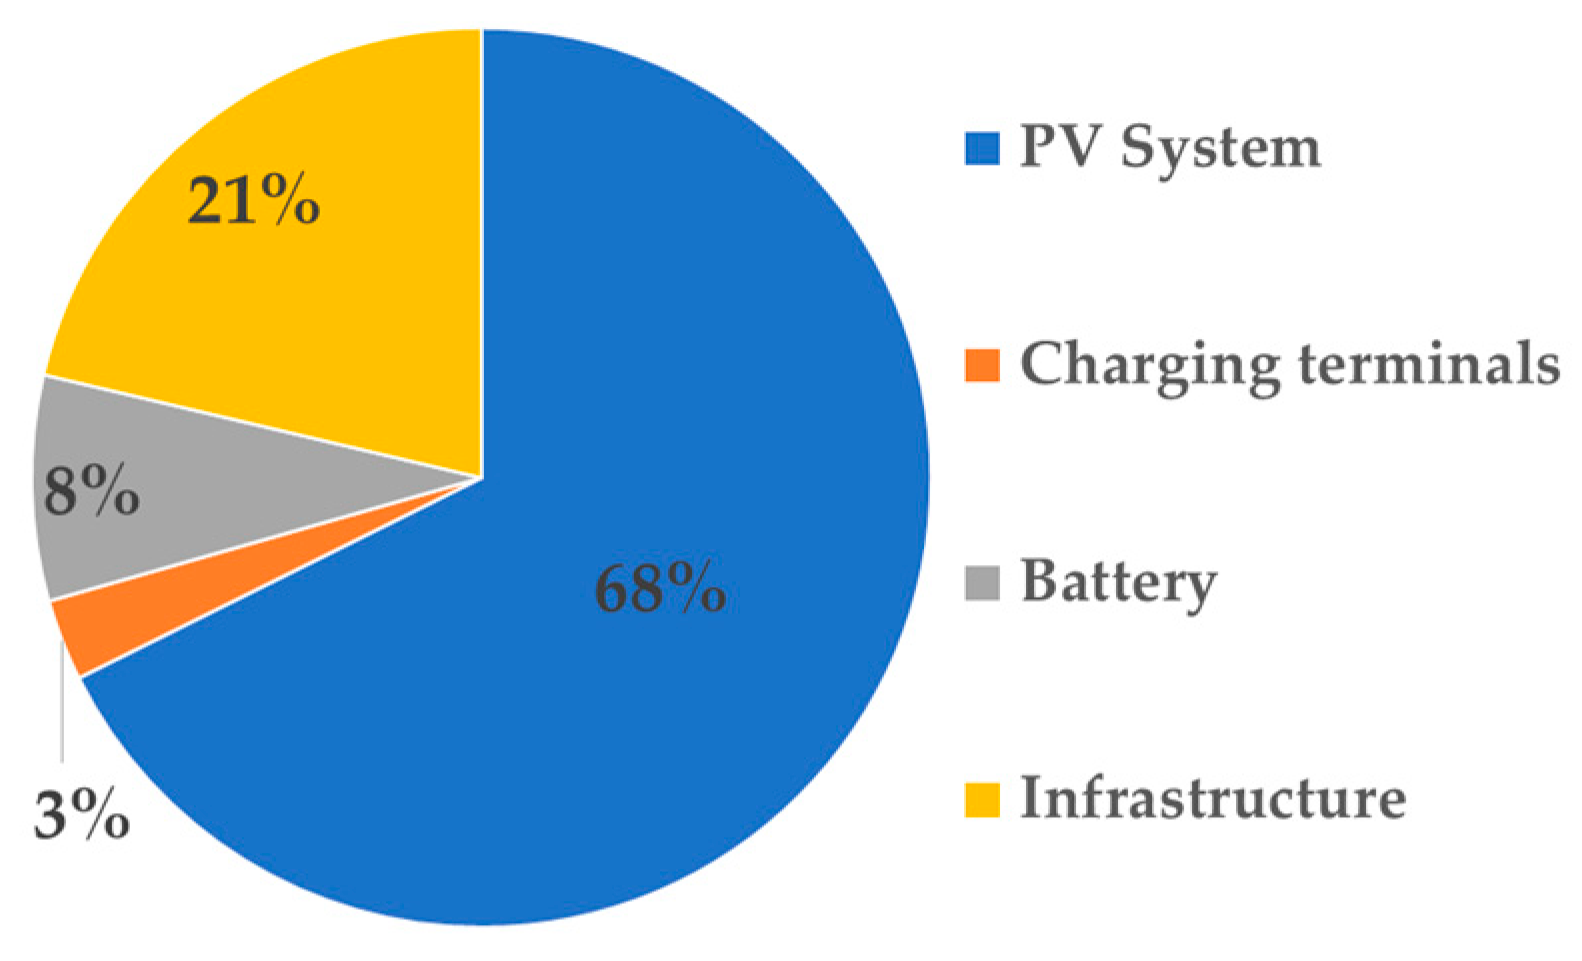
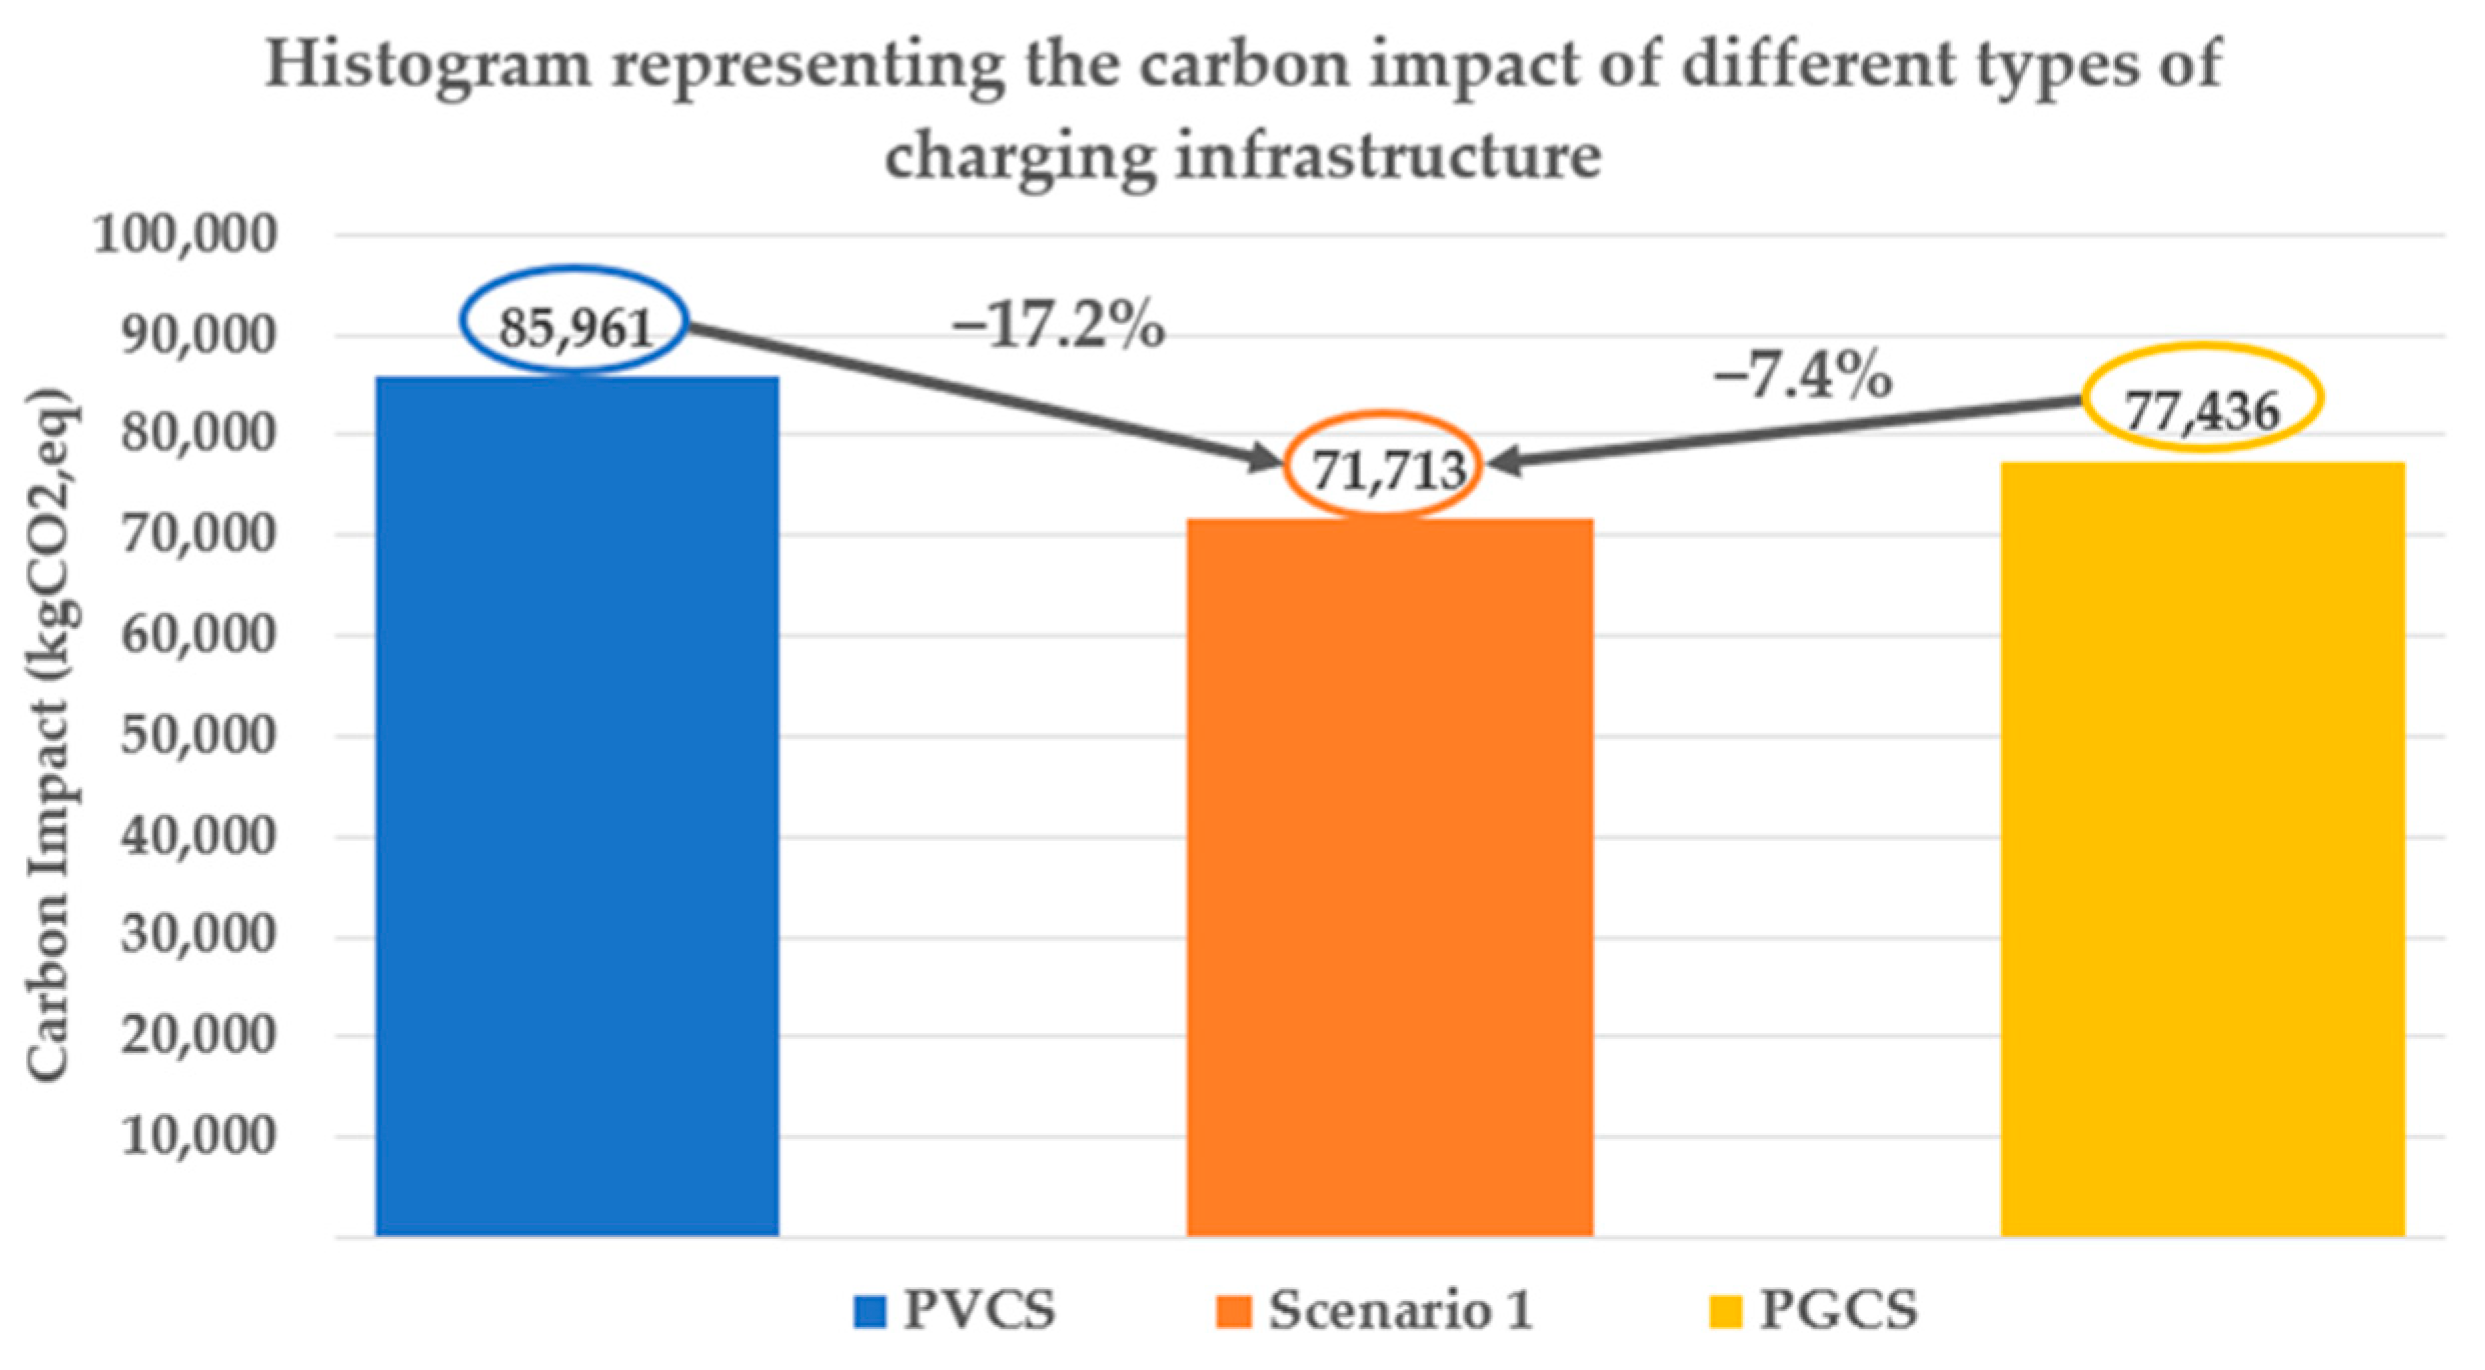
4.2. Results of the Numerical Application of the PVCS Carbon Impact

In this example, the assessment of the PVCS carbon impact is calculated using PV panels with a carbon emission coefficient of 0.04 kgCO2,eq/kWh, according to the NREL laboratory in the context of the LCA harmonization project [28]. Numerical applications of formulas give:
I m p P V , i n f r a = 48 , 546 kg CO 2 , eq I m p s i t e = 2 kg CO 2 , eq I m p m a i n t = 447 kg CO 2 , eq
The carbon impact of this PV system is therefore:
I m p P V = 48 , 995 kg CO 2 eq
In addition to this carbon impact, there is also the impact of batteries, charging terminals, infrastructure related to the shade, and electricity provided by the power grid. As summarized in Table 1, the numerical application provides a value of I m p P V C S = 85 , 961 kg CO 2 , eq as the total carbon impact of the PVCS. Compared to the amount of power that PVCS supplies from the PV system and the power grid in the analysis period, this carbon impact is equivalent to an global emission coefficient of the PVCS of 0.068 kgCO2,eq/kWh.
It is interesting to compare the carbon impact of the PVCS with the carbon impact of PGCS. This station therefore provides the same quantity of electricity over 30 years as the PVCS, and also includes the same number of charging terminals. Thus, its carbon impact I m p P G C S can be calculated using this equation:
I m p P G C S = I m p C T + I m p P G
where I m p C T and I m p P G are the carbon impact of the charging terminals and the public grid, respectively.
The numerical application gives that the carbon impact for this PGCS is equal to 77,436 kgCO2,eq. The comparison of these two carbon impacts is given by calculating the variation rate.
V a r i a t i o n   r a t e = I m p P V C S I m p P G C S I m p P G C S × 100 = 11 %
In this example, the numerical application indicates that the carbon impact of the PVCS is 11% higher than that of the PGCS. Once the carbon impact of the PVCS is established, it is necessary to estimate the action levers allowing one to reduce the carbon impact of the system.

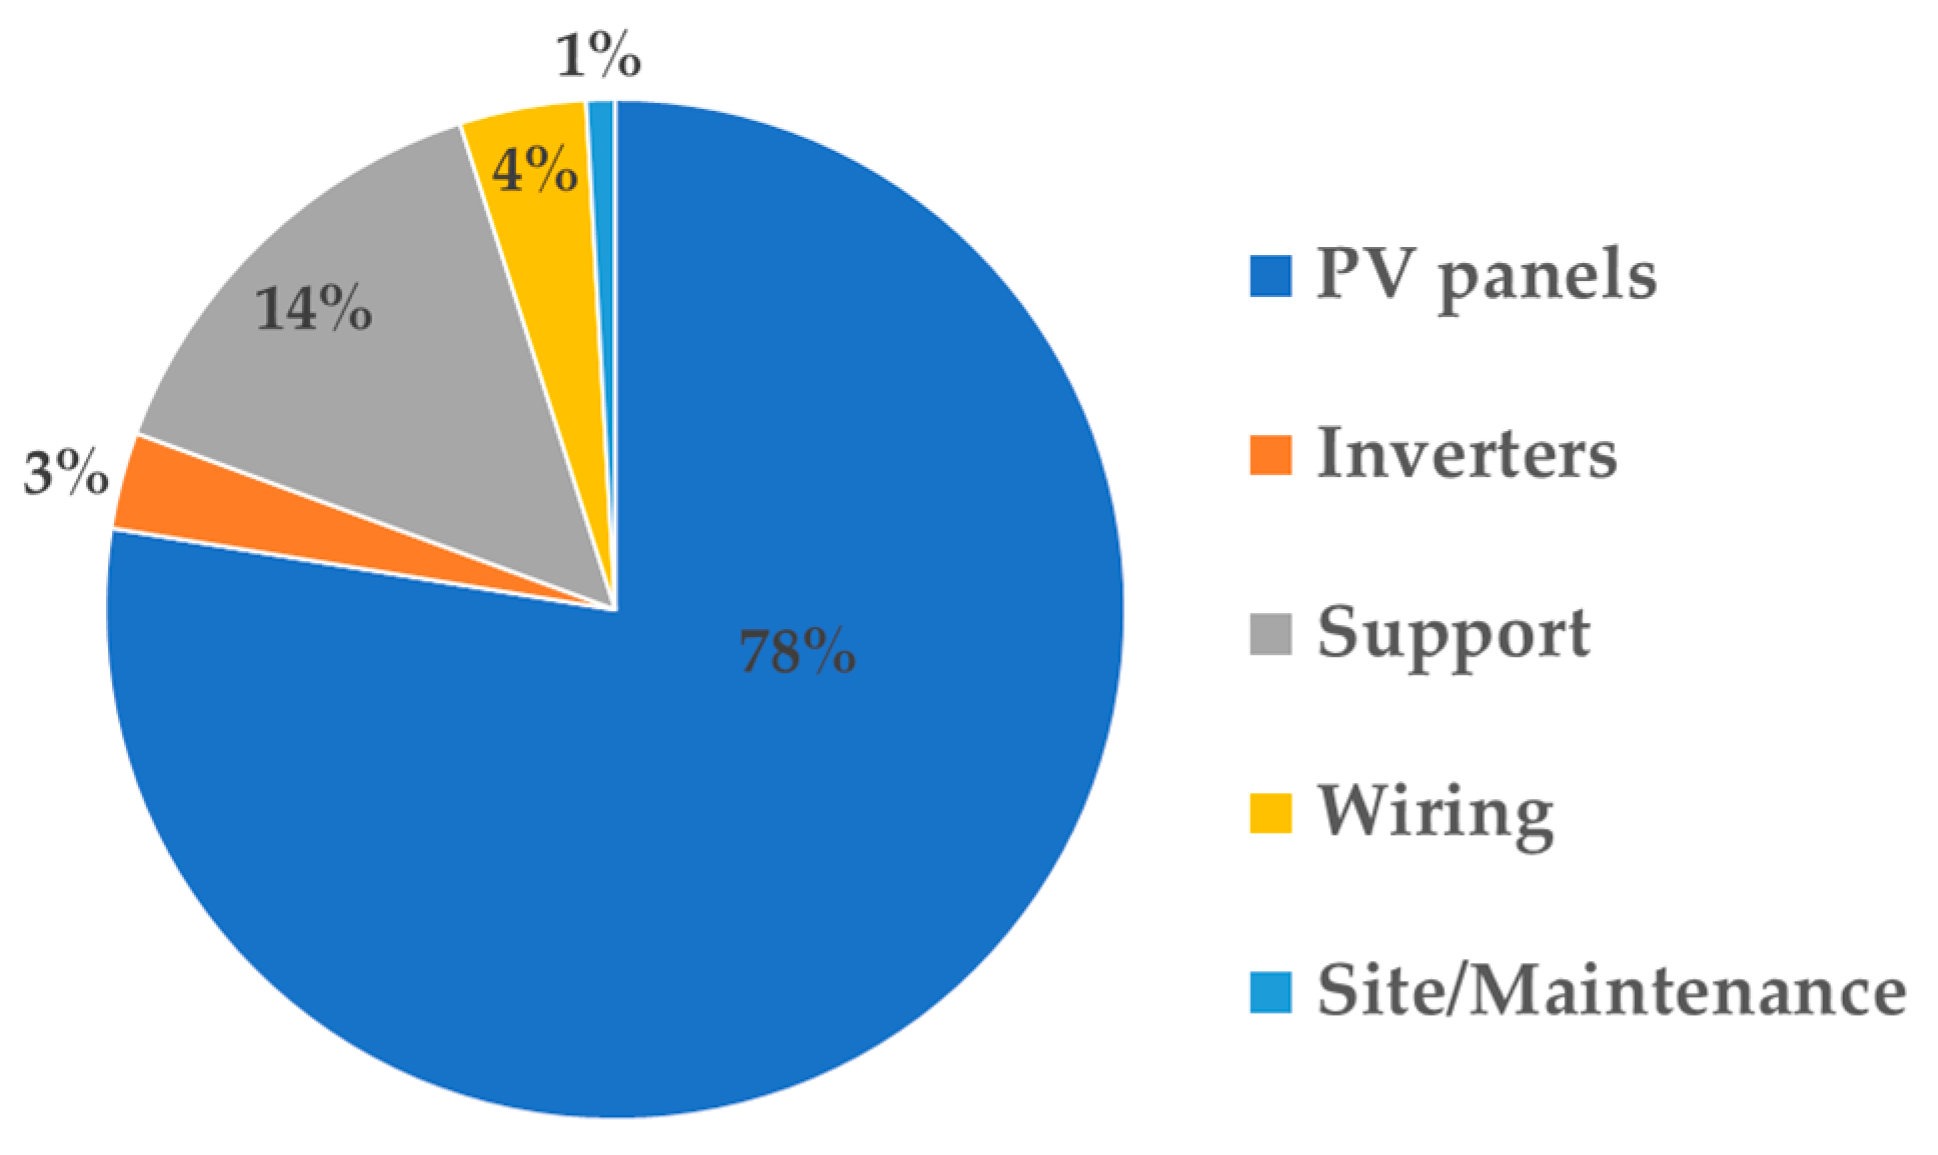
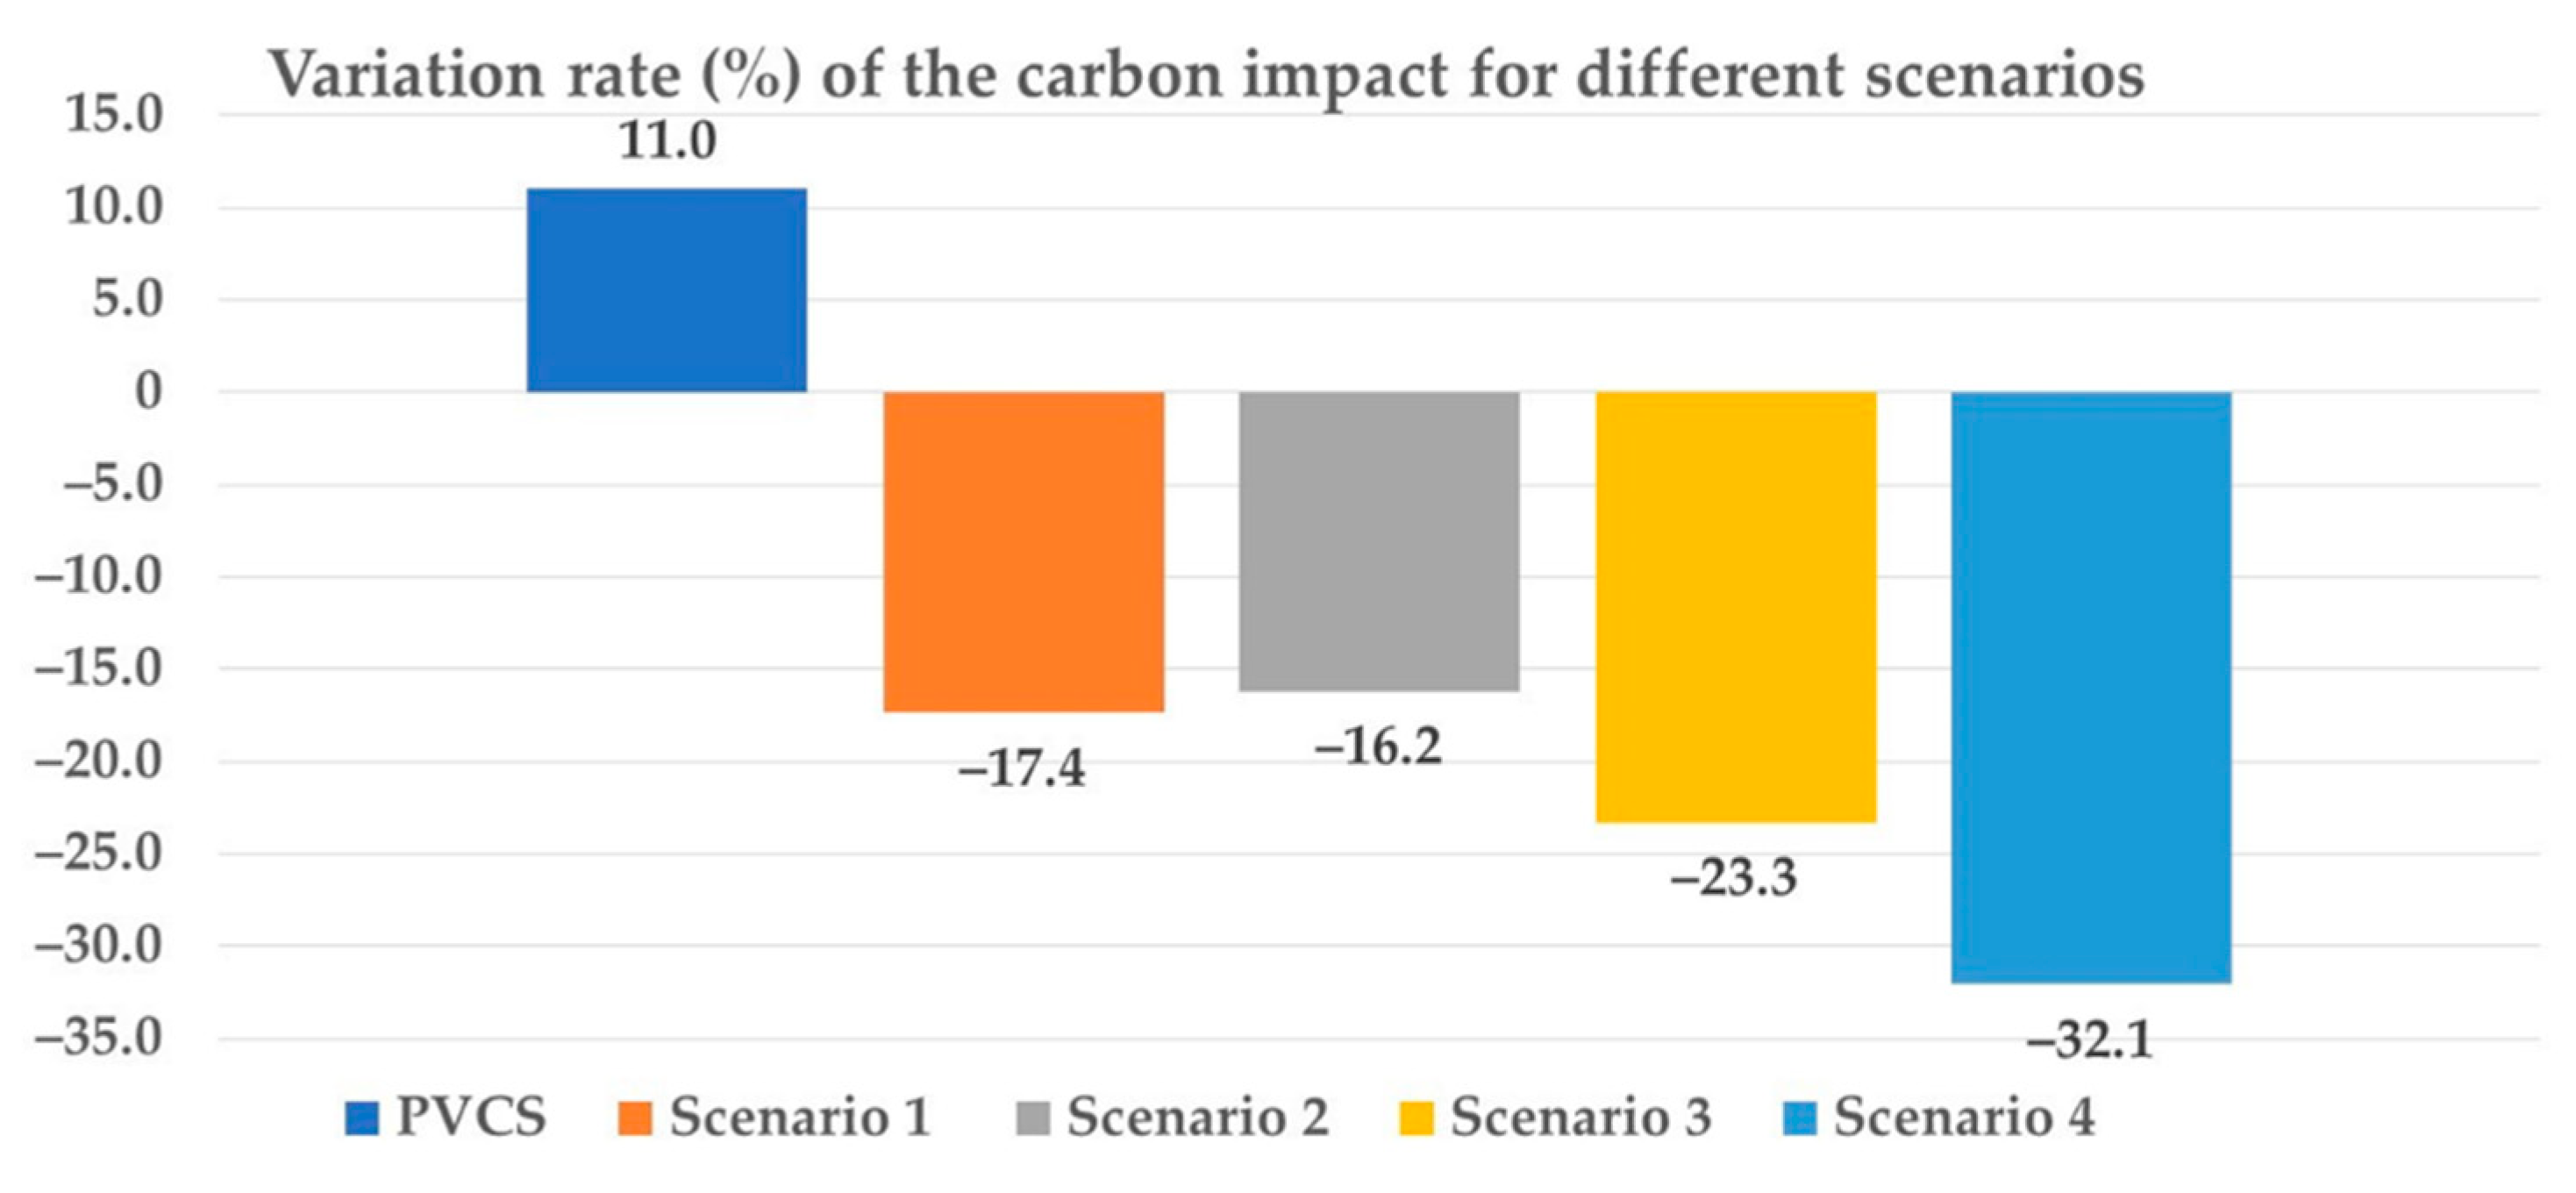
4.3. Analyses of Action Levers to Reduce the Carbon Impact of the PVCS

To identify the action levers required to reduce the carbon impact, the most emitting positions within the PVCS have been identified. It is then necessary to determine these levers. Once these levers are determined, it is sufficient to reduce their carbon emission coefficient or their carbon impact. This reduction relies on recycled materials and newer data. Once the component’s carbon impact is reduced, the new carbon impact of the PVCS is compared to that of the initially considered PVCS and PGCS, to show the gains obtained.
According to the chart pie shown in Figure 5, the most impactful element, in terms of carbon impact, is the PV system, which emits 57% of the total carbon impact of the PVCS. The second most impacting element is infrastructure, which emits 18%.
The power grid is not considered for estimating action levers that reduce carbon impacts. Therefore, the other components of the PVCS are considered to determine the levers of action. Figure 6 shows the distribution of the carbon impact of the PVCS without the power grid.
Without considering the carbon impact of the power grid, the most impactful element in terms of carbon impact is the PV system, which emits 68% of the PVCS carbon impact. The second most impacting element is the infrastructure, which emits 21%. Next, comes the stationary storage with 8% and the charging terminals with 3%.
Since the PV system is made up of many other components, it is then necessary to determine which components emit the most within the system. As shown in Figure 7, the PV panels are the most impactful elements in terms of carbon impact. Their carbon impact is about 78%.
Indeed, the PV panels’ manufacturing is the most energy-intensive step. For example, a large quantity of energy is used to convert silica sand into high purity silicon. The main action lever in order to reduce the carbon impact is then the PV panels, thereby reducing the impact of the PV system, and therefore of the PVCS. According to the aforementioned analysis, the PV panels and infrastructure will be considered.
The carbon impact of new PV panels decreased sharply over the years, due to the use of less carbon emitting processes and materials during manufacture, and their improved efficiency.
In this study, the values of emission coefficients used to calculate the carbon impact of the considered PVCS came from the Ecoinvent database and the study carried out by NREL in the LCA harmonization project [29], which explains an emission coefficient of 0.04 kgCO2,eq/kWh for PV panels.
Thus, in order to calculate the reduction of the carbon impact, the emission coefficient of the PV panels will be changed. In this framework, the reduction of the carbon impact of PVCS is analyzed according to four scenarios.

4.3.1. Scenario 1: Reduction of the Emission Coefficient of the PV Panels from 0.04 kgCO2,eq/kWh to 0.025 kgCO2,eq/kWh

By taking PV panels with a carbon emission coefficient of 0.025 kgCO2,eq/kWh, the carbon impact of the panels drops from 37,996 kgCO2,eq to 23,748 kgCO2,eq.
As depicted in Figure 8, the carbon impact of the PVCS drops from 85,961 kgCO2,eq approximately to 71,713 kgCO2,eq, a decrease of 17.2% compared to the initially considered charging station.
In addition, knowing that the carbon impact of a PGCS is around 77,436 kgCO2,eq, then over 30 years, the variation rate becomes −7.4%, which means that the carbon impact of the PVCS is lower than the PGCS’ one.

4.3.2. Scenario 2: Reduction of the PV Panels’ Emission Coefficient to 0.025 kgCO2,eq and the Infrastructure Is Based on Recycled Materials

In addition to the PV panels, it is possible to reduce the carbon impact of the infrastructure by using recycled materials. The constituent materials of the infrastructure are steel and the concrete. For concrete, RC from wastes will be used, which will prevent some emissions from the use of new concrete. For steel, the metal structure will be made of recycled steel. Thus, the carbon impact of the immobilization drops from 15,439 kgCO2,eq to 8616 kgCO2,eq. For the emission coefficient of the PV panels, scenario 1 is considered.
Thus, for these values, the carbon impact of the PVCS decreases from 85,961 kgCO2,eq to 64,890 kgCO2,eq, approximately 24.5% reduction compared to the initially considered infrastructure (Figure 9). Thus, over 30 years, the carbon impact of a PGCS is 16.2% higher than PVCS that contains PV panels with an emission coefficient of 0.025 kgCO2,eq/kWh and recycled infrastructure.

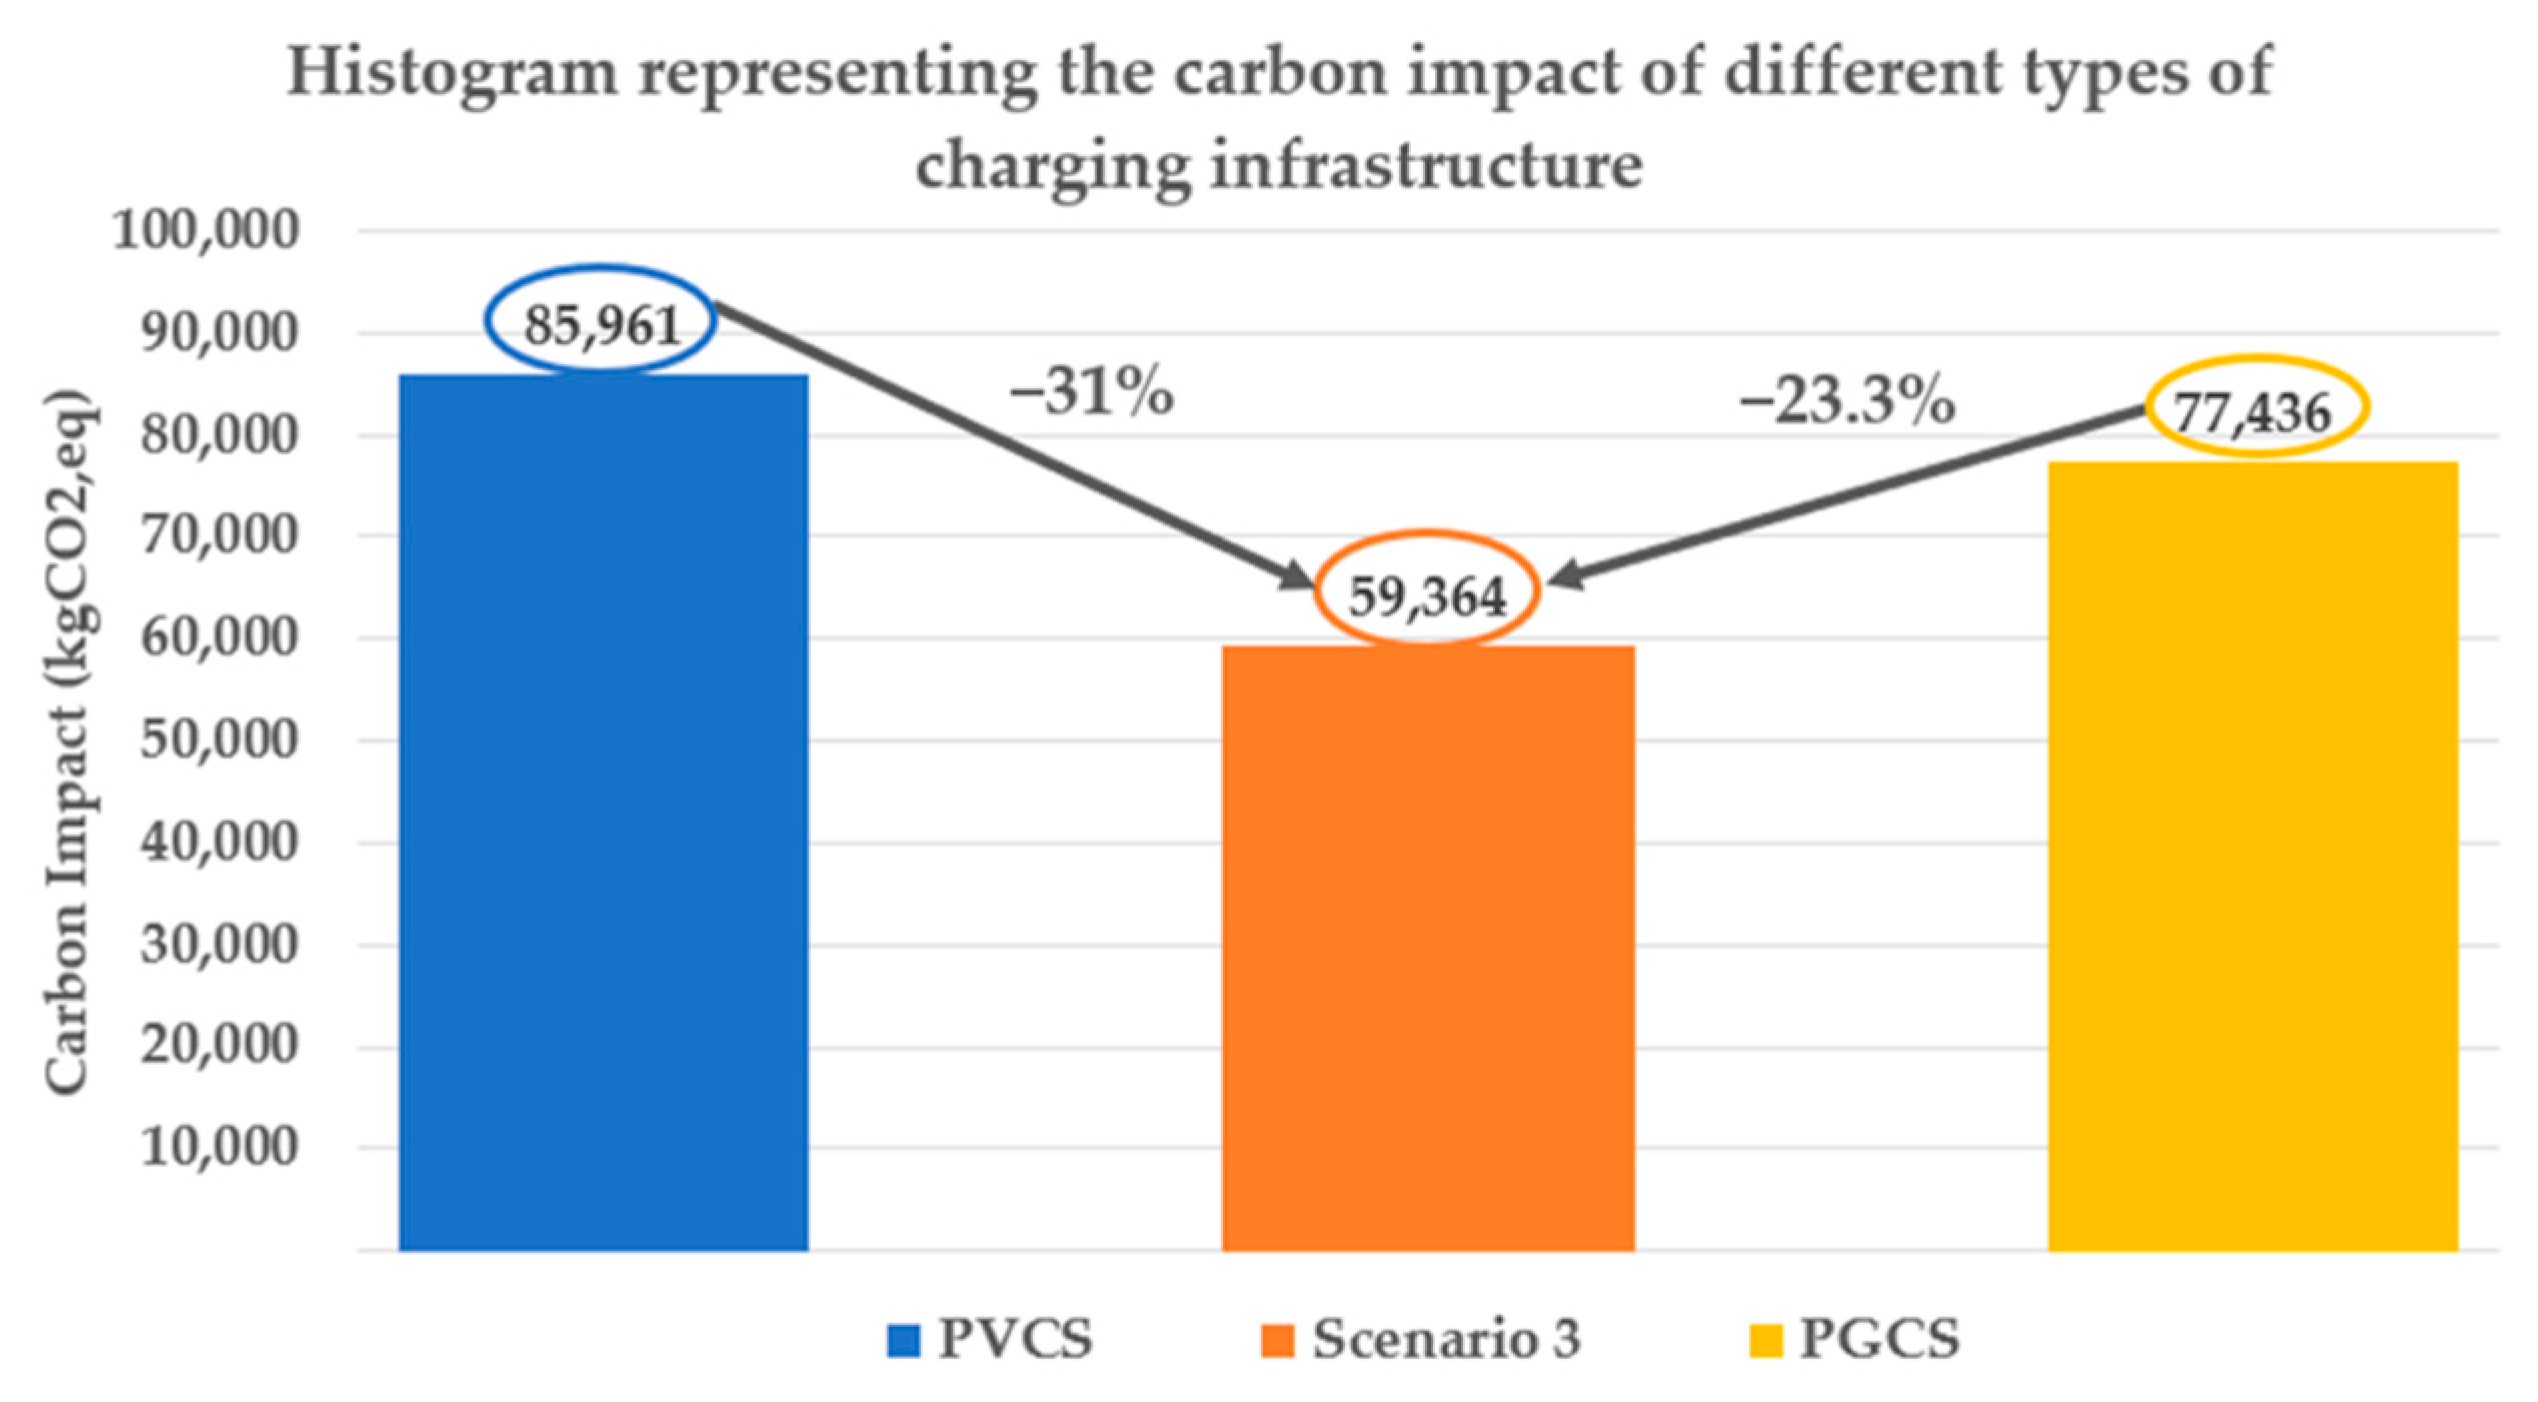
4.3.3. Scenario 3: Reduction of the PV Panels Emission Coefficient to 0.012 kgCO2,eq/kWh

A study published in 2017 [29] demonstrates that the carbon emission factor of PV modules in 2050 will vary between 3.5 and 0.012 kgCO2,eq/kWh.
By taking PV panels with a carbon emission coefficient of 0.012 kgCO2,eq/kWh, the carbon impact of the panels drops from 37,996 kgCO2,eq to 11,399 kgCO2,eq.
As depicted in Figure 10, the carbon impact of the PVCS decreases from 85,961 kgCO2,eq to 59,364 kgCO2,eq, a 31% reduction compared to the initially considered charging station. In comparison with the PGCS, the variation rate becomes −23.3%, which means that the carbon impact of the PVCS is lower than the PGCS’ one.

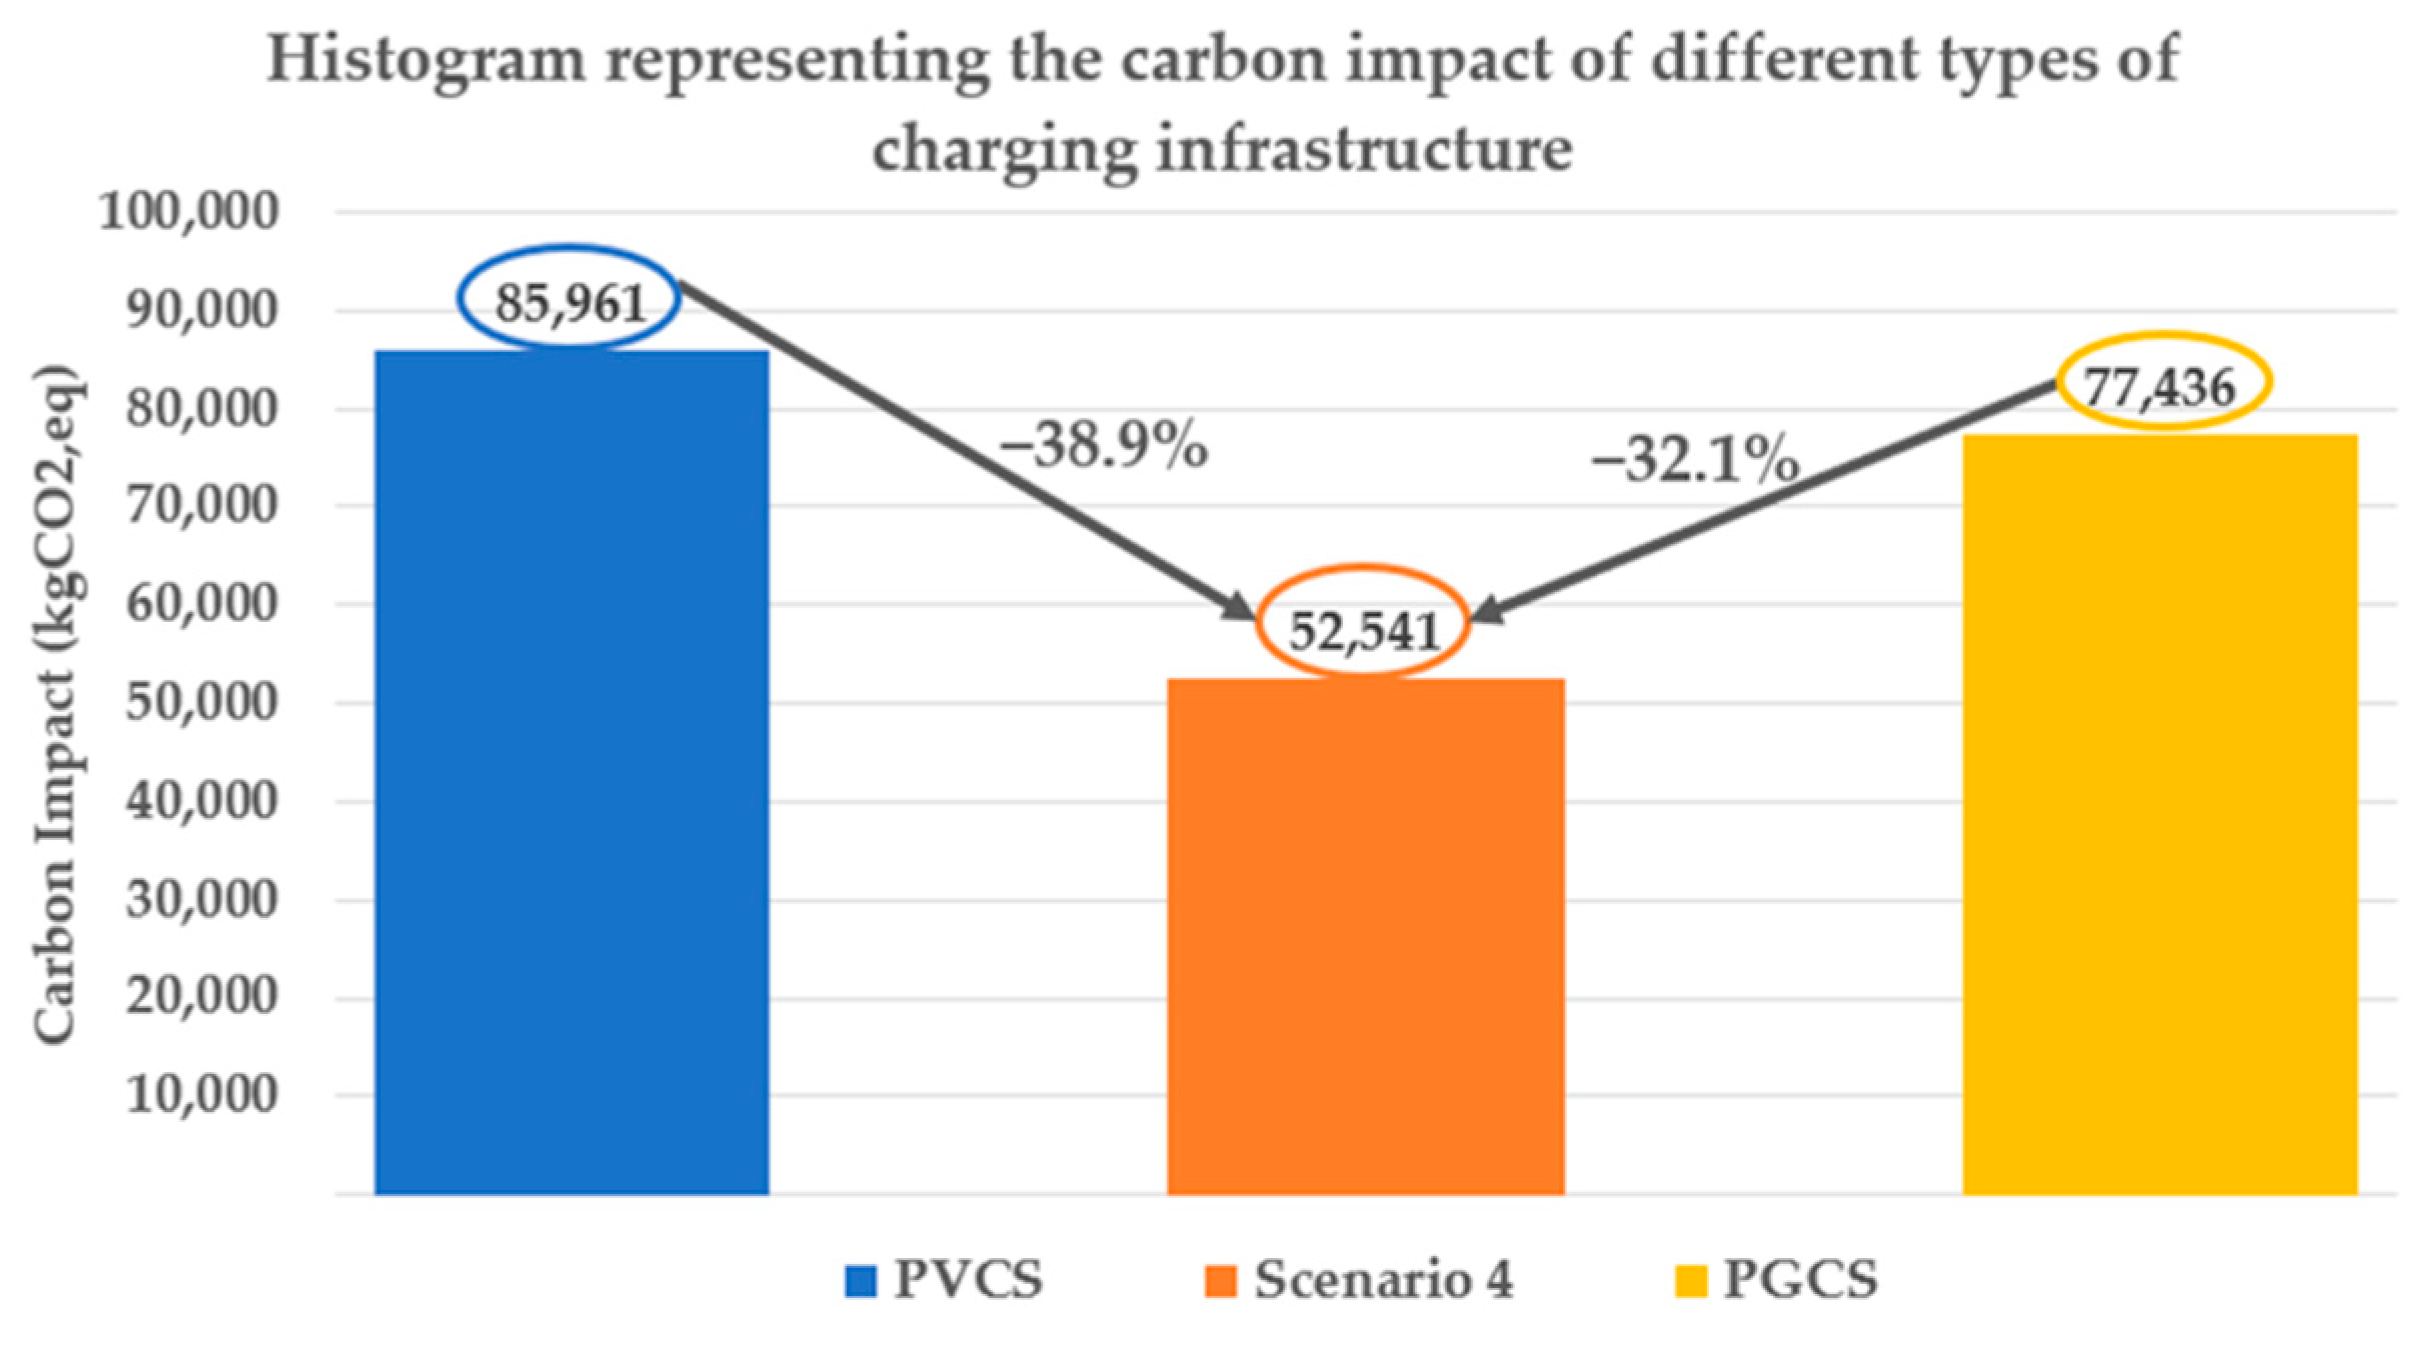
4.3.4. Scenario 4: Combination of Scenario 3 and an Infrastructure Based on Recycled Materials

As presented in Figure 11, the carbon impact of the PVCS with a recycled infrastructure and PV panels with the emission coefficient of 0.012 kgCO2,eq/kWh is approximately 52,541 kgCO2,eq, a decrease of 38.9% compared to the carbon impact of the initially considered PVCS. In comparison with the PGCS, the variation rate becomes −32.1%, which means that the carbon impact of the PVCS is lower than the carbon impact of the PGCS.

4.4. Discussion

The environmental benefits of the PVCS are assessed as the function of the energy mix of each country. The carbon impact of each country depends mainly on the thermal power plants, nuclear energy distribution, and the capacity of the renewable energies. For example, in France, with the high nuclear energy use, the charging infrastructure based only on the power grid has a lower carbon impact than the PVCS initially considered in this study. Each country displays its coefficient without giving details concerning the life cycle of each category of power plant. Thus, in this study, the developed methodology offers, with more details, to the decision maker a choice of infrastructure compatible with his spatial, ecological, and budgetary constraints.
Similar works have been published by other researchers. In [18], an optimal configuration of PVCS for EVs has been analyzed technically and economically under different conditions of solar irradiation in Vietnam. However, the cost of building, allowing the creation and the coverage of parking places, is not included in the total cost, as well as the replacement cost of the charging terminals. In [33], a technical, environmental, and financial analysis of the feasibility of PVCS associated with a stationary battery storage for EVs (EV) located in China and the United States has been discussed, using the estimation of the energy balance, annual costs, and CO2 emissions. However, the carbon impact from the manufacturing phase until the disposal of each element of the PVCS is not included in the CO2 estimation, as well as there being a lack of actions to reduce this emission.
In this context, this work details the entire methodology followed for the calculation of the global cost and the carbon impact of the PVCS, as well as the different actions to reduce it.
According to the aforementioned analysis, the PV system is the most impacting element of CO2, which emits 57% of the total carbon impact of the PVCS. On this basis, four scenarios have been suggested to reduce the PVCS carbon impact using recent data. Each scenario presented in the previous sections was able to reduce the carbon impact of PVCS compared to the initially considered charging station and PGCS.
Each scenario presented in the previous sections was able to reduce the carbon impact of PVCS compared to the initially considered charging station and PGCS.
Thus, scenario 4 presents the lowest carbon impact, combining a carbon emission coefficient of 0.012 kgCO2,eq/kWh for PV panels and an infrastructure based on recycled materials. The variation rate of each scenario compared to the charging station only grid-connected is summarized in Figure 12.
Thus, the analysis of action levers demonstrates that despite a very carbon-free French energy mix, it is possible to have a lower carbon impact of PVCS than PGCS. PV technologies are evolving very quickly. Thus, for recent PV panels with a greatly reduced emission coefficient, the carbon impact of the PVCS will be also greatly reduced.
Figure 13 depicts the carbon impact of the PVCS compared with the PGCS in different countries. The calculated carbon emission coefficient of the initially considered PVCS of 0.068 kgCO2,eq/kWh is lower than the PGCS based on the energy mix of different countries, with the exception of that of France, because the French energetic mix is very low.
Scenario 4 makes the carbon emission coefficient of PVCS become 0.042 kgCO2,eq/kWh lower than the energy mix of different countries, even that of France.

5. Conclusions

Electric mobility and PVCS installation are positioned as solutions to the dynamic issues linked to environmental challenges. The purpose of this work is to disseminate through the development of methodology based on LCA to calculate the global cost of this type of installation, and to quantify the savings of the carbon impact of the PVCS. Thus, estimating the global cost will provide a clearer view of the financial impact of this type of installation over the 30-year lifespan. Moreover, the PVCS carbon impact estimation provides an approach to quantify the environmental impact of this type of installation by quantifying the pollution of the installation in the CO2 equivalent.
According to the results obtained, the carbon impact of the PV system is largely responsible for the global carbon impact of the PVCS. Thus, the impact of using more recent data of the PV panels’ carbon emission coefficient and recycled materials on the global carbon impact of the PVCS is analyzed in this paper. For recent PV panels with 0.012 kgCO2,eq/kWh and an infrastructure with recycled materials, the carbon impact of the PVCS is 32.1% lower than the carbon impact of the PGCS. In this scenario, the carbon emission coefficient of the PVCS becomes 0.042 kgCO2,eq/kWh lower than the energy mix of different countries.
The carbon emission coefficient of the studied PVCS is compared to than that of PGCS in several countries; where the carbon emission coefficient different from one country to another, it depends mainly on the thermal power plants, the distribution of the nuclear energy, and the capacity of the renewable energy’s installations. However, each country displays its coefficient without giving details concerning the life cycle of each category of power plant. This represents a limit for constructing a precise comparison framework. In addition, difficulties are encountered in collecting recent data based on the evolution of technologies related to PVCS and defining a calculation methodology of the global cost and the carbon impact, which presents a concern with the proposed methodology.
As future works, it would be possible to resume and deepen the calculation of the carbon emissions of each subsystem of the PVCS based on any more recent data, by deepening the analysis method based on the life cycle using second-life batteries, and also, by completing the methodology of the global cost by providing updated prices and rectifying the evolution of technologies related to PVCS.

Author Contributions

Conceptualization, Y.K., M.S. and F.L.; methodology, Y.K., M.S. and F.L.; software, Y.K., M.S. and F.L.; validation, Y.K., M.S. and F.L.; formal analysis, Y.K., M.S. and F.L.; investigation, Y.K., M.S. and F.L.; resources, Y.K., M.S. and F.L.; data curation, Y.K., M.S., F.L. and A.A.; writing—original draft preparation, Y.K.; writing—review and editing, M.S., F.L. and A.A.; visualization, Y.K., M.S., F.L. and A.A.; supervision, M.S.; project administration, M.S.; funding acquisition, M.S. All authors have read and agreed to the published version of the manuscript.

Funding

This research was funded by ADEME France, project PV2E_Mobility, grant number #1905C0043.

Informed Consent Statement

Not applicable.

Acknowledgments

The authors thank the engineering students of the Urban Engineering Department of the Université de Technologie de Compiègne for the technical support and the provided case study data.

Conflicts of Interest

The authors declare no conflict of interest.

References

  1. Manuel, B.; Aurore, C.; Jérôme, D.; Alexis, F.; Charlotte, V. Key Figures on Climate France, Europe and Worldwid; General Commission for Sustainable Development: New York, NY, USA, 2020; p. 88. [Google Scholar]
  2. Cheikh-Mohamad, S.; Sechilariu, M.; Locment, F.; Krim, Y. PV-Powered Electric Vehicle Charging Stations: Preliminary Requirements and Feasibility conditions. Appl. Sci. 2021, 11, 1770. [Google Scholar] [CrossRef]
  3. Bilan Carbone® France. Available online: http://www.basecarbone.fr/ (accessed on 20 July 2021).
  4. Synapsun, Commission de Régulation de l’énergie, ECS (Simplified Carbon Evaluation). Available online: https://www.synapsun.com/en/introduction-to-simplified-carbon-footprint-calculation/ (accessed on 5 September 2017).
  5. EcoInvent—Switzerland. Available online: http://www.ecoinvent.ch/ (accessed on 20 July 2021).
  6. ISO 14040; Environmental Management—Life Cycle Assessment—Principles and Framework. International Standards Organization: Geneva, Switzerland, 2006. Available online: https://www.iso.org/standard/37456.html (accessed on 23 December 2019).
  7. Jianli, Z.; Yunna, W.; Chenghao, W.; Feiyang, H.; Buyuan, Z.; Fangtong, L. A geographical information system based multi-criteria decision-making approach for location analysis and evaluation of urban photovoltaic charging station: A case study in Beijing. Energy Convers. Manag. 2020, 205, 112340. [Google Scholar]
  8. Fachrizal, R.; Shepero, M.; van der Meer, D.; Munkhammar, J.; Widén, J. Smart charging of electric vehicles considering photovoltaic power production and electricity consumption: A review. eTransportation 2020, 4, 100056. [Google Scholar] [CrossRef]
  9. Rodriguez, A.S.; de Santana, T.; MacGill, I.; Ekins-Daukes, N.; Reinders, A. A feasibility study of solar PV-powered electric cars using an interdisciplinary modeling approach for the electricity balance, CO2 emissions, and economic aspects: The cases of The Netherlands, Norway, Brazil, and Australia. Prog. Photovolt. Res. Appl. 2020, 28, 517–532. [Google Scholar] [CrossRef] [Green Version]
  10. Esfandyari, A.; Norton, B.; Conlon, M.; McCormack, S.J. Performance of a campus photovoltaic electric vehicle charging station in a temperate climate. Sol. Energy 2019, 177, 762–771. [Google Scholar] [CrossRef]
  11. Filote, C.; Felseghi, R.A.; Raboaca, M.S.; Aşchilean, I. Environmental impact assessment of green energy systems for power supply of electric vehicle charging station. Int. J. Energy Res. 2020, 44, 10471–10794. [Google Scholar] [CrossRef]
  12. Wong, E.; Ho, D.; So, S.; Tsang, C.-W.; Chan, E. Life Cycle Assessment of Electric Vehicles and Hydrogen Fuel Cell Vehicles Using the GREET Model—A Comparative Study. Sustainability 2021, 13, 4872. [Google Scholar] [CrossRef]
  13. Wu, Z.; Wang, C.; Wolfram, P.; Zhang, Y.; Sun, X.; Hertwich, E. Assessing electric vehicle policy with region-specific carbon footprints. Appl. Energy 2019, 256, 113923. [Google Scholar] [CrossRef]
  14. Javid, R.J.; Salari, M.; Javid, R.J. Environmental and economic impacts of expanding electric vehicle public charging infrastructure in California’s counties. Transp. Res. Part D Transp. Environ. 2019, 77, 320–334. [Google Scholar] [CrossRef]
  15. Aljohani, T.; Alzahrani, G. Life Cycle Assessment to Study the Impact of the Regional Grid Mix and Temperature Differences on the GHG Emissions of Battery Electric and Conventional Vehicles. In Proceedings of the 2019 SoutheastCon, Huntsville, AL, USA, 11–14 April 2019; pp. 1–9. [Google Scholar] [CrossRef]
  16. Vadium, I.T.; Das, R.; Wang, Y.; Putrus, G.; Kotter, R. Electric vehicle Carbon footprint reduction via intelligent charging strategies. In Proceedings of the 2019 8th International Conference on Modern Power Systems (MPS), Cluj-Napoca, Romania, 21–23 May 2019; pp. 1–6. [Google Scholar] [CrossRef]
  17. Grande, L.S.A.; Yahyaoui, I.; Gómez, S.A. Energetic, economic and environmental viability of off-grid PV-BESS for charging electric vehicles: Case study of Spain. Sustain. Cities Soc. 2018, 37, 519–529. [Google Scholar] [CrossRef]
  18. Minh, P.V.; Le Quang, S.; Pham, M.-H. Technical Economic Analysis of Photovoltaic-Powered Electric Vehicle Charging Stations under Different Solar Irradiation Conditions in Vietnam. Sustainability 2021, 13, 3528. [Google Scholar] [CrossRef]
  19. Liu, G.; Xue, Y.; Chinthavali, M.S.; Tomsovic, K. Optimal Sizing of PV and Energy Storage in an Electric Vehicle Extreme Fast Charging Station. In Proceedings of the IEEE Power & Energy Society Innovative Smart Grid Technologies Conference (ISGT), Washington, DC, USA, 17–20 February 2020; pp. 1–5. [Google Scholar]
  20. Alireza, K.; Georgios, T.; Prodromos, M.; Konstantinos, S.; Nikolaos, E.; Emmanouel, V. Sizing of electric vehicle charging stations with smart charging capabilities and quality of service requirements. Sustain. Cities Soc. 2021, 70, 102872. [Google Scholar]
  21. ADEME, French Agency for Ecological Transition. Know The Costs and Evaluate The Profitability, Investment Costs. Available online: https://www.photovoltaique.info/fr/preparer-un-projet/quelles-demarches-realiser/choisir-son-modele-economique/#couts_dinvestissement (accessed on 25 May 2021).
  22. Collectif. Le Moniteur Editions, Batiprix Bordereau; Groupe Moniteur: Paris, France, 2017; 3644p, ISBN 978-2-281-14172-6. EAN 9782281141726. [Google Scholar]
  23. ADEME, French Agency for Ecological Transition. Key Figures. Available online: https://www.ademe.fr/expertises/mobilite-transports/chiffres-cles-observations/chiffres-cles (accessed on 9 April 2018).
  24. Miquel, C.; Gaiddon, B. Systèmes Photovoltaïques: Fabrication et Impact Environnemental; HESPUL, Energies Renouvelalbes et Efficacité Energétique: Lyon, France, 2009; pp. 1–35. Available online: https://www.photovoltaique.info/media/filer_public/36/fe/36fe92bb-d625-4712-abb4-47470c864208/pv_fab_envt_final_26082009.pdf (accessed on 26 January 2020).
  25. ISO 14067; Greenhouse Gases—Carbon Footprint of Products—Requirements and Guidelines for Quantification. ICS: 13.020.40 Pollution, Pollution Control and Conservation, Sustainable Development Goal. International Standards Organization: Geneva, Switzerland, 2018; pp. 1–46.
  26. ISO 14064; International Standards Organization: Geneva, Switzerland, 2018. Available online: https://www.iso.org/standards.html (accessed on 20 July 2021).
  27. Avenir Climatique. MOOC Energie & Climate. 2017. Available online: https://avenirclimatique.org/mooc/ (accessed on 26 January 2020).
  28. NREL, National Renewable Energy Laboratory. Life Cycle Greenhouse Gas Emissions from Solar Photovoltaics; NREL/FS-6A20-56487; NREL: Golden, CO, USA, 2012; p. 2. [Google Scholar]
  29. Pehl, M.; Arvesen, A.; Humpenöder, F.; Popp, A.; Hertwich, E.G.; Luderer, G. Understanding future emissions from low-carbon power systems by integration of life-cycle assessment and integrated energy modelling. Nat. Energy 2017, 2, 939–945. [Google Scholar] [CrossRef]
  30. Schneider Electric. EVlink Wallbox Plus-T2S Socket Outlet with Shutters-3 Phase-32A/22kW. Available online: https://www.se.com/fr/fr/product/EVC1S22P4E4ERF/evlink-city---borne---22kw---2xt2s-tri-32a-%2B-2x2p%2Bt---rfid/ (accessed on 26 January 2020).
  31. Schneider-Electric. Product Environmental Profile EVLink Wallbox, 08/2015, ENVPEP1502002_V1/PEP Ecopassport SCHN-2015-019-V0-EN. Available online: https://download.schneider-electric.com/files?p_Doc_Ref=ENVPEP1502002EN (accessed on 26 January 2020).
  32. Lévy, J.-B. Producing a Climate-Friendly Energy. 2020. Available online: https://www.edf.fr/en/the-edf-group/producing-a-climate-friendly-energy (accessed on 26 January 2020).
  33. Sierra, A.; Gercek, C.; Geurs, K.; Reinders, A. Technical, Financial, and Environmental Feasibility Analysis of Photovoltaic EV Charging Stations With Energy Storage in China and the United States. IEEE J. Photovolt. 2020, 10, 1892–1899. [Google Scholar] [CrossRef]
Figure 1. Perimeter of the study.
Applsci 12 04115 g001
Figure 2. Distribution of the investment cost of the PVCS.
Applsci 12 04115 g002
Figure 3. (a) Maintenance cost, (b) exploitation cost.
Applsci 12 04115 g003
Figure 4. The 30-year financial report: (a) Distribution of the global cost; (b) evolution of the global cost by year.
Applsci 12 04115 g004
Figure 5. Distribution of the impact carbon of the PVCS.
Applsci 12 04115 g005
Figure 6. Distribution of carbon impact of the PVCS without considering the power grid.
Applsci 12 04115 g006
Figure 7. Distribution of carbon impact of the PV system.
Applsci 12 04115 g007
Figure 8. Result of scenario 1.
Applsci 12 04115 g008
Figure 9. Result of scenario 2.
Applsci 12 04115 g009
Figure 10. Result of scenario 3.
Applsci 12 04115 g010
Figure 11. Result of scenario 4.
Applsci 12 04115 g011
Figure 12. Variation rate for the different scenarios.
Applsci 12 04115 g012
Figure 13. Comparison of the carbon emission coefficient of PVCS with the PGCS in different countries.
Applsci 12 04115 g013
Table 1. Summary table of the carbon impact of each component of the initially considered PVCS.
PVCS Imp (kgCO2,eq)
PV systemPV system componentsPV panels37,996
Inverter1501
Support7087
Wiring1962
SiteInstallation1
Uninstallation1
MaintenanceCleaning23
Servicing424
Charging terminalsMaintenance 1023
Fabrication 1095
Li-Ion battery 5869
Infrastructure 15,439
Public grid 13,540
Total 85,961
Publisher’s Note: MDPI stays neutral with regard to jurisdictional claims in published maps and institutional affiliations.

