
Evaluation of the Acceleration Vibration Signal for Aggregates of the Horizontal Drilling Stand


Abstract
Featured Application
Abstract
1. Introduction
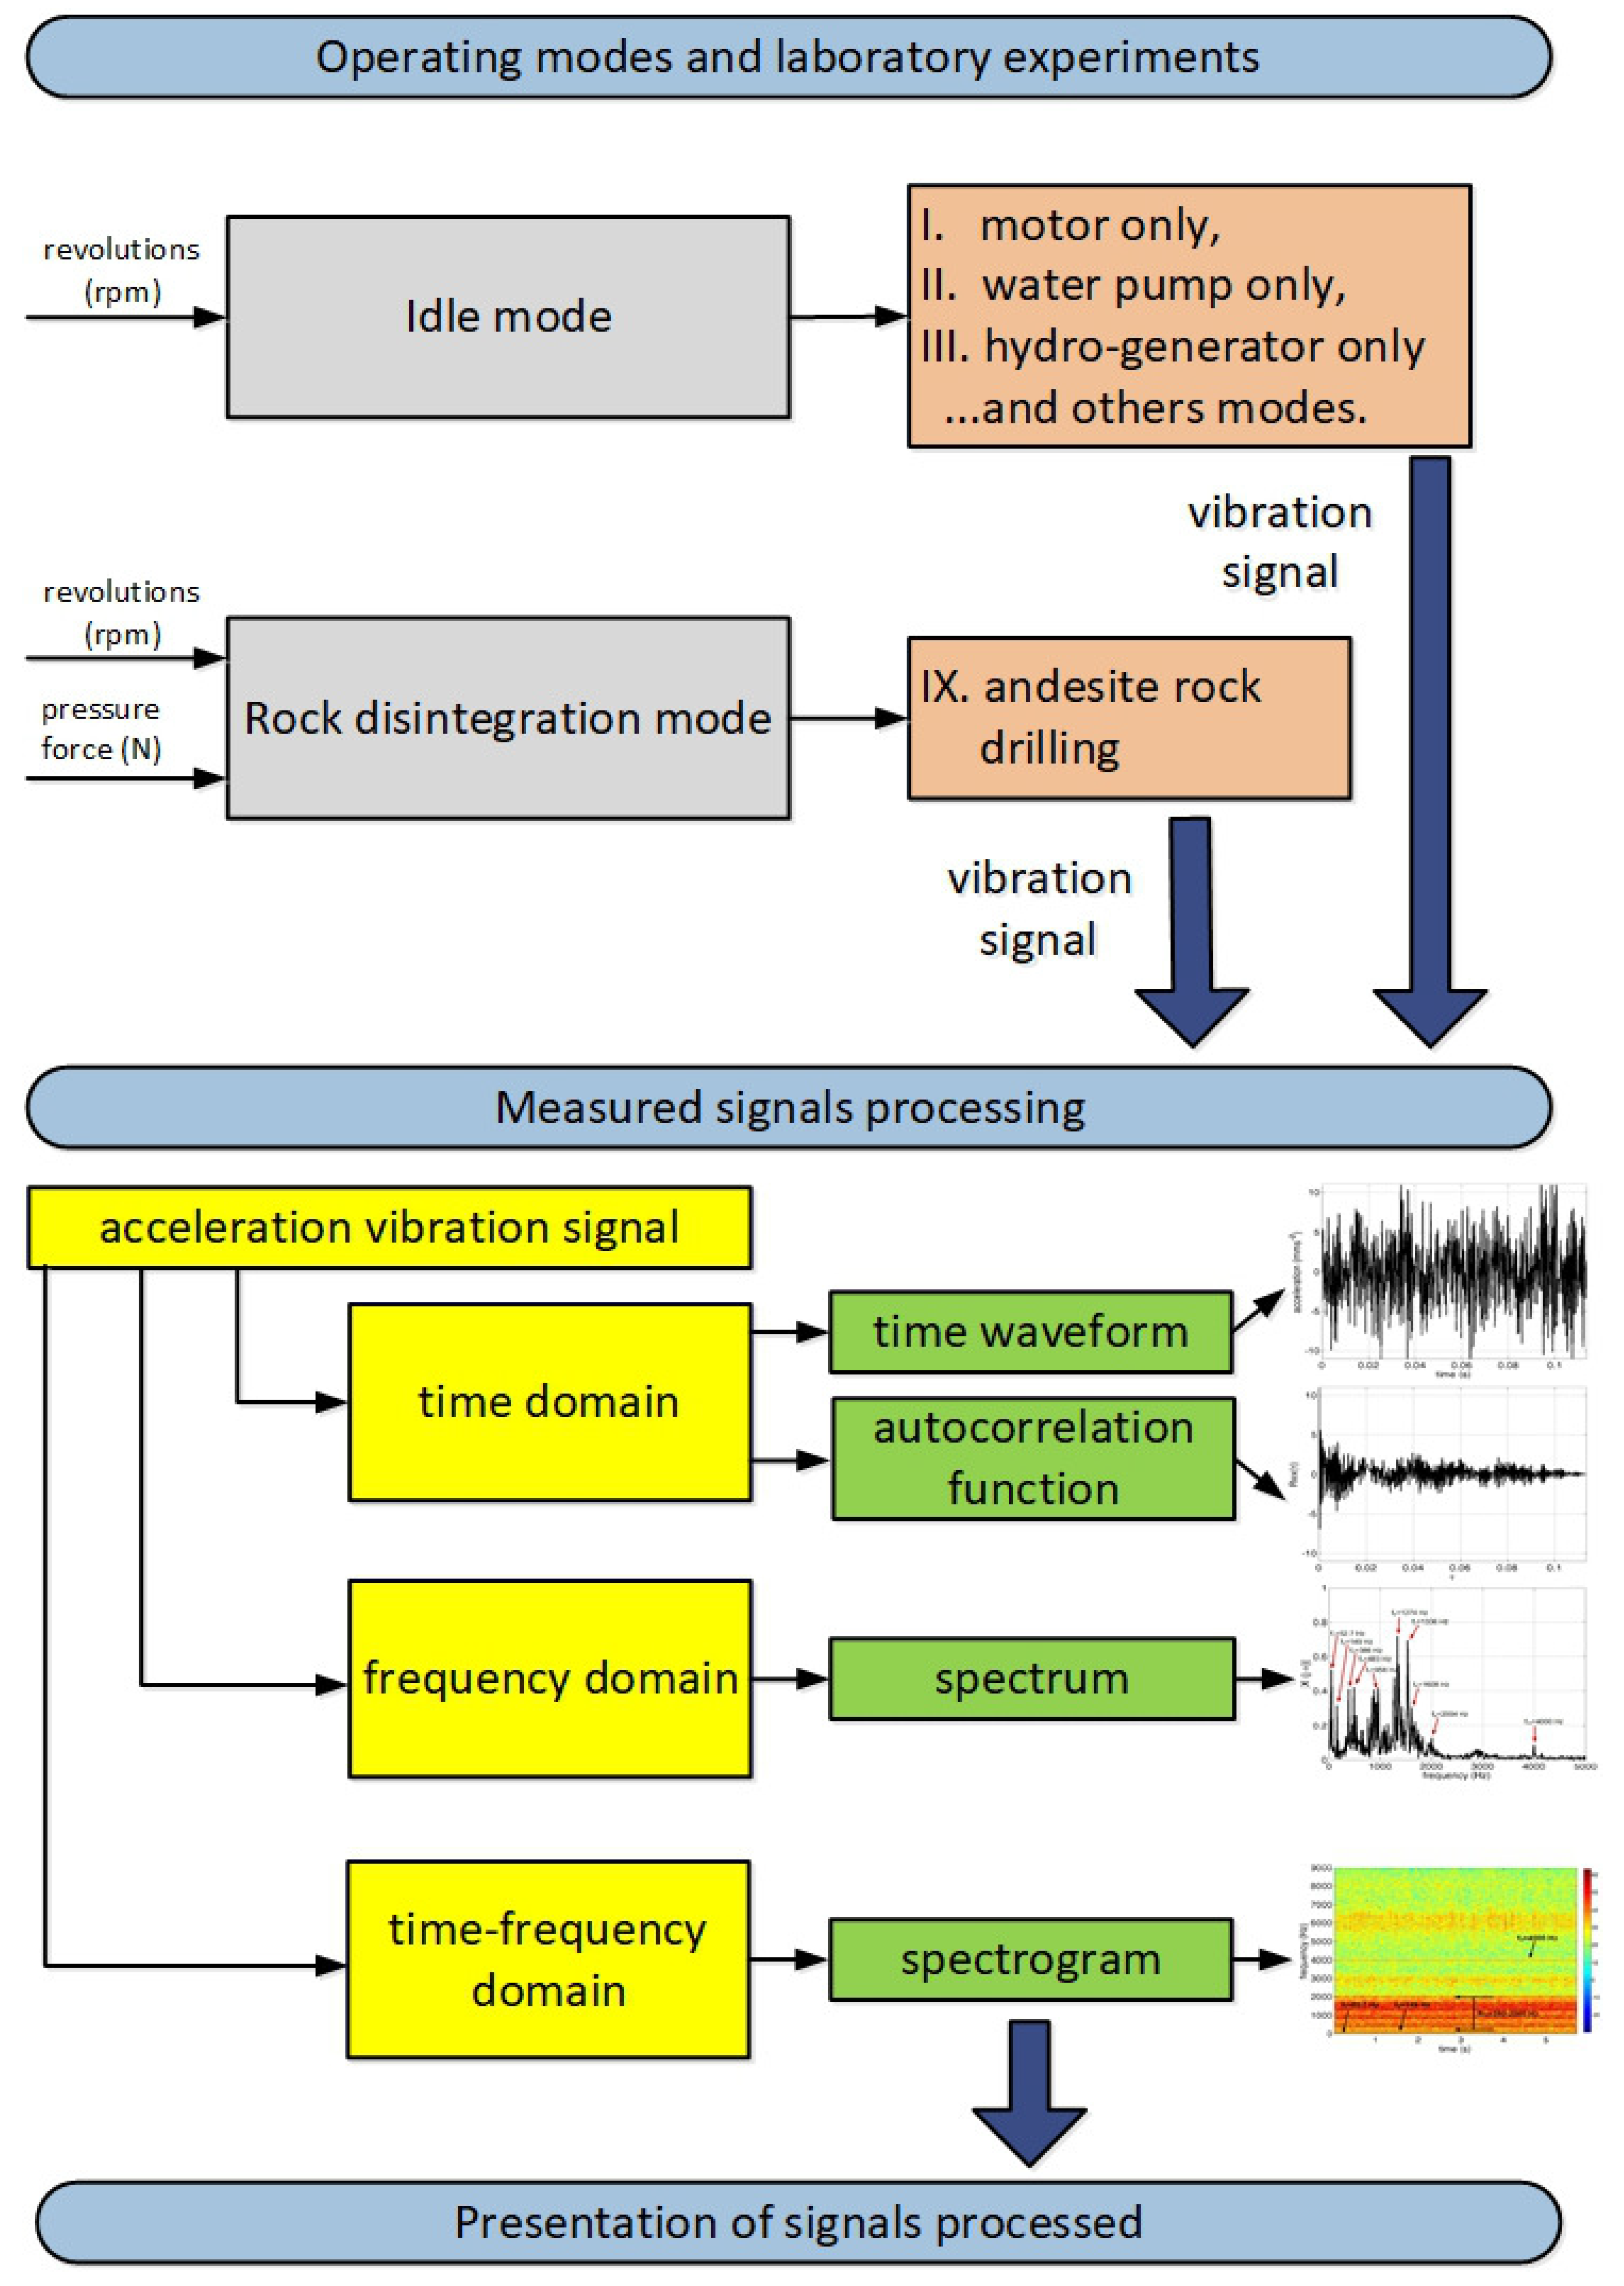
- no-load vibration;
- vibrations during rotational disintegration of selected rocks.
- vibrations from main aggregates;
- rinsing water vibrations.
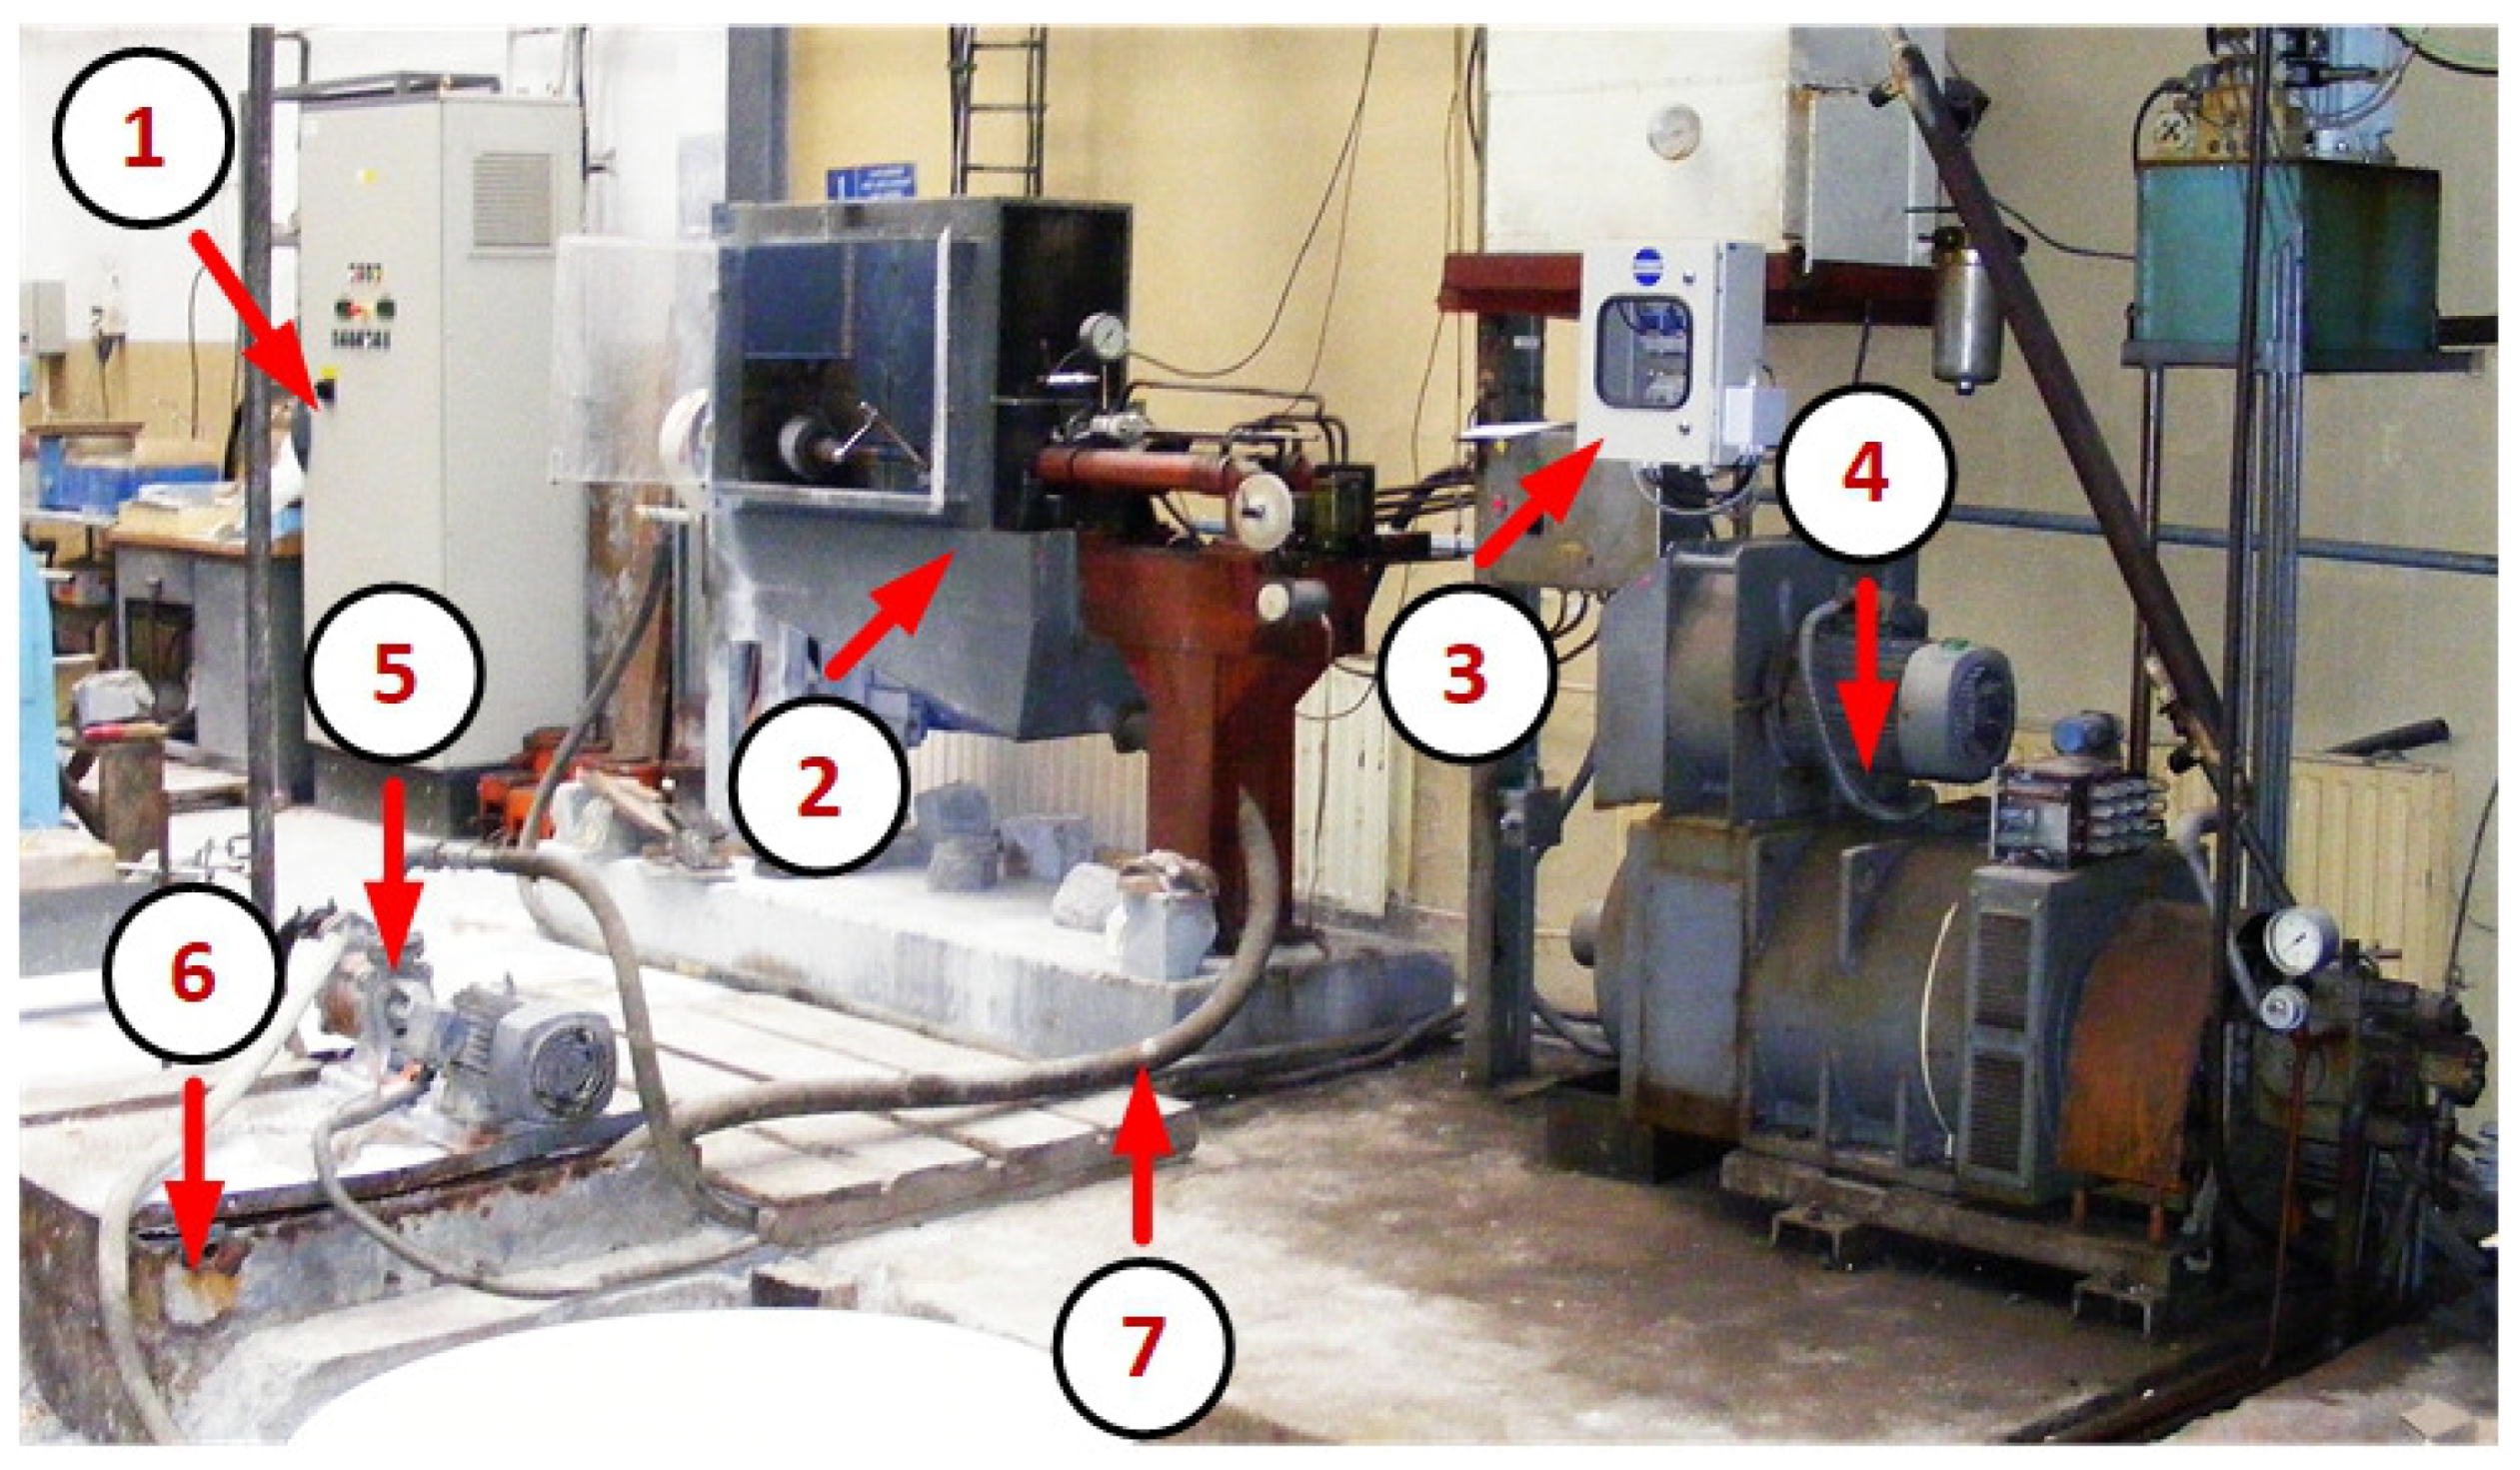
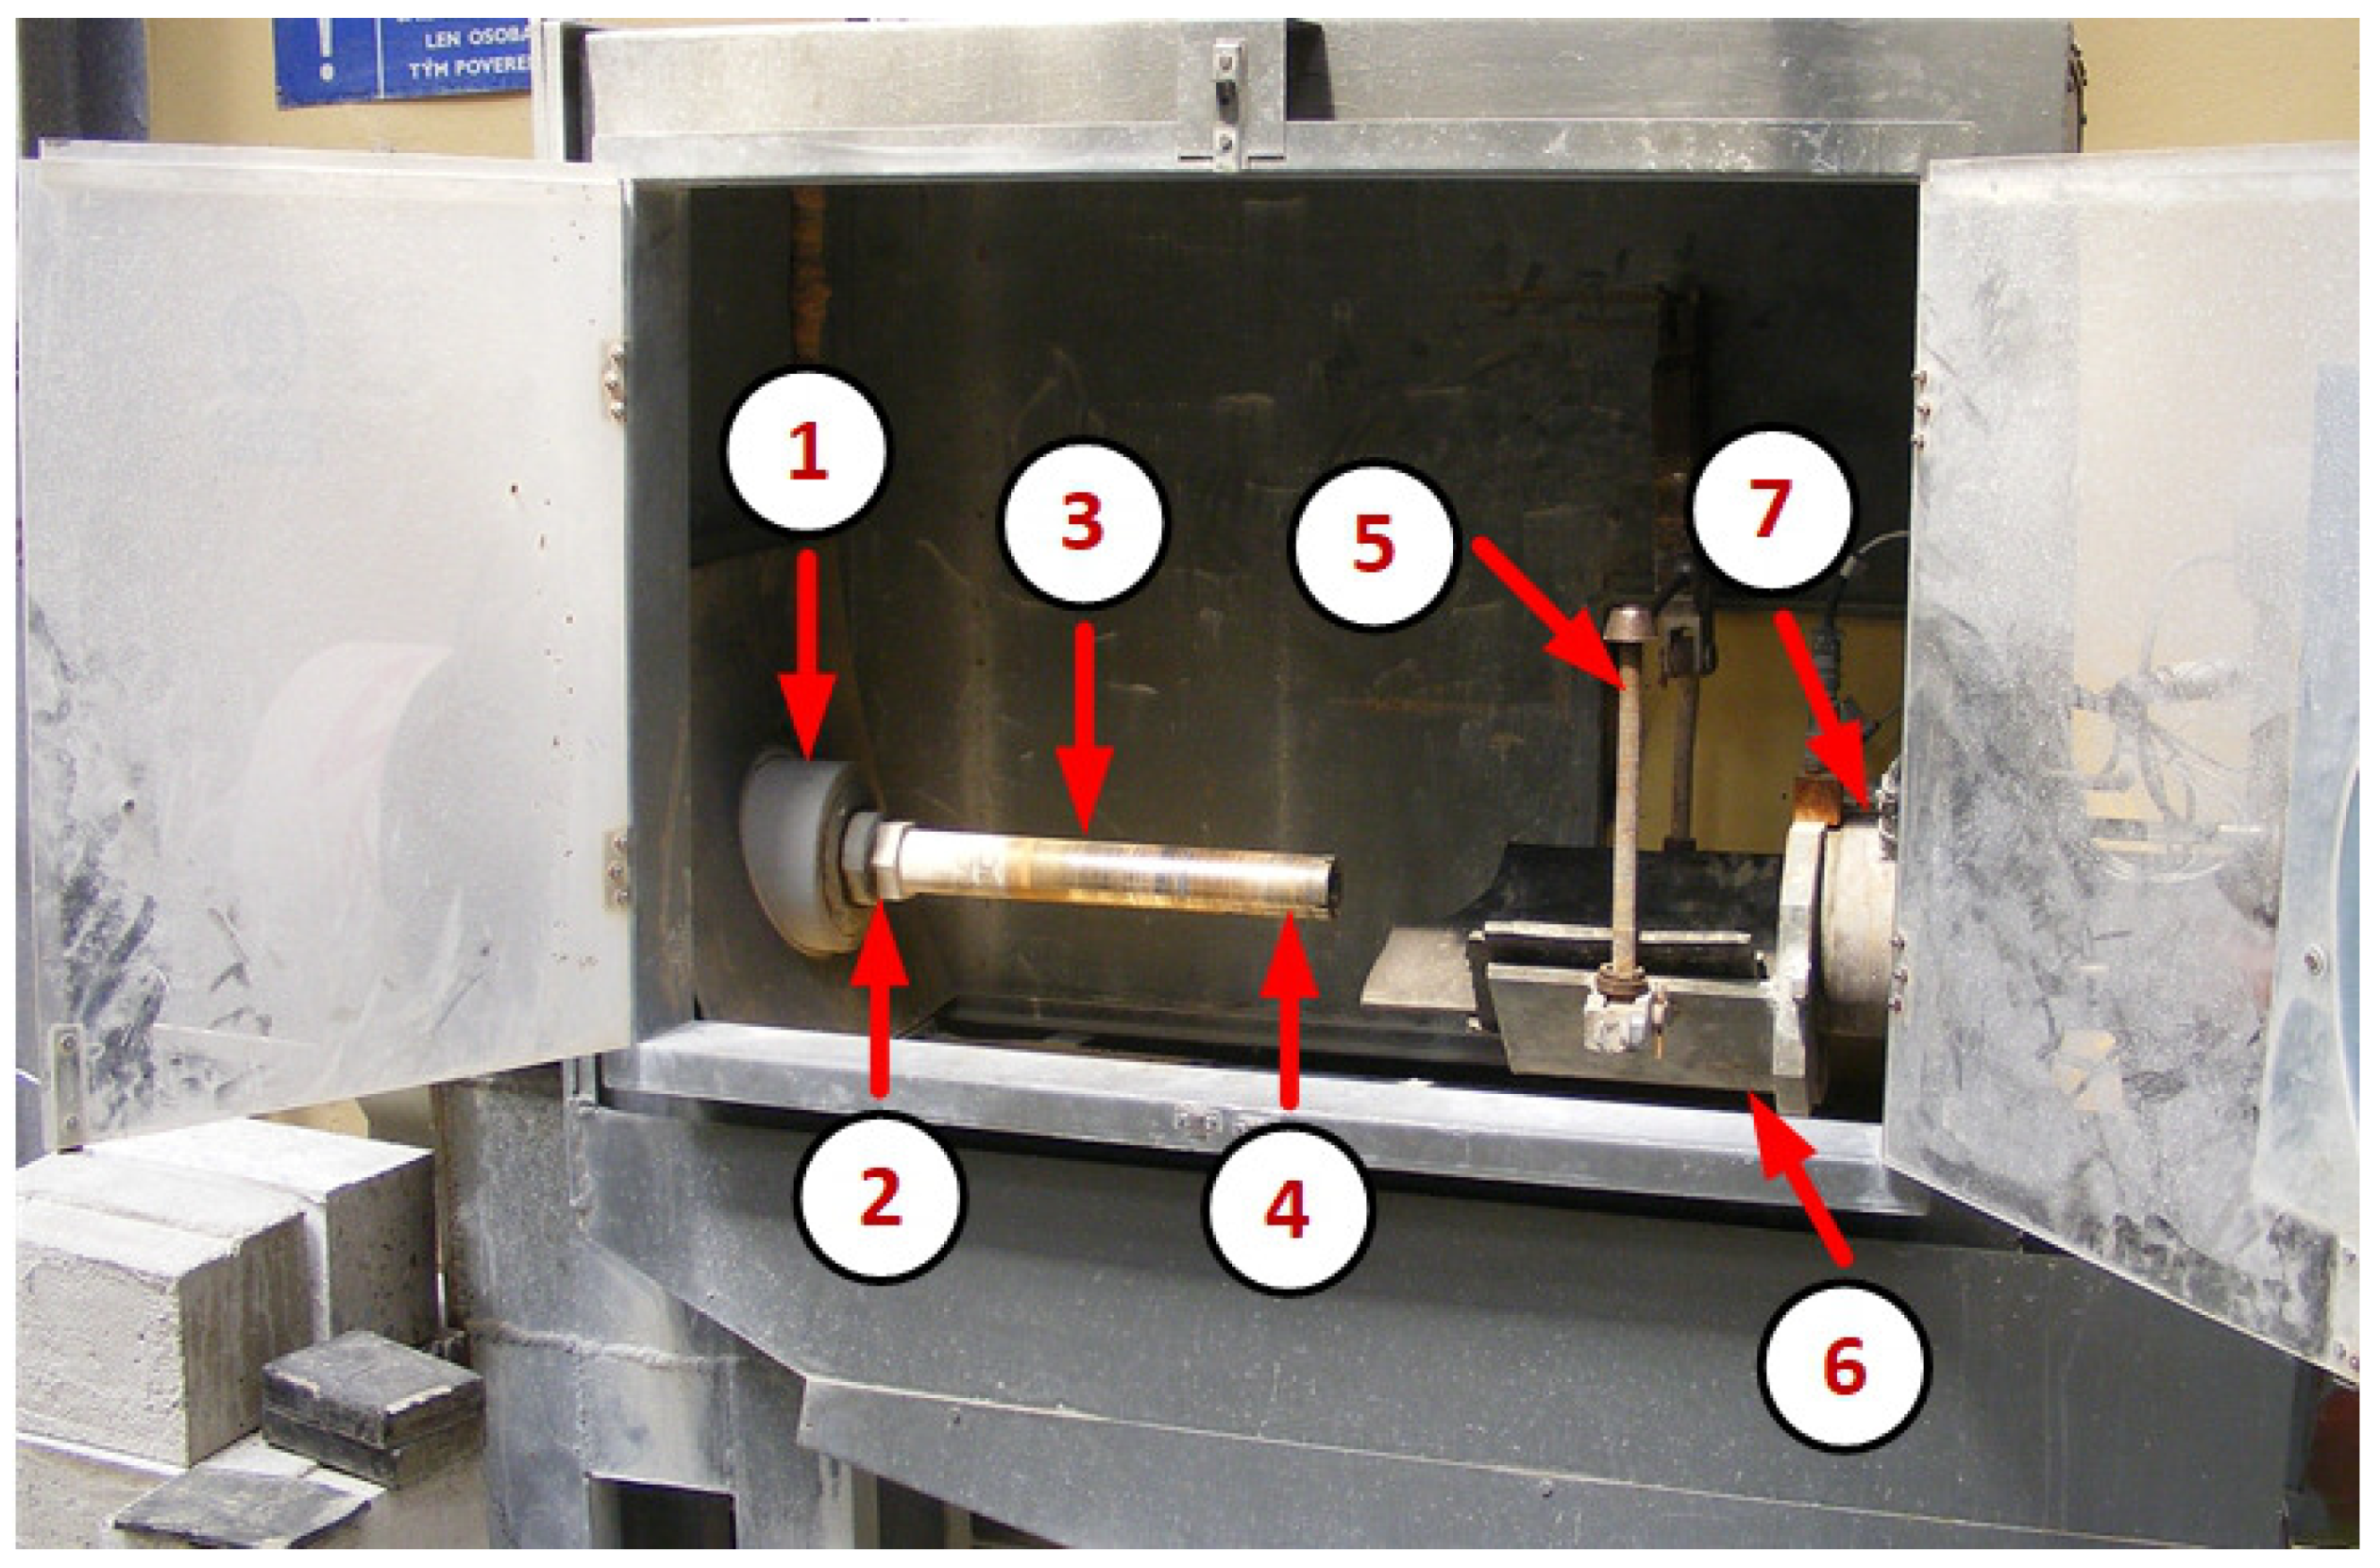
2. Experiments Methodology—Description of the Drilling Stand
- motor only;
- pump only;
- hydro-generator only;
- motor and pump;
- motor and hydro-generator;
- pump and hydro-generator;
- motor, pump, and hydro-generator, tool spindle without the bit;
- motor, pump, and hydro-generator, tool spindle with the bit;
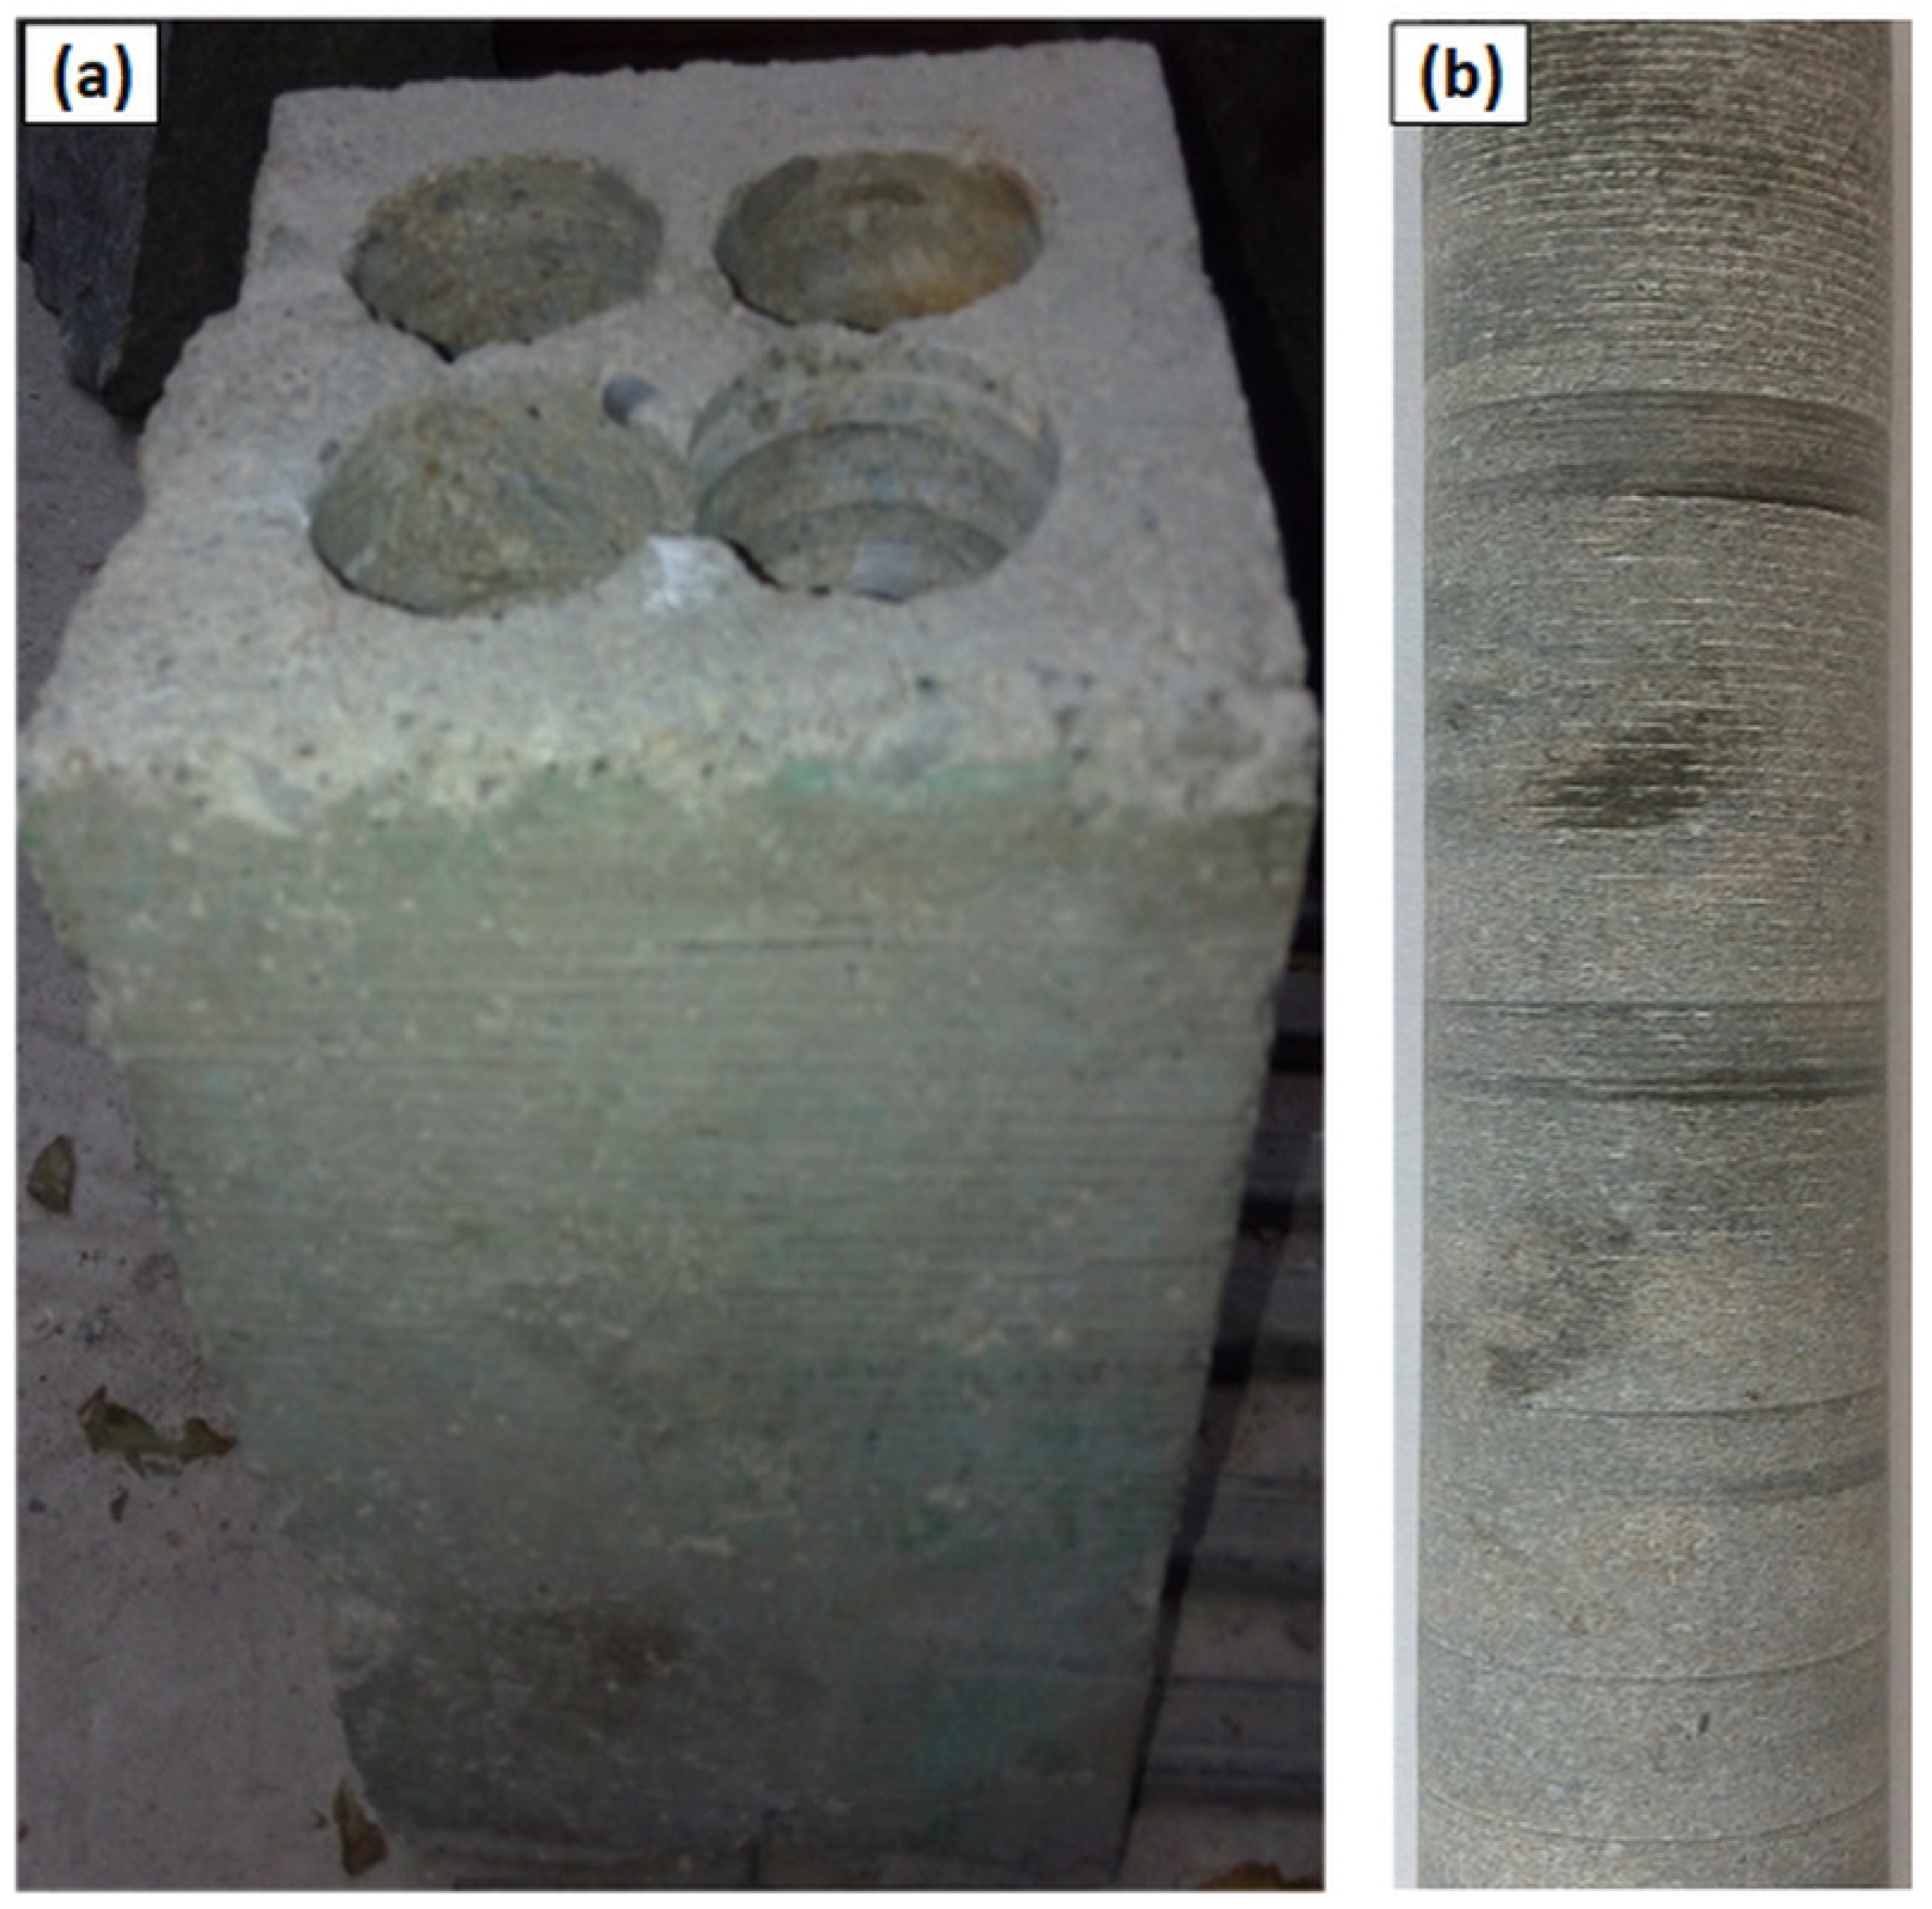
- andesite rock drilling.
- pressure force, F 0—16,000 N;
- revolutions, n 0–2500 rpm, or 0–50 rps;
- torque, Mk 0–200 Nm;
- drilled length, l 0–0.3 m;
- volume flow of water flush, Q 0–1 × 10⁻³ m3s−1;
- speed (velocity) of drilling, v 0–16.8 × 10⁻³ ms−1.
3. Theoretical Background and Calculation
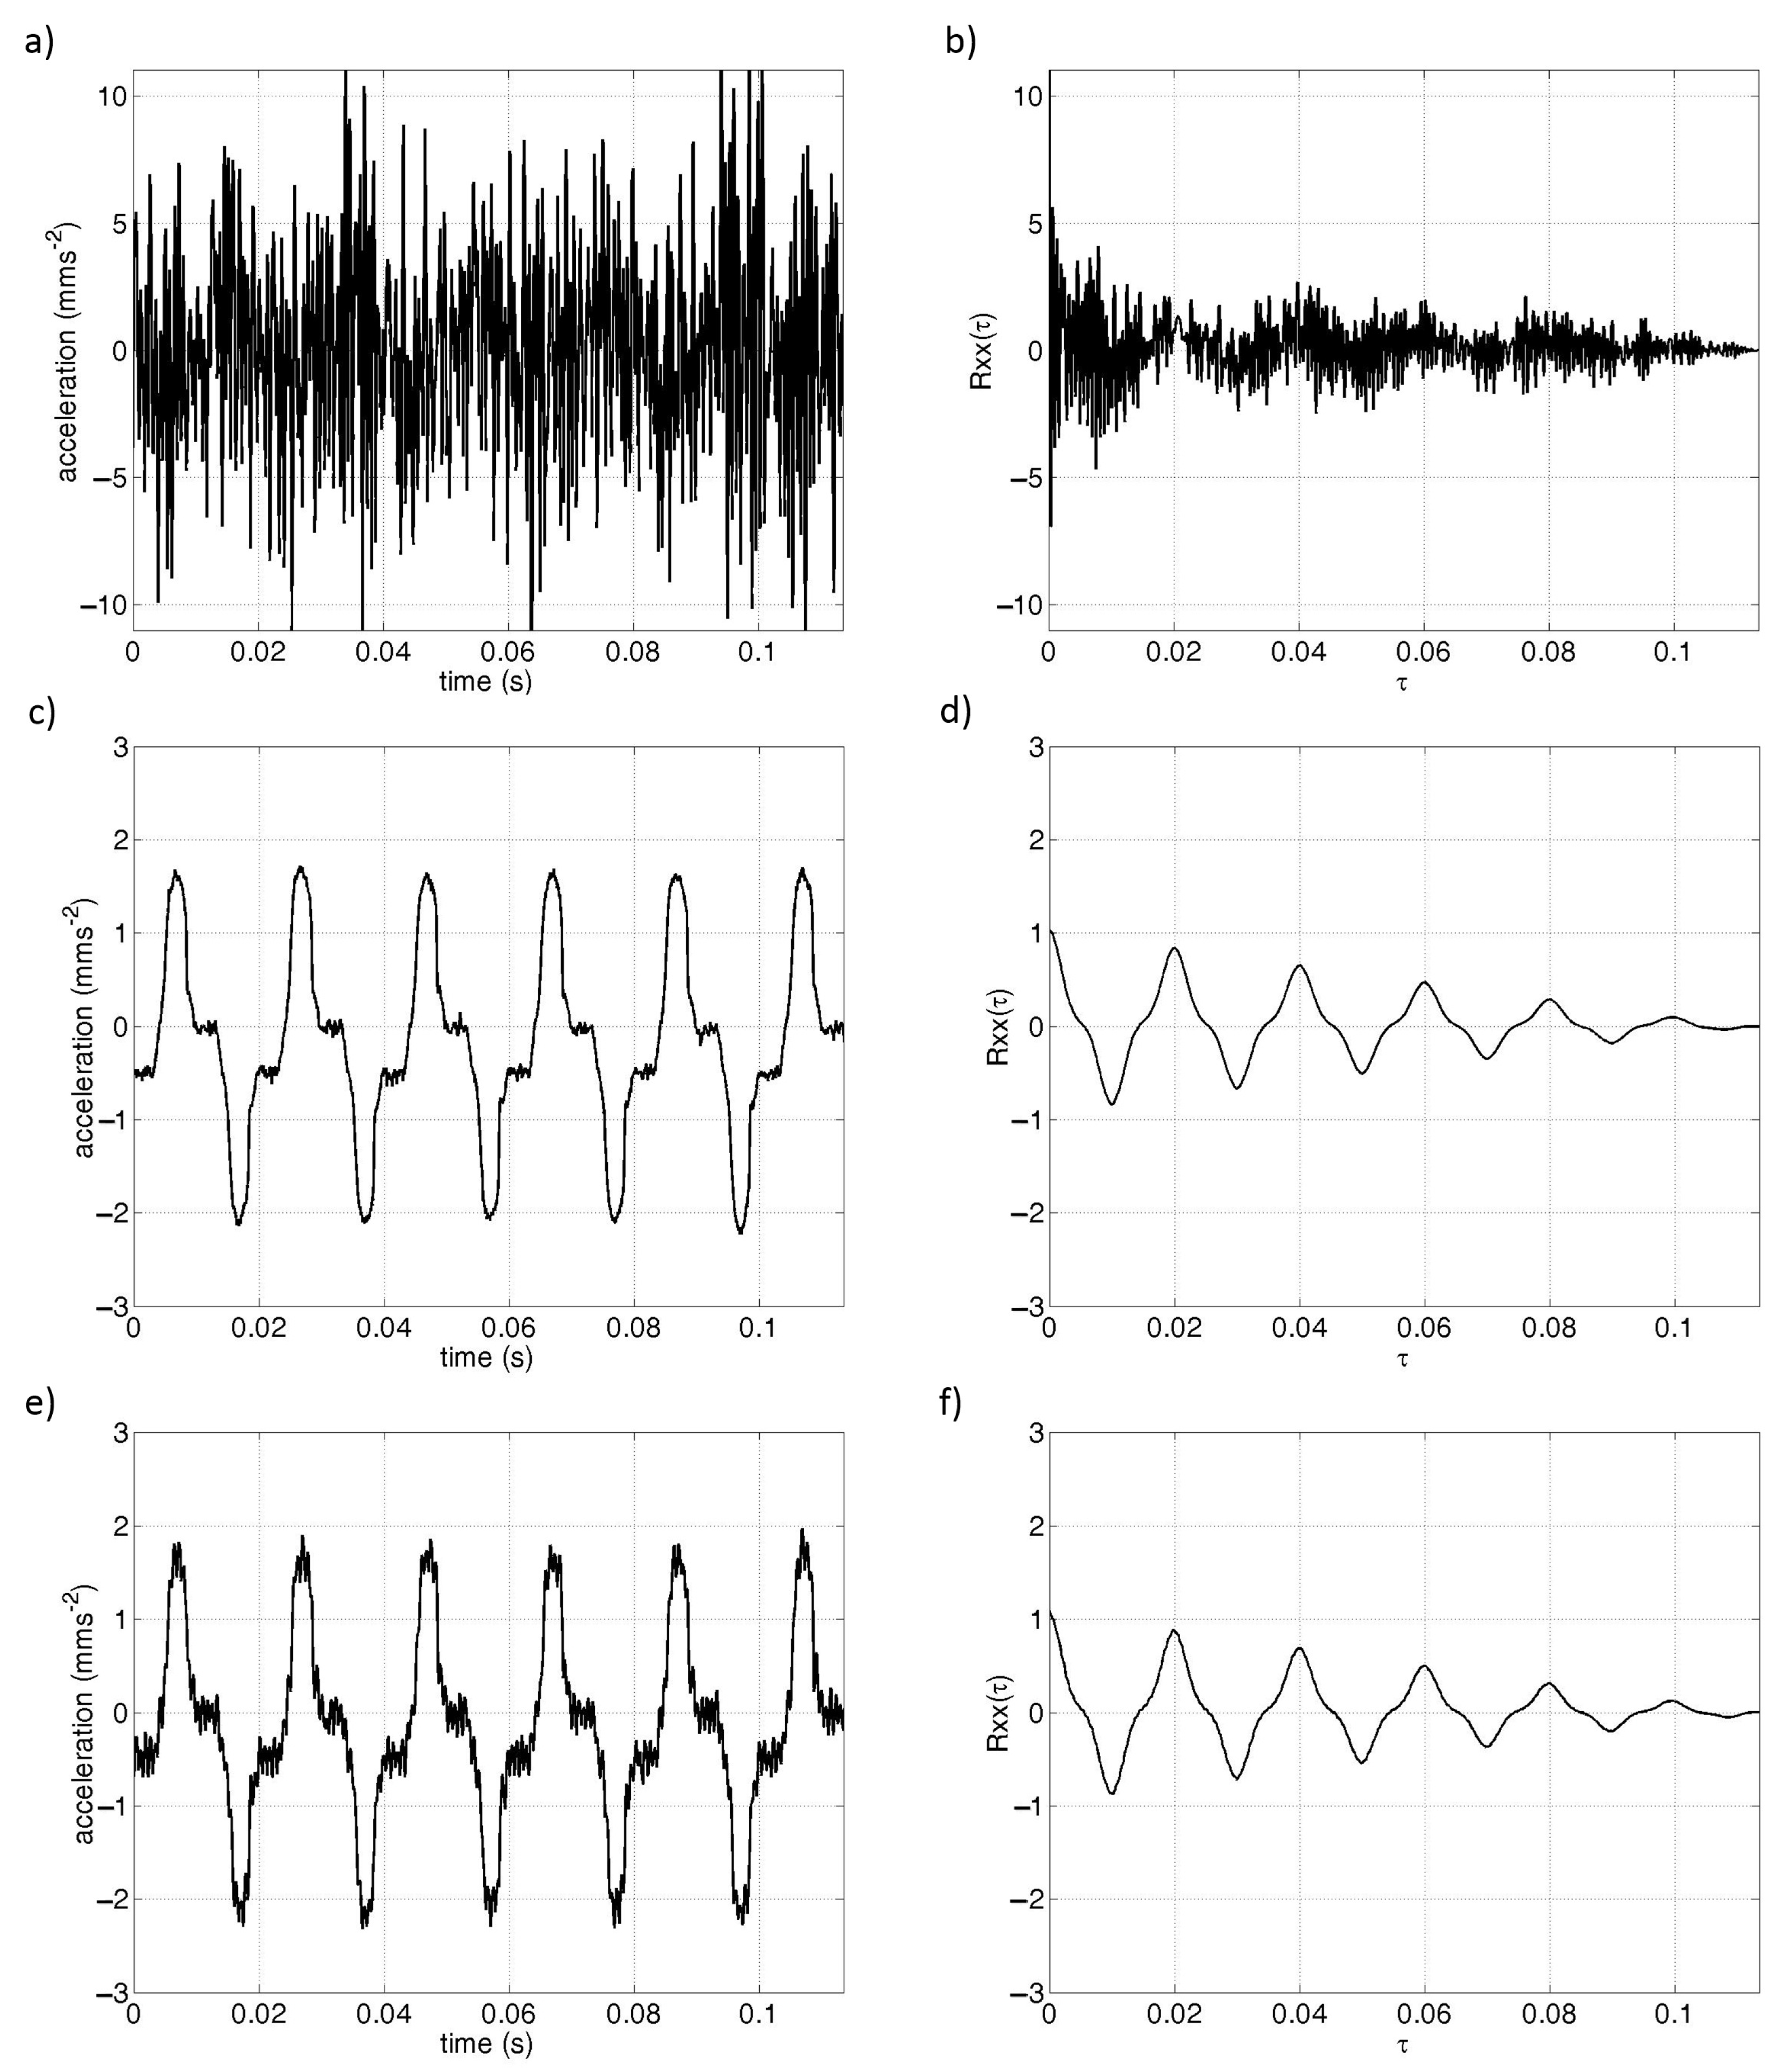
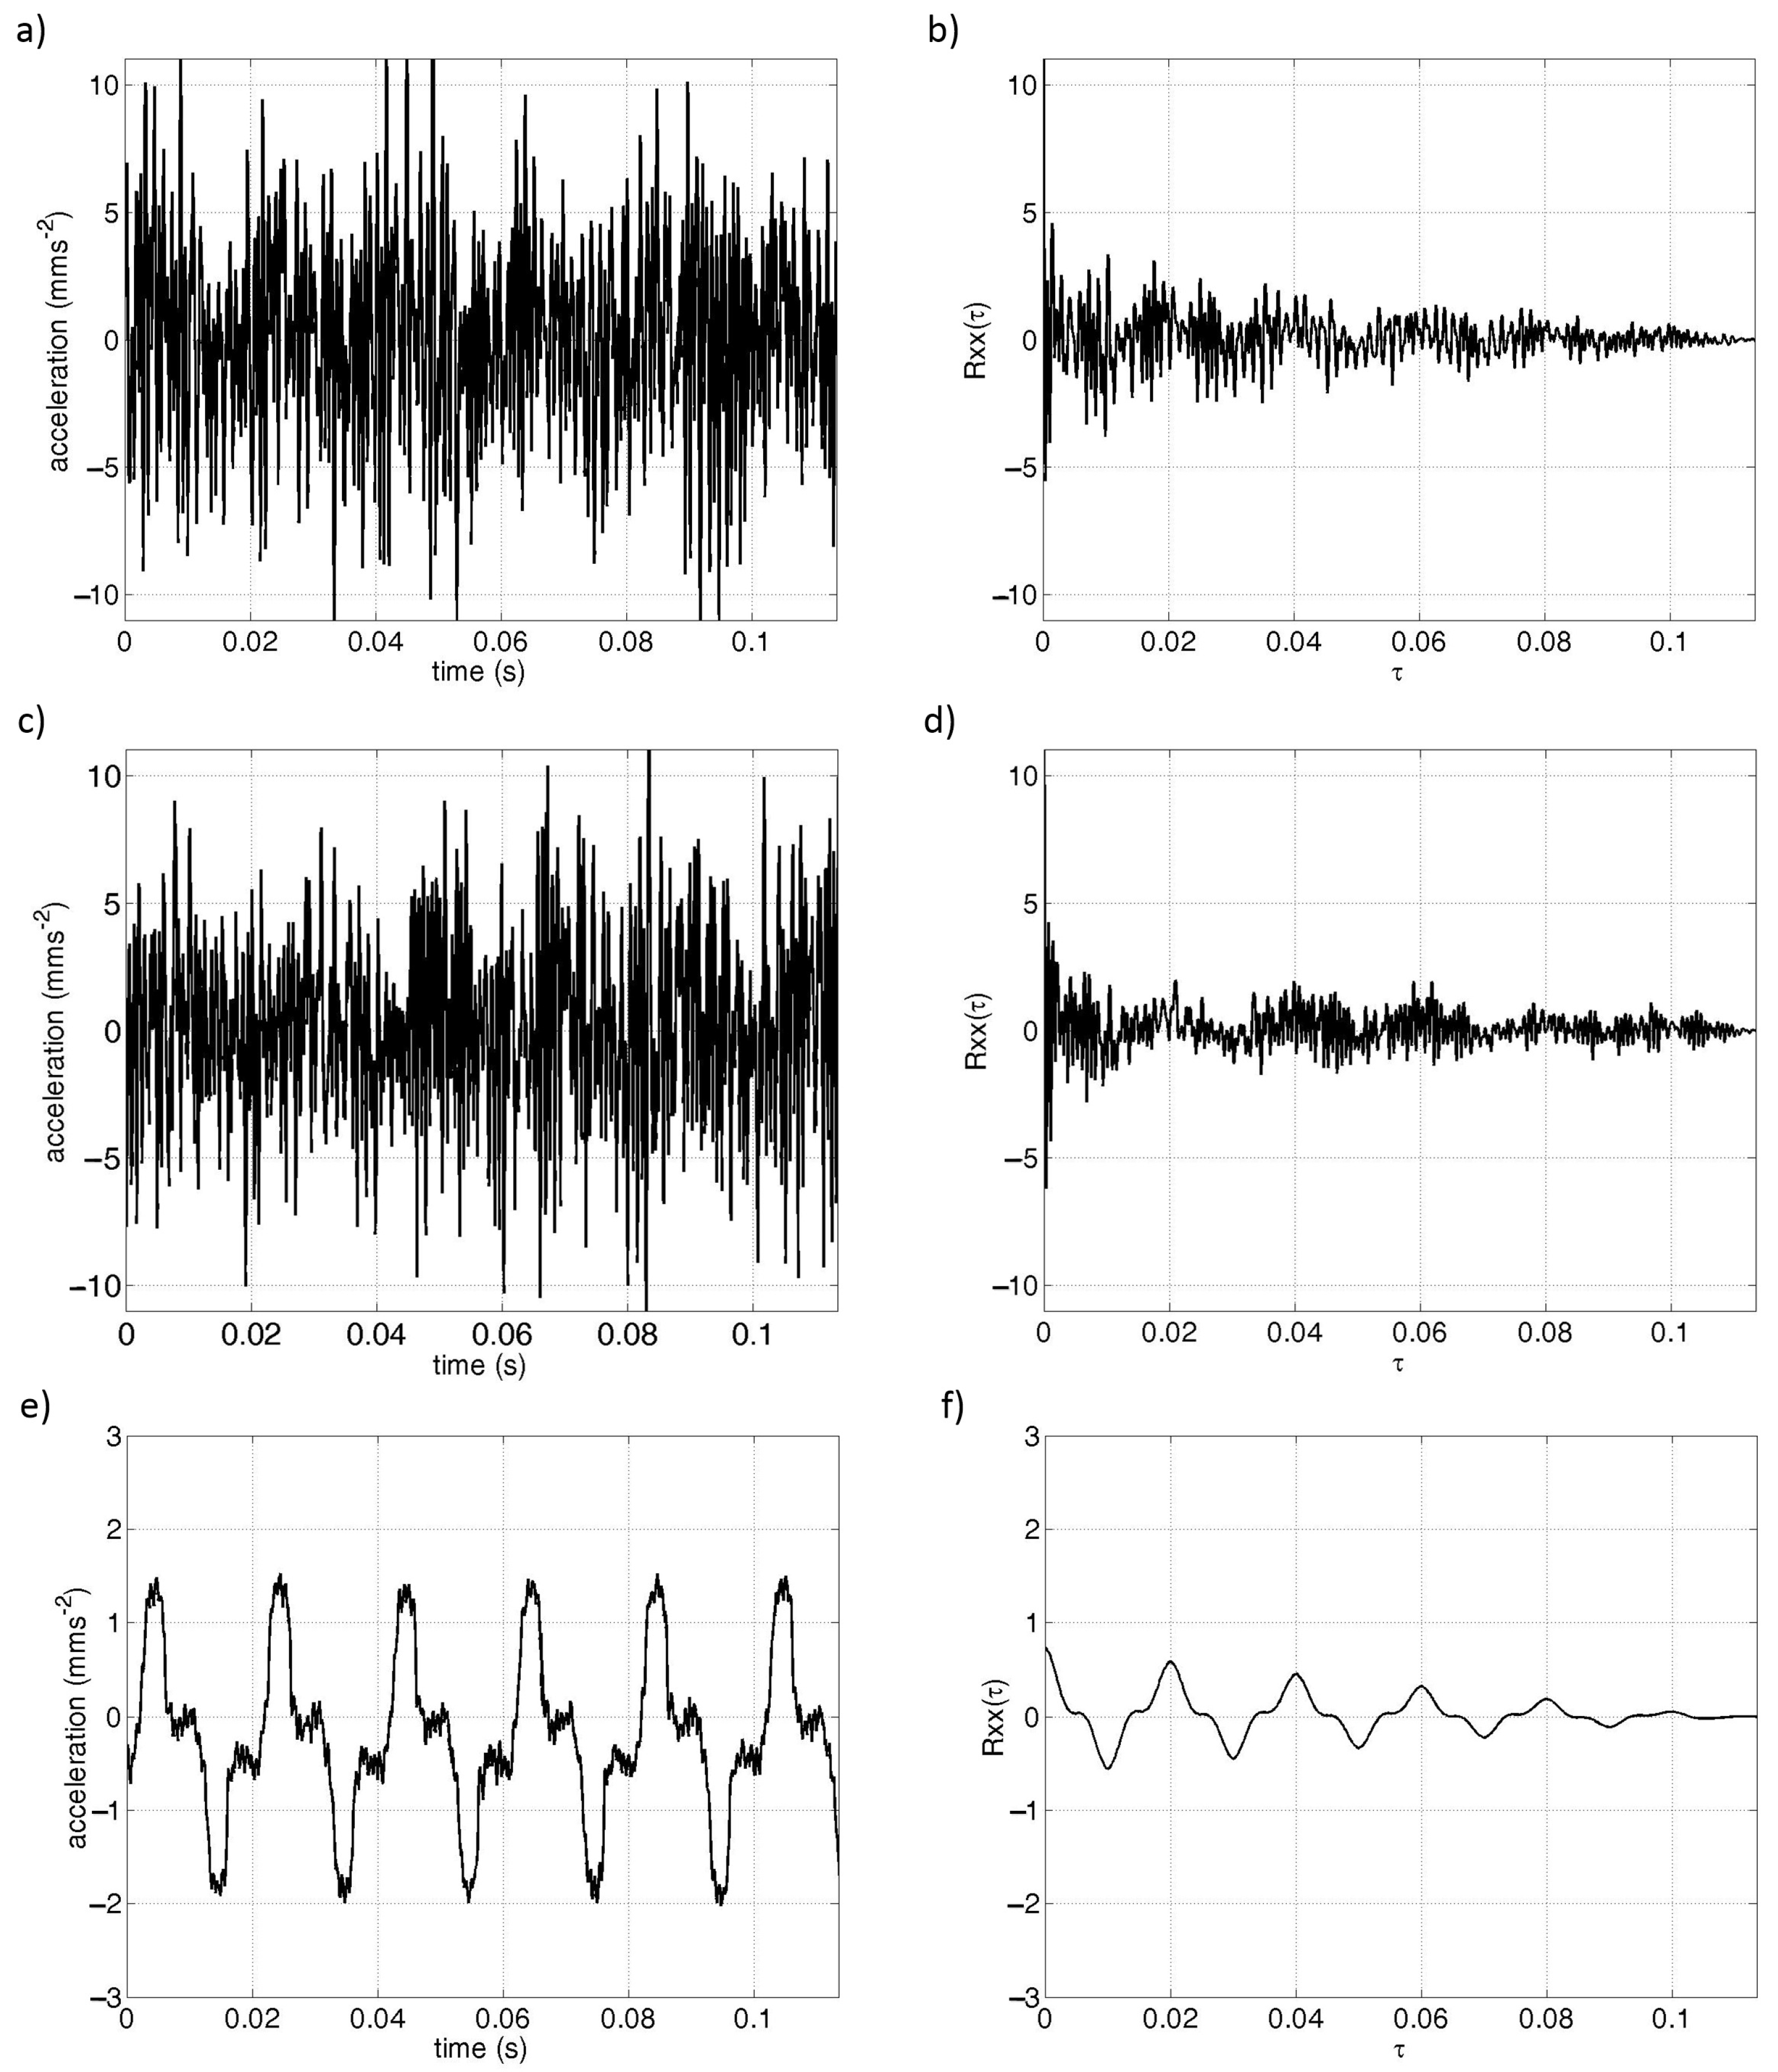
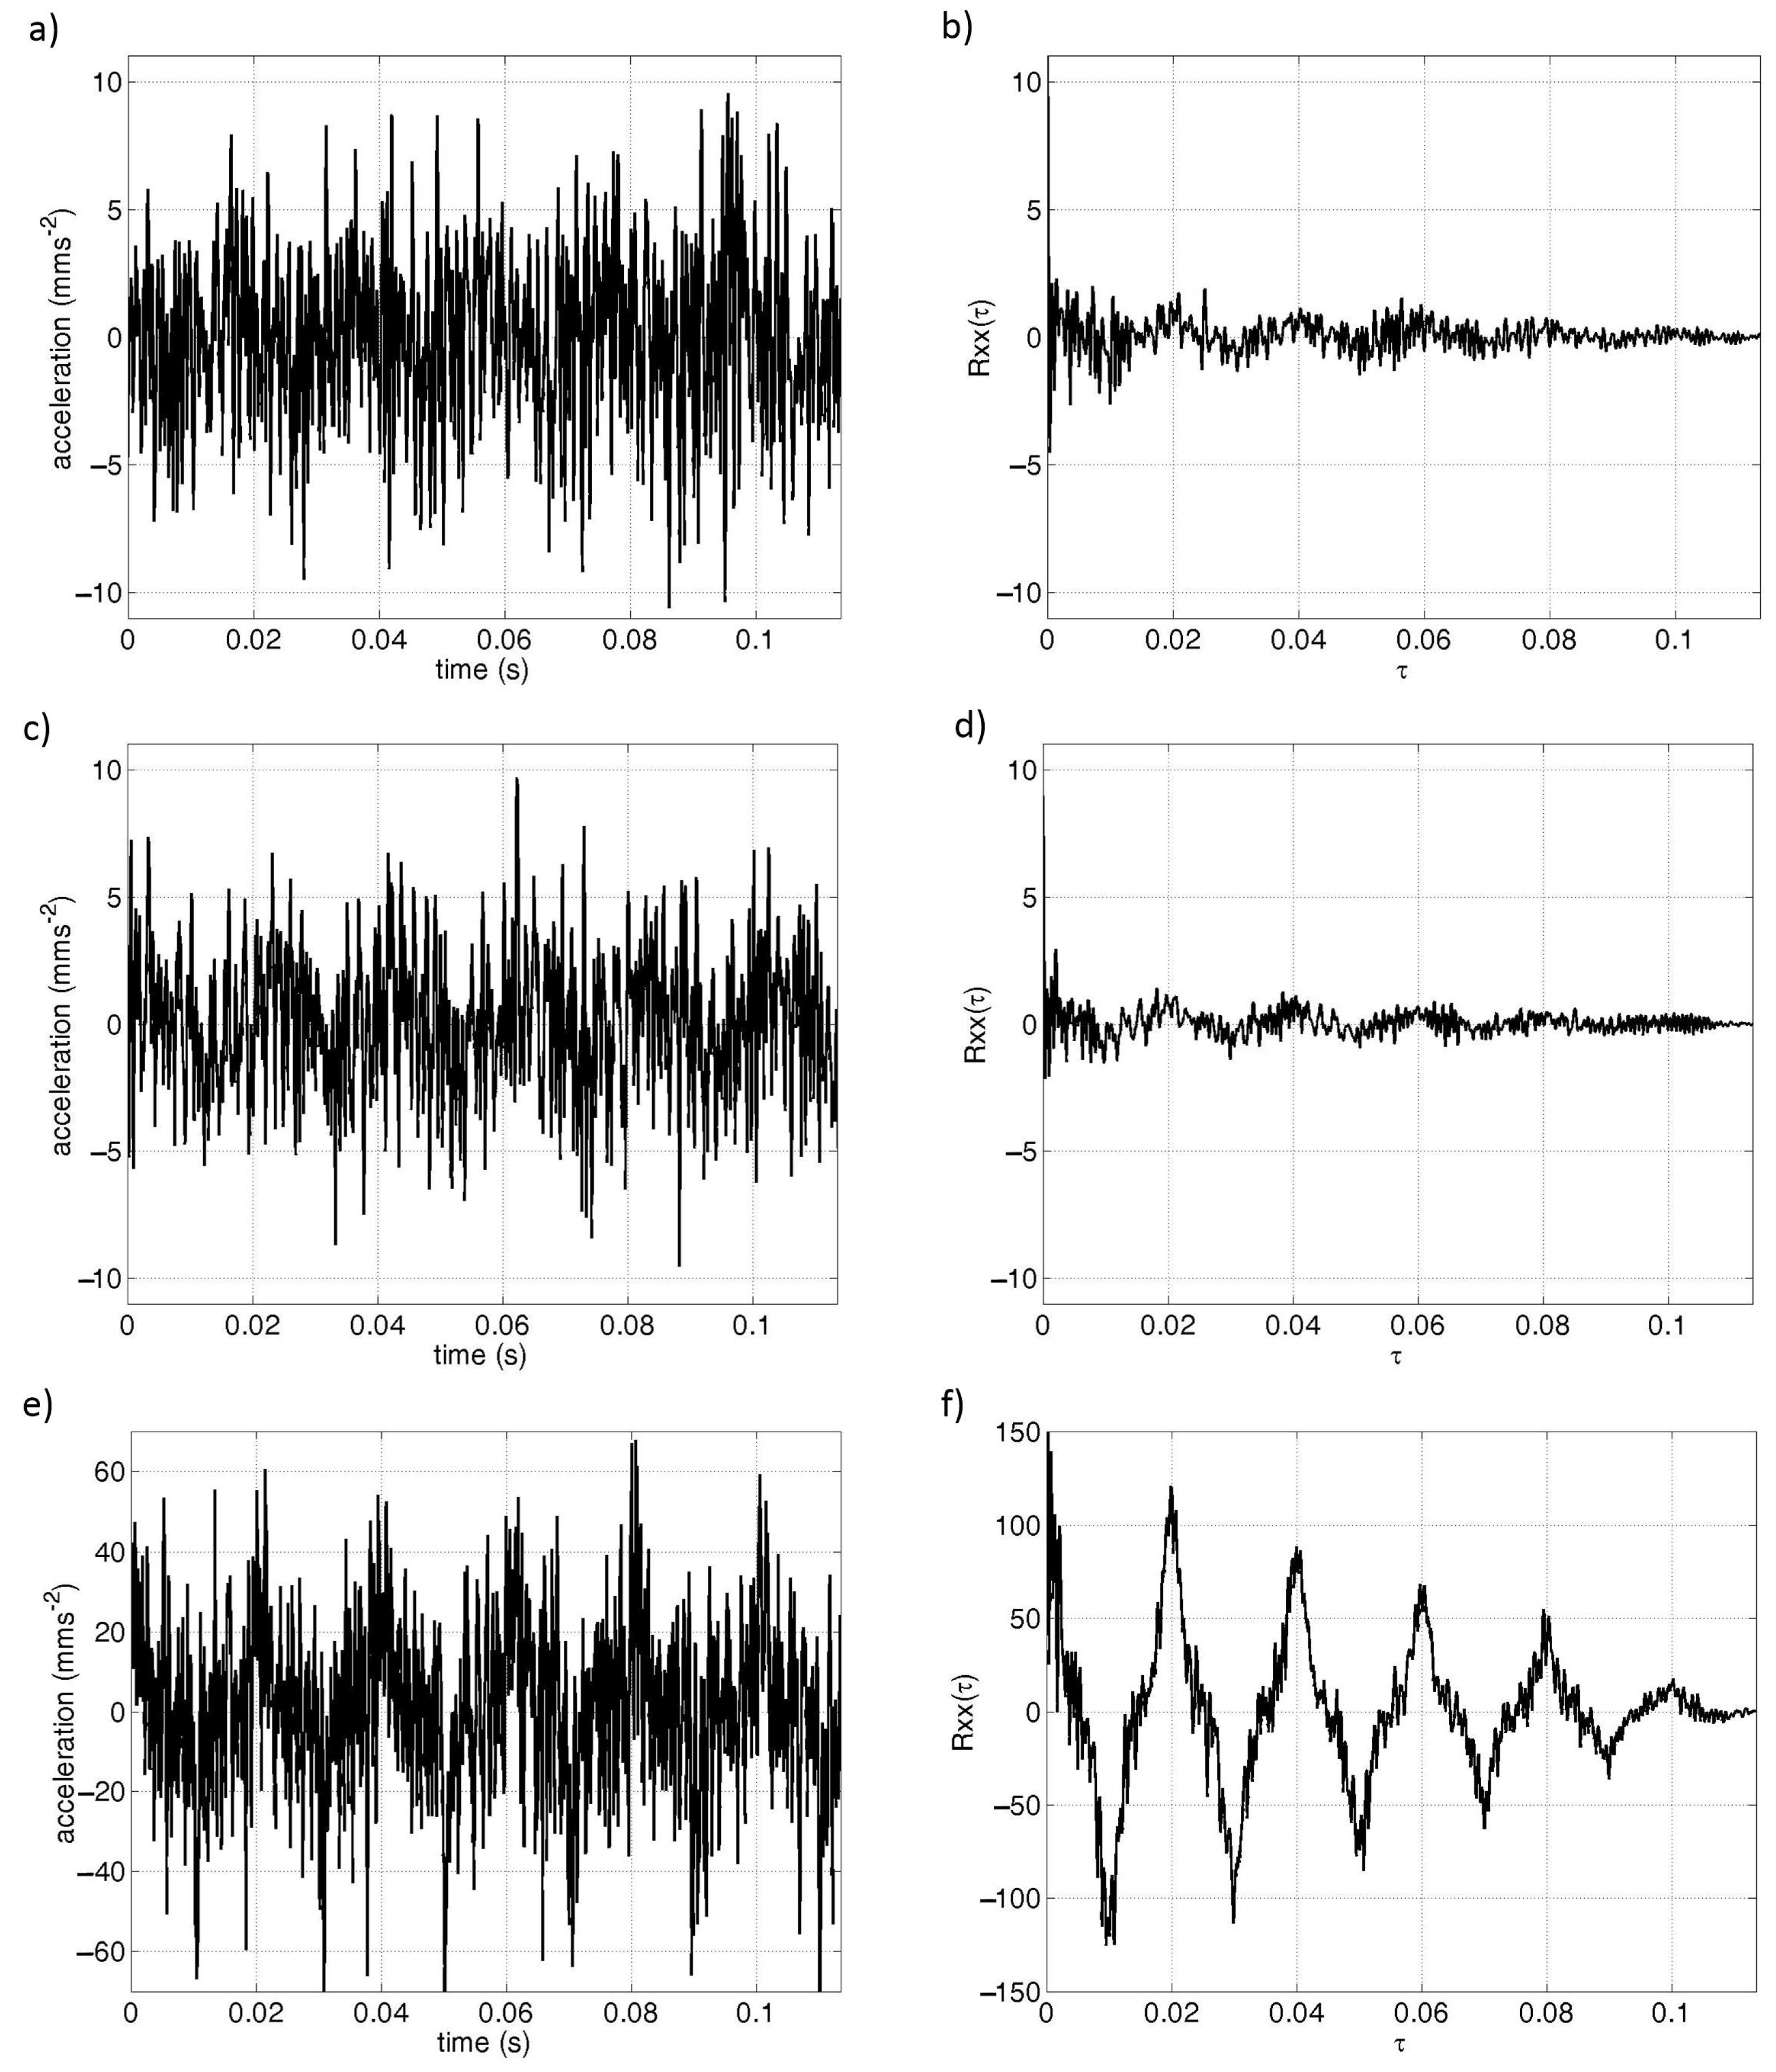
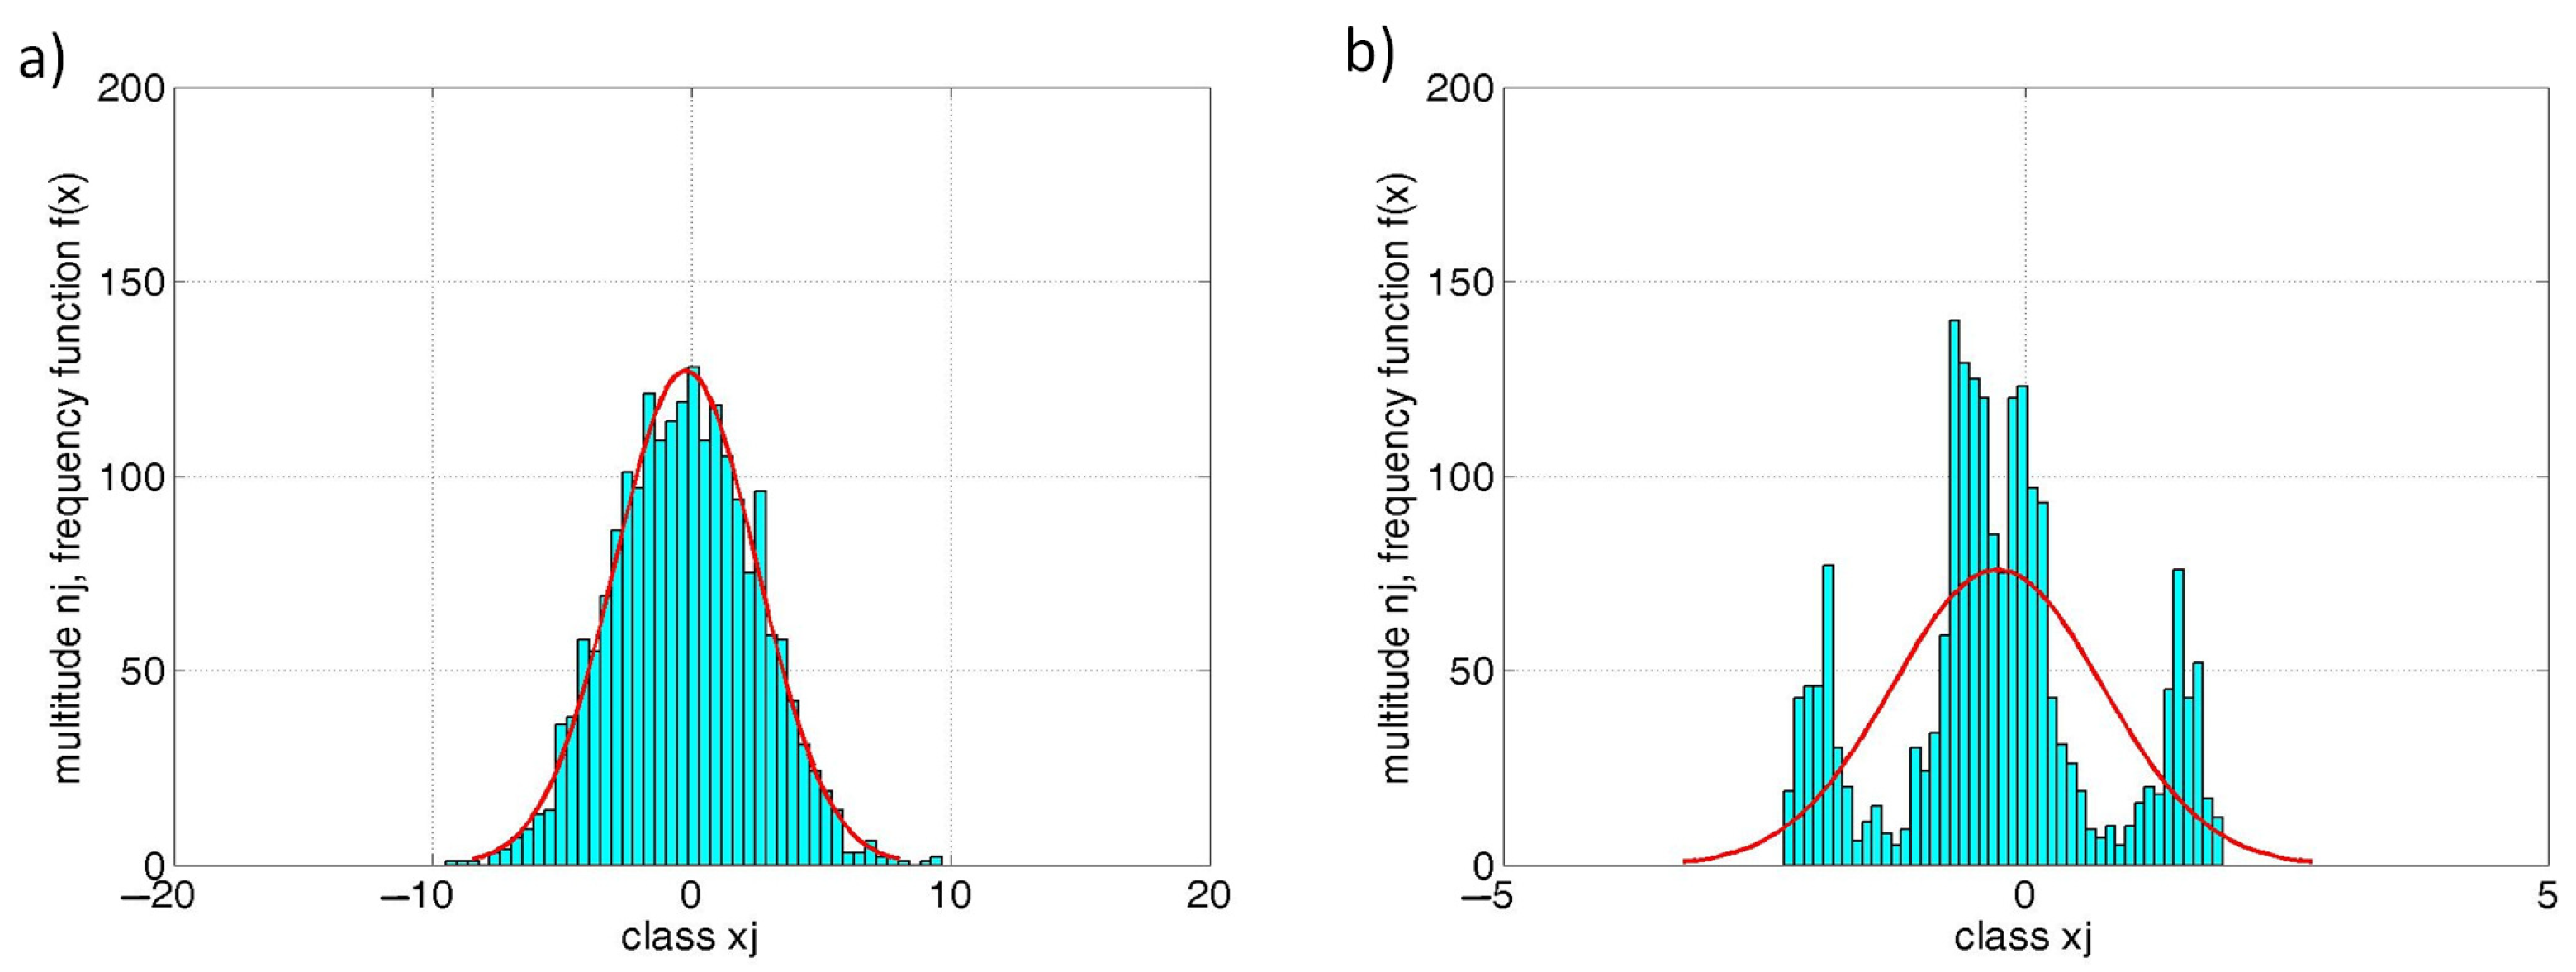
3.1. Time Domain Vibration Analysis
- amplitude , which is the instantaneous value of the monitored signal parameter in time t;
- peak , that represents the maximum distance of the peak of the wave from the reference value, usually the x-axis;
- peak-to-peak , which is the maximum distance of opposite peaks of the wave;
- the average value that represents the average value of the amplitude during the wave according to the equation:
- effective value (Root Mean Square—RMS) which is the objective value used in the diagnostic guidelines, determined by the equation [33]:
3.2. Frequency Domain Vibration Analysis
- frequency range represents the baseband from 0 Hz to ;
- “zoom” factor, when using a frequency magnifier, indicates how many times the frequency range is smaller;
- the number of spectral lines is usually ;
- the sequence number of the spectral line;
- frequency analysis resolution, indicating the spacing between the spectral lines.
3.3. Time-Frequency Domain Vibration Analysis
4. Experimental Results and Analysis
4.1. Vibration Signal Processing in the Time Domain
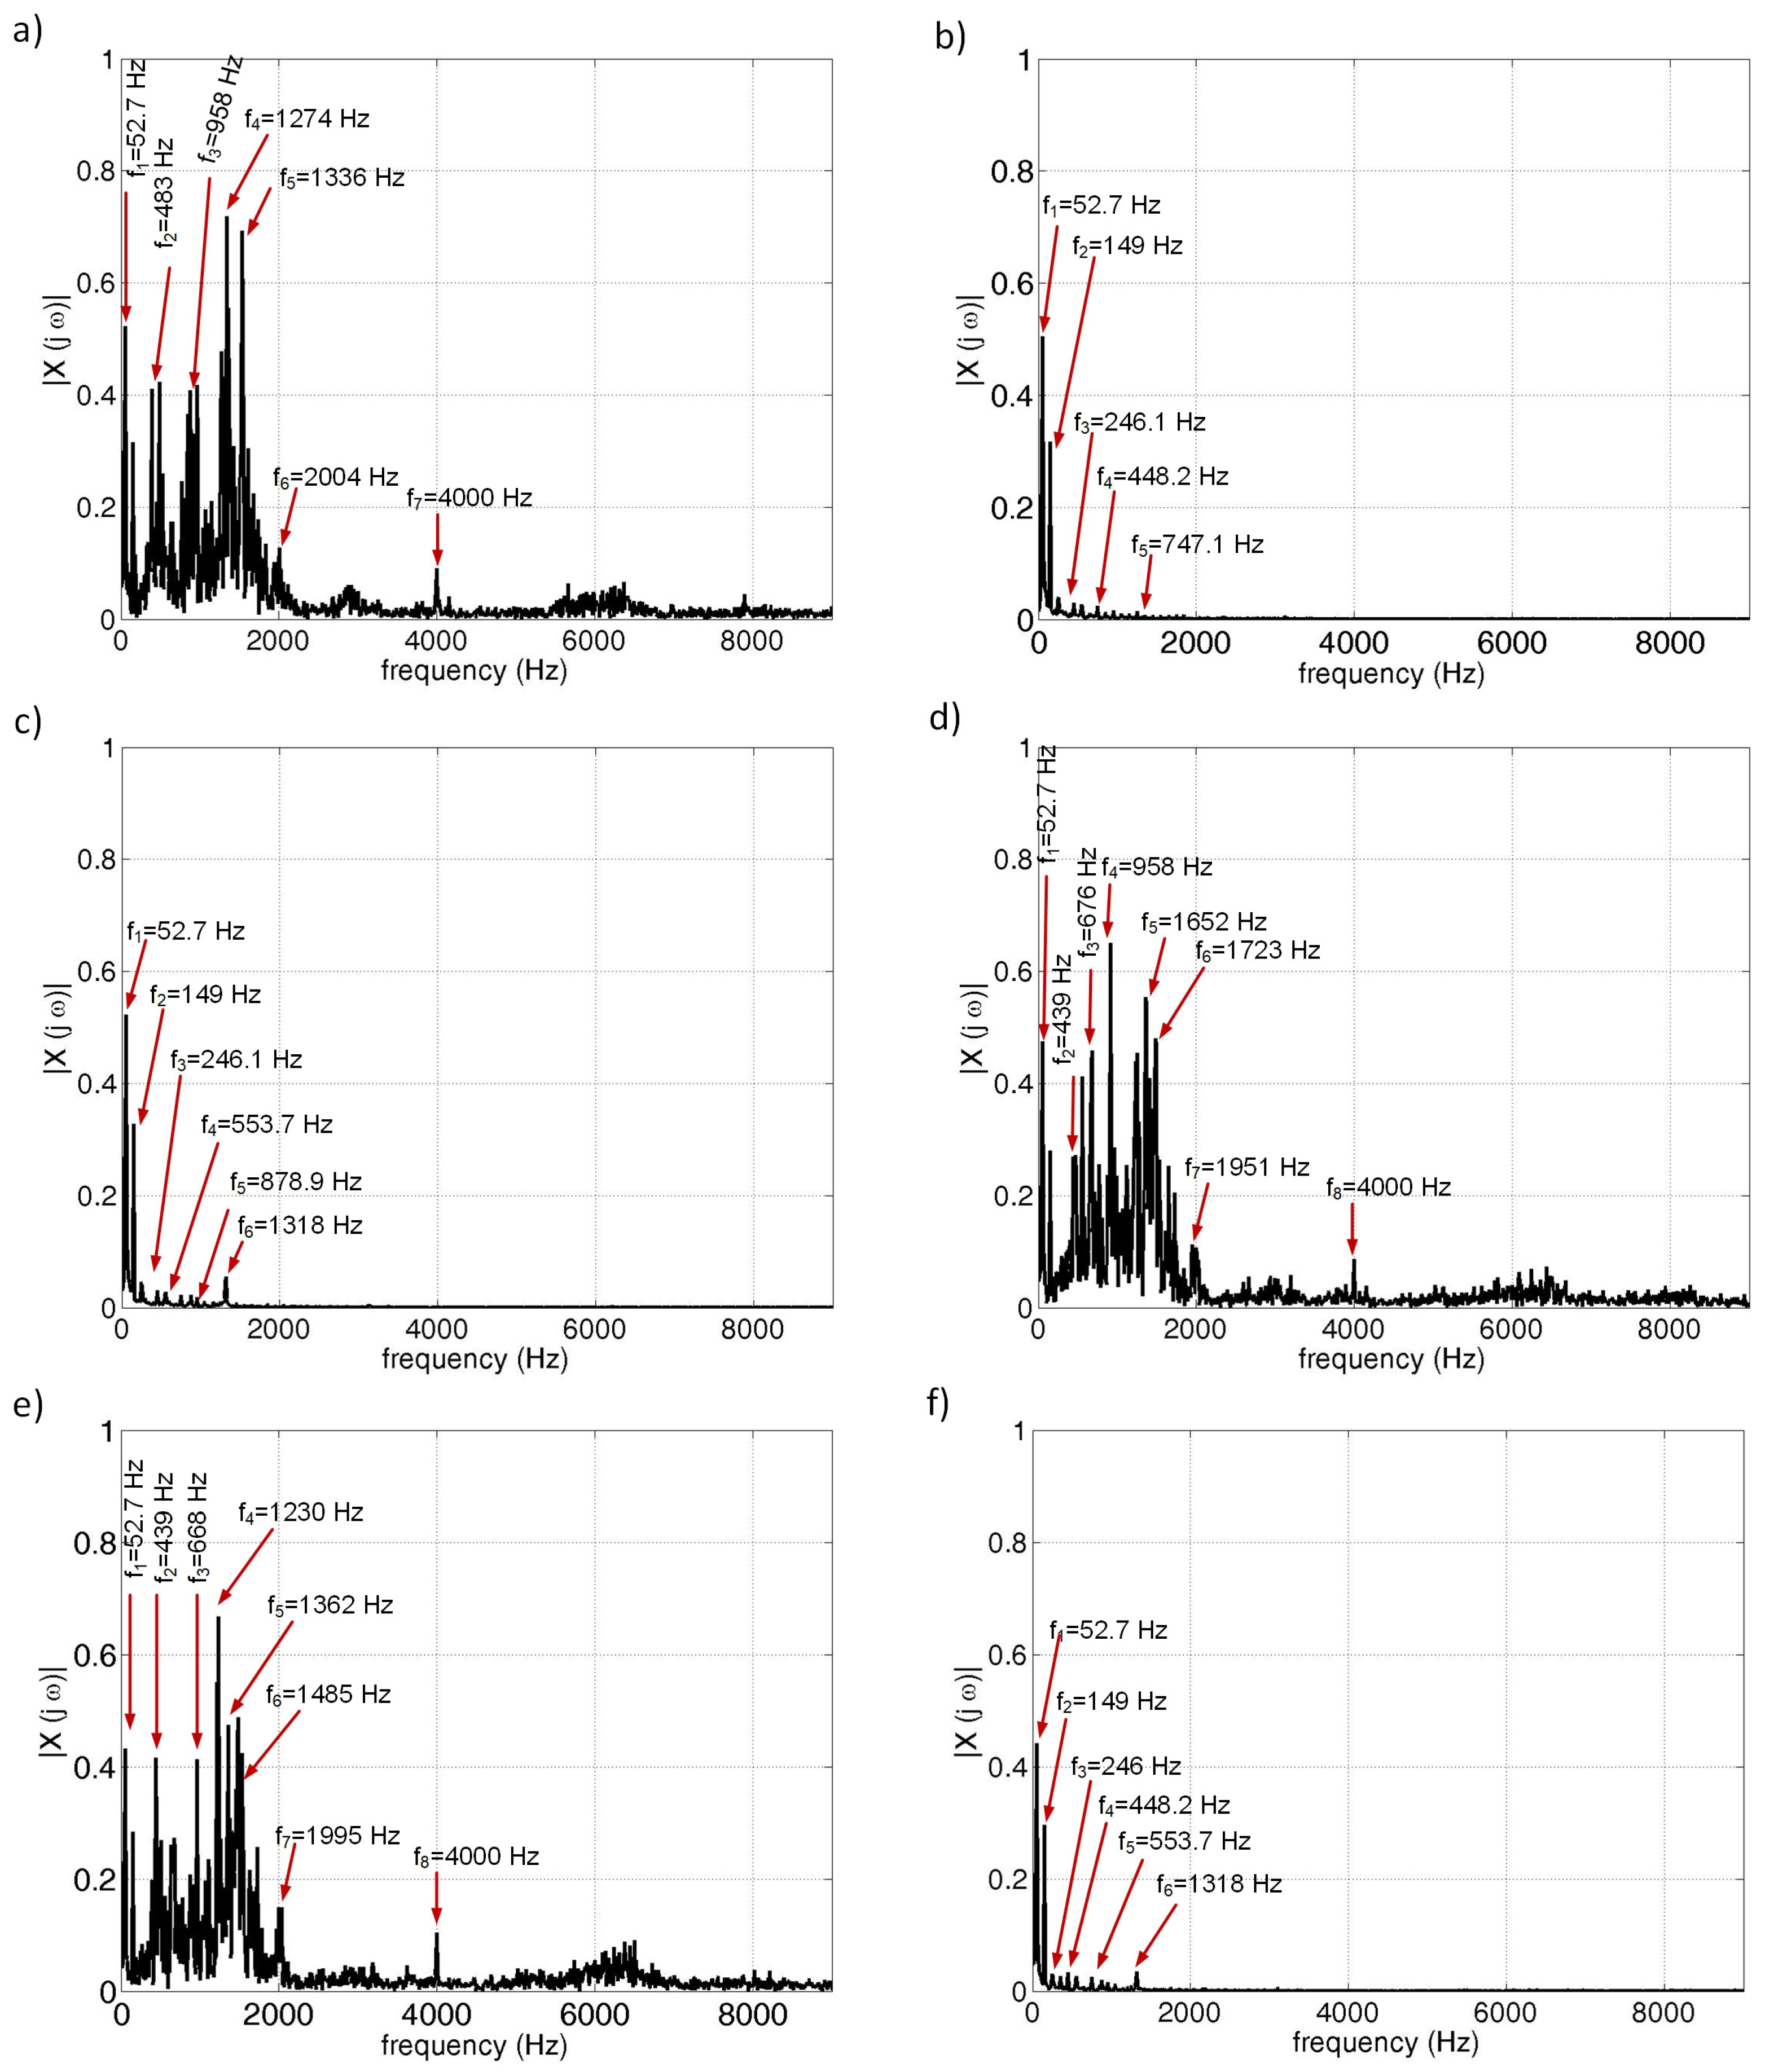
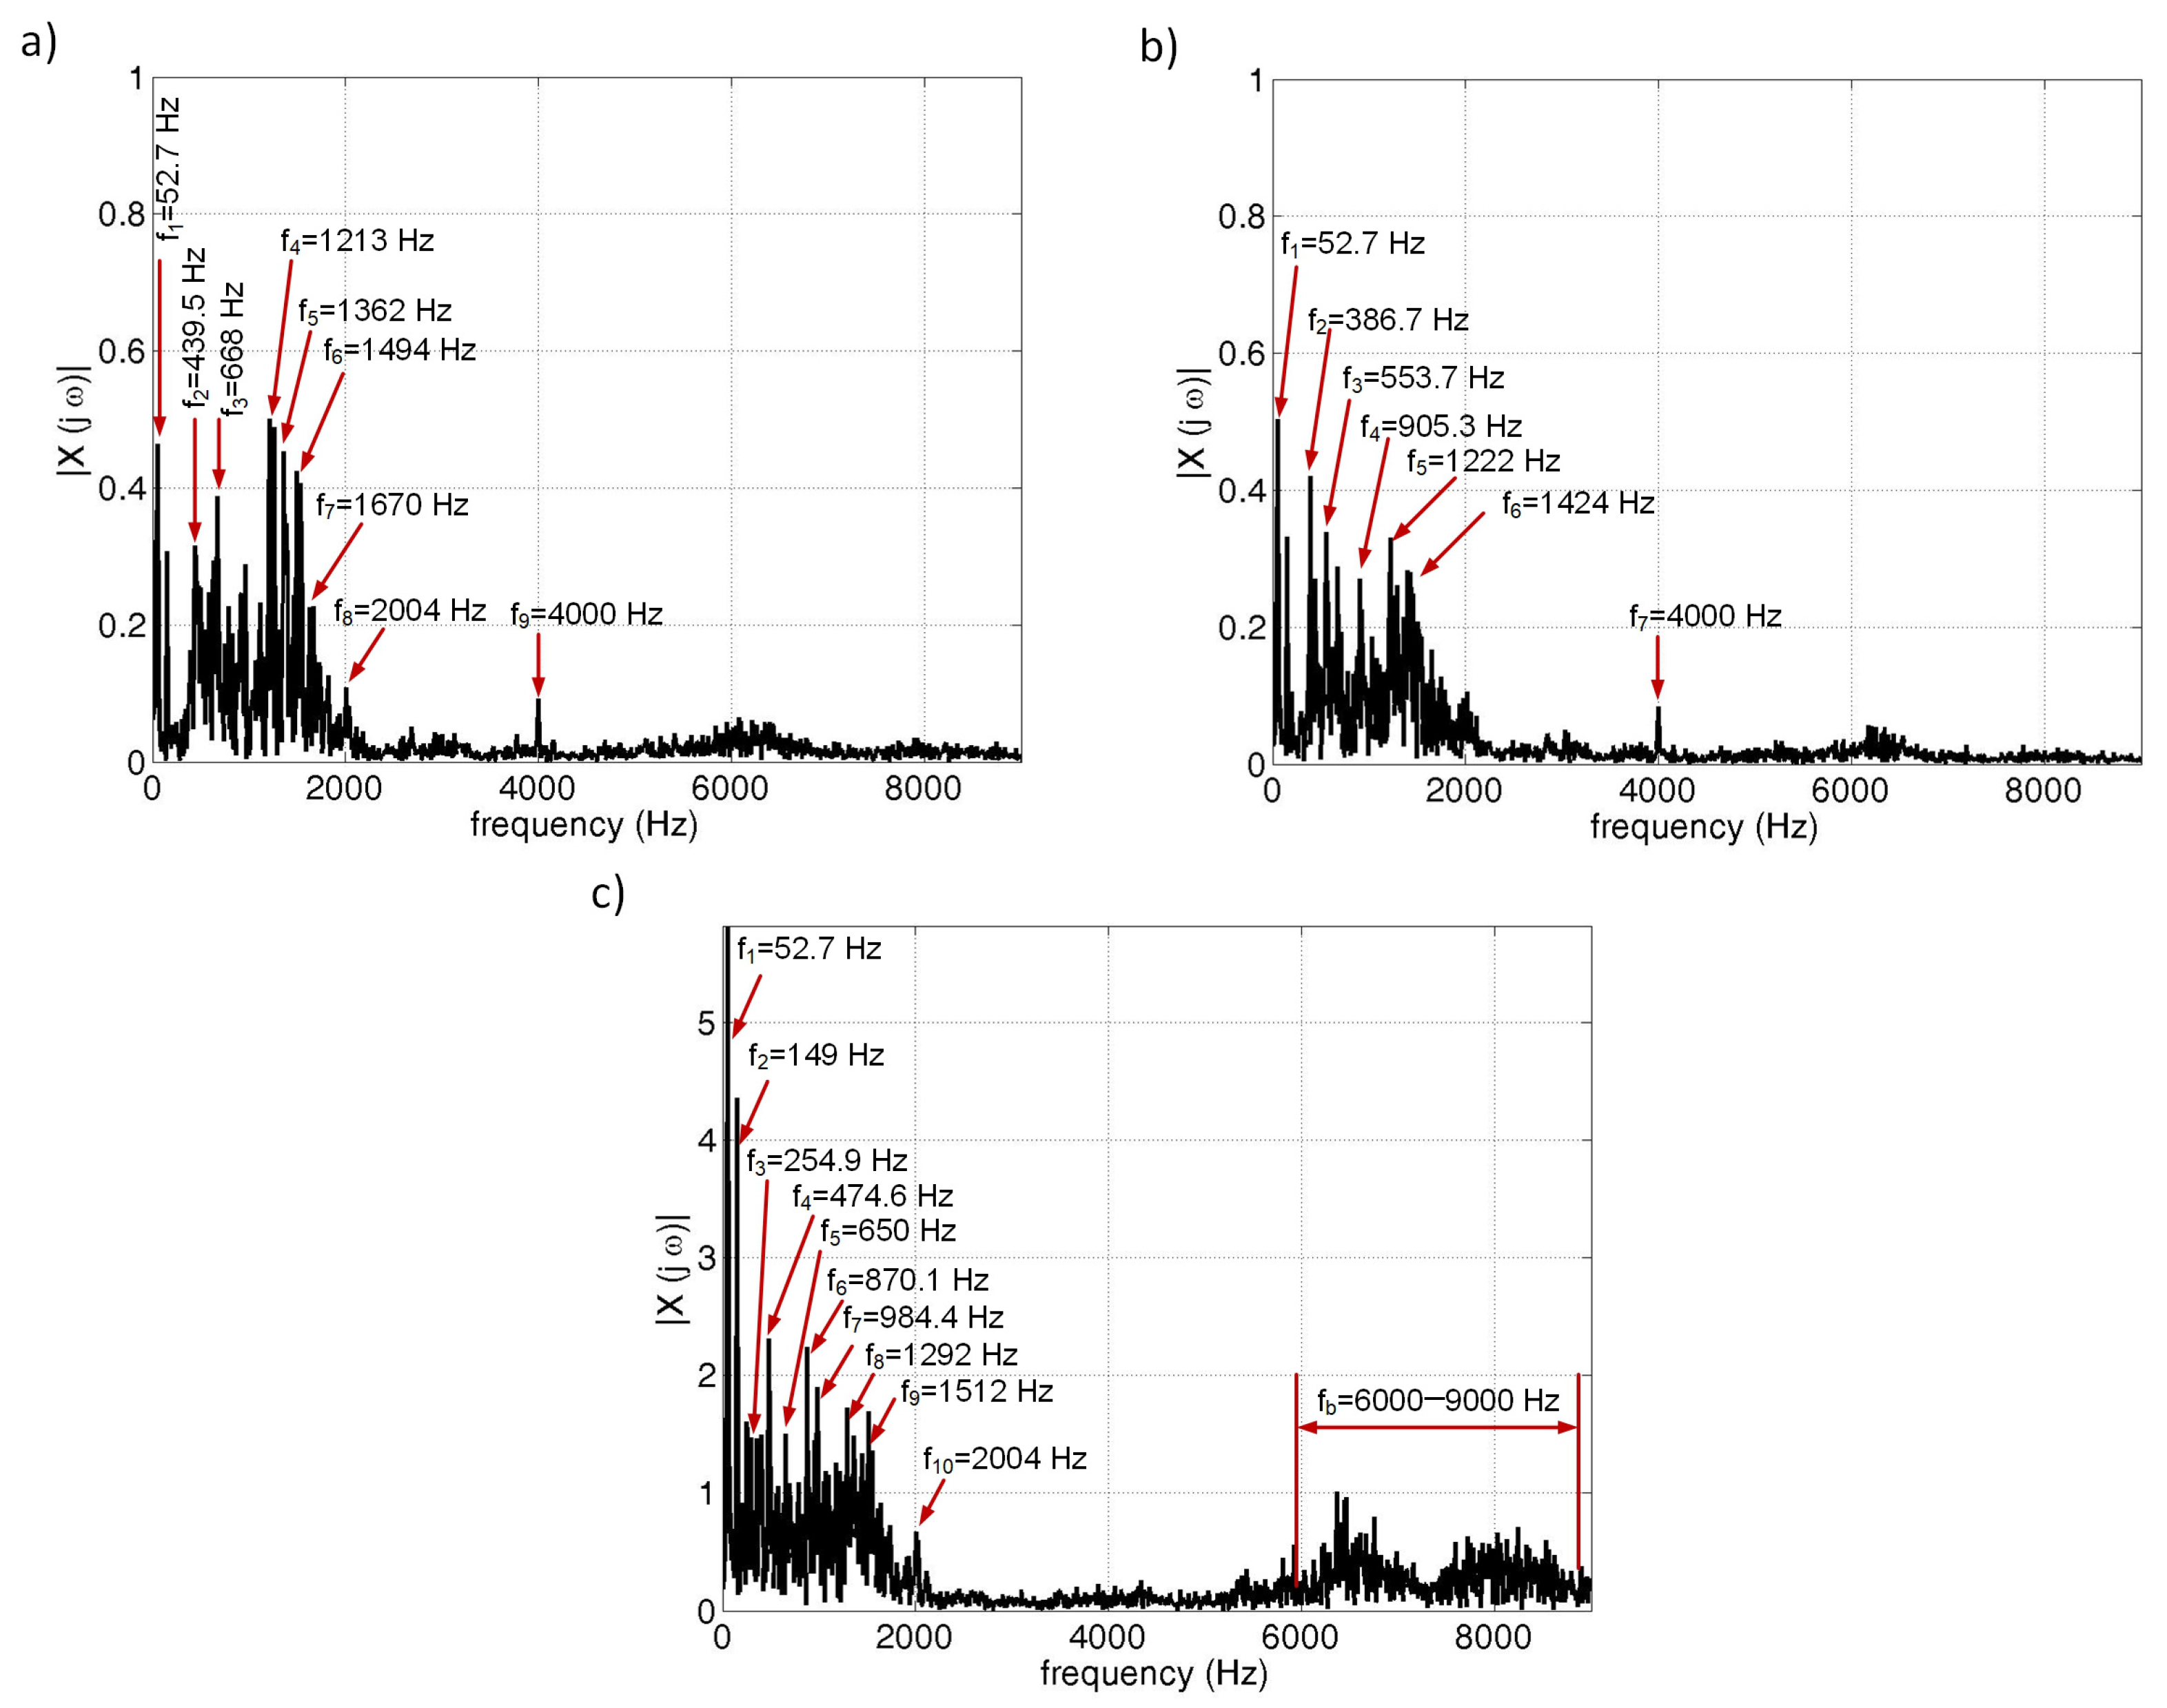
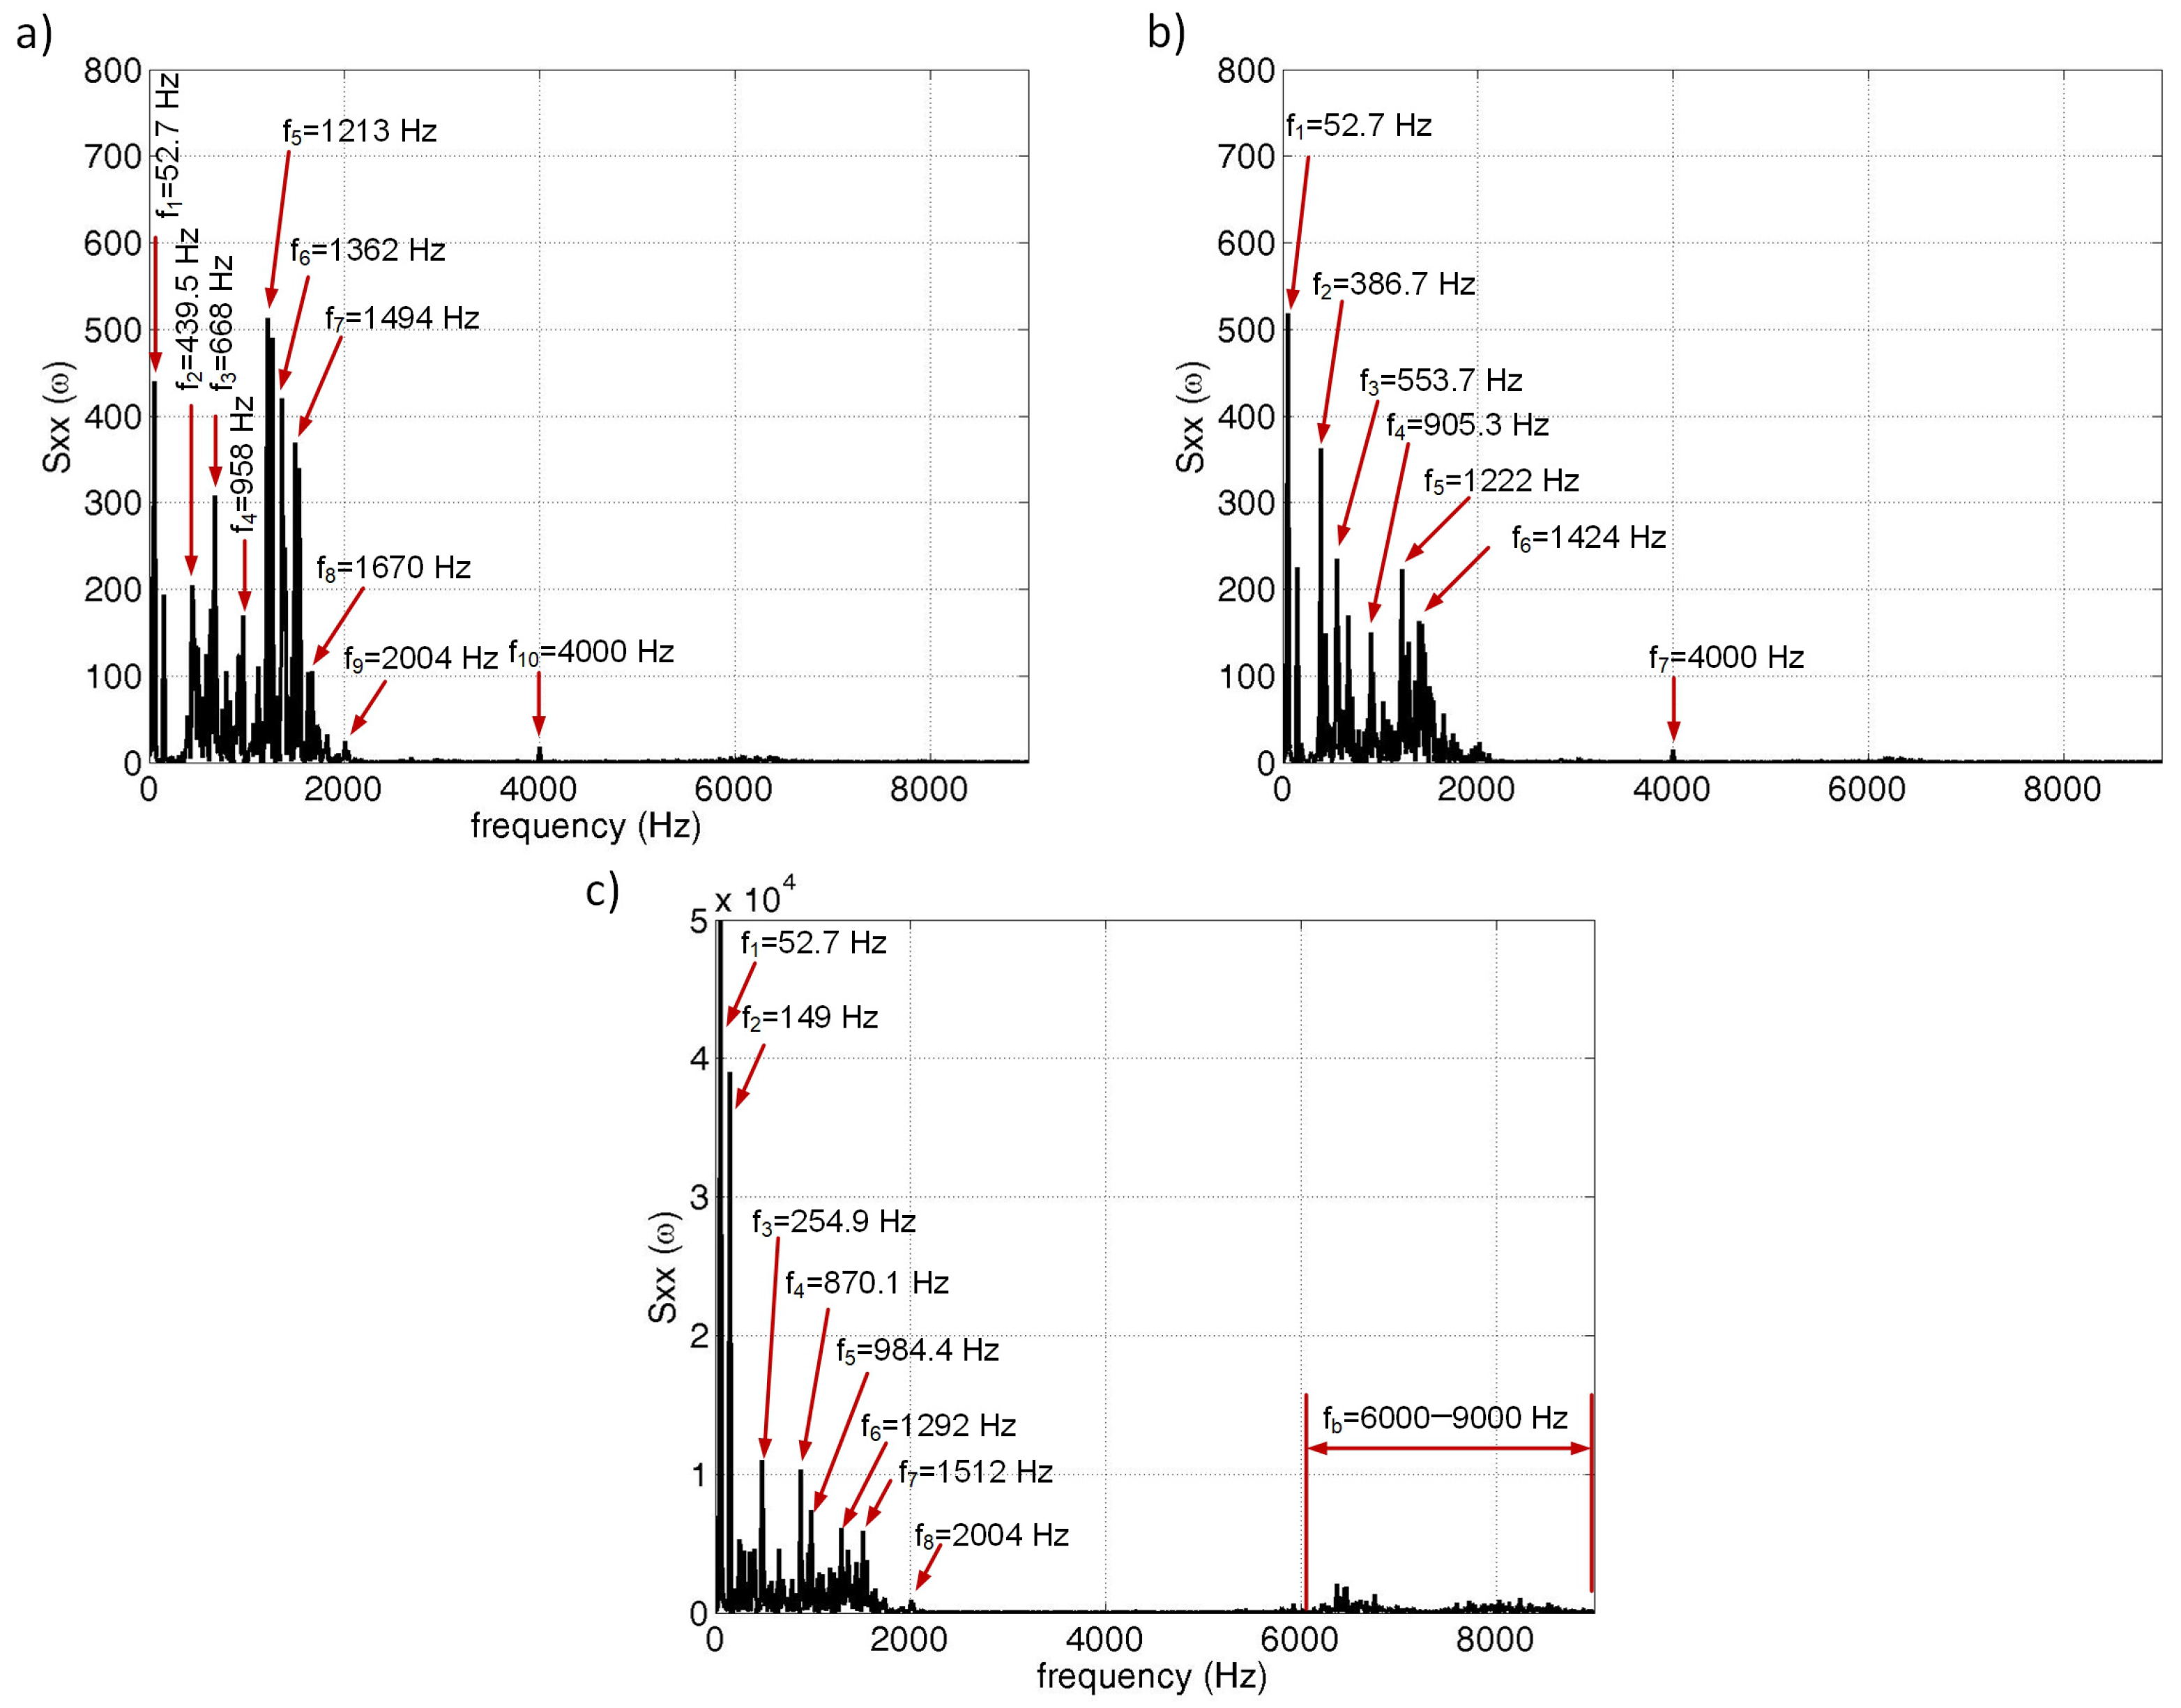
4.2. Vibration Signal Processing in the Frequency Domain
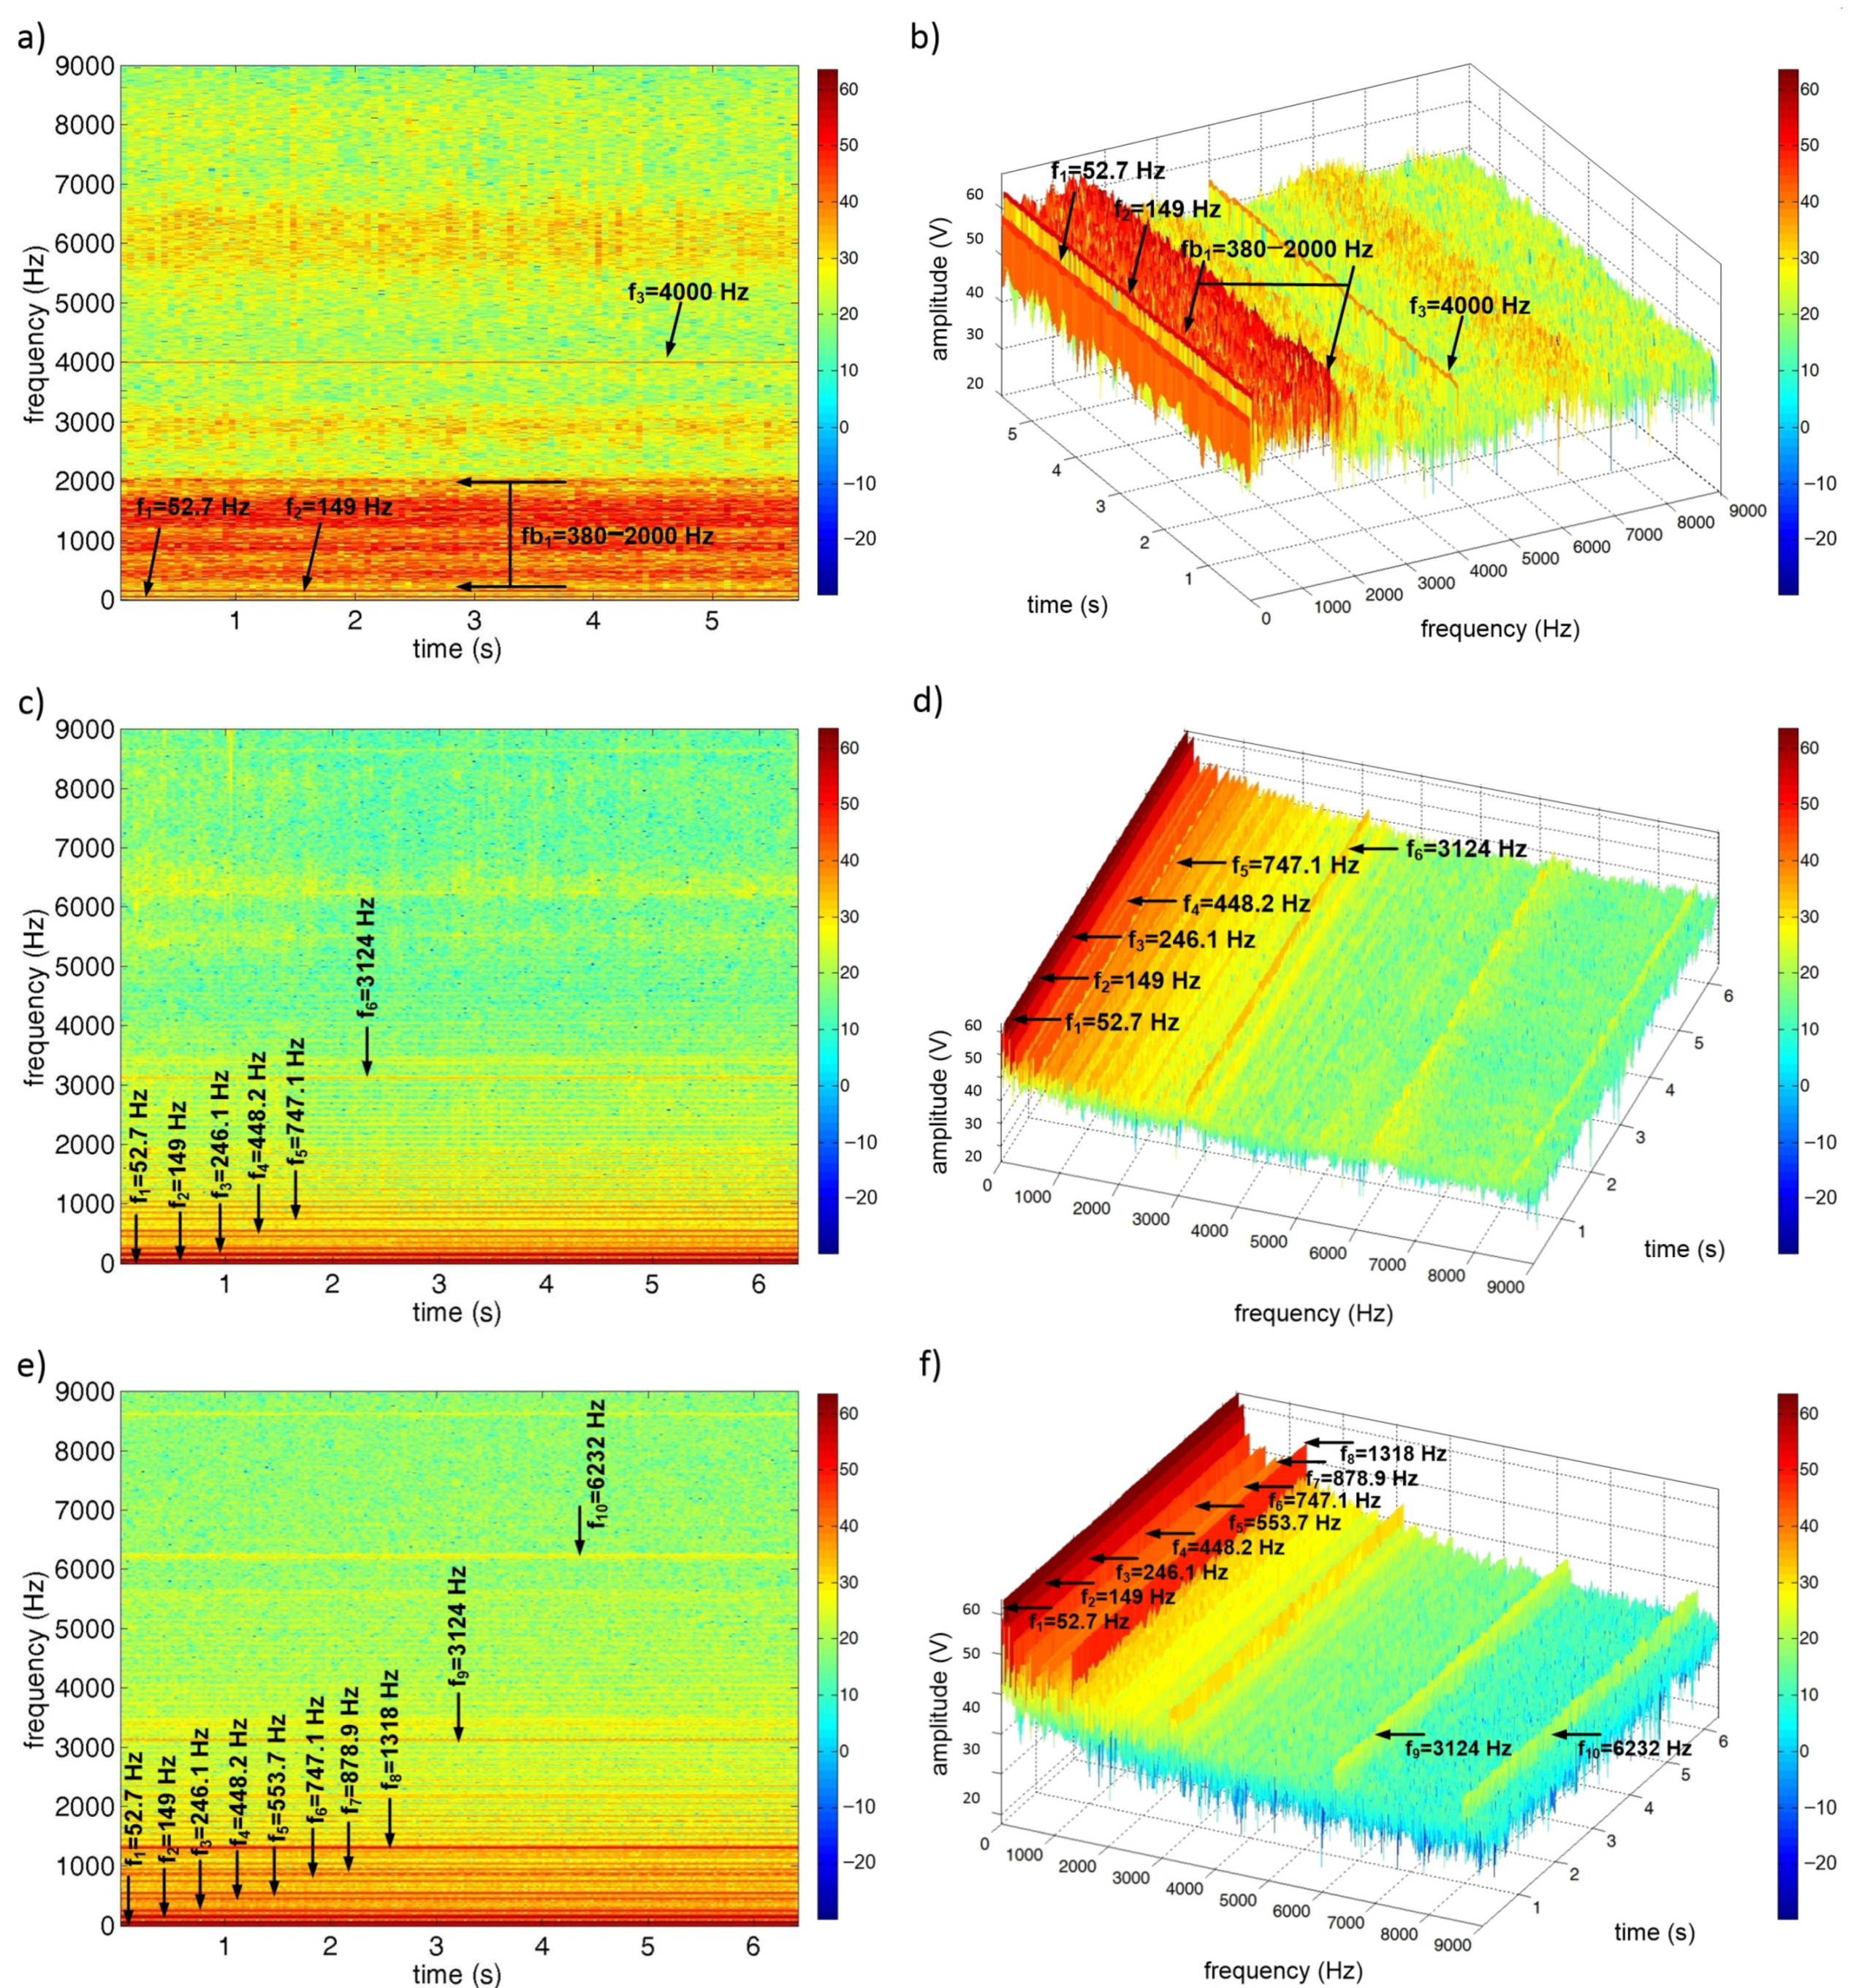
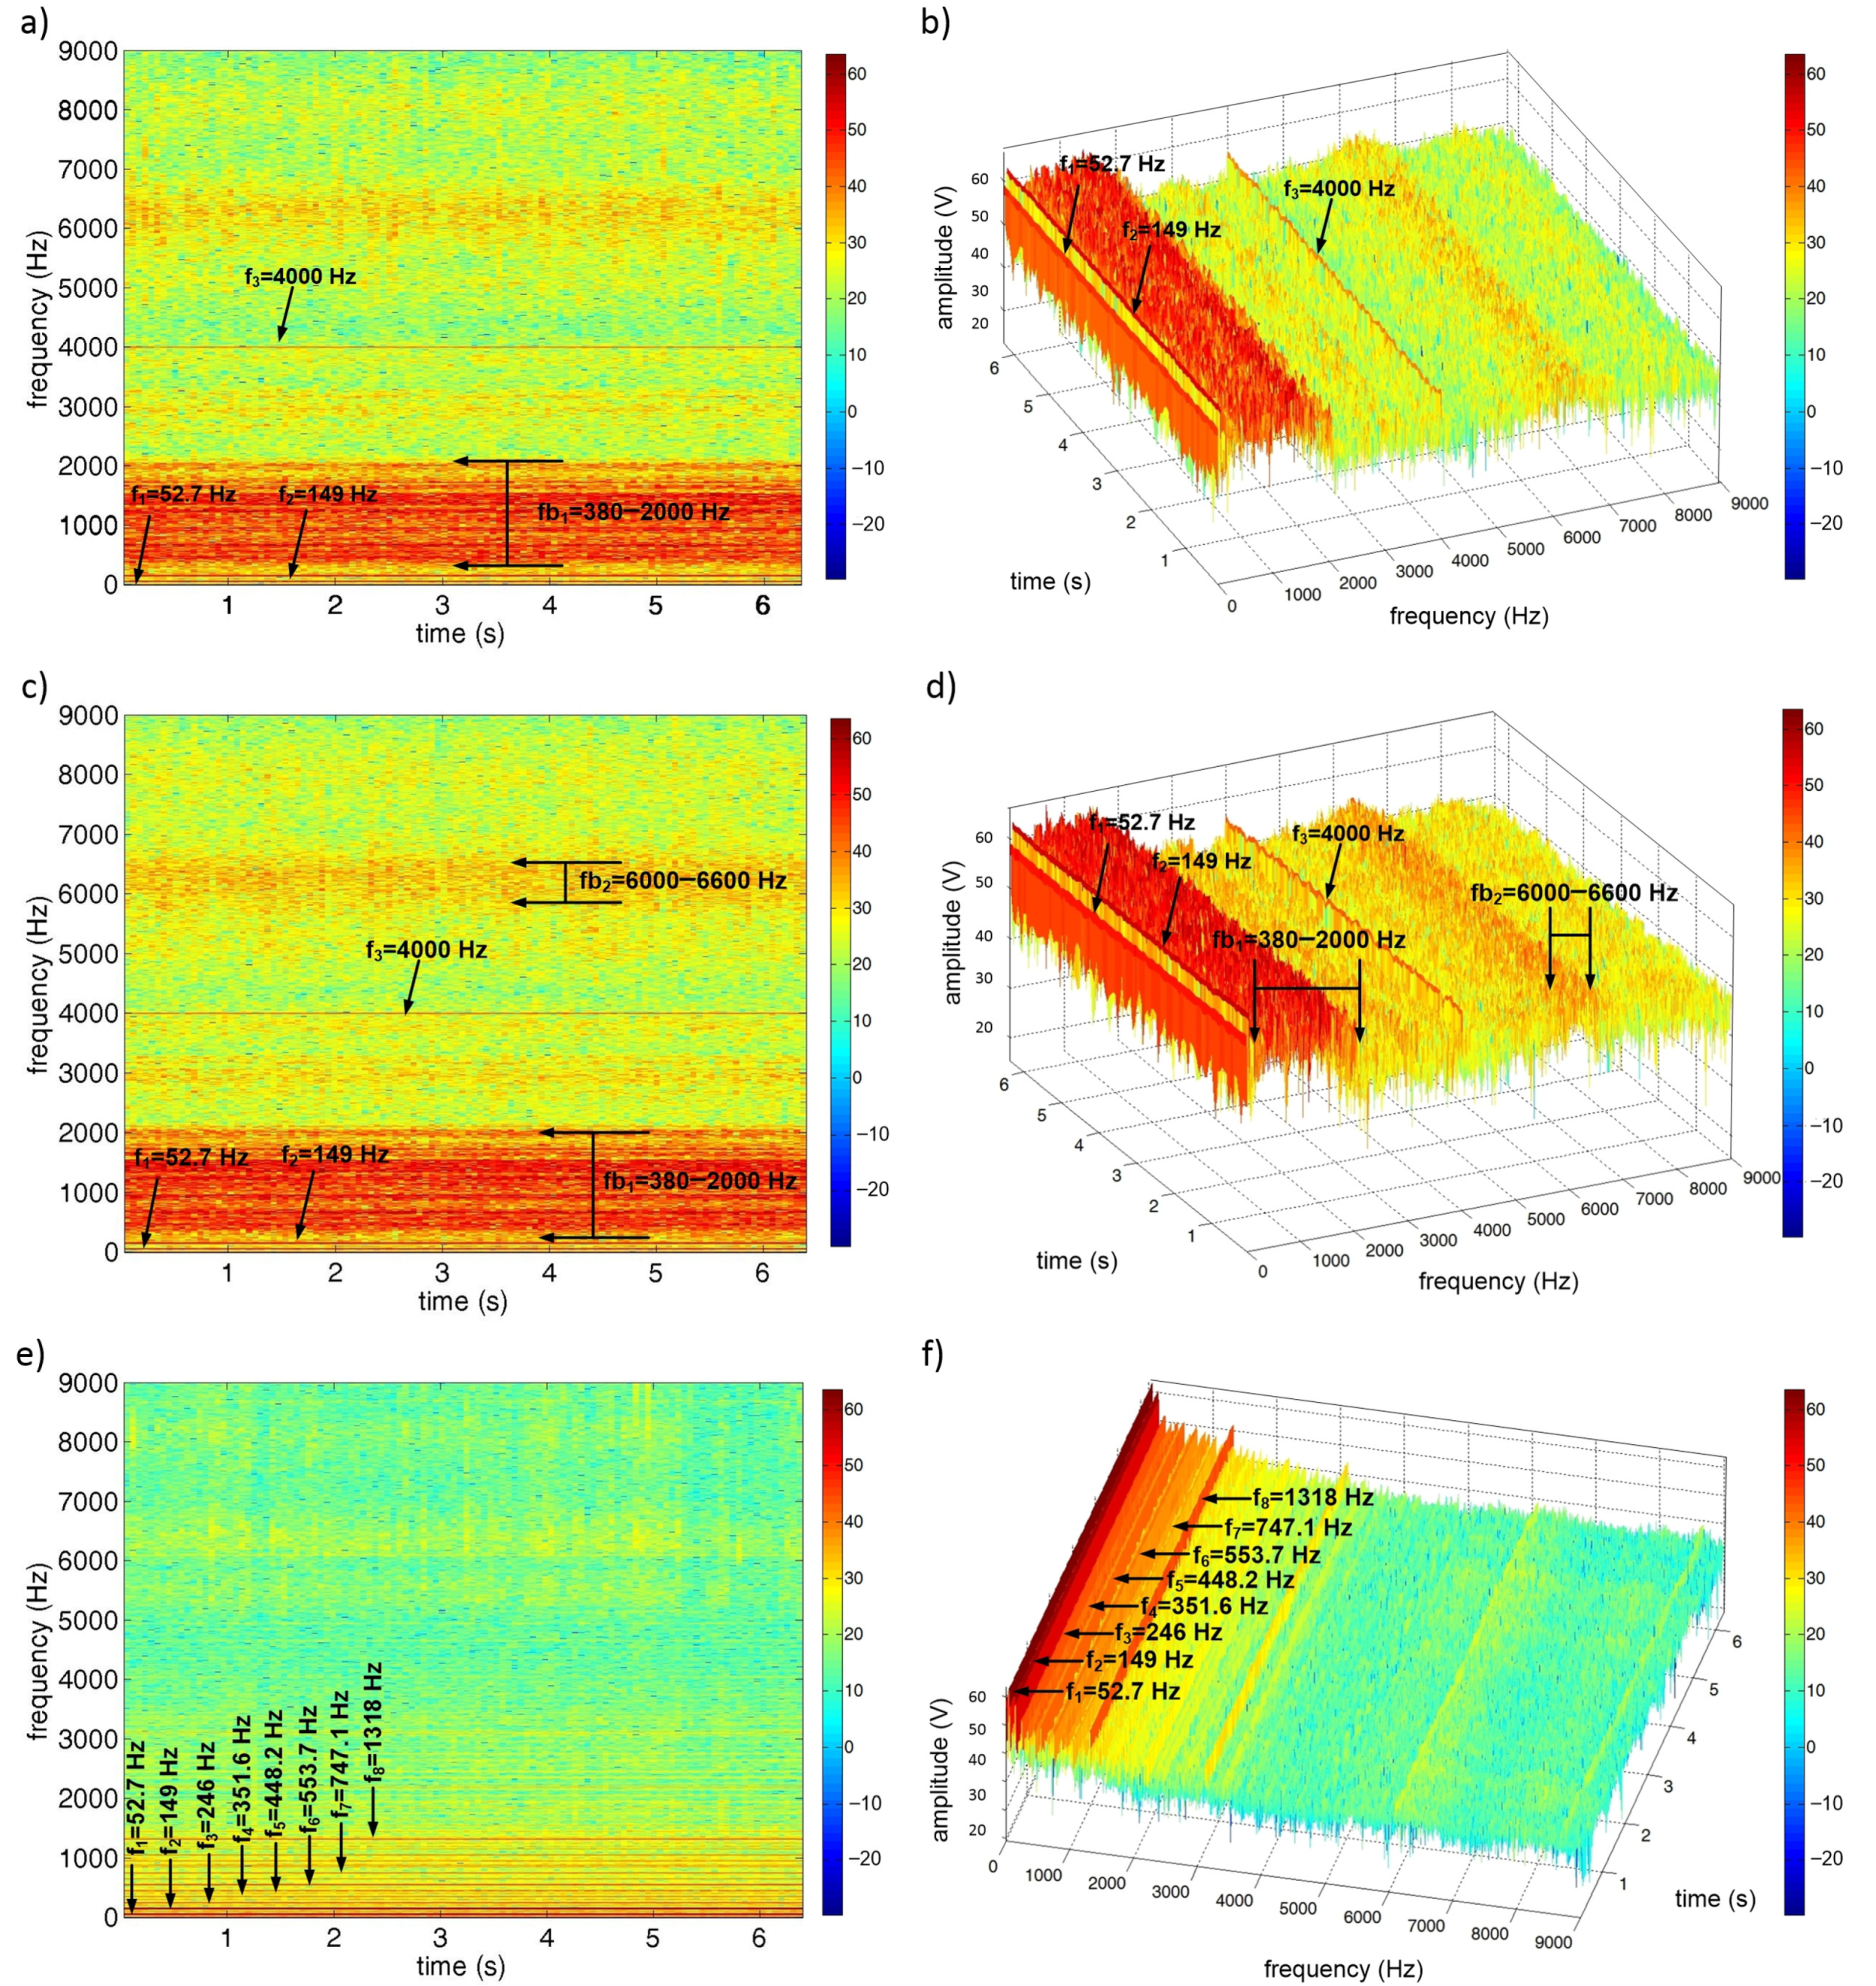
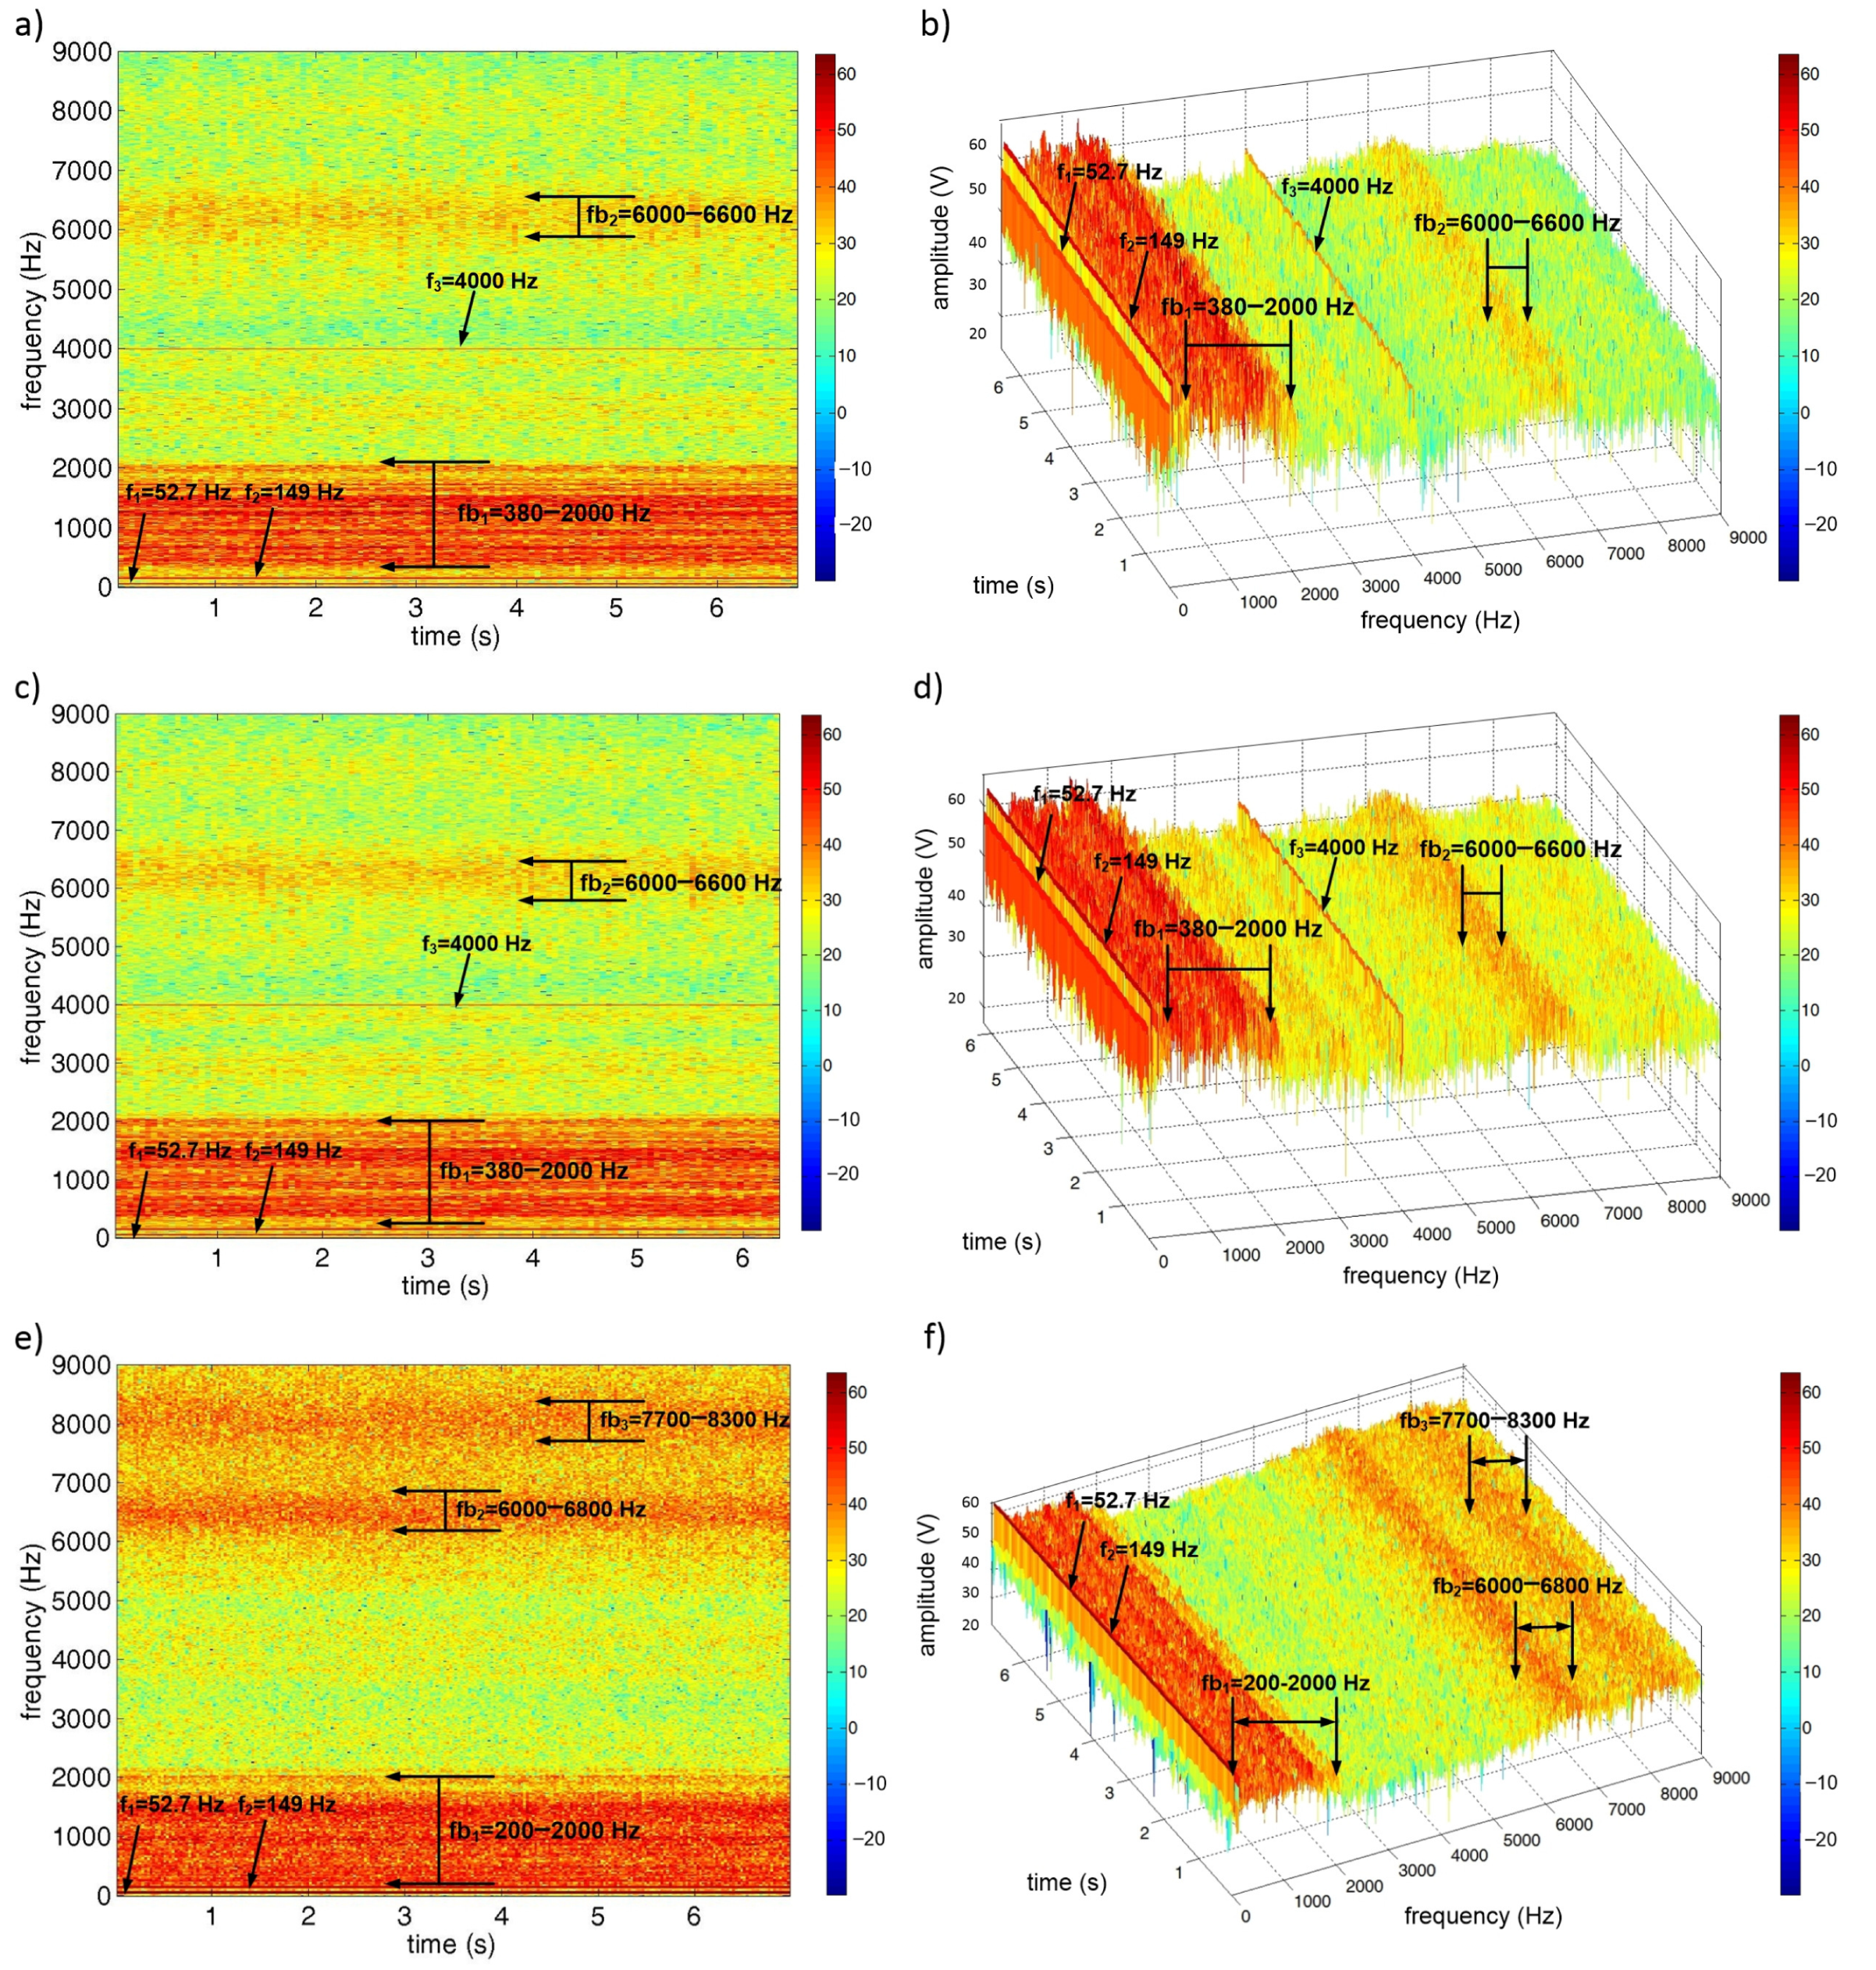
4.3. Vibration Signal Processing in the Time-Frequency Domain
5. Discussion and Future Work
- vibrations of power units (i.e., motor, water pump, and hydro-generator);
- vibrations caused by contact between the drill bit and the rock;
- vibrations from the set values of pressure force F (N) and revolutions (rpm);
- vibrations due to the abrasiveness of the drilling tool during drilling;
- vibrations from the rinsing water inlet and outlet.
6. Conclusions
Author Contributions
Funding
Institutional Review Board Statement
Informed Consent Statement
Data Availability Statement
Acknowledgments
Conflicts of Interest
References
- Krepelka, F.; Chlebová, Z.; Ivaničová, L. Measurement, analyzes and evaluation of stochastic processes operating in rock drilling. Acta Mech. Slovak. 2008, 12, 229–236. [Google Scholar]
- Krepelka, F.; Chlebová, Z. Frequency analysis of the device acoustical response by rock drilling in connection with drilling process optimization. Acta Mech. Slovak. 2007, 11, 111–120. [Google Scholar]
- Chlebová, Z. Simulation analysis of vibratory device controlled vibration. Acta Mech. Slovak. 2008, 12, 323–334. [Google Scholar]
- Tiboni, M.; Remino, C.; Bussola, R.; Amici, C. A Review on Vibration-Based Condition Monitoring of Rotating Machinery. Appl. Sci. 2022, 12, 972. [Google Scholar] [CrossRef]
- He, Z.; Cheng, W.; Xia, J.; Wen, W.; Li, M. Vibration source signal separation of rotating machinery equipment and robot bearings based on low rank constraint. Appl. Sci. 2021, 11, 5250. [Google Scholar] [CrossRef]
- Kumar, S.; Lokesha, M.; Kumar, K.; Srinivas, K. Vibration based Fault Diagnosis Techniques for Rotating Mechanical Components: Review Paper. IOP Conf. Ser. Mater. Sci. Eng. 2018, 376, 012109. [Google Scholar] [CrossRef]
- Khoshouei, M.; Bagherpour, R. Predicting the Geomechanical Properties of Hard Rocks Using Analysis of the Acoustic and Vibration Signals During the Drilling Operation. Geotech. Geol. Eng. 2020, 1, 1529–1573. [Google Scholar] [CrossRef]
- Botti, L.; Martin, B.; Barr, A.; Kapellusch, J.; Mora, C.; Rempel, D. R2: Drilling into concrete: Effect of feed force on handle vibration and productivity. Int. J. Ind. Ergon. 2020, 80, 103049. [Google Scholar] [CrossRef]
- Flegner, P.; Kačur, J.; Durdán, M.; Leššo, I.; Laciak, M. Measurement and processing of vibro-acoustic signal from the process of rock disintegration by rotary drilling. Measurement 2014, 56, 178–193. [Google Scholar] [CrossRef]
- Wang, K.; Hu, Y.; Yang, K.; Qin, M.; Li, Y.; Liu, G.; Wang, G. Experimental evaluation of rock disintegration detection in drilling by a new acoustic sensor method. J. Pet. Sci. Eng. 2020, 195, 107853. [Google Scholar] [CrossRef]
- Flegner, P.; Kačur, J.; Durdá, M.; Laciak, M. Processing a measured vibroacoustic signal for rock type recognition in rotary drilling technology. Measurement 2019, 134, 451–467. [Google Scholar] [CrossRef]
- Flegner, P.; Kačur, J.; Durdán, M.; Laciak, M. Evaluating Noise Sources in a Working. Pol. J. Environ. Stud. 2019, 28, 3711–3720. [Google Scholar] [CrossRef]
- Du, S.; Lv, J. Minimal Euclidean distance chart based on support vector regression for monitoring mean shifts of auto-correlated processes. Int. J. Prod. Econ. 2013, 141, 377–387. [Google Scholar] [CrossRef]
- Trebuňa, F.; Šimčák, F.; Bocko, J.; Trebuňa, P. Failure analysis of mechanical elements in steelworks equipment by methods of experimental mechanics. Eng. Fail. Anal. 2010, 17, 787–801. [Google Scholar] [CrossRef]
- Wittenberger, G.; Cehlár, M.; Jurkasová, Z. Deep hole drilling modern disintegration technologies in process of HDR technology. Acta Montan. Slovaca 2012, 17, 241–246. [Google Scholar]
- Kahraman, S. Correlation of TBM and drilling machine performances with rock brittleness. Eng. Geol. 2002, 65, 269–283. [Google Scholar] [CrossRef]
- Piltan, F.; Kim, J.M. Bearing anomaly recognition using an intelligent digital twin integrated with machine learning. Appl. Sci. 2021, 11, 4602. [Google Scholar] [CrossRef]
- Cheng, L.; Lu, J.; Li, S.; Ding, R.; Xu, K.; Li, X. Fusion method and application of several source vibration fault signal spatio-temporal multi-correlation. Appl. Sci. 2021, 11, 4318. [Google Scholar] [CrossRef]
- Zhu, D.C.; Zhang, Y.X.; Zhu, Q.W. Fault Diagnosis Method for Rolling Element Bearings under Variable Speed Based on TKEO and Fast-SC. J. Fail. Anal. Prev. 2018, 18, 2–7. [Google Scholar] [CrossRef]
- Li, J.W.; Fang, W.J.; Wan, L.; Liu, X.P.; Hu, W.D.; Cao, D.; Han, K.; Li, Y.Y.; Yan, Y.G. Research on the bonding properties of vitrified bonds with porous diamonds and the grinding performance of porous diamond abrasive tools. Diam. Relat. Mater. 2022, 123, 108841. [Google Scholar] [CrossRef]
- Klaic, M.; Murat, Z.; Staroveski, T.; Brezak, D. Tool wear monitoring in rock drilling applications using vibration signals. Wear 2018, 408–409, 222–227. [Google Scholar] [CrossRef]
- Maxit, L.; Karimi, M.; Guasch, O.; Michel, F. Numerical analysis of vibroacoustic beamforming gains for acoustic source detection inside a pipe conveying turbulent flow. Mech. Syst. Signal Process. 2022, 171, 108888. [Google Scholar] [CrossRef]
- Qiu, H.; Yang, J.; Butt, S.; Zhong, J. Investigation on random vibration of a drillstring. J. Sound Vib. 2017, 406, 74–88. [Google Scholar] [CrossRef]
- Qiu, H.; Yang, J.; Butt, S. Investigation on bit stick-slip vibration with random friction coefficients. J. Pet. Sci. Eng. 2018, 164, 127–139. [Google Scholar] [CrossRef]
- Woodall, W.H.; Montgomery, D.C. Some current directions in the theory and application of statistical process monitoring. J. Qual. Technol. 2014, 46, 78–94. [Google Scholar] [CrossRef]
- Xanthopoulos, P.; Razzaghi, T. A weighted support vector machine method for control chart pattern recognition. Comput. Ind. Eng. 2014, 70, 134–149. [Google Scholar] [CrossRef]
- Kessai, I.; Benammar, S.; Doghmane, M.Z.; Tee, K.F. Drill bit deformations in rotary drilling systems under large-amplitude stick-slip vibrations. Appl. Sci. 2020, 10, 6523. [Google Scholar] [CrossRef]
- Zurawski, M.; Zalewski, R. Damping of beam vibrations using tuned particles impact damper. Appl. Sci. 2020, 10, 6334. [Google Scholar] [CrossRef]
- Barat, V.; Terentyev, D.; Bardakov, V.; Elizarov, S. Analytical modeling of acoustic emission signals in thin-walled objects. Appl. Sci. 2020, 10, 279. [Google Scholar] [CrossRef]
- Kumar, R.; Kumaraswamidhas, L.; Murthy, V.; Vettivel, S. Experimental investigations on machine vibration in blast-hole drills and optimization of operating parameters. Meas. J. Int. Meas. Confed. 2019, 145, 803–819. [Google Scholar] [CrossRef]
- Bian, J.; Ma, B.; Liu, X.; Qi, L. Experimental study of toolwear in electrochemical discharge machining. Appl. Sci. 2020, 10, 5039. [Google Scholar] [CrossRef]
- Han, B.; Wang, S.; Zhu, Q.; Yang, X.; Li, Y. Intelligent fault diagnosis of rotating machinery using hierarchical Lempel-Ziv complexity. Appl. Sci. 2020, 10, 4221. [Google Scholar] [CrossRef]
- IEEE Std 181-2003; IEEE Standard on Transitions, Pulses, and Related Waveforms. IEEE: Piscataway, NJ, USA, 2003; pp. 1–60. [CrossRef]
- Balaji, M.; Venkata Rao, K.; Mohan Rao, N.; Murthy, B. Optimization of drilling parameters for drilling of TI-6Al-4V based on surface roughness, flank wear and drill vibration. Meas. J. Int. Meas. Confed. 2018, 114, 332–339. [Google Scholar] [CrossRef]
- Ghasemloonia, A.; Geoff Rideout, D.; Butt, S. A review of drillstring vibration modeling and suppression methods. J. Pet. Sci. Eng. 2015, 131, 150–164. [Google Scholar] [CrossRef]
- Xiao, Y.; Hurich, C.; Butt, S. Assessment of rock-bit interaction and drilling performance using elastic waves propagated by the drilling system. Int. J. Rock Mech. Min. Sci. 2018, 105, 11–21. [Google Scholar] [CrossRef]
- Xiao, Y.; Hurich, C.; Molgaard, J.; Butt, S. Investigation of active vibration drilling using acoustic emission and cutting size analysis. J. Rock Mech. Geotech. Eng. 2018, 10, 390–401. [Google Scholar] [CrossRef]
- Prasad, B.; Babu, M. Correlation between vibration amplitude and tool wear in turning: Numerical and experimental analysis. Eng. Sci. Technol. Int. J. 2017, 20, 197–211. [Google Scholar] [CrossRef]
- Pardo-Igúzquiza, E.; Rodríguez-Tovar, F.J. Spectral and cross-spectral analysis of uneven time series with the smoothed Lomb–Scargle periodogram and Monte Carlo evaluation of statistical significance. Comput. Geosci. 2012, 49, 207–216. [Google Scholar] [CrossRef]
- Sierra-Alonso, E.; Caicedo-Acosta, J.; Gutiérrez, Á.; Quintero, H.; Castellanos-Dominguez, G. Short-time/-angle spectral analysis for vibration monitoring of bearing failures under variable speed. Appl. Sci. 2021, 11, 3369. [Google Scholar] [CrossRef]
- Shim, J.; Kim, G.; Cho, B.; Koo, J. Application of vibration signal processing methods to detect and diagnose wheel flats in railway vehicles. Appl. Sci. 2021, 11, 2151. [Google Scholar] [CrossRef]
- Krajňák, J.; Homišin, J.; Grega, R.; Kaššay, P.; Urbanský, M. The failures of flexible couplings due to self-heating by torsional vibrations—Validation on the heat generation in pneumatic flexible tuner of torsional vibrations. Eng. Fail. Anal. 2021, 119, 104977. [Google Scholar] [CrossRef]
- Kaláb, Z.; Lyubushin, A. Power spectra of quarry blasting works measured in different depths. Acta Mont. Slovaca 2020, 25, 302–309. [Google Scholar] [CrossRef]
- Yu, Y.; Qin, X.; Hussain, S.; Hou, W.; Weis, T. Pedestrian Counting Based on Piezoelectric Vibration Sensor. Appl. Sci. 2022, 12, 1920. [Google Scholar] [CrossRef]
- Mirani, A.; Samuel, R. Discrete vibration stability analysis with hydromechanical specific energy. J. Energy Resour. Technol. Trans. ASME 2018, 140, 032904. [Google Scholar] [CrossRef]
- Valíček, J.; Harničárová, M.; Kopal, I.; Palková, Z.; Kušnerová, M.; Panda, A.; Šepelák, V. Identification of upper and lower level yield strength in materials. Materials 2017, 10, 982. [Google Scholar] [CrossRef]
- Panda, A.; Olejárová, Š.; Valíček, J.; Harničárová, M. Monitoring of the condition of turning machine bearing housing through vibrations. Int. J. Adv. Manuf. Technol. 2018, 97, 401–411. [Google Scholar] [CrossRef]
- Nahornyi, V.; Panda, A.; Valíček, J.; Harničárová, M.; Kušnerová, M.; Pandová, I.; Legutko, S.; Palková, Z.; Lukáč, O. Method of Using the Correlation between the Surface Roughness of Metallic Materials and the Sound Generated during the Controlled Machining Process. Materials 2022, 15, 823. [Google Scholar] [CrossRef]
- Lednická, M.; Kaláb, Z. Vibration Effect of Near Earthquakes at Different Depths in a Shallow Medieval Mine. Acta Geophys. 2016, 64, 2244–2263. [Google Scholar] [CrossRef][Green Version]
- Shreedharan, S.; Hegde, C.; Sharma, S.; Vardhan, H. Acoustic fingerprinting for rock identification during drilling. Int. J. Min. Miner. Eng. 2014, 5, 89–105. [Google Scholar] [CrossRef]
- Masood; Vardhan, H.; Aruna, M.; Rajesh Kumar, B. A critical review on estimation of rock properties using sound levels produced during rotary drilling. Int. J. Earth Sci. Eng. 2012, 5, 1809–1814. [Google Scholar]
- Chongfuangprinya, P.; Kim, S.B.; Park, S.K.; Sukchotrat, T. Integration of support vector machines and control charts for multivariate process monitoring. J. Stat. Comput. Simul. 2011, 81, 1157–1173. [Google Scholar] [CrossRef]
- Khoshouei, M.; Bagherpour, R.; Jalalian, M. Rock Type Identification Using Analysis of the Acoustic Signal Frequency Contents Propagated While Drilling Operation. Geotech. Geol. Eng. 2021, 1, 1–14. [Google Scholar] [CrossRef]
- Kahraman, S.; Delibalta, M.; Comakli, R.; Grafov, B. Noise level measurement test to predict the abrasion resistance of rock aggregates. Fluct. Noise Lett. 2013, 12, 1350021. [Google Scholar] [CrossRef]
- Zhao, X.X.; Gong, Y.D. Research on the Load on Cutter Head of Hard Rock Tunnel Boring Machine. Appl. Mech. Mater. 2014, 684, 303–307. [Google Scholar] [CrossRef]
- Krishnakumar, P.; Rameshkumar, K.; Ramachandran, K. Tool wear condition prediction using vibration signals in high speed machining (HSM) of Titanium (Ti-6Al-4V) alloy. Procedia Comput. Sci. 2015, 50, 270–275. [Google Scholar] [CrossRef]
- Smulko, J.; Kish, L. High-order statistics for fluctuation-enhanced gas sensing. Sens. Mater. 2004, 16, 291–299. [Google Scholar]
- Lentka, L.; Smulko, J.; Kotarski, M.; Granqvist, C.; Ionescu, R. Non-gaussian resistance fluctuations in gold-nanoparticle-based gas sensors: An appraisal of different evaluation techniques. Sensors 2017, 17, 757. [Google Scholar] [CrossRef]
- Shan, X.; Tang, L.; Wen, H.; Martinek, R.; Smulko, J. Analysis of vibration and acoustic signals for noncontact measurement of engine rotation speed. Sensors 2020, 20, 683. [Google Scholar] [CrossRef]
- Puchalski, A. A technique for the vibration signal analysis in vehicle diagnostics. Mech. Syst. Signal Process. 2015, 56, 173–180. [Google Scholar] [CrossRef]
- Bartelmus, W.; Zimroz, R. A new feature for monitoring the condition of gearboxes in non-stationary operating conditions. Mech. Syst. Signal Process. 2009, 23, 1528–1534. [Google Scholar] [CrossRef]
- Osburn, A.; Kostek, T.; Franchek, M. Residual generation and statistical pattern recognition for engine misfire diagnostics. Mech. Syst. Signal Process. 2006, 20, 2232–2258. [Google Scholar] [CrossRef]
- Zimroz, R.; Bartkowiak, A. Two simple multivariate procedures for monitoring planetary gearboxes in non-stationary operating conditions. Mech. Syst. Signal Process. 2013, 38, 237–247. [Google Scholar] [CrossRef]


| Operating Mode | Peak | Peak-to-Peak | Average Value | RMS |
|---|---|---|---|---|
| 1. motor | 12.753 | 25.836 | −0.276 | 3.831 |
| 2. water pump | 1.646 | 3.787 | −0.261 | 0.979 |
| 3. hydro-generator | 1.931 | 4.326 | −0.249 | 1.032 |
| 4. motor and water pump | 13.2325 | 26.016 | −0.232 | 3.697 |
| 5. motor and hydro-generator | 12.065 | 26.657 | −0.267 | 3.576 |
| 6. water pump and hydro-generator | 1.542 | 3.622 | −0.245 | 0.904 |
| 7. motor, water pump and hydro-generator, tool spindle without the bit | 13.247 | 27.752 | −0.2767 | 3.552 |
| 8. motor, water pump and hydro-generator, tool spindle with the bit | 9.939 | 20.343 | −0.292 | 2.948 |
| 9. andesite drilling | 71.1702 | 159.4525 | 0.14856 | 21.1312 |
| Operating Mode | Dominant Frequencies (Hz) | |||||||||||
|---|---|---|---|---|---|---|---|---|---|---|---|---|
| 1. motor | 52.73 | 149 | 386.7 | 483.4 | 958 | 1274 | 1336 | - | - | 1608 | 2004 | 4000 |
| 2. water pump | 52.73 | 149 | 246.1 | 448.2 | 747.1 | - | - | - | - | - | - | - |
| 3. hydro-genertor | 52.73 | 149 | 246.1 | 448.2 | 553.7 | 747.1 | 878.9 | 1318 | - | - | - | |
| 4. motor and water pump | 52.73 | 149.4 | 439.5 | 553.7 | 676.8 | 958 | 1248 | 1529 | 1652 | 1723 | 1951 | 4000 |
| 5. motor and hydro-generator | 52.73 | 149.4 | 439.5 | 668 | 958 | 1230 | 1362 | 1485 | 1723 | 1995 | 4000 | - |
| 6. water pump and hydro-generator | 52.73 | 149.4 | 246 | 351.6 | 448.2 | 553.7 | 747.1 | 1318 | - | - | - | - |
| 7. motor, water pump and hydro-generator, tool spindle without the bit | 52.73 | 149.4 | 439.5 | 668 | 958 | 1213 | 1362 | 1494 | 1670 | 1819 | 2004 | 4000 |
| 8. motor, water pump and hydro-generator, tool spindle with the bit | 52.73 | 149.4 | 386.7 | 553 | 668 | 905.3 | 1222 | 1424 | 1644 | - | 2013 | 4000 |
| 9. andesite drilling | 52.73 | 149.4 | 254.9 | 474.6 | 650 | 870 | 984 | 1292 | 1512 | - | 2004 | 6000–9000 |
Publisher’s Note: MDPI stays neutral with regard to jurisdictional claims in published maps and institutional affiliations. |
© 2022 by the authors. Licensee MDPI, Basel, Switzerland. This article is an open access article distributed under the terms and conditions of the Creative Commons Attribution (CC BY) license (https://creativecommons.org/licenses/by/4.0/).
Share and Cite
Flegner, P.; Kačur, J.; Durdán, M.; Laciak, M. Evaluation of the Acceleration Vibration Signal for Aggregates of the Horizontal Drilling Stand. Appl. Sci. 2022, 12, 3984. https://doi.org/10.3390/app12083984
Flegner P, Kačur J, Durdán M, Laciak M. Evaluation of the Acceleration Vibration Signal for Aggregates of the Horizontal Drilling Stand. Applied Sciences. 2022; 12(8):3984. https://doi.org/10.3390/app12083984
Chicago/Turabian StyleFlegner, Patrik, Ján Kačur, Milan Durdán, and Marek Laciak. 2022. "Evaluation of the Acceleration Vibration Signal for Aggregates of the Horizontal Drilling Stand" Applied Sciences 12, no. 8: 3984. https://doi.org/10.3390/app12083984
APA StyleFlegner, P., Kačur, J., Durdán, M., & Laciak, M. (2022). Evaluation of the Acceleration Vibration Signal for Aggregates of the Horizontal Drilling Stand. Applied Sciences, 12(8), 3984. https://doi.org/10.3390/app12083984