Abstract
The characterization of new materials for enabling gear design is definitely a fundamental objective in the gear industry and research. Single Tooth Bending Fatigue (STBF) tests can be performed to speed up this process. However, it is well known that STBF tests tend to overestimate material strength compared to tests performed directly on meshing gears (MG) which, in turn, require an excessively long test time. Therefore, it is common practice to use a constant correction factor of 0.9 to translate STBF results for designing actual MG (e.g., via ISO 6336). Recent works involving a combination of Finite Element Models (FEM) and multiaxial (non-proportional) fatigue criteria based on the critical plane concept have highlighted that the assumption of considering as a constant independent of the gear design parameters leads to inaccurate results. However, in previous studies, no correlation between and gear design parameters has emerged. In the present paper, the influence of the normal pressure angle (), the profile shift coefficient (), and the normal module () on was investigated by analyzing FEM simulations with the Findley fatigue criterion. 27 gear geometries were studied by varying the above 3 parameters in 3 levels (full factorial DOE). These geometries were simulated in both MG and STBF configurations. The results of the 54 FEM simulations were analyzed by applying the Findley fatigue criterion and the corresponding were calculated. The correlation between and , and was investigated using the Analysis of Variance (ANOVA) technique. The results show that the only gear design parameter influencing is hence, a regression model for including has been developed. This latter has been then adopted for calculating and comparing values from other combination of the parameters found in literature, giving good correspondence.
1. Introduction
In mechanical systems, gears transmit mechanical power between different components in terms of torque and rotational speed [1]. Their operating principle is based on the meshing of teeth, which are subject to different failure modes [2,3,4]. For example, under high contact pressure and/or insufficient lubrication, the sliding/rolling contact between the teeth flanks could lead to wear [5,6], scuffing [7], or (micro-)pitting [8,9]. Furthermore, the contact between the teeth flanks leads the stresses at the tooth root radius to vary continuously, pulsating from zero to a maximum [10,11]. The failure mode related to this fatigue loading condition, which could lead to catastrophic consequences due to a crack nucleation and propagation in the fillet region [12,13], is known as Tooth (Root) Bending Fatigue (TBF) [10].
In gear design, the service life of a tooth subject to TBF can determined by calculating the Tooth Bending Strength (TBS) [14,15]. To evaluate the TBS, the standards propose a simplified strength criterion. Indeed, according to ISO 6336-3 [16], by defining the permissible bending stress in the fillet region as and the maximum stress due to pure bending in the fillet region as , the relation has to be satisfied (considering the life factor ) to ensure an infinite life to the designed gear. On the one hand, different analytical methods to calculate can be found, e.g., ISO 6336-3 [16], ANSI/AGMA [17]. On the other hand, is proportional to the material strength (method B of ISO 6336-3 [16]). According to ISO 6336-5 [18], for specific materials and/or treatments has to be estimated experimentally.
In the literature, it is possible to distinguish three different types of tests to estimate : (1) Meshing Gears (MG) tests, e.g., [15,19], (2) Single Tooth Bending Fatigue (STBF) tests, e.g., [20,21,22], and (3) notched specimens tests, e.g., [23,24,25].
With respect to MG tests, the specimen is itself a gear made with the material and treatment to be characterized. It meshes with (at least) one more gear, see [15,19]. Through MG tests, it is possible to reproduce the actual loading conditions during operation and, thus, the exact stress history in the fillet region [26,27]. Accordingly, it is possible to characterize the fatigue behavior of the tested material (and treatment) very reliably using this method [28]. Indeed, the TBS obtained via MG tests () is the value of as defined in the standards. However, running tests on MG is relatively expensive, time consuming, and requires specific test rigs, e.g., [15,29]. The above-mentioned limitations are mainly due to the fact that, for each gear tested, a single value of can be estimated since the breakage of a tooth makes the specimen unusable for the acquisition of other data [26,27].
Specimen costs and the duration of the experimental campaign (with respect to MG tests) can be drastically reduced exploiting notched specimens. This kind of test can be performed on any universal testing machines. However, since there is no meshing, these tests do not reproduce a stress history that is faithful to the gears operating conditions. In addition, the different geometry (with respect to the gears teeth) further compromises the accuracy of the results that, to be used in the standards, require the implementation of a set of corrective coefficients [30].
An excellent compromise between the time required for the experimental campaign, the costs related to the specimens (and the test equipment) and the accuracy/reliability of the results can be found in STBF tests [20]. STBF tests consist of the application of two coaxial forces (fixed directions and sinusoidally variable amplitudes) to two teeth of the sample (a gear made of the material and treatment to characterize). More specifically, in STBF tests, two anvils (having parallel faces and mounted on a universal testing machine) load two specific teeth of the above-mentioned gear, see [31,32,33]. The loading condition leads to the forces to be tangent to the base circle and, at the same time, normal to the tested teeth flanks (Wildhaber property [1]). Since in STBF loading condition, the gear has not to mesh and/or to rotate, the damage/absence of specific teeth (not the tested one) does not compromise the application of the load. Therefore, through STBF tests, it is possible to perform multiple measurement on the same gear. This is a clear economic advantage towards the experimentation on MG. In addition, in STBF tests the lubrication is not required since there is no meshing [34].
However, in STBF tests, the stress history induced in the fillet region presents some differences with respect to those induced in MG and to those modeled in the standard to estimate the TBS. First, in MG the rolling/sliding contact, the possibility of having multiple pairs of meshing teeth leads to the contact force to vary in both direction and amplitude [26,27]. This leads to have, in the fillet region, a multiaxial and non-proportional stress history [35]. Conversely, in STBF tests the applied forces have a constant direction and vary in amplitude (sinusoidally). Therefore, such amplitude trend fails to reproduce the uneven force sharing due to the engagement or disengagement of additional pair of meshing teeth [26,27]. In addition, in STBF tests, the angle between the loaded tooth axis () and the applied forces can be considerably different from the one in the Outer Point of Single pair tooth Contact (OPSC) that, in turn, according to the standard, it is exploited to calculate on MG. Second, in STBF tests, to avoid undesired movement of the specimen, a compressive load is usually present. A common ratio between the minimum and maximum applied load is R = 0.1, e.g., the STBF tests described in [29,36,37,38,39]. It modifies the average stress in fillet region since, conversely, in MG the above-mentioned ratio in usually equal to zero [19,20,40,41].
Based on the theoretical differences before mentioned and experimental results aimed at estimating the difference between and , it is possible to state that a correction coefficient is needed since [42,43]. To consider this effect, Rettig in [42] and Stahl in [43] suggested to exploit a constant correction coefficient () defined as . However, experimentally, has been estimated without investigating the effect of gears geometry and material [26,42,43]. Numerically, in [26,44] the scholars highlighted that considering this coefficient constant is inaccurate. Indeed, preliminary results show that varying materials, load ratio (R), and some gear design parameters, varies from 0.65 to 1.1. However, in [26,44] the relationship between the gear design parameters and has not been systematically studied.
Therefore, in the present paper, a specific Design of Experiment (DOE) was created to study the effect of specific gear design parameters on using the numerical approach proposed in [26,44]. In Section 2, a background related to the implementation of multiaxial fatigue criteria on gear and to the mathematical model for implementing the Findley criterion on Finite Element Models (FEM) results is presented. In Section 3, the method used to establish the gear geometries to be simulated and the settings of the FEM simulations are shown. The statistical elaboration of the results and the related discussion are presented in Section 4. Conclusions can be found in Section 5.
2. Background
2.1. Studies Related to the Implementation of Multiaxial Fatigue Criteria on Gear
In the literature, several multiaxial-fatigue criteria can be found, e.g., [45,46,47,48,49,50,51,52,53,54,55,56,57,58]. However, papers studying TBF through multiaxial-fatigue criteria are limited. For example, the Sines fatigue criterion [58] combined with Finite Element Analysis (FEA) of a gear has been used in [21]. However, the Sines criterion can be applied exclusively for proportional loading condition. In [27,59] spur gears were studied through the elaboration of FEA results with the Crossland fatigue criterion [46]. In [60] hypoid gears were studied combining FEM simulations and the Liu and Mahadevan fatigue criterion [61]. Both of the above-mentioned criteria are capable of considering non-proportional loads, but it is interesting to notice that the fatigue criterion proposed by Liu and Mahadevan is based on the critical plane concept. The idea behind the fatigue criteria based on the critical plane concept is the following: the crack due to the fatigue loading propagates on a specific plane on which both shear and normal (with respect to the plane) stress components contribute to the failure [47].
Additional studies that have used fatigue criteria based on the critical plane concept to study gears are [26,44,62,63]. In [26], an approach to estimate by applying Findley’s criterion [46] to the results of specific FEA was proposed. In [43], the method proposed in [26] has been extended to include other criteria based on the critical plane concept such as Papadopoulos [53,64], Matake [48], McDiarmid [50], and Susmel et al. [65]. In [62,63] numerical and experimental results have been compared to determine the most appropriate criteria to study TBF in gears. Results have shown that the Findley’s criterion is the most prone criterion to predict the crack behavior in terms of nucleation position and propagation direction [62,63]. Therefore, in the present paper the Findley’s criterion has been exploited.
2.2. General Framework to Calculate by Means of FEM Simulation and Findley’s Criterion
As mentioned in the introduction, the load/stress histories in the MG and STBF conditions are different and therefore the damage caused by the two tests (for each loading cycle) is different. For each test, the damage can be quantified through the implementation of fatigue criteria based on the critical plane, in this specific case the Findley criterion which was proven to be the most accurate for such analyses [62,63]. Indeed, it can be proven that , defined as the ratio of and , is equivalent to the ratio between the maximum damages (calculated through Findley) in the STBF condition and the MG condition [26].
Therefore, a general framework to estimate for a specific combination of gear geometry and material involves two steps.
- The first step relies on setting up FEM simulations of MG and STBF tests on the same gear. The loading conditions (force applied to the anvil in STBF simulation and torque applied to the MG simulation) have to lead to the same according to [16]. In addition, to model a critical condition, should be similar to a presumed . In this way, the results of the FEA related to the STBF and the ones related to MG are equivalent from the standard’s perspective [16].
- The second step involves the calculation of the maximum damage reached in the fillet region according to the Findley criterion. With this respect, the stress history tensor (Equation (1)) has to be extracted for each position along the fillet region for both the FEM analysis performed. In this way, the points of the fillet region can be analyzed through the Findley criterion. Indeed, elaborating the various it is possible to detect the most critical point and calculate the maximum damage parameter for each type of test.
In the following of this section, the concepts behind the fatigue criteria based on the critical plane are presented together with the procedure to elaborate according to the Findely’s one to acquire the maximum damages parameters and, therefore, to calculate . The mathematical modelling behind this procedure is explained in more detail in [62].
In Figure 1, a plane defined by its normal vector n (having spherical coordinates ) is shown. This plane passes through the point to be evaluated in terms of damage due to fatigue. To this regard, has to be extracted in the above-mentioned point. The total stress acting on this plane can be represented by a vector having time-dependent modulus and direction () that, in turn, can be defined through Equation (2).
can be decomposed into and . The former has fixed direction (normal to the plane) and time-dependent modulus. The latter is tangential to the plane and have a time-dependent modulus and direction.
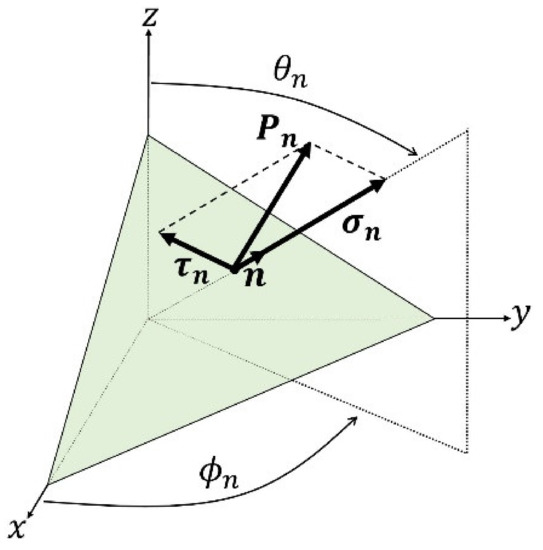
Figure 1.
Components of the vector on the plane defined through . The plane (in green) is represented in a Cartesian space (x, y, z) and the polar coordinates () identify the direction of the vector normal to the plane .
In Figure 2, it is possible to note that, when periodic stresses are in play, describes a three-dimensional closed curve whose projection on the plane is the positions of assumed in a load cycle ( in Figure 2). In addition, along a cycle, it is possible to individuate and (Figure 2).
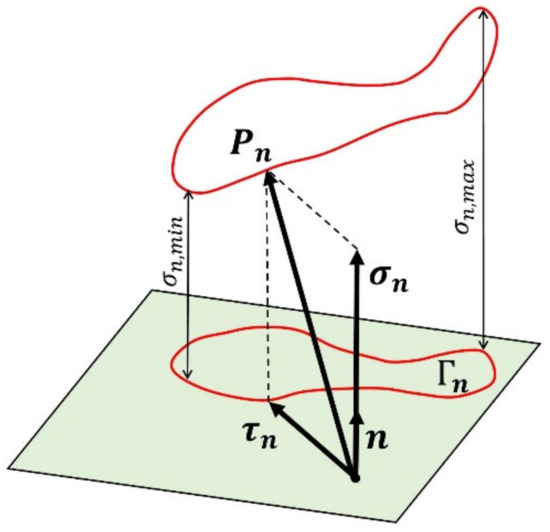
Figure 2.
Values and vectors related to periodic on a plane defined by . . is the projection on the plane (having normal vector ) of all the values assumed by in the loading cycle, i.e., all the values assumed by in a loading cycle.
However, for implementing fatigue criteria, it is necessary to identify the value of the alternate tangential stress and its average value . These values represent the entire load cycle in terms of shear acting on the studied plane. With this respect, the most common method to summarize into two scalars ( and ) is the Minimum Circumscribed Circle (MCC) [64]. In this approach, represented in Figure 3, is calculated as the radius of the smallest circle that can entirely contains the curve , while can be defined as the distance between the center of the circle and the origin of .
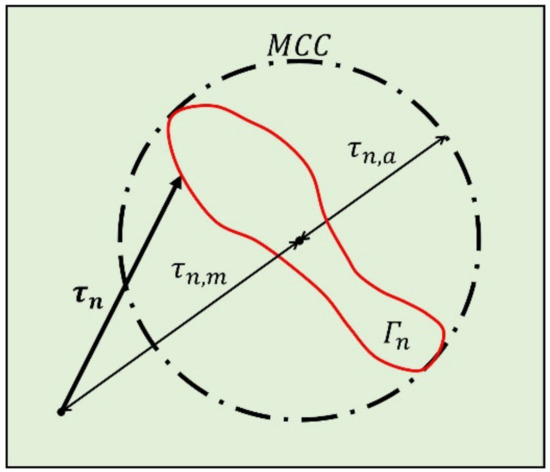
Figure 3.
Minimum Circumscribed Circle method: is the radius of the smallest circle that entirely contains . is the distance between the center of the above-mentioned circle and the origin of the .
Hence, by varying the parameters (, ) it is possible to define multiple planes passing through the studied point and, for each of these planes, the relevant stress values, i.e.; , , , can be calculated through the aforementioned methods. At this point, establishing specific criteria it is possible to individuate (among the defined planes) the critical one. In the present paper, the spherical coordinates and the related stress’ values are labelled with the subscript c (critical) as in Equations (3) and (4).
The principle to establish the critical plane (, ) varies according with different criteria. In most of the cases, the critical plane corresponds with the plane having the maximum value of , e.g., [48,50,53,65]. However, according to the Findley criterion (Equation (5)), the critical planes can be found through Equation (6) by varying and in the range . In Equations (5) and (6), is the ratio between the material fatigue limit at symmetrical alternating torsional loading () and the limit at symmetrical alternating bending loading () (Equation (7)).
The Findley criterion states that the studied point withstands the loading history for an infinite lifetime, if the left-hand side of Equation (5) is less than a constant related to a material property obtained by fatigue testing with pure bending and pure torsion. This left-hand of Equation (5) can be considered the Damage Parameter (DP) of the studied point that, in turn, its maximum value determines the critical plane (Equation (6)). Indeed, the Findley criterion defines the critical planes as the plane in which the maximum DP is present. This definition of the critical plane differentiates it from the other criteria. Indeed, the Findley criterion exploits a linear combination of and for the individuation of the critical plane while, as mentioned above, the other criteria consider only .
Through the evaluation of the fatigue trough the Findley criterion on each position along the tooth root radius (where data on can be obtained via FEA) it is possible to evaluate the related DP and, therefore, the point of the tooth root radius in which the DP assumes the maximum value. This process can be repeated for both simulated conditions (STBF and MG) and it is therefore possible to extract the maximum DP value for each of them. At this point, considering that when the DP reaches the critical value the failure due to fatigue theoretically occur, it is possible to state that the ratio of the maximum DP reached in STBF and MG conditions is representative of . Therefore, can be calculated with Equation (8).
Implementing the framework presented in this section it is possible to calculate starting from (1) the extracted by the FEM simulation of MG and STBF tests (2) the values of and that can be obtained via standard fatigue tests for new materials and/or from literature, e.g., [66] for most common materials.
In addition, according to the Findley criterion, it is possible to define the Safety Factor () as in Equation (9). is the ratio between the right term and the left term of Equation (5) where the DP assumes its maximum value (and therefore the is the minimum among all the positions of the tooth root radius). More specifically, when the value is close to the unit, it means that the load applied to the tooth leads towards the limit value of fatigue life.
3. Materials and Method
3.1. Definition of the Main Design Parameter and Design of Experiment
In spur-gear design, the gear geometry can be defined (at least macroscopically) through a specific number of parameters, i.e., the normal module (), the normal pressure angle (), the number of teeth (), the face width (), the profile shift coefficient (), the addendum coefficient (), the dedendum coefficient (), and the root radius factor ().
is the ratio between the circular pitch (pitch diameter divided by the number of teeth and π. This parameter is the most important because it defines which gear can mate. The applicability of the standard ISO-6336 [14] is limited to mm. For smaller normal modules, specific arrangements have to be made [22,32,33]. On the other hand, STBF tests have been conducted also on gears having mm, e.g., [31].
is the normal pressure angle, the one between the normal to the line going through the two gear centers and the tangent to the two base circles. This parameter defines the inclination of the line of action and is responsible for the different share between bending and compression stresses. Moreover, it affects the bending and the torsion of the shaft on which the gear is mounted/manufactured. According to the ISO, the standard is 20° while, in the USA, the standard is 25° [1]. However, applications in which is between 14° and 20° are common [1].
is a dimensionless coefficient that, if multiplied by , it provides the offset value (in mm) to be applied to the hobbing tool during the gear cutting. A null value of shift coefficient means that the gear has standard proportions. The shift of the cutting line with respect to the reference one permit the creation of the so-called corrected gears [1]. On the one hand, a positive shift coefficient increases the tooth thickness at the root and therefore the TBS. On the other hand, it reduces the width of the tooth tip (on the outside circle) [1]. In addition, affects the operating pressure angle, the efficiency, and/or the center distance [67]. It is known that negative have a negative impact on the TBS [1,67]. Indeed, negative reduce the section of the tooth in the most critical area, actually increasing the maximum stresses (with respect to the same applied force). In addition, negative lead toward undercutting issues [1]. Therefore, in the present study only positive , i.e., those that increase the TBS have been considered. Typical positive are in the range 0–0.5 [1].
and are two dimensionless coefficients that, when multiplied by , give the value (in mm) of the addendum and dedendum, respectively. The addendum is the difference between the outer radius and the pitch radius while the dedendum is the difference between the pitch radius and the root radius. On the other hand, is a dimensionless coefficient that, if multiplied by , provides the tip rounding radious of the hobbing tool (in mm). It is interesting to notice that this area (tooth root radius) is not actively involved in the mating of pairs of teeth and, therefore, it can be machined with different geometries, e.g., elliptical, hypocycloidal [68] and with different strategies, e.g., milling, hobbing [69].
Based on the above-mentioned information along with the discussion presented in the introduction, it is possible to assume that the main differences between the stress/loading conditions in MG and STBF tests are due to the different angles and positions at which the forces are applied. These depend mainly on , and . Therefore, in the present study the effect of these three design parameters on has been investigated. With this respect, 27 different gear geometries were created through the combination of the 3 parameters and 3 levels. These levels are:
- mm in compliance with the standard range [14];
- ° to include a relatively small angle (15°), the European standard (20°) [14], and the U.S. standard (25°) [1].
- to study the effects of standard gears () and positive shift (which improves tooth strength [1]) in a machining range common in many applications [1].
In the definition of the 27 geometries (listed in Table 1) the other parameters (i.e., , , , , ) have been kept constant within the limits of the feasibility of the profiles. More specifically, , , for all the gear geometry. for all geometries except gear geometry number 10 and 19 (Table 1) where, due to profile manufacturability, has been selected equal to 1.30. Moreover, for the same reasons mentioned above, has been selected 0.380 except for geometries with (7–9; 16–18; 25–27 in Table 1) where . The values of , , and are standard values according to [14]. It is worth mentioning that in the studied geometries the profile is constant along the whole width i.e., there is no profile modification [70].

Table 1.
Geometrical characteristics of the simulated gears.
In Figure 4, it is possible to see the 27 tooth profiles created according to the properties listed in Table 1. Each tooth profile has been associated with the number of the geometry to which it corresponds. In order to simplify visibility, all the profiles have been made homogeneous through a scale factor inversely proportional to the . In the figure, it is possible to notice how the profiles vary according the three design parameters studied.
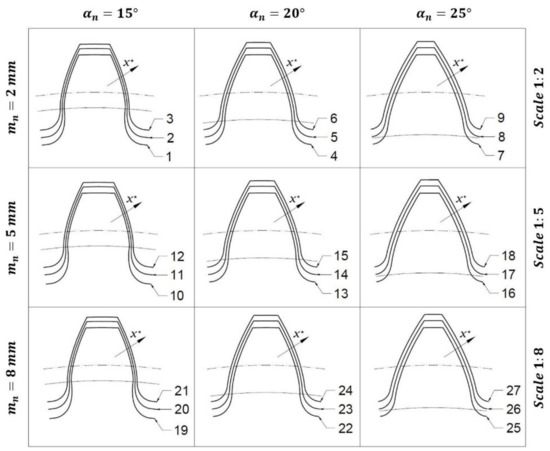
Figure 4.
27 different tooth profiles by varying (rows), (columns), and according to Table 1. It is represented also the base circle (in a continuous line) and the pitch circle (in a dash-dotted line); their distance is related to . The dimensions have been scaled to facilitate visibility.
3.2. Finite Element Analysis
The 27 gear geometries presented in the previous section have been simulated via FEM in MG and STBF condition with the aim of obtaining the stress histories () in the tooth root radius. In this way, as it is explained in more detail in the next section, it has been possible to study stress histories by applying Findley’s fatigue criterion.
Each gear geometry has been modelled through the open-source software Salome-Meca/Code_Aster. In the present study, 2D simulations have been performed to speed-up the calculation time of the 54 simulations (27 modeling the MG conditions and 27 modeling the STBF ones). In Figure 5, it is possible to see an explanatory model of STBF condition and, in Figure 6, an explanatory model of MG condition is represented. Two-dimensional simulations are also supported by the fact that in previous studies (in which fatigue criteria based on critical planes were applied to gears, e.g., [62,63]) it has always been observed that the critical plane is perpendicular to the frontal view of the gear. Moreover, in this study, ideal geometries have been exploited and defects are not taken into account.

Figure 5.
Finite Element Modelling of STBF tests. In yellow, it is shown the symmetry line of the system. The force is applied to the anvil. The nodes highlighted in green belonging to the anvil are master while the ones, highlighted in green, belonging to the tooth are slave. In red are highlighted the nodes in which the stress history has been studied.
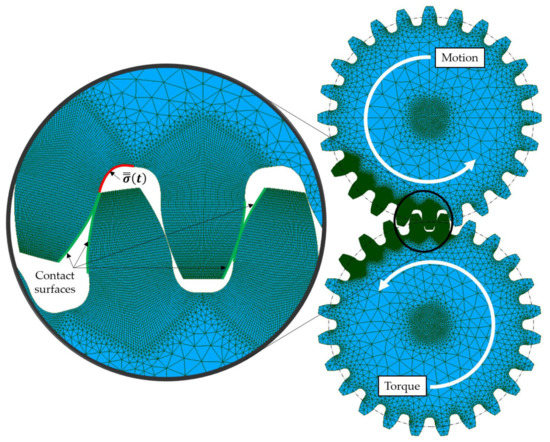
Figure 6.
Finite Element Modelling of MG tests. The torque is applied to bottom gear while the motion has been set consistently to the top gear. The latter has the studied tooth root (the stress history of the red-highlighted nodes has been elaborated). The nodes highlighted in green are those in which the contact has been set. More specifically, the nodes belonging to the bottom gear are master and those of the top gear are slave.
In both the configurations, the loaded teeth have been modeled through quadrangular elements. The tooth root radii have been discretized by 31 nodes as well as the teeth flanks. The remaining part of the gears have been modeled through triangular elements having larger dimensions. This allowed reducing the number of total mesh elements taking into account the overall stiffness of the simulated gears.
In MG simulations (Figure 6), the gears have been simulated in their whole geometry. On the teeth involved in the gearing, the mesh density has been increased as mentioned above. In the STBF loading condition (Figure 5), it was possible to exploit the symmetries. Indeed, in STBF, the gear is stationary and there is a symmetry in the plane passing through the center of the gear and parallel to the anvil’s contact faces (yellow line in Figure 5).
Since the teeth are loaded cyclically due to the meshing with other teeth (MG) or with anvils (STBF), non-linear simulations have been set up discretizing the loading cycle in 40 time steps. The modeled material is linear isotropic having a Young modulus and a Poisson’s ratio . In all the simulations, the state of stress never exceeded the yielding. Therefore, the non-linearity of the simulation is related to the contact that, as visible from Figure 5 and Figure 6, involves the points (highlighted in green) of the two components according to the simulation. In other words, the nodes on which contact can occur are the tooth flanks in MG and between the tooth flank and the anvil in STBF. In the contact, a friction coefficient of 0.05 have been set. However, the effect of friction has a negligible effect on the tooth root bending fatigue.
With respect to the MG simulations, the gears have been positioned fixing their axes of rotation at a theoretical center distance. The teeth were positioned half an angular step out of phase (since both wheels have the same number of teeth) in order to ensure meshing. The motion has been assigned to the driving gear (the top gear in Figure 6) and the resistant torque to the driven one (the bottom gear in Figure 6) accordingly. In MG simulations, multiple teeth can engage simultaneously as in the real tests and, therefore, the stiffness of the entire meshing arc was taken into account in MG simulations [26].
With respect to the STBF simulations, the symmetry was set as fixed constrain and a pulsating force varying sinusoidally with was applied to the anvil as in the real tests. The maximum force in STBF and the torque applied in MG simulations have been set in order to lead to the same according to the standard [16]. Moreover, force or torque should lead to for simulating the conditions where the crack nucleates and propagate leading to the fracture at approximately 106 cycles [63]. In the present study, the material considered is the 39NiCrMo3. This typical gear steel presents [18], a bending fatigue limit [66,71], a torsional fatigue limit [66,71], and an ultimate tensile strength [66,71].
For each simulation, the of all the positions within the tooth root region of the loaded tooth have been extracted (red area in Figure 5 and Figure 6). These points are the ones in which the crack has higher probability to nucleate. Since the performed simulation are 2D, ; ; ; are equal to zero due to the plane stress condition.
3.3. Calculation of through the Findley’s Fatigue Criterion
The has been extracted for each grid node (31 nodes) belonging the tooth root radius in each simulated condition (STBF and MG). These represent an entire load cycle discretized in 40 time steps. The approach presented in Section 2.2 has been implemented to calculate . More specifically:
- For each node the critical plane has been identified using the cylindrical coordinates because the case is 2-dimensional. This means that the angle defining the representation plane of the gears has been kept constant and equal to 90°;
- On each critical plane (of each node) the DP and, therefore, the was calculated;
- On each tooth root radius, the maximum DP and, therefore, the minimum was individuated.
Based on the above-mentioned values evaluated for the MG and STBF conditions of the same gear geometry, it has been possible to calculate .
Results of the (related to the MG and STBF) and the of each gear geometry are presented in Table 2. It is interesting to notice how, in the majority of cases, safety factors assume values approximately the unit. This is a symptom of the correct setting of the forces/torques (using the ISO 6336 approach) combined with the good ability of the Findley criterion to characterize the DP.
Table 2.
Applied Torque (in MG), applied Force (in STBF), calculated safety factors and .
4. Results and Discussion
In order to obtain a robust model of the corrective factor, the acquired data must follow a normal distribution [72] thus, a normality test of values has been performed (Figure 7). The plot of Figure 7 shows the percentage of the normal probability of the data residuals. The central straight line depicts the cumulative probability, while the two curves represent the 95% confidence interval boundaries. For respecting the normality assumption, data residuals should stay inside the confidence interval curves and closed to the cumulative probability line, showing a symmetric behavior respect to it. Therefore, from Figure 7, it can be noticed that the normality assumption distribution of the data is validated, thus the results of the succeeding analysis can be considered robust and reliable.
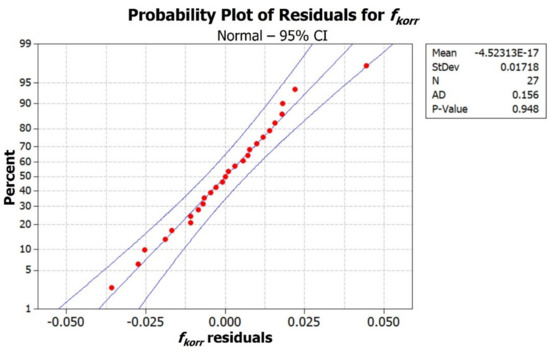
Figure 7.
Normality test: probability plot of the residuals for .
The results of the ANOVA analysis, performed on the data based on the DOE plan are reported in Table 3.
Table 3.
Analysis of variance for .
In the source column, it is possible to view that the single effects of the geometrical parameters and their interactions have been evaluated. DoF, SS, Adj SS, and Adj MS columns represent, respectively, degrees of freedom, sum of squares, adjusted sum of squares, and adjusted mean squares of the relative source. The F-value column is calculated as the ratio between the adjusted mean squares of the relative source and of error, and represent the test statistics for verifying or rejecting the hypothesis that the source has influence on the response (). In practice, if the F-value is lower than the related percentile of F-distribution, it means that the source influence on the response is negligible; if it is higher, on the contrary, the source significantly affects the response. A most useful evaluation of the significance of the source parameter is the analysis of the p-value. This latter is calculated as a function of F-value, the related F-distribution percentile, DoF of the source, and DoF of the error. The p-value represents the probability of obtaining test results at least as extreme as the results observed, under the assumption that the null hypothesis is correct. A very small p-value means that such an extreme observed outcome would be very unlikely under the null hypothesis. A small p-value implies therefore that the null hypothesis is false or something unlikely has occurred. In a formal significance test, the null hypothesis is rejected if the p-value is less than a pre-defined threshold value, depending on the selected confidence interval, which is referred to as the significance level. It is common practice to set the confidence interval to 95% [72], as optioned in the present analysis, thus the significance level for the p-value is equal to 1 − 95% = 0.05. With this evidence (p-values < significance level), the alternative hypothesis should be considered correct.
The results of Table 3 underline that the only gear design parameter affecting is the profile shift coefficient (p-value = 0.002), while the influence of the other parameters and their interactions is negligible (p-values > 0.05). This is also noticeable in Figure 8 where the main effect plots are reported and displays how behaves as a function of each parameter. Every point in the plots of Figure 9 represents the average of the values of related to the particular value of the process parameter, while the bands indicate the dispersion of the measurements. The high slope of the graph related to highlights the great influence of it on the corrective factor, while to low inclination of the graphs, together with the dispersion bands, for and indicates again their negligible contributions. Moreover, Figure 8 suggests that an increase of leads to a rise of .
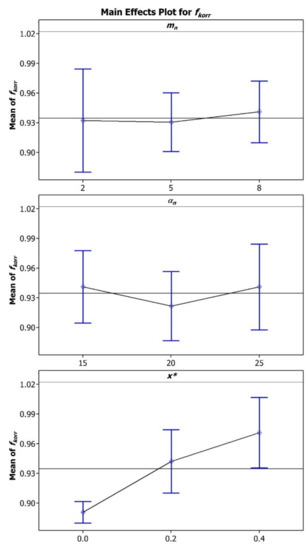
Figure 8.
Plot of the main effects of the analyzed gear design parameters on .
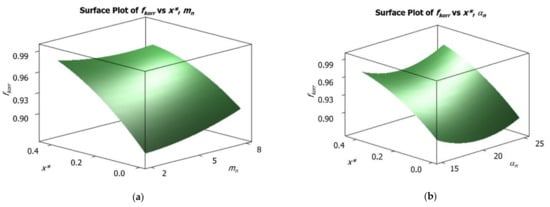
Figure 9.
Surface plots of : (a) in function of and , (b) in function of and .
The lack of significance of and parameters respect to may be noticed also observing the surface plots of Figure 9, that depict the evolution of in the variation range of and (Figure 9a), and of and (Figure 9b). In both plots, in fact, it is clearly visible how the main inclination of the surface is related to the axis representing the variation, while for both and axes the surface slope is trivial.
Following the aforementioned considerations, a statistical regression considering only parameter has been performed, leading to the formulation of a linear mathematical model of reported in Equation (10). Indeed, starting from the above-mentioned evidence it was possible to define a relation between the profile shift coefficient and the correction factor .
The goodness of this relation () was proved with the application of the abovementioned procedure (RG vs. STBF via FEM) to other 6 configuration (Figure 10) coming from literature [21,22,29,30,31,32,73,74,75]. These 6 configurations are characterized by having values for the , the , and the that are not the ones used for the derivation of the regression equation and significantly outside the range used for the DOE (, , ) (Figure 11). These 6 geometries have been simulated (with material properties of 39NiCrMo3) with the aim of obtaining in [26].
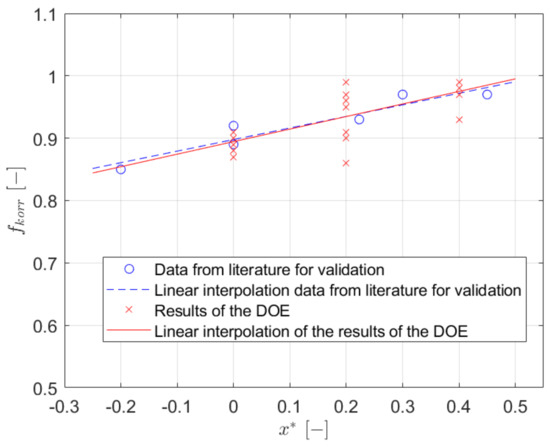
Figure 10.
Results of the linear interpolation.
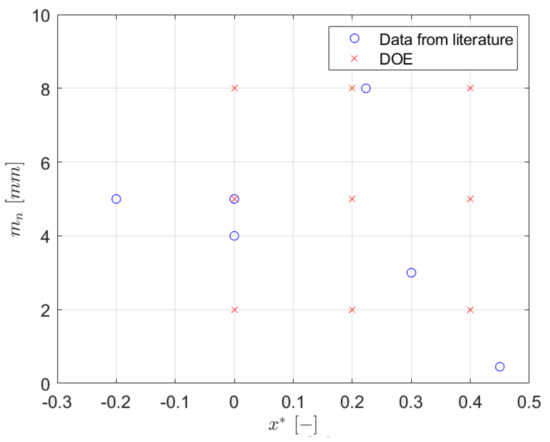
Figure 11.
Date used for the DOE and for the validation.
It is interesting to notice how all the additional data used for validation (blue circles in Figure 10), fall on the regression line (red) and show a maximum error of 3% in the prediction of . This supports the good accuracy of Equation (10) regarding the properties of the material used.
5. Conclusions
In previous studies, the authors have shown that through the application of FEM combined with advanced fatigue criteria based on the critical plane concept is possible to have a better estimation of for any specific gear design (instead of considering always equal to 0.9).
In the present work, the effect of the gear design parameters on the translation of STBF results into MGs’ strength was investigated. Specifically:
- Three design parameters were included in the analysis: the profile shift coefficient , the normal pressure angle , and the normal module .
- For each of those parameters, three different levels were considered, and a full factorial DOE (27 designs) was studied.
- The 27 gear geometries were numerically simulated via FEM both in the RG and in the STBF conditions. The calculated stress states for the 2 configurations (for each gear design) were analyzed exploiting a fatigue criterion based on the critical plane concept, i.e., the Findley criterion.
- For each gear design, the applied load was selected according to the ISO 6336 standard. The comparison between the results of the FEM for the RG and the STBF configurations has led the determination of the correction factor .
- The systematic approach used in the present work and the amount of data collected, allowed to better understand the possible relations between the gear design parameters and .
- An ANOVA has shown that among the three considered parameters (, and ), only the profile shift coefficient have a statistically significant effect on .
- It has been translated in terms of linear regression in Equation (10). To validate the goodness and reliability of this relation, 6 additional gear designs which parameters did not fall in the ranges used for the derivation of the relation between and were investigated with the same procedure.
- The results are aligned with the predictions of the linear model with a maximum error of 4%.
- The relation could be possibly used to improve the reliability of the material parameters obtained via STBF tests.
- Future studies will be aimed at further investigating the effect of material strength parameters (e.g., and , critical to Findley’s implementation) on the relationship between and obtained in this study.
Author Contributions
Conceptualization, F.C.; methodology, F.C. and L.M.; software, L.F., L.M., C.C. and F.C.; writing—original draft preparation, L.M.; writing—review and editing, F.C. and C.C.; supervision, F.C. All authors have read and agreed to the published version of the manuscript.
Funding
This work was supported by the Open Access Publishing Fund of the Free University of Bozen-Bolzano.
Institutional Review Board Statement
Not applicable.
Informed Consent Statement
Not applicable.
Conflicts of Interest
The authors declare no conflict of interest.
Nomenclature
| Addendum coefficient | |
| Dedendum coefficient | |
| Safety Factor | |
| Life factor | |
| Correction factor | |
| Normal module | |
| Ratio between and | |
| Profile shift coefficient | |
| Stress exerting on a plane defined by a normal vector n | |
| Curve determined by along the time | |
| Angle between the loaded tooth axis and the applied forces | |
| Normal pressure angle | |
| Root radius factor | |
| Maximum stress due to pure bending in the fillet region | |
| Permissible bending stress in the fillet region | |
| Material strength | |
| Material strength measured via MG tests | |
| Material strength measured via STBF tests | |
| Maximum stress component normal to the critical plane | |
| Material fatigue limit at symmetrical alternating bending loading | |
| Maximum value assumed by | |
| Minimum value assumed by | |
| Alternating tangential stress on the critical plane | |
| Material fatigue limit at symmetrical alternating torsional loading | |
| Alternating tangential stress on the plane defined by a normal vector n | |
| Average tangential stress on the plane defined by a normal vector n | |
| Angles in polar coordinates defining a plane having normal vector n | |
| Stress Tensor History | |
| Stress component normal to the plane defined by a normal vector n | |
| Stress component tangential to the plane defined by a normal vector n | |
| DOE | Design Of Experiment |
| DP | Damage Parameter |
| FEA | Finite Element Analysis |
| FEM | Finite Element Model |
| MCC | Minimum Circumscribed Circle method |
| MG | Meshing Gears |
| OPSC | Outer Point of Single pair tooth Contact |
| STBF | Single Tooth Bending Fatigue |
| TBF | Tooth (Root) Bending Fatigue |
| TBS | Tooth Bending Strength |
| Face width | |
| Number of teeth |
References
- Vullo, V. Gears Volume 1: Geometric and Kinematic Design; Springer International Publishing: Rome, Italy, 2020; Volume 1. [Google Scholar]
- Concli, F.; Cortese, L.; Vidoni, R.; Nalli, F.; Carabin, G. A mixed FEM and lumped-parameter dynamic model for evaluating the modal properties of planetary gearboxes. J. Mech. Sci. Technol. 2018, 32, 3047–3056. [Google Scholar] [CrossRef]
- Yadav, A. Different Types Failure in Gears—A Review. Int. J. Sci. Eng. Technol. Res. 2012, 1, 86–92. [Google Scholar]
- Fernandes, P.J.L.; McDuling, C. Surface Contact Fatigue Failures in Gears. Eng. Fail. Anal. 1997, 4, 99–107. [Google Scholar] [CrossRef]
- Wu, S.; Cheng, H.S. Sliding Wear Calculation in Spur Gears. J. Tribol. 1993, 115, 493–500. [Google Scholar] [CrossRef]
- Sudhagar, S.; Bhaskara Rao, L. Analytical and Experimental Studies on Wear in Spur Gear Running in Dry Condition. J. Tribol. 2022, 144, 021703. [Google Scholar] [CrossRef]
- Li, S.; Kahraman, A. A Scuffing Model for Spur Gear Contacts. Mech. Mach. Theory 2021, 156, 104161. [Google Scholar] [CrossRef]
- Blake, J.W.; Cheng, H.S. A Surface Pitting Life Model for Spur Gears: Part I—Life Prediction. J. Tribol. 1991, 113, 712–718. [Google Scholar] [CrossRef]
- Liu, H.; Liu, H.; Zhu, C.; Zhou, Y. A Review on Micropitting Studies of Steel Gears. Coatings 2019, 9, 42. [Google Scholar] [CrossRef] [Green Version]
- Fernandes, P.J.L. Tooth Bending Fatigue Failures in Gears. Eng. Fail. Anal. 1996, 3, 219–225. [Google Scholar] [CrossRef]
- Davoli, P.; Conrado, E.; Michaelis, K. Recognizing gear failures. Mach. Des. 2007, 63, 64–67. [Google Scholar]
- Bretl, N.; Schurer, S.; Tobie, T.; Stahl, K.; Höhn, B.-R. Investigations on Tooth Root Bending Strength of Case Hardened Gears in the Range of High Cycle Fatigue. In Proceedings of the American Gear Manufacturers Association Fall Technical Meeting, Indianapolis, IN, USA, 15–17 September 2013; pp. 103–118. [Google Scholar]
- Pantazopoulos, G.A. Bending Fatigue Failure of a Helical Pinion Bevel Gear. J. Fail. Anal. Prev. 2015, 15, 219–226. [Google Scholar] [CrossRef]
- ISO 6336-1:2006; Calculation of Load Capacity of Spur and Helical Gears, Part 1: Basic Principles, Introduction and General Influence Factors. Standard: Genevra, CA, USA, 2006.
- Hong, I.J.; Kahraman, A.; Anderson, N. A Rotating Gear Test Methodology for Evaluation of High-Cycle Tooth Bending Fatigue Lives under Fully Reversed and Fully Released Loading Conditions. Int. J. Fatigue 2020, 133, 105432. [Google Scholar] [CrossRef]
- ISO 6336-3:2006; Calculation of Load Capacity of Spur and Helical Gears, Part 3: Calculation of Tooth Bending Strength. Standard: Genevra, CA, USA, 2006.
- ANSI/AGMA 2001-D04; Fundamental Rating Factors and Calculation Methods for Involute Spur and Helical Gear Teeth. Standard: Alexandria, VA, USA, 2004.
- ISO 6336-5:2006; Calculation of Load Capacity of Spur and Helical Gears-Part 5: Strength and Quality of Materials. Standard: Geneva, CA, USA, 2006.
- Rao, S.B.; McPherson, D.R. Experimental characterization of bending fatigue strength in gear teeth. Gear Technol. 2003, 20, 25–32. [Google Scholar]
- McPherson, D.R.; Rao, S.B. Methodology for Translating Single-Tooth Bending Fatigue Data to Be Comparable to Running Gear Data. Gear Technol. 2008, 20, 25–32. [Google Scholar]
- Benedetti, M.; Fontanari, V.; Höhn, B.-R.; Oster, P.; Tobie, T. Influence of Shot Peening on Bending Tooth Fatigue Limit of Case Hardened Gears. Int. J. Fatigue 2002, 24, 1127–1136. [Google Scholar] [CrossRef]
- Dobler, A.; Hergesell, M.; Tobie, T.; Stahl, K. Increased Tooth Bending Strength and Pitting Load Capacity of Fine-Module Gears. Gear Technol. 2016, 33, 48–53. [Google Scholar]
- Medlin, D.J.; Cornelissen, B.E.; Matlock, D.K.; Krauss, G.; Filar, R.J. Effect of Thermal Treatments and Carbon Potential on Bending Fatigue Performance of SAE 4320 Gear Steel. SAE Tech. Pap. 1999, 108, 547–556. [Google Scholar] [CrossRef]
- Spice, J.J.; Matlock, D.K.; Fett, G. Optimized Carburized Steel Fatigue Performance as Assessed with Gear and Modified Brugger Fatigue Tests. SAE Tech. Pap. 2002, 111, 589–597. [Google Scholar] [CrossRef] [Green Version]
- Vilela Costa, L.; Corrêa de Oliveira, D.; Wallace, D.; Lelong, V.; Findley, K.O. Bending Fatigue in Low-Pressure Carbonitriding of Steel Alloys with Boron and Niobium Additions. J. Mater. Eng. Perform. 2020, 29, 3593–3602. [Google Scholar] [CrossRef]
- Concli, F.; Fraccaroli, L.; Maccioni, L. Gear Root Bending Strength: A New Multiaxial Approach to Translate the Results of Single Tooth Bending Fatigue Tests to Meshing Gears. Metals 2021, 11, 863. [Google Scholar] [CrossRef]
- Bonaiti, L.; Bayoumi, A.B.M.; Concli, F.; Rosa, F.; Gorla, C. Gear Root Bending Strength: A Comparison between Single Tooth Bending Fatigue Tests and Meshing Gears. J. Mech. Des. Trans. ASME 2021, 143, 103402. [Google Scholar] [CrossRef]
- Rao, S.B.; McPherson, D.R. Mechanical Testing of Gears. ASM Handb. 2000, 8, 861–872. [Google Scholar]
- Gorla, C.; Conrado, E.; Rosa, F.; Concli, F. Contact and Bending Fatigue Behaviour of Austempered Ductile Iron Gears. Proc. Inst. Mech. Eng. Part C J. Mech. Eng. Sci. 2018, 232, 998–1008. [Google Scholar] [CrossRef]
- Meneghetti, G.; Dengo, C.; Lo Conte, F. Bending Fatigue Design of Case-Hardened Gears Based on Test Specimens. Proc. Inst. Mech. Eng. Part C J. Mech. Eng. Sci. 2018, 232, 1953–1969. [Google Scholar] [CrossRef]
- Gorla, C.; Rosa, F.; Conrado, E.; Albertini, H. Bending and Contact Fatigue Strength of Innovative Steels for Large Gears. Proc. Inst. Mech. Eng. Part C J. Mech. Eng. Sci. 2014, 228, 2469–2482. [Google Scholar] [CrossRef] [Green Version]
- Concli, F. Tooth Root Bending Strength of Gears: Dimensional Effect for Small Gears Having a Module below 5 Mm. Appl. Sci. 2021, 11, 2416. [Google Scholar] [CrossRef]
- Concli, F.; Fraccaroli, L. Bending Fatigue Strength of Small Size 2 Mm Module Gears. Proc. WIT Trans. Eng. Sci. 2021, 133, 39–46. [Google Scholar]
- Hong, I.; Teaford, Z.; Kahraman, A. A Comparison of Gear Tooth Bending Fatigue Lives from Single Tooth Bending and Rotating Gear Tests | Ein Vergleich Der Ermüdungserscheinungen von Zahnradzähnen Aus Einzelzahnbiege- Und Drehgetriebetests. Forsch. Ing. 2021, 1–13. [Google Scholar] [CrossRef]
- Podrug, S.; Jelaska, D.; Glodež, S. Influence of Different Load Models on Gear Crack Path Shapes and Fatigue Lives. Fatigue Fract. Eng. Mater. Struct. 2008, 31, 327–339. [Google Scholar] [CrossRef]
- Concli, F. Austempered Ductile Iron (ADI) for Gears: Contact and Bending Fatigue Behavior. Proc. Procedia Struct. Integr. 2018, 8, 14–23. [Google Scholar] [CrossRef]
- Gorla, C.; Rosa, F.; Concli, F.; Albertini, H. Bending Fatigue Strength of Innovative Gear Materials for Wind Turbines Gearboxes: Effect of Surface Coatings. In Proceedings of the ASME International Mechanical Engineering Congress and Exposition, Houston, TX, USA, 9–15 November 2012; Volume 45233, pp. 3141–3147. [Google Scholar]
- Gasparini, G.; Mariani, U.; Gorla, C.; Filippini, M.; Rosa, F. Bending Fatigue Tests of Helicopter Case Carburized Gears: Influence of Material, Design and Manufacturing Parameters. In Proceedings of the American Gear Manufacturers Association-American Gear Manufacturers Association Fall Technical Meeting, San Antonio, TX, USA, 12–14 October 2008; pp. 131–142. [Google Scholar]
- Gorla, C.; Rosa, F.; Conrado, E.; Concli, F. Bending Fatigue Strength of Case Carburized and Nitrided Gear Steels for Aeronautical Applications. Int. J. Appl. Eng. Res. 2017, 12, 11306–11322. [Google Scholar]
- Rao, S.B.; McPherson, D.R.; Schwanger, V.; Rudd, C. Measurement and Validation of Dynamic Bending Stresses in Spur Gear Teeth. In Proceedings of the ASME International Design Engineering Technical Conferences and Computers and Information in Engineering Conference, Long Beach, CA, USA, 24–28 September 2005; Volume 5, pp. 755–764. [Google Scholar]
- Wagner, M.; Isaacson, A.; Knox, K.; Hylton, T. Single Tooth Bending Fatigue Testing at Any r Ratio. In Proceedings of the 2020 AGMA/ABMA Annual Meeting, Buena Vista, FL, USA, 19–21 March 2020. [Google Scholar]
- Rettig, H. Ermittlung von Zahnfußfestigkeitskennwerten Auf Verspannungsprüfständen Und Pulsatoren-Vergleich Der Prüfverfahren Und Der Gewonnenen Kennwerte. Antriebstechnik 1987, 26, 51–55. [Google Scholar]
- Stahl, K. Lebensdauer Statistik: Abschlussbericht. Forschungsvorhaben Nr. 304; FVA: Frankfurt am Main, Germany, 1999. [Google Scholar]
- Concli, F.; Maccioni, L.; Bonaiti, L. Reliable Gear Design: Translation of the Results of Single Tooth Bending Fatigue Tests Through the Combination of Numerical Simulations and Fatigue Criteria. In Proceedings of the WIT Transactions on Engineering Sciences, Tallinn, Estonia, 24–26 May 2021; pp. 111–122. [Google Scholar] [CrossRef]
- Gough, H.J.; Pollard, H.V. The Strength of Metals under Combined Alternating Stresses. Proc. Inst. Mech. Eng. 1935, 131, 3–103. [Google Scholar] [CrossRef]
- Crossland, B. Effect of Large Hydrostatic Pressures on the Torsional Fatigue Strength of an Alloy Steel. Proc. Int. Conf. Fatigue Met. 1956, 138, 12. [Google Scholar]
- Findley, W.N. A Theory for the Effect of Mean Stress on Fatigue of Metals under Combined Torsion and Axial Load or Bending. J. Eng. Ind. 1959, 81, 301–306. [Google Scholar] [CrossRef]
- Matake, T. Explanation on Fatigue Limit Under Combined Stress. Bull JSME 1977, 20, 257–264. [Google Scholar] [CrossRef]
- Macha, E. Mathematical Models of the Life to Fracture for Materials Subject to Random Complex Stress Systems; Scientific Papers of the Institute of Material Science and Applied Mechanics of Wroclaw Technical University; Wroclaw University of Science and Technology: Wroclaw, Poland, 1979; p. 41. [Google Scholar]
- McDiarmid, D.L. Fatigue under Out-of-Phase Biaxial Stresses of Different Frequencies. Multiaxial Fatigue 1985, 606–621. [Google Scholar] [CrossRef]
- Dang Van, K. Macro-Micro Approach in High-Cycle Multiaxial Fatigue. Adv. Multiaxial Fatigue 1993, 1191, 120–130. [Google Scholar]
- Fatemi, A.; Kurath, P. Multiaxial Fatigue Life Predictions under the Influence of Mean-Stresses. J. Eng. Mater. Technol. Trans. ASME 1988, 110, 380–388. [Google Scholar] [CrossRef]
- Papadopoulos, I.V. A High-Cycle Fatigue Criterion Applied in Biaxial And Triaxial Out-Of-Phase Stress Conditions. Fatigue Fract. Eng. Mater. Struct. 1995, 18, 79–91. [Google Scholar] [CrossRef]
- Macha, E.; Sonsino, C.M. Energy Criteria of Multiaxial Fatigue Failure. Fatigue Fract. Eng. Mater. Struct. 1999, 22, 1053–1070. [Google Scholar] [CrossRef]
- Lagoda, T.; Macha, E.; Bȩdkowski, W.X. Critical Plane Approach Based on Energy Concepts: Application to Biaxial Random Tension-Compression High-Cycle Fatigue Regime. Int. J. Fatigue 1999, 21, 431–443. [Google Scholar] [CrossRef]
- Carpinteri, A.; Spagnoli, A.; Vantadori, S. A Multiaxial Fatigue Criterion for Random Loading. Fatigue Fract. Eng. Mater. Struct. 2003, 26, 515–522. [Google Scholar] [CrossRef]
- Karolczuk, A.; Macha, E. A Review of Critical Plane Orientations in Multiaxial Fatigue Failure Criteria of Metallic Materials. Int. J. Fract. 2005, 134, 267–304. [Google Scholar] [CrossRef]
- Sines, G. Behavior of Metals under Complex Static and Alternating Stresses. Met. Fatigue 1959, 1, 145–169. [Google Scholar]
- Savaria, V.; Bridier, F.; Bocher, P. Predicting the Effects of Material Properties Gradient and Residual Stresses on the Bending Fatigue Strength of Induction Hardened Aeronautical Gears. Int. J. Fatigue 2016, 85, 70–84. [Google Scholar] [CrossRef]
- Hotait, M.A.; Kahraman, A. Estimation of Bending Fatigue Life of Hypoid Gears Using a Multiaxial Fatigue Criterion. J. Mech. Des. Trans. ASME 2013, 135, 101005. [Google Scholar] [CrossRef]
- Liu, Y.; Mahadevan, S. A Unified Multiaxial Fatigue Damage Model for Isotropic and Anisotropic Materials. Int. J. Fatigue 2007, 29, 347–359. [Google Scholar] [CrossRef]
- Concli, F.; Maccioni, L. Critical Planes Criteria Applied to Gear Teeth: Which One Is the Most Appropriate to Characterize Crack Propagation? Proc. WIT Trans. Eng. Sci. 2021, 133, 15–25. [Google Scholar] [CrossRef]
- Concli, F.; Maccioni, L.; Fraccaroli, L.; Bonaiti, L. Early Crack Propagation in Single Tooth Bending Fatigue: Combination of Finite Element Analysis and Critical-Planes Fatigue Criteria. Metals 2021, 11, 1817. [Google Scholar] [CrossRef]
- Papadopoulos, I.V. Critical Plane Approaches in High-Cycle Fatigue: On the Definition of the Amplitude and Mean Value of the Shear Stress Acting on the Critical Plane. Fatigue Fract. Eng. Mater. Struct. 1998, 21, 269–285. [Google Scholar] [CrossRef]
- Susmel, L.; Tovo, R.; Lazzarin, P. The Mean Stress Effect on the High-Cycle Fatigue Strength from a Multiaxial Fatigue Point of View. Int. J. Fatigue 2005, 27, 928–943. [Google Scholar] [CrossRef]
- Susmel, L. On the Overall Accuracy of the Modified Wöhler Curve Method in Estimating High-Cycle Multiaxial Fatigue Strength. Frat. Ed Integrità Strutt. 2011, 16, 5–17. [Google Scholar] [CrossRef] [Green Version]
- Belarhzal, S.; Daoudi, K.; Boudi, E.M.; Bachir, A.; Elmoumen, S. A multiobjective optimization analysis of spur gear pair: The profile shift factor effect on structure design and efficiency. Math. Probl. Eng. 2021, 2021, 8873769. [Google Scholar] [CrossRef]
- Gołębski, R. Experimental Method of Machining Gears with an Involute Profile Using CNC Lathe with Driven Tools. Materials 2022, 15, 1077. [Google Scholar] [CrossRef]
- Gołębski, R.; Boral, P. Study of machining of gears with regular and modified outline using CNC machine tools. Materials 2021, 14, 2913. [Google Scholar] [CrossRef]
- Gołębski, R.; Ivandić, Ž. Analysis of modification of spur gear profile. Teh. Vjesn. 2018, 25, 643–648. [Google Scholar] [CrossRef] [Green Version]
- Bernasconi, A.; Foletti, S.; Papadopoulos, I.V. A Study on Combined Torsion and Axial Load Fatigue Limit Tests with Stresses of Different Frequencies. Int. J. Fatigue 2008, 30, 1430–1440. [Google Scholar] [CrossRef]
- Montgomery, D.C. Design and Analysis of Experiments, 10th ed.; Wiley: Sedona, AZ, USA, 2019. [Google Scholar]
- Benedetti, M.; Menapace, C. Tooth root bending fatigue strength of small-module sinter-hardened spur gears. Powder Metall. 2017, 60, 149–156. [Google Scholar] [CrossRef]
- Eyercioglu, O.; Walton, D.; Dean, T.A. Comparative bending fatigue strength of precision forged spur gears. Proc. Inst. Mech. Eng. Part C J. Mech. Eng. Sci. 1997, 211, 293–299. [Google Scholar] [CrossRef]
- Conrado, E.; Gorla, C.; Davoli, P.; Boniardi, M. A comparison of bending fatigue strength of carburized and nitrided gears for industrial applications. Eng. Fail. Anal. 2017, 78, 41–54. [Google Scholar] [CrossRef]
Publisher’s Note: MDPI stays neutral with regard to jurisdictional claims in published maps and institutional affiliations. |
© 2022 by the authors. Licensee MDPI, Basel, Switzerland. This article is an open access article distributed under the terms and conditions of the Creative Commons Attribution (CC BY) license (https://creativecommons.org/licenses/by/4.0/).