Article

Organ-on-a-Chip: Design and Simulation of Various Microfluidic Channel Geometries for the Influence of Fluid Dynamic Parameters

by
Francesca Pisapia
,
Wamadeva Balachandran
* and
Manoochehr Rasekh
*
College of Engineering, Design and Physical Sciences, Brunel University London, Uxbridge, London UB8 3PH, UK
*
Authors to whom correspondence should be addressed.
Appl. Sci. 2022, 12(8), 3829; https://doi.org/10.3390/app12083829
Submission received: 14 February 2022 / Revised: 21 March 2022 / Accepted: 5 April 2022 / Published: 11 April 2022

Abstract

:
Shear stress, pressure, and flow rate are fluid dynamic parameters that can lead to changes in the morphology, proliferation, function, and survival of many cell types and have a determinant impact on tissue function and viability. Microfluidic devices are promising tools to investigate these parameters and fluid behaviour within different microchannel geometries. This study discusses and analyses different designed microfluidic channel geometries regarding the influence of fluid dynamic parameters on their microenvironment at specified fluidic parameters. The results demonstrate that in the circular microchamber, the velocity and shear stress profiles assume a parabolic shape with a maximum velocity occurring in the centre of the chamber and a minimum velocity at the walls. The longitudinal microchannel shows a uniform velocity and shear stress profile throughout the microchannel. Simulation studies for the two geometries with three parallel microchannels showed that in proximity to the micropillars, the velocity and shear stress profiles decreased. Moreover, the pressure is inversely proportional to the width and directly proportional to the flow rate within the microfluidic channels. The simulations showed that the velocity and wall shear stress indicated different values at different flow rates. It was also found that the width and height of the microfluidic channels could affect both velocity and shear stress profiles, contributing to the control of shear stress. The study has demonstrated strategies to predict and control the effects of these forces and the potential as an alternative to conventional cell culture as well as to recapitulate the cell- and organ-specific microenvironment.

1. Introduction

Organ transplantation represents the ideal treatment and solution for patients with severe organ failure. However, waiting lists are very long due to limited organ availability. During the last few years, scientists have tried to find alternatives to currently available therapies. Drug therapy represents an alternative treatment, but it is time-consuming and expensive [1,2]. Stem cell therapy is another available treatment to help remodel damaged tissue. However, there have not been reported many successes yet, as these injected cells have failed to develop vascularisation and extracellular matrix (ECM) due to the hostile environment that surrounds them [3,4,5,6]. For example, cardiac tissue engineering aims to fabricate constructs capable of restoring the function of damaged heart tissue [7,8,9]. However, many challenges remain unknown due to the complexity of mimicking the properties and hierarchy of native cardiac tissue. The rapid development of miniaturisation technologies has given rise to microfluidics. Microfluidic devices (MFDs) consist of a set of moulded microchannels on a biocompatible polymeric material, such as polymer polydimethylsiloxane (PDMS), through which it is possible to flow biomolecule suspensions to investigate their behaviour in real time under various controlled conditions. The volumes involved are either micro- or nano-litres. Fluid dynamics at the micrometre scale allows the physiological conditions that cells experience in the human body to be simulated by providing mechanical, electrical, and molecular cues [10,11]. Currently, the new emerging technology is the so-called organ-on-a-chip (OOC), which uses microfluidic technology to reproduce and mimic the physiological microenvironment of certain tissues or organs and to recapitulate the organs’ specific microenvironment [12,13]. The OOC platforms allow the limitations and disadvantages of two-dimensional (2D) cell culture and animal models to be overcome. Although 2D cell culture provides useful preliminary data, it does not fully recapitulate the organ microenvironment [14,15,16]. Animal studies can provide extremely useful and detailed information on what happens in a complex organism, but many issues are still challenging, such as ethical concerns and difficulties in predicting human reactions and body responses due to differences in both the metabolic rate and the size of animal models [15,16]. Therefore, the need to design and develop a platform that can recapitulate the human organ microenvironment has led to the development of OOC involving the intersection of cell biology and microfluidic engineering [17]. During the past decade, different types of OOC have been developed by scientists to reproduce the critical mechanical, structural, and functional properties of human organs [17,18,19]. For instance, a study of a heart-on-a-chip allowed researchers to investigate the human cardiac tissue’s three-dimensional (3D) microenvironment and damaged heart tissue [20,21]. The studies conducted on MFDs have shown the influence of channel geometry on cell properties and characteristics. A study by Kobuszewska et al. [22] has shown how the geometry of the microchannels can affect the proliferation, morphology, and alignment of cardiomyoblasts using three different microchannel geometries that were simulated to analyse the distribution of flow and wall shear stress within the channels. Additionally, other researchers investigated how microchannel width can affect spontaneous cell migration, demonstrating that the width of the microchannels influenced the ability of the cells to cross over to the collection chamber [23,24]. A micropillar-based microfluidic system designed by other scientists was to perform dynamic fluid simulations to obtain wall shear stress and pressure within the device when used to grow 3D and 2D heart cell cultures, indicating that cardiomyocytes proliferate better in 3D than in 2D [25]. The effect of microchannel geometry on cell adhesion has been investigated by designing channels with sharp and curved turns and performing fluid dynamic simulations showing the uniform distribution of velocity and stress within curved-turn microchannels [26,27,28]. The effect of shear stress within the channels of different widths on the function of aortic valvular interstitial cells was studied, indicating that the magnitude of shear stress regulates cell morphology, phenotype transformation, and the formation of focal adhesion while the cells align in the direction of the flow [29,30]. On the other hand, OOC devices still have some limitations, such as the difficulty of modelling the organs on micrometric scales, creating vascularised tissues, and the difficulty of reproducing adequate levels of oxygen and nutrients [31]. The controlled environment of microfluidic devices offers the ability to change the fluidic parameters, making it possible to study cell interactions and fluid behaviour. For example, the changes in flow rate and pressure at varied geometric dimensions have led to the understanding of the role of various factors responsible for cell adhesion, gene expression, remodelling of the cytoskeleton and cell death [27,32,33]. Computational tools have played an important role in complementing experimental studies, as they allow parameters to be defined that are difficult to measure with experimental methods, such as velocity, shear stress and pressure [34,35,36]. Mosavati et al. [37] simulated the flow behavior and glucose concentration profiles to study the geometry of two microfluidic channels that were separated by a porous membrane. They demonstrated that the rate of glucose diffusion increases with membrane porosity and decreases with a flow rate of 50 µL/h. Peng et al. studied fluid flow velocity (0.01–0.05 m/s) and heat transfer using a COMSOL Multiphysics simulation to evaluate the temperature profile at different locations of a microfluidic device consisting of three layers, in which the cell suspension flows across the fluidic layers in the chip with a width-to-height ratio of 5:1. They demonstrated an actual temperature control and manipulation of the developed microfluidic cooling/heating system offering the capability of manipulating on-chip localised temperature (2 °C to 37 °C) due to typical cytotoxic issues with additive cryoprotective agents [38]. Other researchers examined metastatic behaviour within a 3D-bioprinted vasculature to validate a 3D computational flow model showing the contribution of hydrodynamics in determining sites of circulating tumor cell vascular colonization. They demonstrated that the bioprinted analog was readily capable of evaluating the accuracy and integrated complexity of a computational flow model and the discrete contribution of hydrodynamics in vascular colonization [39].
In addition to normal planar microfluidic channels, we have designed and simulated four different 3D microfluidic channel geometries incorporating micropillars compared to previous studies. Given that geometrical (i.e., width and height) and fluid dynamic parameters (i.e., wall shear stress, pressure, flow rate, velocity) have significant effects on cell morphology, proliferation, alignment, migration, and cell adhesion, various flow velocities within different design geometries were studied for the effects of their geometrical and fluid dynamic parameters in order to predict and control the effects of these forces and their potential as an alternative to conventional cell culture as well as for cell survivability and to recapitulate the cell- and organ-specific microenvironment.

2. Materials and Methods

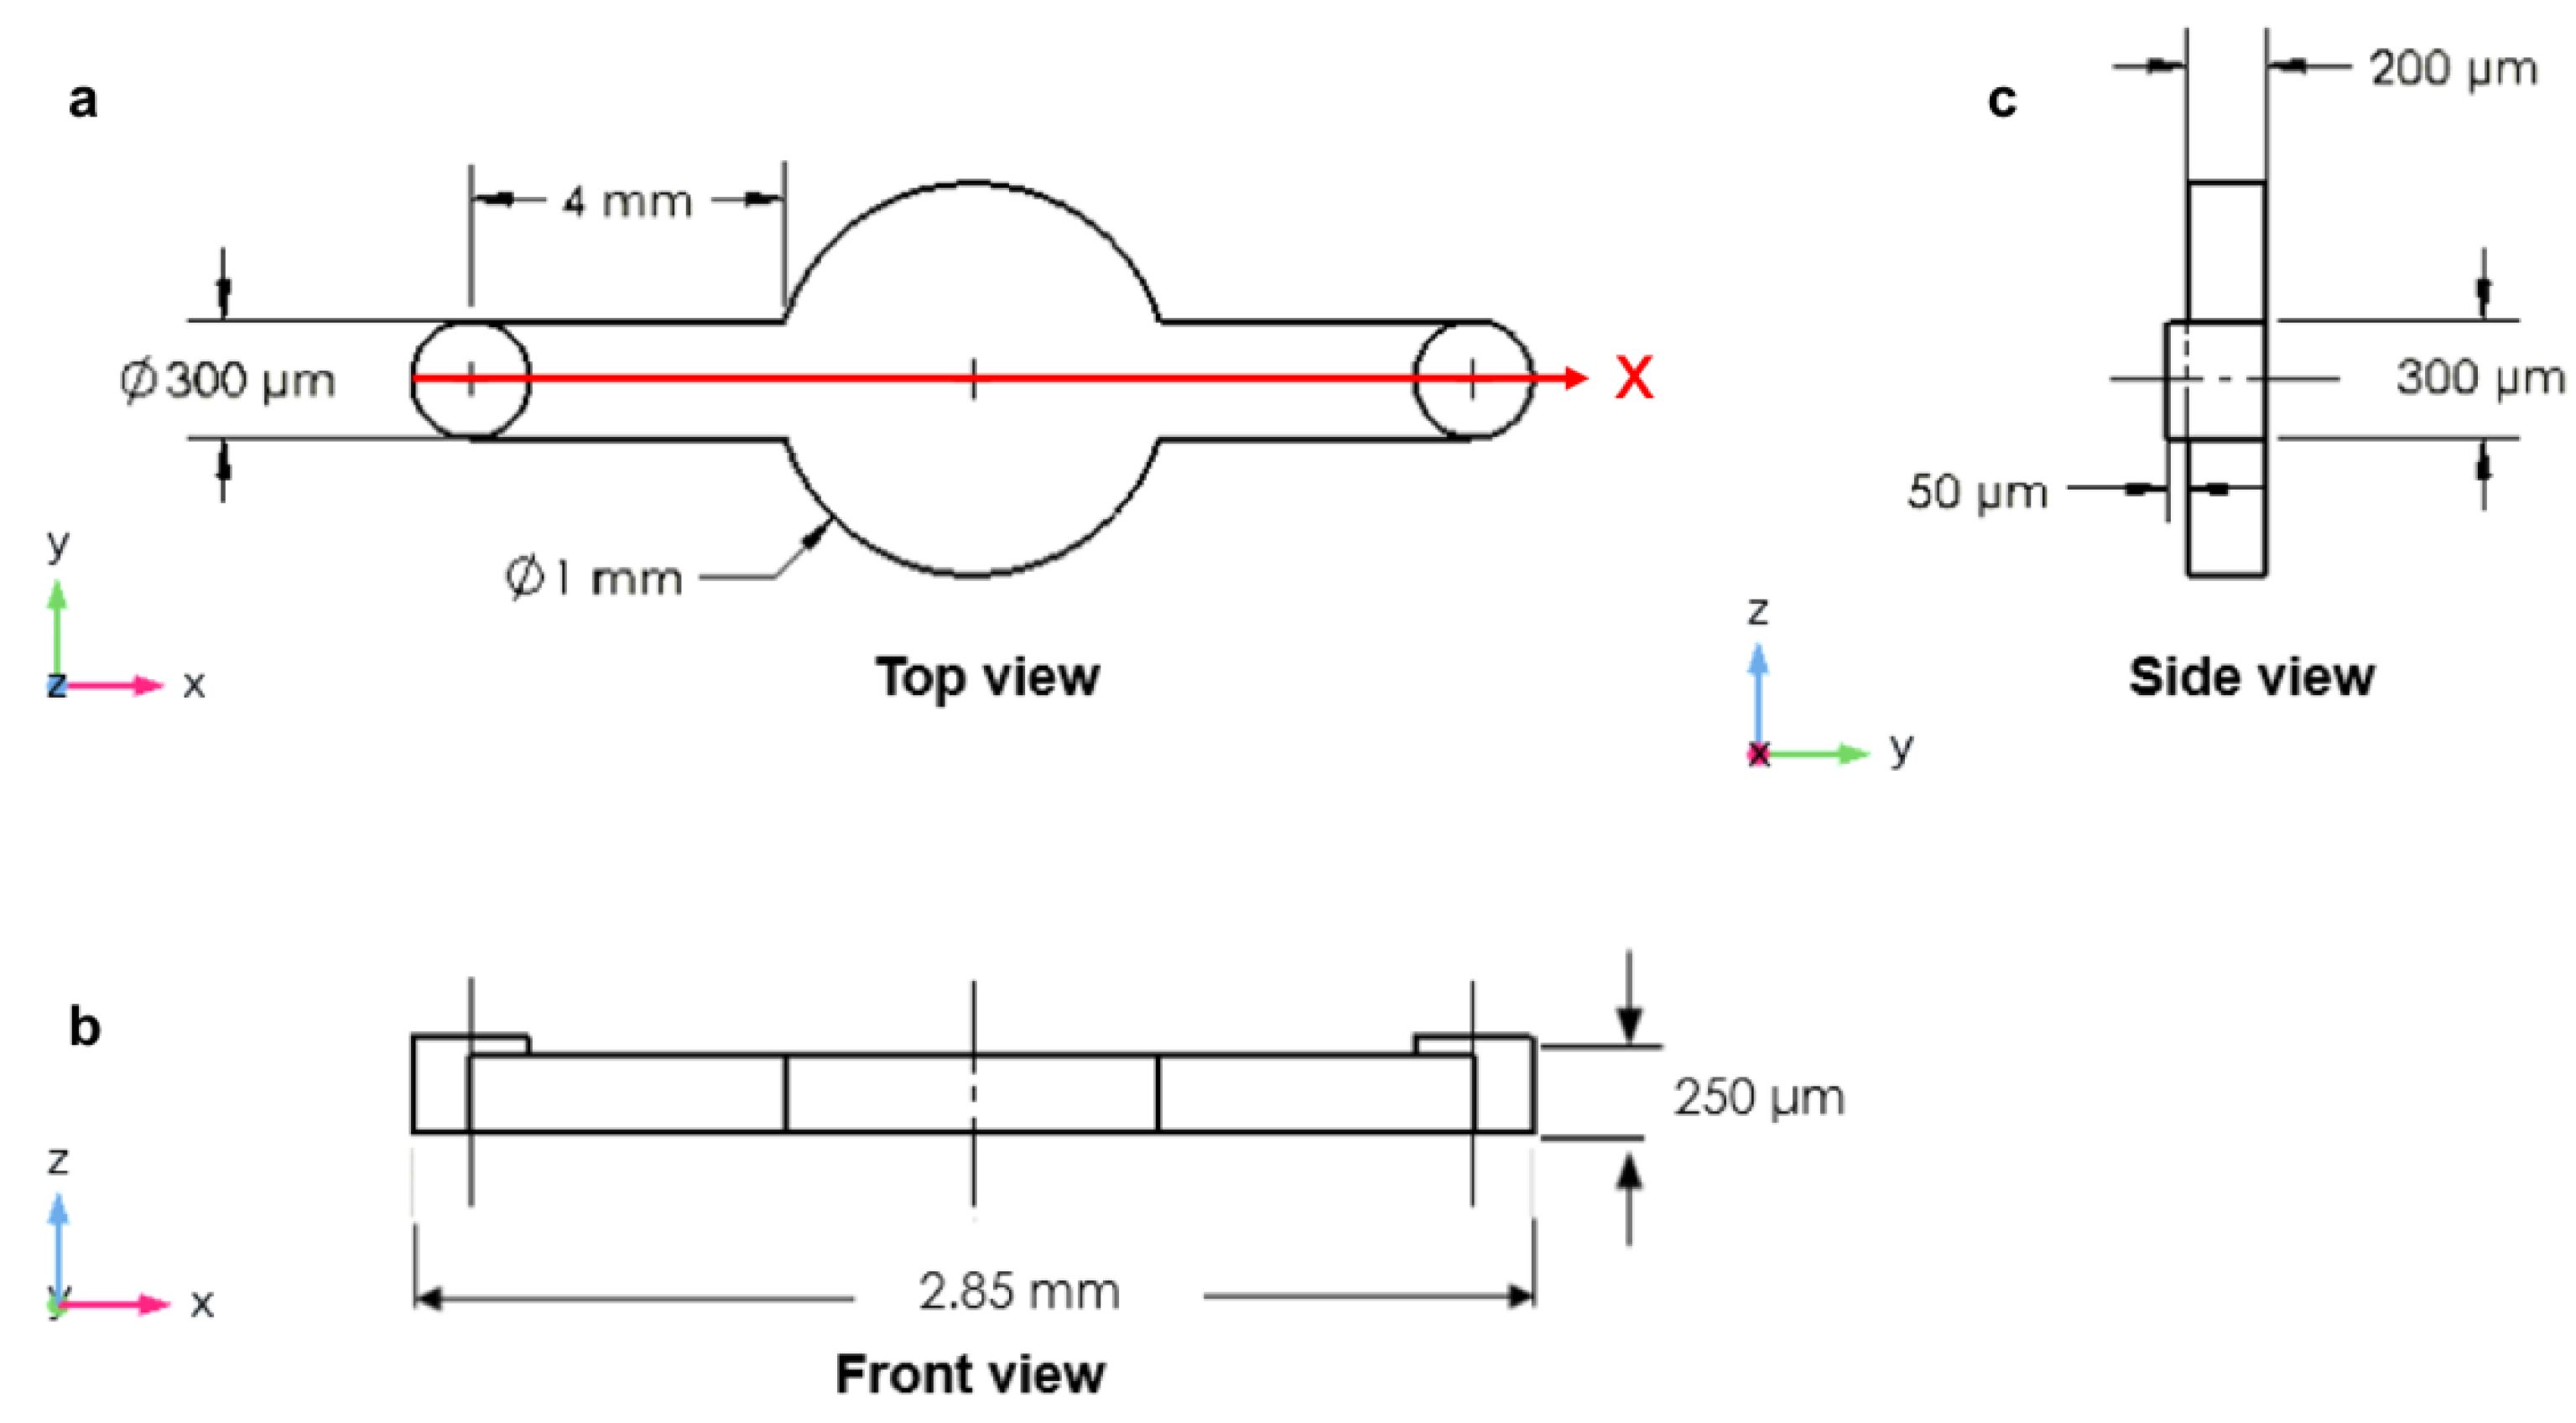
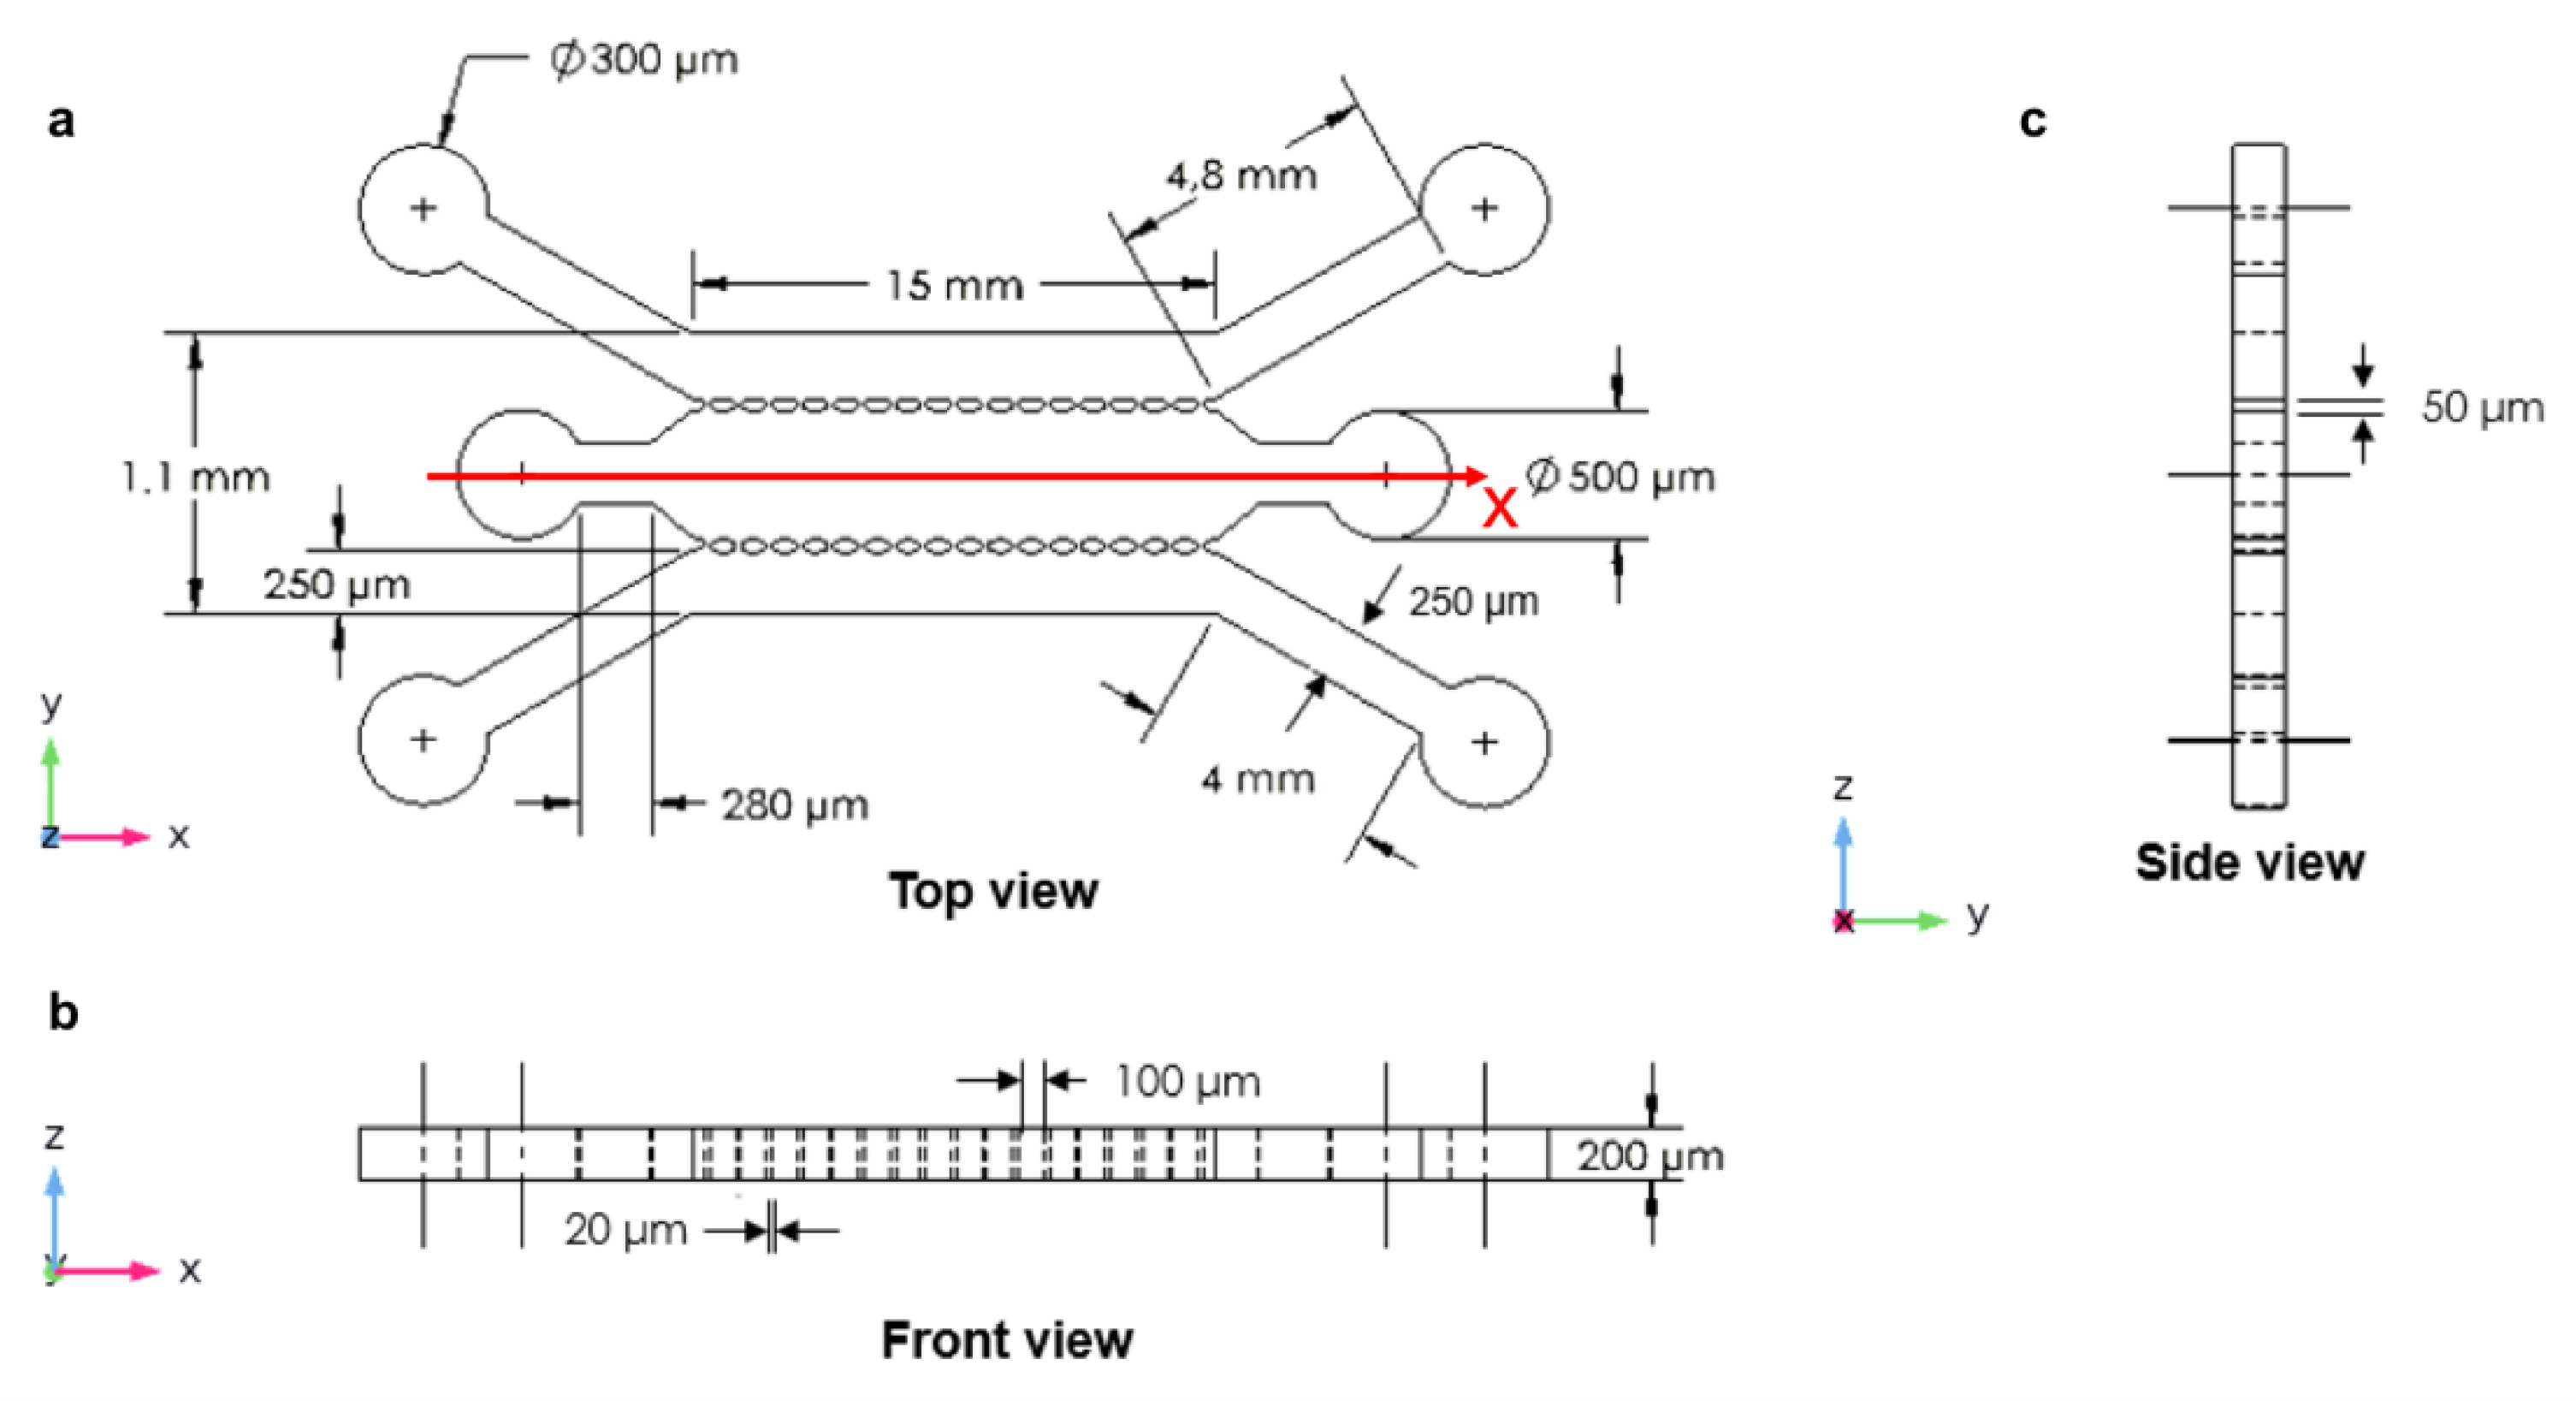
2.1. The Design of Microfluidic Devices

Four different microfluidic channel geometries were designed by using SolidWorks software, version SP0, 2019 (Dassault Systems, Paris, France). To obtain a 3D design, each geometry was extruded at a specific height along the z-direction of the Cartesian reference system x, y, and z. The first design was a circular microchamber with an input and output microchannel diameter of 300 µm. The length of the input and output microchannels was 4 mm on each side. The cultivation chamber, located in the center of the device, had a circular shape with a diameter of 1 mm. The height (depth) of the microchannel was 200 µm, while the height of the inlet and outlet was 250 µm (Figure 1).
The second designed device consisted of a straight microchannel with cylindrical inlet and outlet ports with a diameter of 115 µm each. The microchannel had a width of 250 µm, length of 12 mm and height of 200 µm. The input and output ports had a length of 300 µm, a diameter of 115 µm and a height of 250 µm (Figure 2). The input can also be connected to external pumping equipment. This can be a micropump or a screw pump.
The third device was designed with three microchannels which were arranged in parallel and separated from each other by two rows of micropillars with a width of 50 µm, length of 100 µm, and spacing of 20 µm (Figure 3a). This included the three inlets and three outlets, which were connected to the main microchannel and the side microchannels. This design provided the main microchannel for culturing and encapsulation of cells and the side microchannels for injecting culture medium. The length of this microfluidic device was 15 mm, and the width was 500 µm for the main microchannel and 250 µm for each of the two side microchannels with a height of 200 µm (Figure 3).
Unlike the third designed device, the fourth designed microfluidic device (closed microchannel structure) had only two inlet and two outlet chambers: one inlet and one outlet for the two side microchannels and one inlet and one outlet for the central microchannel. This device also had three microchannels arranged in parallel and separated by two rows of micropillars with a width of 100 µm, length of 120 µm, and a gap spacing of 50 µm between the micropillars (Figure 4a). The device had a length of 15 mm with a width of 350 µm for the main microchannel and 250 µm for the side microchannels. The height of the microchannels was 200 µm (Figure 4). The microchannels were rectangular cross-sections, and the input and output connectors were cylindrical in shape to facilitate the external feed and waste flexible tubes.

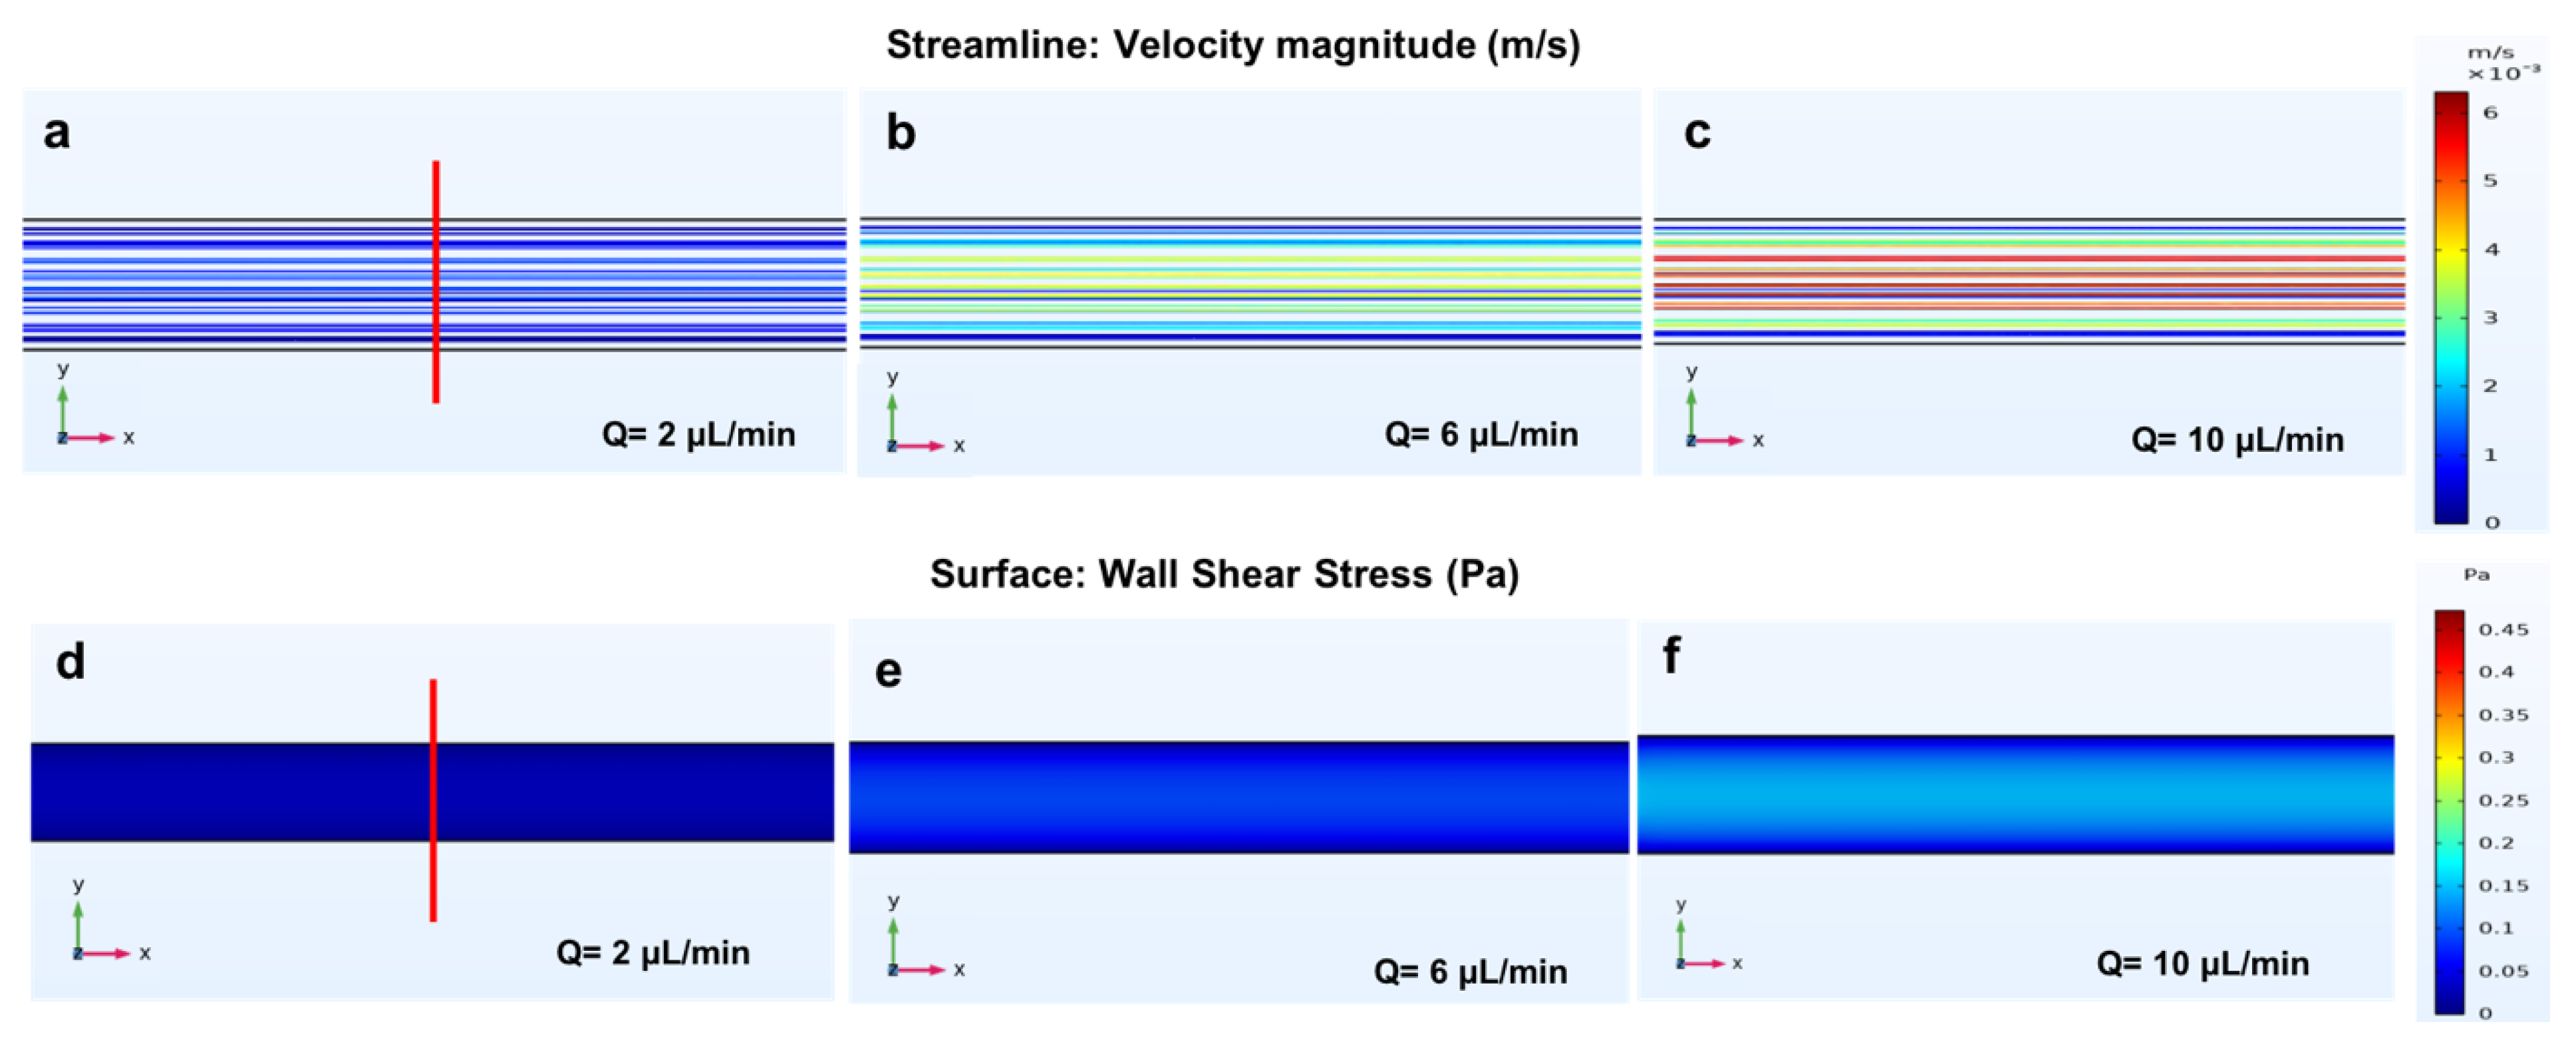
2.2. Computational Fluid Dynamic Simulation

Fluid dynamic analysis was performed using COMSOL Multiphysics (COMSOL Inc., version 5.5, 2020, Stockholm, Sweden). The designed microfluidic geometries were imported from SolidWorks software (SolidWorks, Version SP0, 2019, Dassault Systems) using the LiveLink function of COMSOL Multiphysics. In microfluidic devices with small microchannel geometric length scales, the movement of the fluid is governed by the continuity Equation (1) and the Navier–Stokes Equation (2) [40]. A physics-controlled mesh, which is a software default mesh, was used with an element size set to normal due to the limitations of both the computational capacity and processing time of the computer.
· U ¯ = 0
ρ ( δ U ¯ δ t + U ¯ · U ¯ ) = p + ρ g ¯ + · [ τ ¯ ]
where ρ is the density of the fluid under investigation (kg/m3), U ¯ = (u, v, w) is the flow velocity vector (m/s), p is the pressure (Pa), is the divergence and [ τ ¯ ] is the shear stress tensor Pa. The computational fluid dynamic (CFD) simulation was implemented to solve the incompressible Navier–Stokes Equation (2) and the continuity Equation (1) to evaluate the velocity fields, the shear stresses, and the pressure inside the different microchannel geometries.
The type of physics selected to solve the simulations was single-phase creeping flow, which is suitable for small-geometrical-length-scale microfluidic devices. The steady-state condition was selected. Subsequently, a no-slip boundary condition was applied to the walls. Different values of flow rate (2, 3, 5, 6, 7 and 10 µL/min) were used as inlet conditions for the four different microchannel geometries. The pressure at the outlets was set at P = 0 Pa, which refers to the inlets (no backpressure). Additionally, water was considered as a reference fluid to run the simulations as it is a Newtonian fluid, meaning that its shear stress ( τ ) is proportional to the shear rate ( γ ˙ ), and μ is the fluid viscosity according to Equation (3) [41].
τ = μ γ ˙
The Reynolds number as the main controlling parameter in fluid flow within the microfluidic channels is very low (<1); therefore, the fluid within the microchannels is laminar. In addition, for the designed microchannel geometries, the fluid flow is laminar throughout the microchannel due to the low flow rate and the small overall microchannel dimensions. Thus, there will not be turbulences that may either disrupt or damage the cells [42]. Moreover, the rheological properties of water are similar to those of the culture medium used for cell cultures.

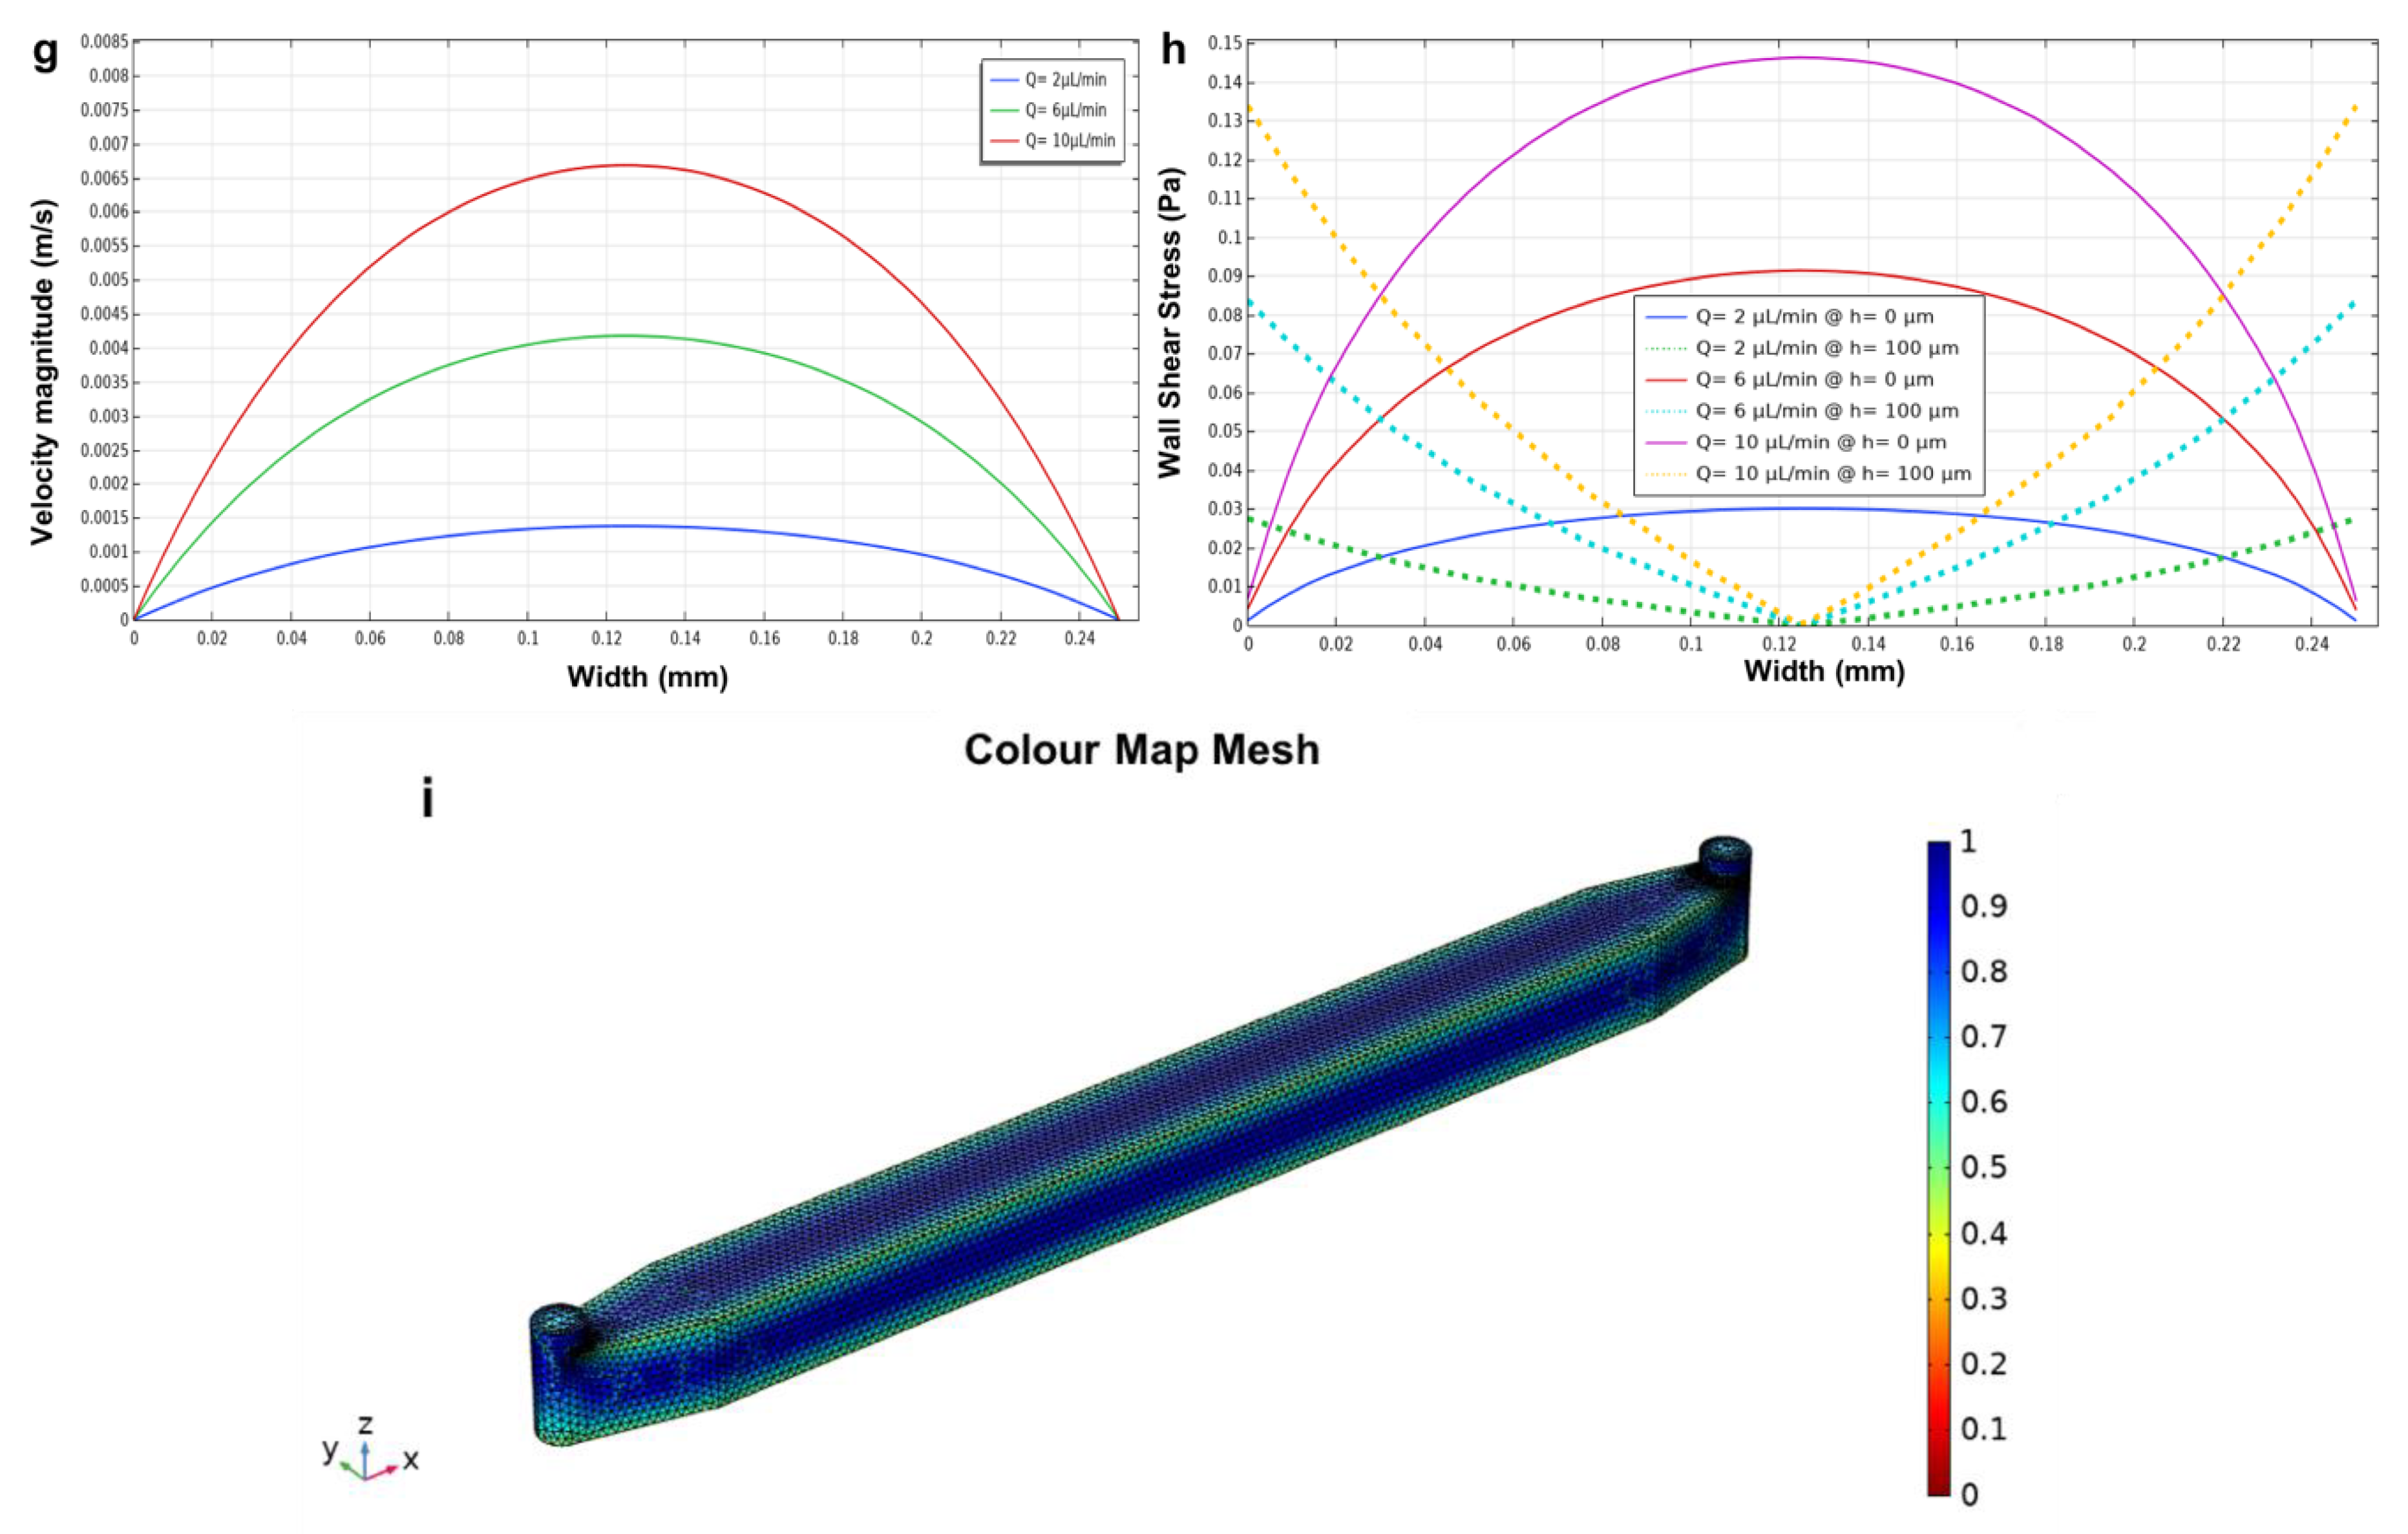
2.3. Velocity Profiles Characteristics

For a rectangular cross-section microchannel of width w and height h, the velocity profile can be determined by solving the Navier–Stokes Equation (2) using the Fourier series [40]:
v ( x , z ) = 48 Q π 3 · h · w · i = odd 1 i 3   [ 1 cos h ( i π x h ) cos h ( i π w 2 h ) sin ( i π z h ) ] 1 i = odd 1 i 5 · 192 π 5 · h w tan h ( i π w 2 h )
From Equation (4) [42,43], the velocity profile has a different distribution along the x- and z-directions. The velocity profile is parabolic, whereas, along the larger dimension, the velocity shows a plateau in the centre and then changes near the wall [44,45,46].
As shown by Yun et al. [46], as the ratio between the height (h) and the width (w) of the microchannel decreases, the velocity profile tends to flatten in the centre of the microchannel, showing a plateau region [47]. Secondly, it is important to highlight the role of wall shear stress, which is a mechanical stimulus generated by the friction of the fluid against both the channel walls and the apical cell membranes. The shear stress plays a key role in the human body as it can alter the behaviour and properties of cells, such as their morphology, detachment from the substrate, alignment, and gene expression [48]. The physiological values of shear stress in the human vascular system are in the range of 5 × 10⁻² to 12 Pa. Therefore, maintaining this parameter within this range is fundamental for the physiological functions of cells. In fact, when the shear stress values are below this range, the cells can undergo apoptosis; conversely, when its values are above the range, the cells can be washed away with the fluid flow [49,50,51].
Since small-geometric-length scales characterise microfluidic systems (water is used as fluid for the simulations), from the Navier–Stokes equation, it is possible to express the wall shear stress along a rectangular cross-section microchannel as [29,52]:
τ = 6 μ Q wh 2
where µ is the dynamic viscosity of the fluid (Pa · s), Q is the volumetric flow rate (m3/s), w is the channel width (m), and h is the channel height (m).

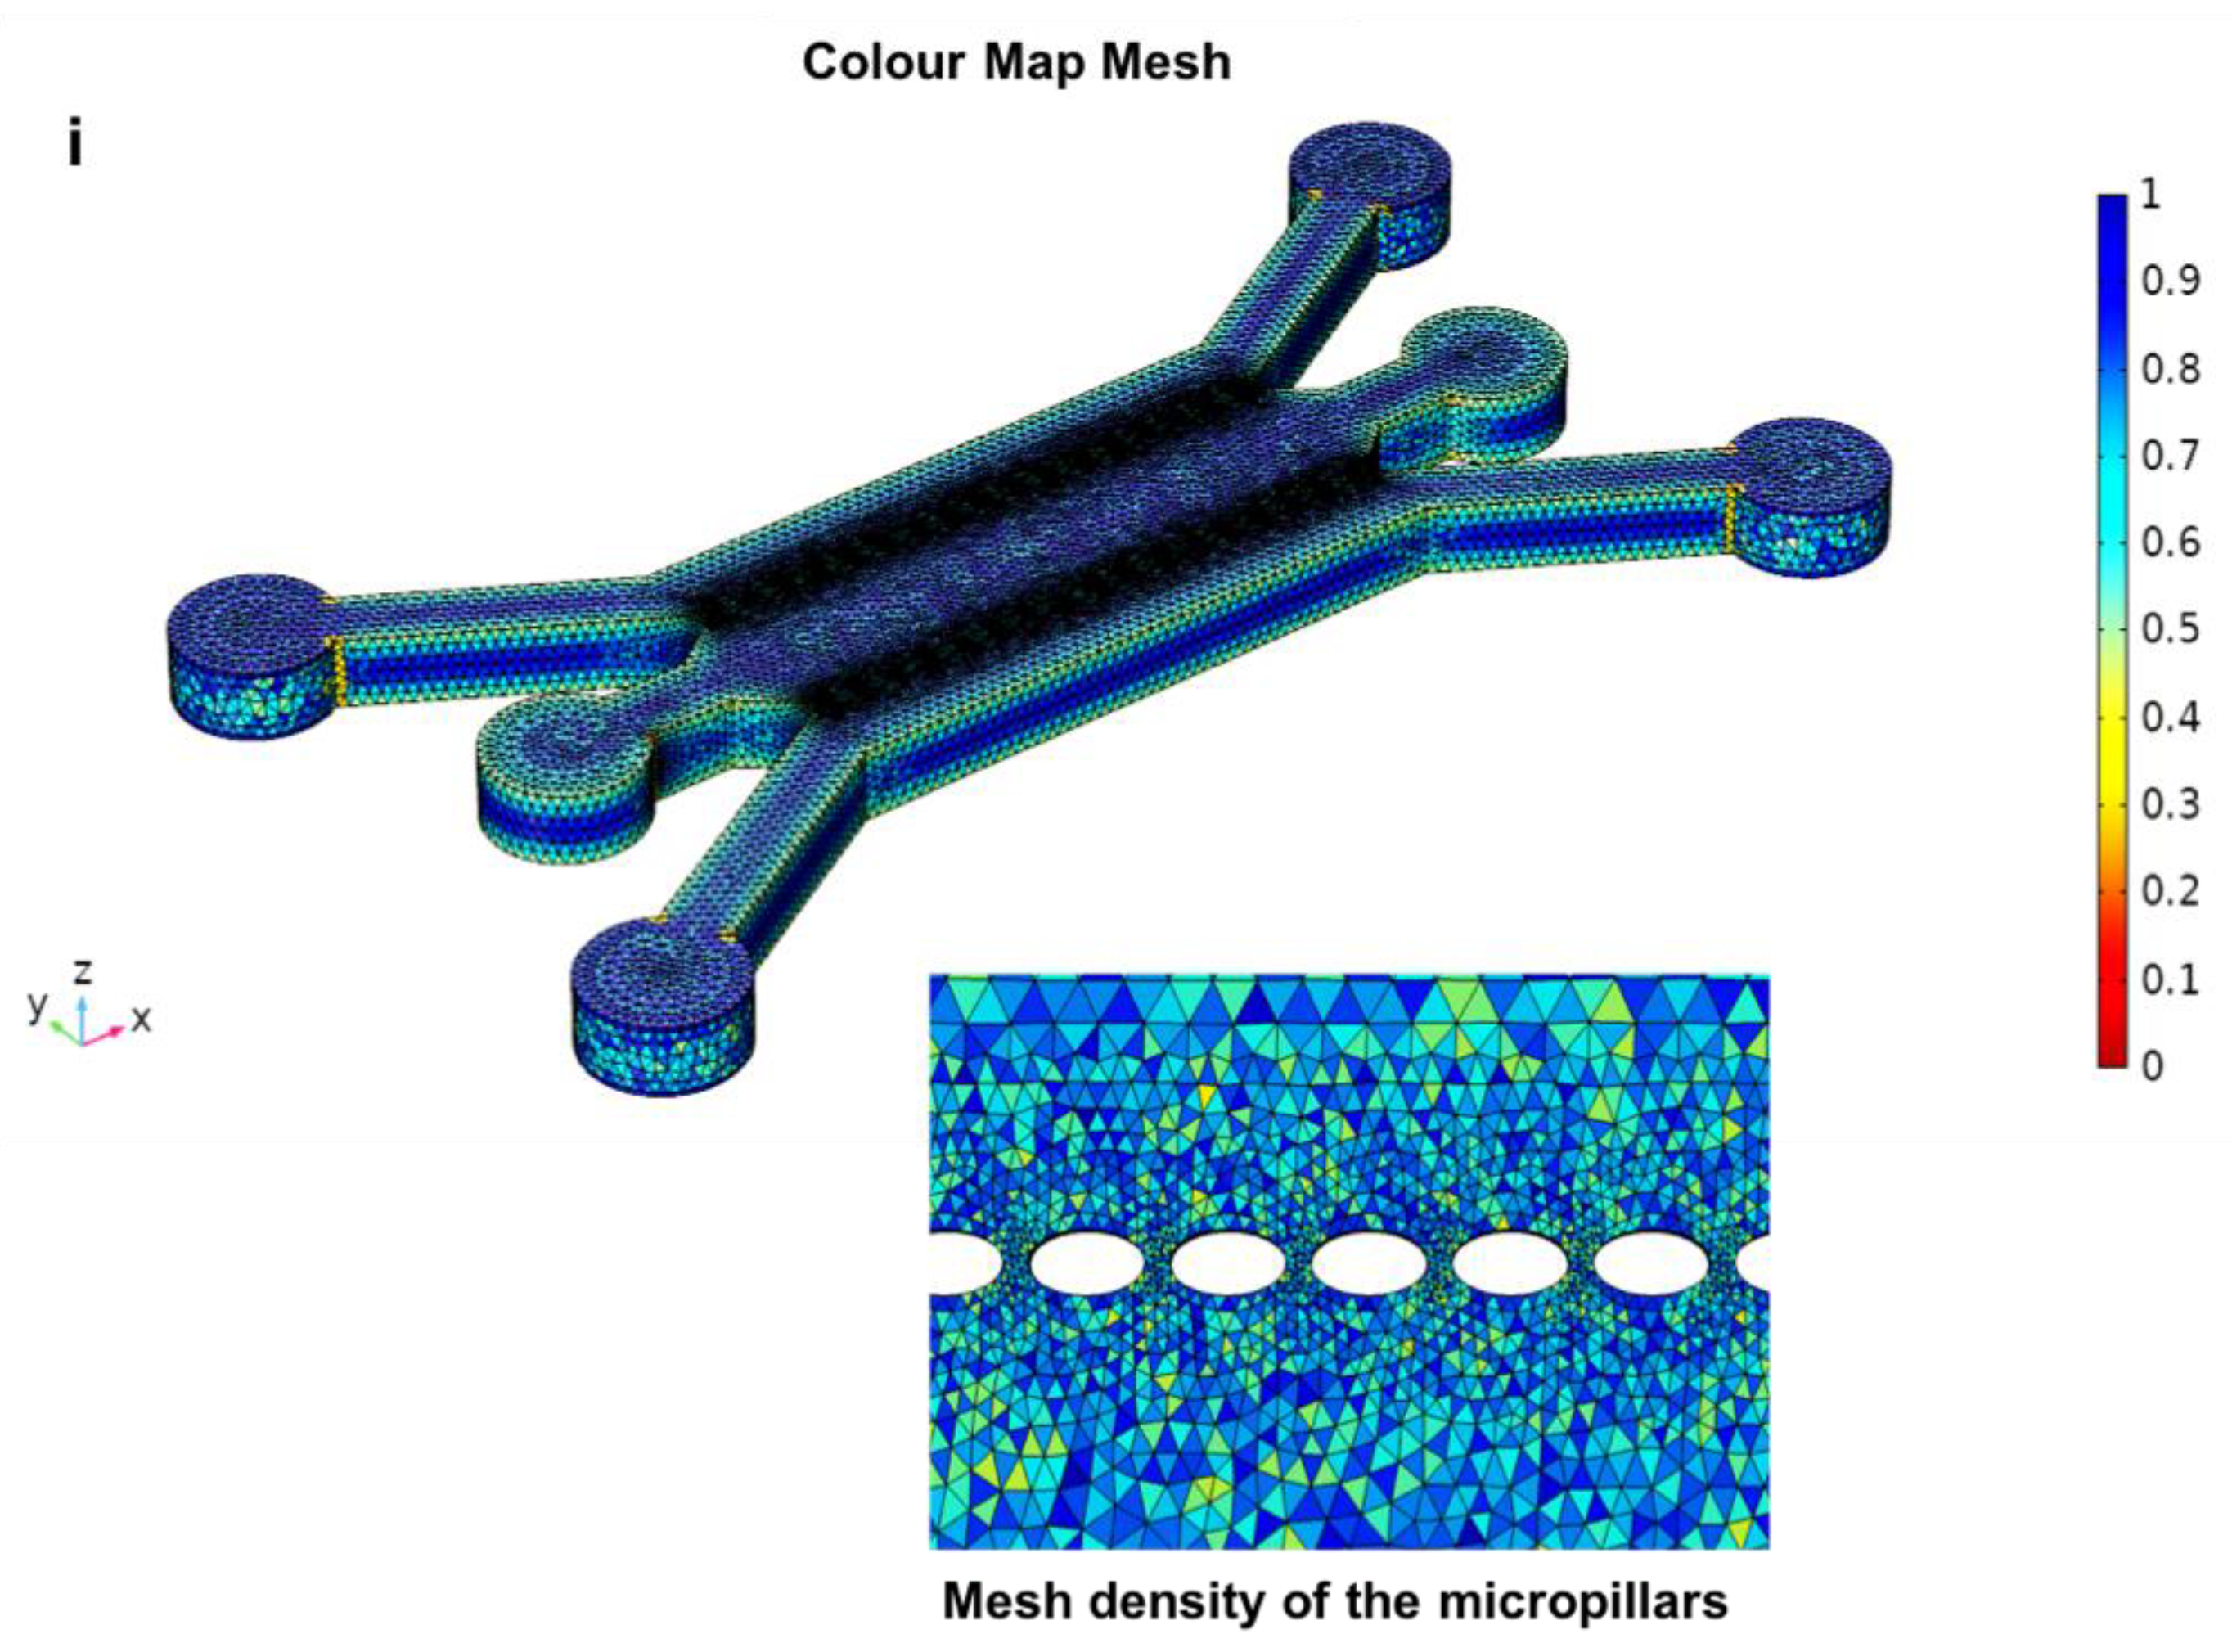
2.4. Computational Meshing for CFD Simulations

A computational mesh study was conducted on the four designed geometries using COMSOL Multiphysics. For this purpose, hybrid meshes with tetrahedral, pyramidal and prismatic element types were generated. For each designed geometry, colour mesh plots were created to understand where low-quality elements were positioned. A quality mesh of 1 indicates an optimal element quality, whereas 0 represents a degenerated element. In general, elements with a quality below 0.1 are considered poor quality. The same mesh generation process was implemented for each designed geometry.

2.5. Post-Processing

The simulation results were evaluated in the post-processing phase. This phase allows a visual display of the device to be obtained to evaluate the results. The visualisation is performed using plots or different types of graphical displays. The type of plots used were slice plots, streamline plots, and surface plots. Finally, for visualising the final data, a graph was used to highlight the maximum value assumed by the variables (e.g., wall shear stress, velocity, pressure) within the microfluidic channels.

3. Results and Discussions

3.1. Circular Microchamber

It was possible to analyse the distribution of the fluid within the microchannel using the streamline plot. It can be observed that the fluid spread throughout the cultivation chamber assumes a different velocity magnitude depending on the applied flow rate at the inlet of the device. The highest velocity value occurred in the centre of the chamber, whereas the velocity tended to decrease towards the walls of the device due to the non-slip boundary condition applied to the walls of the device (Figure 5a–c).
Before modelling, the wall shear stress values for flow rates of 2, 6, 10 µL/min were calculated using Equation (4) (5 × 10⁻³, 1.5 × 10⁻², 2.5 × 10⁻² Pa, respectively). The results obtained from the simulations show that the values of wall shear stress are very low in the circular microchamber (Figure 5d–f). Consequently, both the velocity and the wall shear stress profiles, which are related to the above three flow rates, were plotted versus the width of the circular chamber (1 mm) (Figure 5g,h).
As mentioned above, the ratio between the height and width of the microchannel determines the velocity and wall shear stress profiles within the microchannels. In this case, as the aspect ratio of the microchannel is greater than 1 (cultivation chamber = 1 mm >> h = 200 µm), the velocity profile within the microchamber indicates a parabolic shape, with a maximum velocity occurring in the centre of the chamber and a minimum velocity at the walls due to the non-slip condition. Figure 5h shows that when moving from the bottom (h = 0 μm, solid lines) to the centre or middle (h = 100 μm, dotted lines) of the microchamber, the wall shear stress increases at the wall and decreases in the middle (Equation (3)). Overall, this circular microchamber geometry showed low values of velocities and wall shear stress, thus making it suitable for cell culture studies which require low values of these parameters. Importantly, the low shear stress values negatively affect focal adhesion formation as well as cell proliferation and migration [48,53,54].
Moreover, the velocity profile assumes different values in various parts of the microchamber (Figure 5a–c), and this phenomenon can affect the uniformity of the cells’ arrangement in cell culture studies [22]. A similar geometry was studied to evaluate the fluid flow behaviour and the velocity profile distribution within the channel using a single value of velocity [53]. However, in this study, different flow rates were used in order to evaluate their effects on both shear stress and velocity profile distribution within the channel. Figure 5i demonstrating the mesh study of the circular microchamber shows a total of 248,087 elements, which is adequate to guarantee a grid-independent solution.

3.2. Longitudinal Microchannel

The distributions of both velocity and wall shear stress within a longitudinal microchannel were studied by other researchers, and they found that the length of the channel did not affect the velocity and the shear stress within the microchannels [22,26,55]. In this study, a longitudinal microchannel was designed to investigate the shear stress and the velocity profile distribution within the channel using three different flow rates alongside the width of the microchannels (Figure 2a). In the same way, through a streamline plot, it was possible to study the distribution of the fluid within the microchannel (Figure 6a–c).
Figure 6a–c shows that the fluid moves parallel to the walls within the microchannel, reaching the highest velocity magnitude in the centre of the channel and a minimum velocity at the walls due to the no-slip condition. The wall shear stress values were calculated for the flow rates using Equation (5) prior to simulation (0.02, 0.06, 0.1 Pa, respectively).
The results obtained from the simulations show a uniform distribution of the shear stress within the microchannel (Figure 6d–f). Furthermore, to analyse the distribution of fluid within the microchannel, the velocity and the wall shear stress profiles were plotted against the width of the channel. As the ratio between the height and width of the channel is close to 1 (h = 200 µm and w = 250 µm), the resulting velocity profile, which is evaluated along the rectangular cross-section microchannel width, has a parabolic shape. The wall shear stress profiles have been calculated at two different heights (h = 0 μm, representing the bottom of the microchannel and h = 100 μm at the middle of the microchannel) of the microdevice. As shown in Figure 6h, moving from the bottom (h = 0 μm, solid lines) of the microchannel to the middle (h = 100 μm, dotted lines), the wall shear stress has high values near the wall and low values in the middle (Equation (3)). Since no significant colour variation was observed within each microchannel when the flow rate increased, both velocity and wall shear stress remained uniform throughout the channel (Figure 6a–f). Figure 6i indicates the mesh study of the longitudinal microchannel and shows a total of 310,604 elements, which is adequate to guarantee a grid-independent solution. Additionally, cell culture studies by other scientists have demonstrated that constant velocity and shear stress profiles through the channel can promote cell adhesion [26] and cell alignment in a fluid direction within the reorganisation of their cytoskeleton [24], along with focal adhesion formation, which are fundamental properties to ensure cell survival [53]. Other researchers have also studied fluid flow behaviour in straight channels [24,56,57]. However, their studies have only used a single flow rate value. This study, instead, focused on evaluating the effects of different flow rates within the channel on shear stress and velocity.

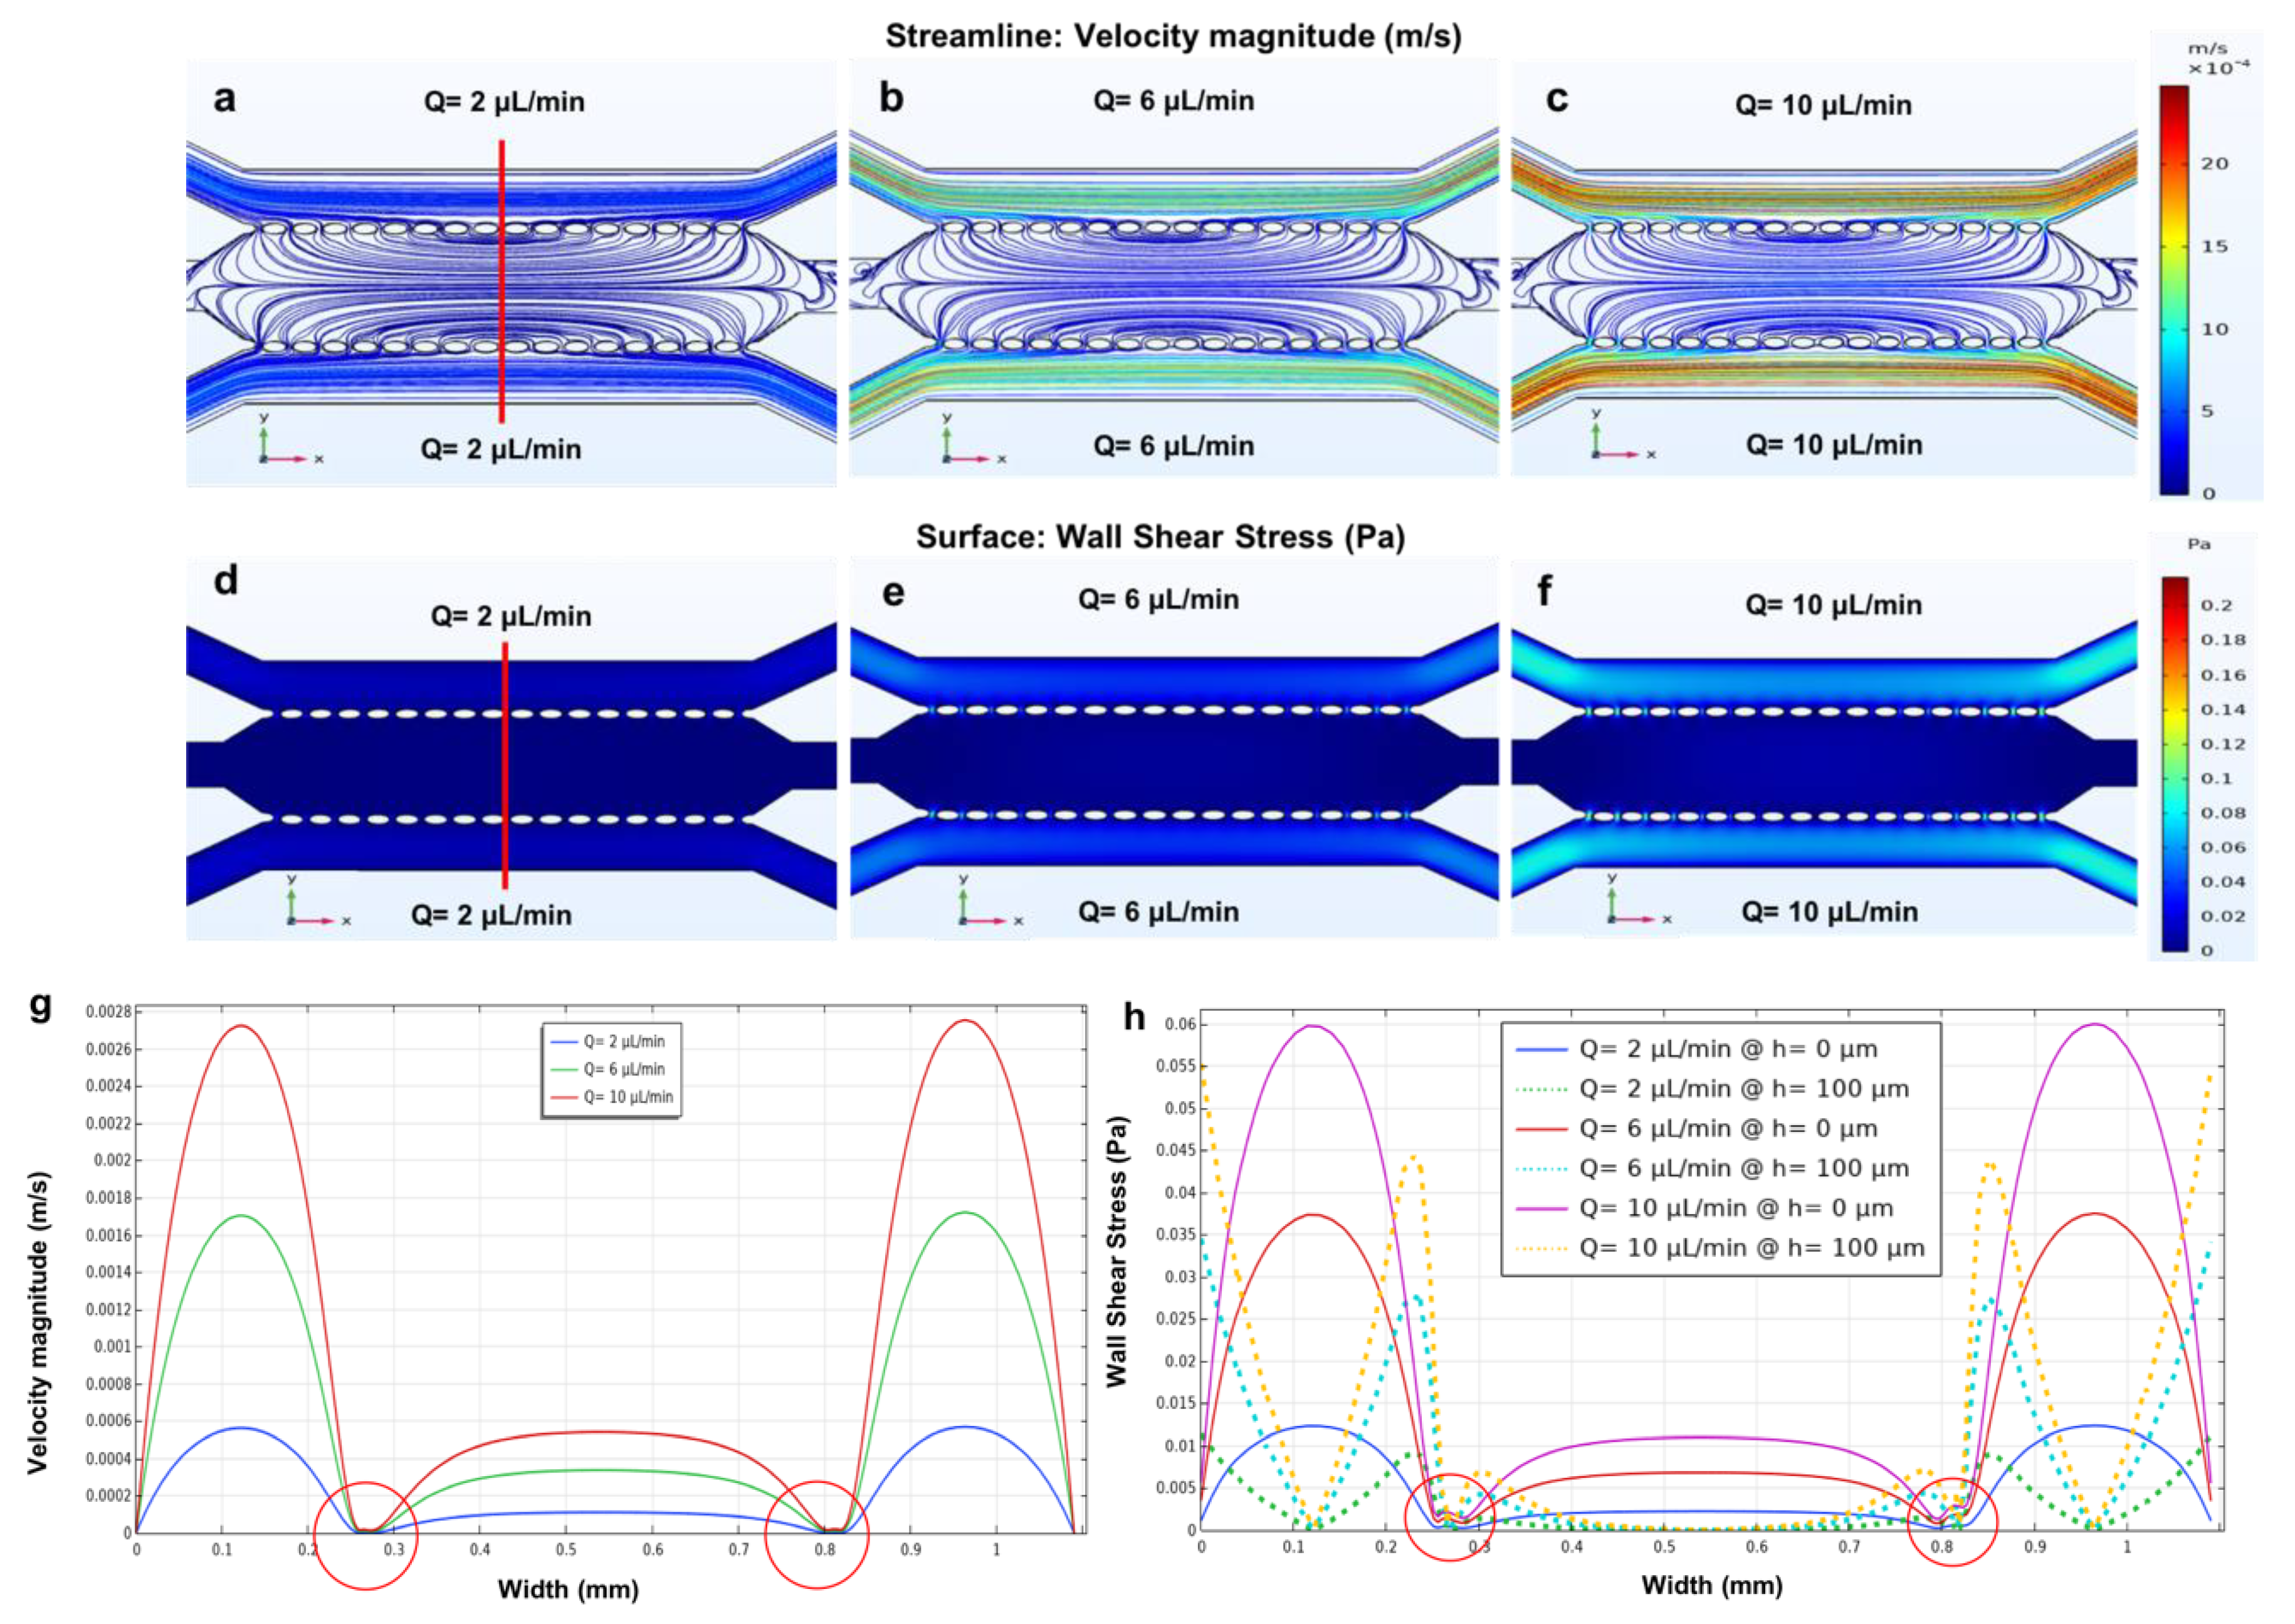
3.3. Three Parallel Microchannels

The microfluidic geometry consisting of parallel channels which were separated by rows of micropillars was analysed by different groups of researchers either to study the distribution of specific compound concentrations inside the channels at different time points [58], to increase the accuracy of in vitro drug screening [33] or to investigate the distributions of velocity and shear stress within the channels [22,30]. This particular microfluidic geometry attracted the interest of many scientists as it allows the cells and the culture medium to be introduced separately. The cells are cultured in the main or middle channel, while the culture medium is supplied through the side channels and gets diffused to the cells across the micropillar structures. However, in this study, the three parallel microchannels were designed to investigate the wall shear stress and velocity profile distribution through the inlets of the two side microchannels using different flow rates (Figure 3a). The fluid distribution within the microchannel was evaluated using a streamline plot (Figure 7a–c).
Figure 7a–c shows that in the side microchannels, the fluid moves parallel to the walls, while in the main microchannel, the fluid diffuses from the side microchannels to the middle microchannel through the micropillars. The wall shear stress for both the side and main microchannel using three different flow rates (2, 6 and 10 µL/min) was calculated using Equation (4). The calculated wall shear stress for the side microchannels (250 µm) using three different flow rates is 0.02, 0.06, and 0.1 Pa. The results obtained from the simulations show low values of shear stress in the main microchannel (no fluid flow) and higher values of shear stress in the side microchannels. Additionally, since the width of the side channels was smaller compared to the main microchannel, the velocity and wall shear stress values were greater within the side microchannels. However, as we increased the flow rates to 6 and 10 µL/min, the velocity and wall shear stress increased (Figure 7d–f). Maintaining the shear stress within the physiological range is critical, as excessively large values of shear forces can alter the cytoskeletal structure of cells as well as cell viability in a microfluidic cell culture.
Additionally, the velocity and wall shear stress profiles (bottom and middle of the microchannels) were simulated versus the width of all the microchannels (Figure 7g,h). As shown in the figure, the minimum velocity occurred not only near the walls due to the non-slip condition but also near the micropillars, which acted as a barrier between the side and main microchannels.
In fact, Figure 7g,h indicated that in the proximity of the micropillars (about 280 µm and 830 µm on the width axis), the velocity decreased near the walls. Furthermore, the velocity started to have higher values in the side microchannels than in the main microchannel. This phenomenon is due to the absence of flow rate in the main microchannel. Figure 7h shows the wall shear stress profiles at two different height positions of the device (h = 0 μm representing the bottom of the microchannels and h = 100 μm representing the middle of the microchannels). According to Equation (3), moving from the bottom (h = 0 μm, solid lines) to the middle (h = 100 μm, dotted lines) of the device, the wall shear stress increased near the wall and decreased in the middle. This can affect cell adhesion, cell migration, and alignment. Furthermore, the flow rate and microchannel size (width) can affect cell adhesion, cell migration, and alignment. Additionally, cell migration within microfluidic devices is influenced by microchannel width [23,41]. Figure 7i shows the generated mesh study of the three parallel microchannels and the micropillars, showing a total of 810,805 elements, which is adequate to guarantee a grid-independent solution.
It is important to highlight that the dimensions of the micropillars can also influence the width of the microchannels. According to Equation (4), the width of the channels is inversely proportional to the wall shear stress. Therefore, as the size of the micropillars increases, the width of the channels decreases and, consequently, the wall shear stress will increase.

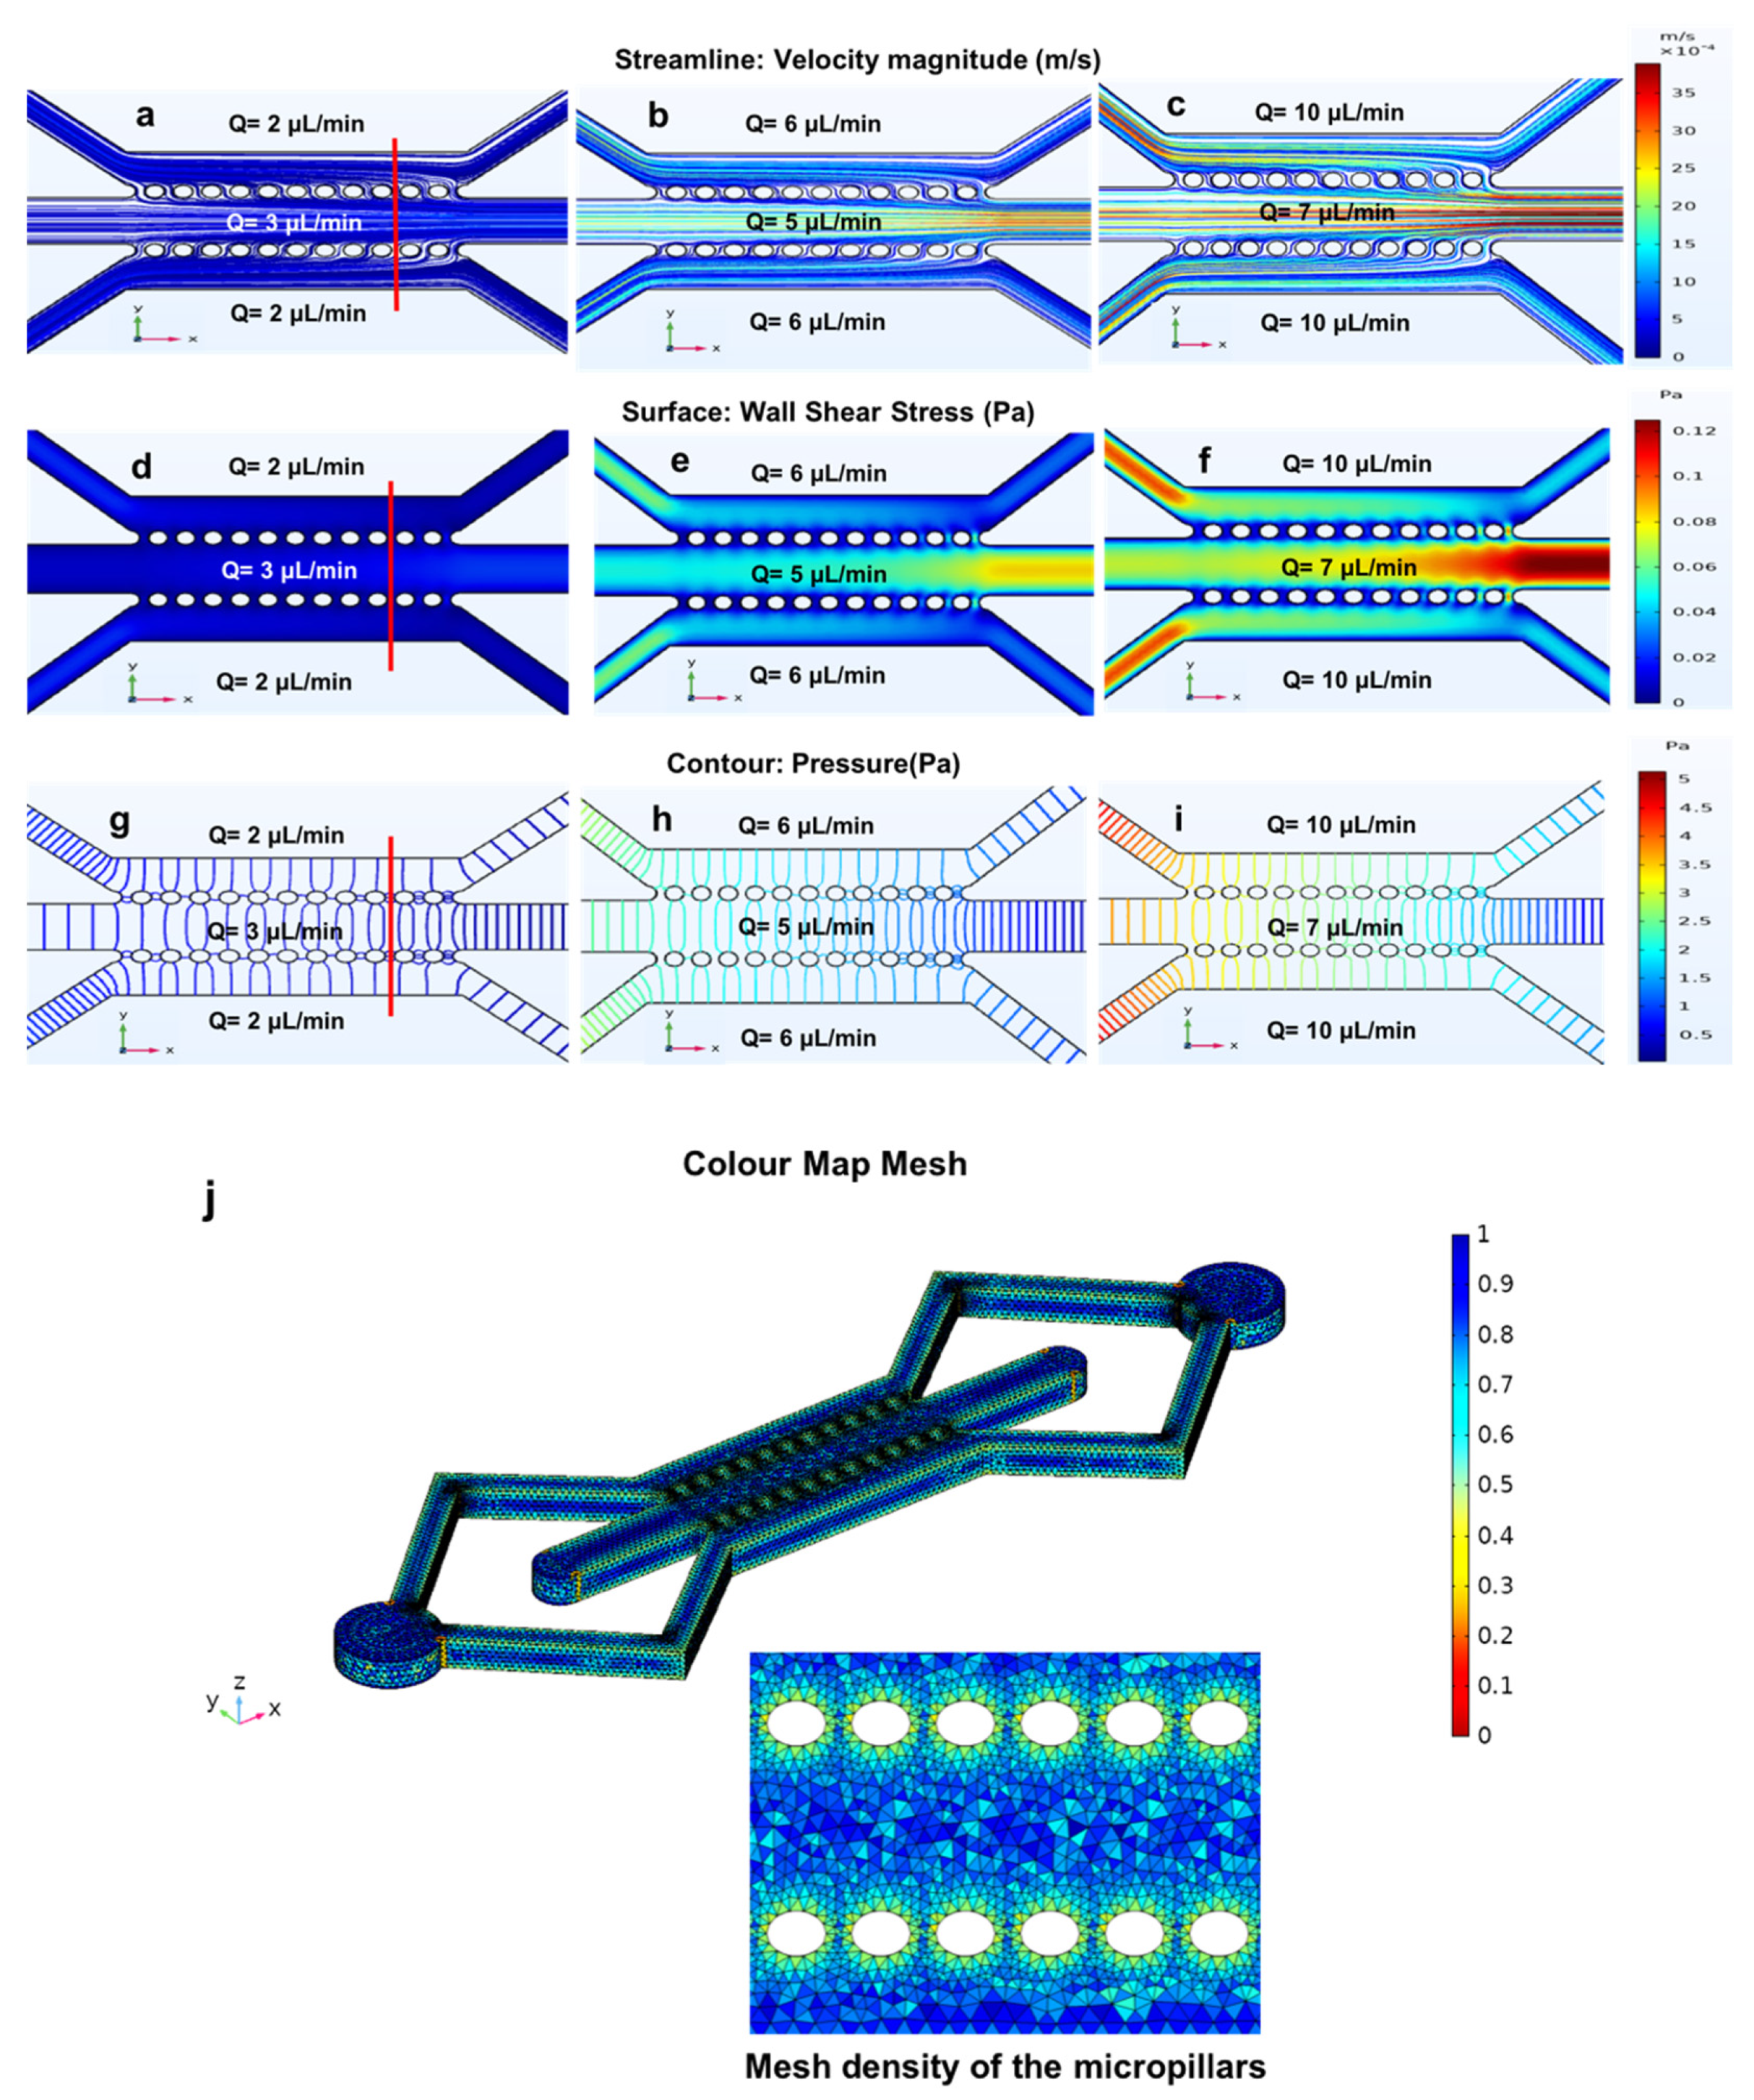
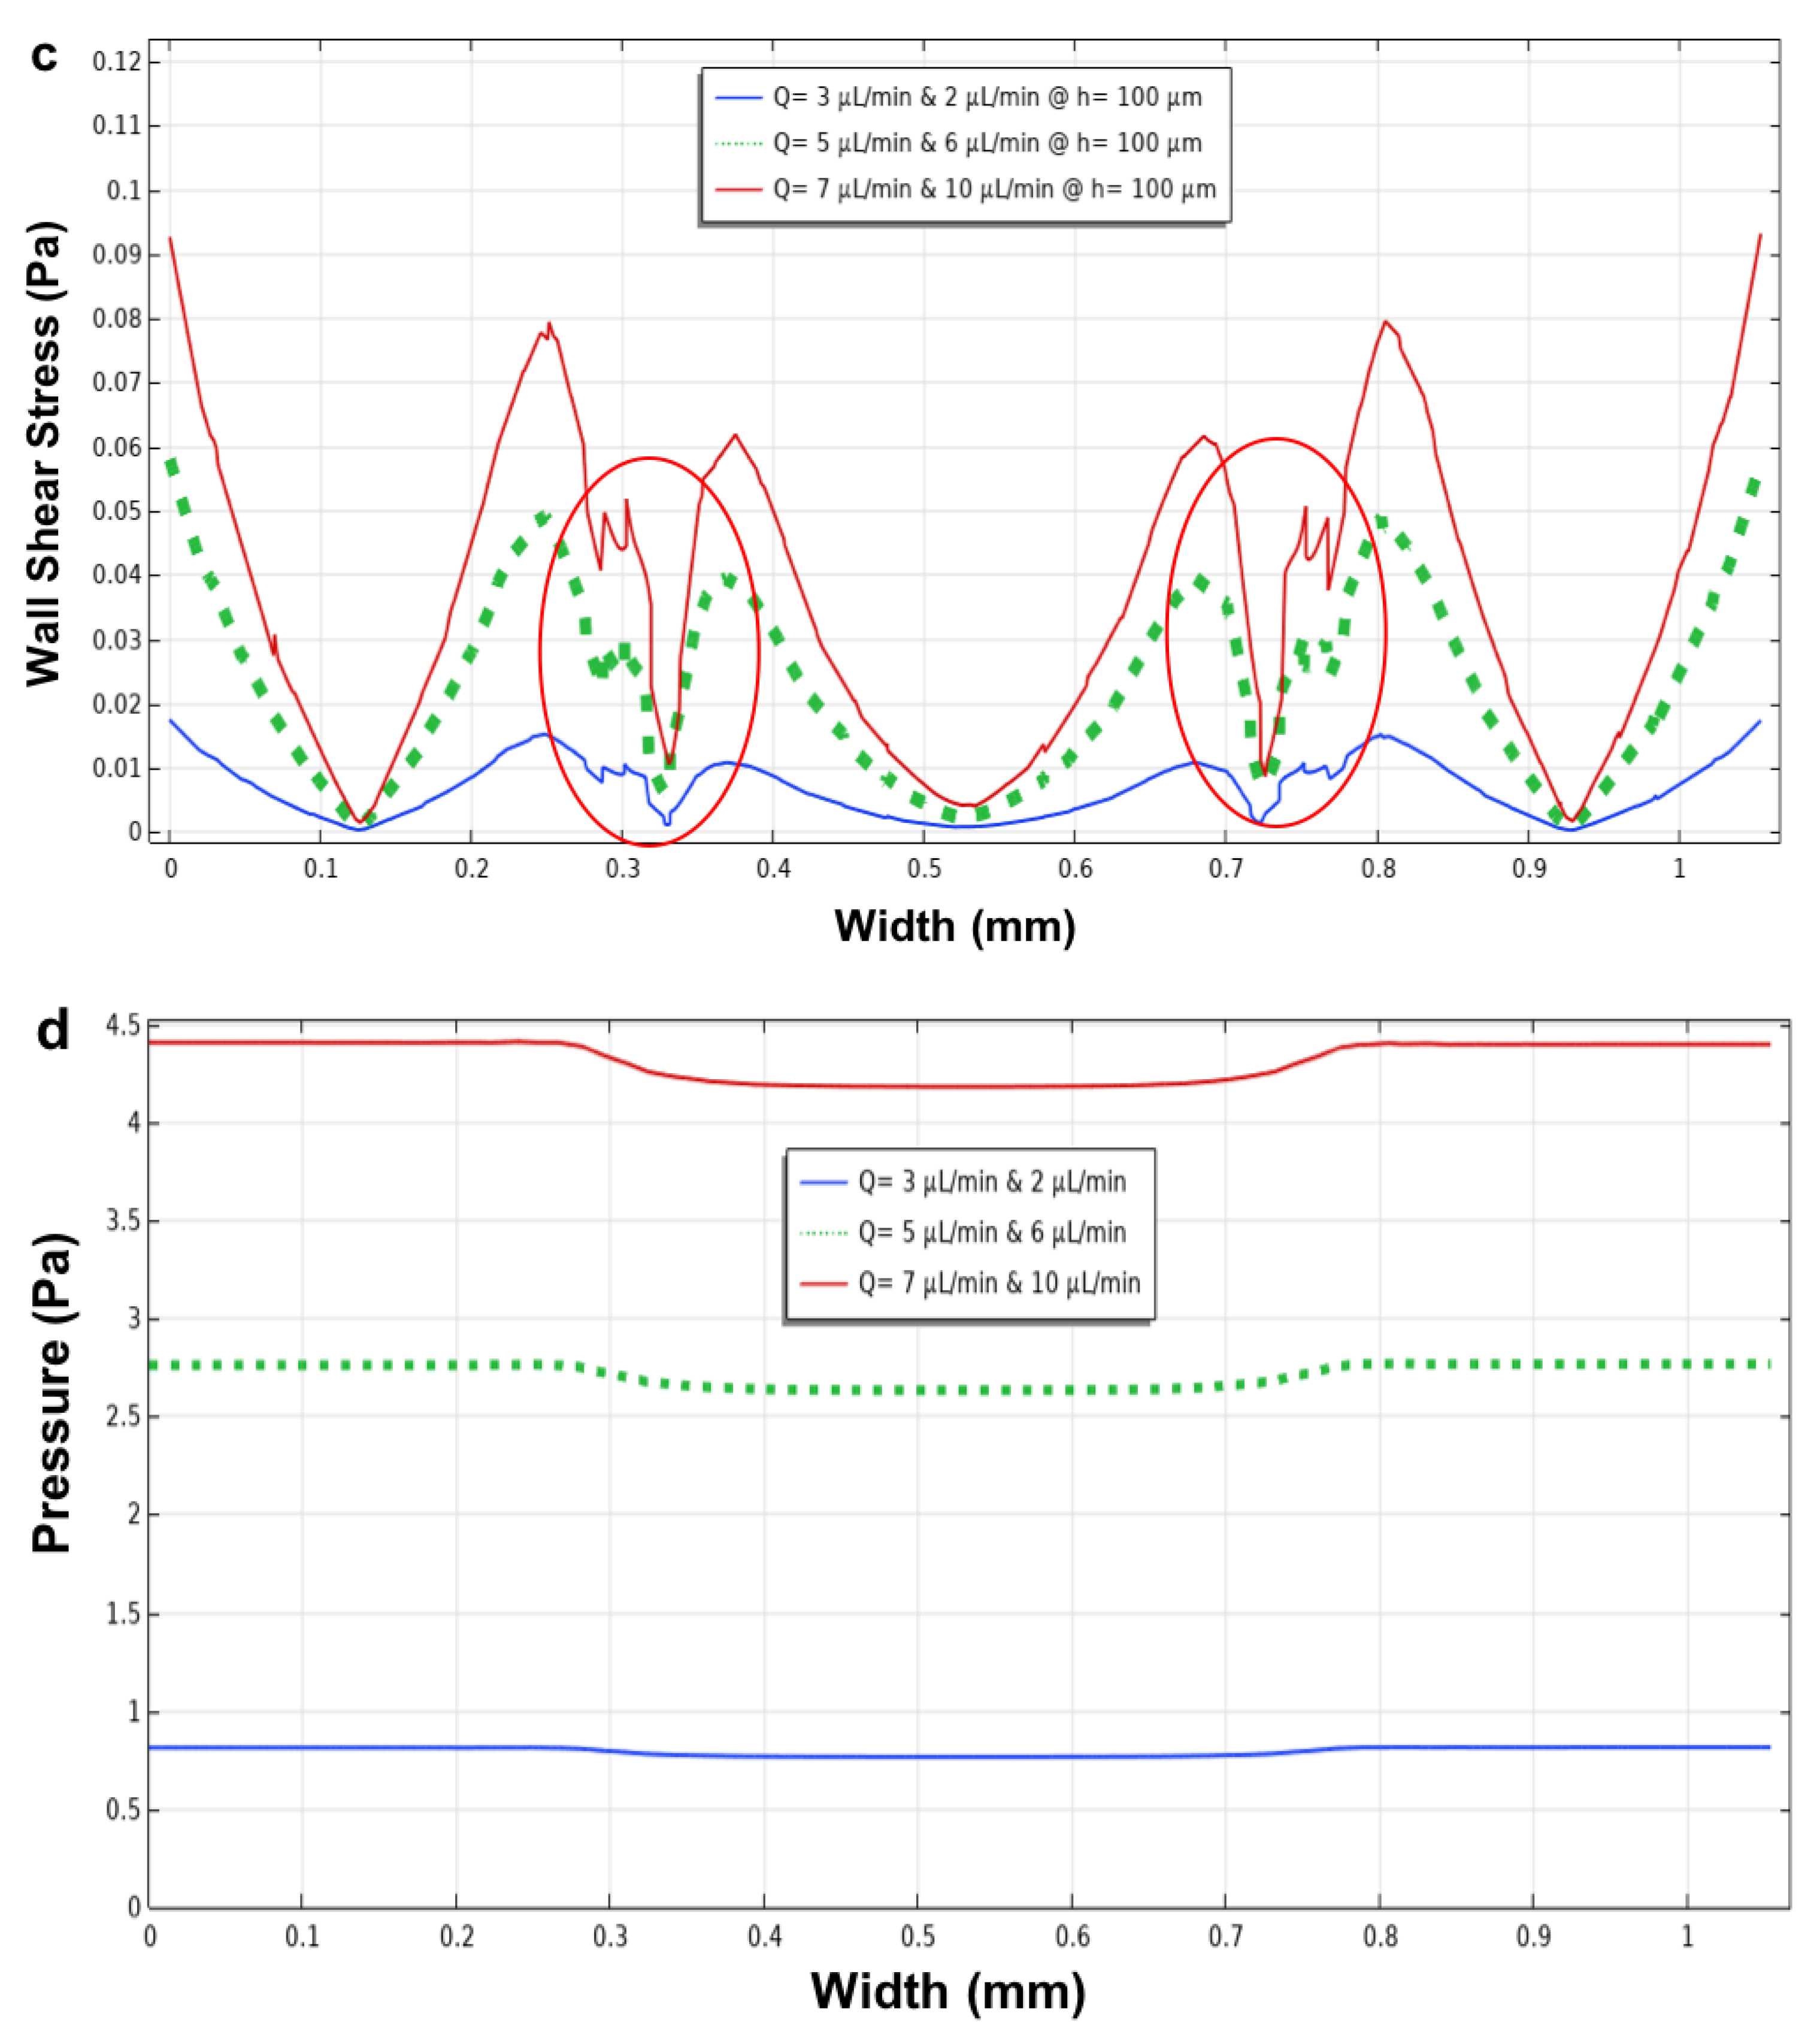
3.4. The Closed-Microchannel Structure

Scientists have performed several studies on fluid dynamics for devices consisting of parallel channels separated by arrays of micropillars [24,25,31]. They have tried to modify the dimensions of the micropillar structure and the inlets and outlets in order to analyse how these geometrical features affect the velocity, shear stress and pressure within the device. Tomecka et al. [25] performed a fluid dynamic analysis on a device consisting of three parallel channels separated by two rows of micropillars for performing 3D and 2D human cardiomyocyte cell culture, signifying that cardiomyocytes proliferated better in 3D than in 2D conditions. Additionally, Kim et al. [30] analysed the effect of gap spacing between the micropillars on wall shear stress. Their results demonstrated tunable shear stress gradients by changing the number of micropillar rows and their size. However, in this study, we designed a microfluidic device with three parallel channels that were separated by two rows of micropillars (Figure 4a) to assess the velocity, shear stress, and pressure within the microdevice using six different flow rates within the channels. This design is used to address the presence of a flow rate in the main microchannel, which can affect the shear stress and velocity profile, as well as how the different geometrical dimensions of the micropillars could affect the fluid dynamic parameters. Furthermore, this design can be utilised to analyse how different gaps between the pillars can affect shear stress and velocity. The wall shear stress was calculated prior to the simulation using Equation (4). The calculated wall shear stress for the side microchannels using flow rates of 2, 6 and 10 µL/min is 0.02, 0.06, and 0.1 Pa, respectively, and the calculated wall shear stress for the main microchannels using 3, 5 and 7 µL/min is 0.007, 0.04, and 0.05 Pa, respectively. The simulation results are shown below (Figure 8a–c).
Figure 8a shows the low-velocity profile at the same flow rate (2 µL/min) used for the side channels and the flow rate of 3 µL/min used for the main microchannel. However, increasing the flow rates at the side and main microchannels produced a higher velocity in the main microchannel, which can cause flow through the micropillars to the main channel (Figure 8b). The same results were obtained for Figure 8c, which shows a higher velocity profile in the main microchannel as we increased the flow rate in the side microchannels.
Figure 8a–c shows the movement of fluid from the side microchannels towards the main microchannel when flow rates are applied to both the side and main microchannels. This can lead to an increase in the value of wall shear stress within the main microchannel. The wall shear stress was increased by increasing the flow rates at the main microchannel, showing higher wall shear stress in Figure 8e,f using the flow rates of 5 and 7, respectively. For this geometry, the pressure distribution inside a rectangular cross-section microfluidic device is also calculated using Equation (6) [40]:
Δ P = 12 μ LQ wh 3
As shown in Figure 8g–i, when the flow rate increases, the pressure within the channels increases and, according to Equation (6), the two values (pressure and flow rates) are directly proportional. Figure 8j depicts the generated mesh study of the closed microchannel structure and the micropillars showing a total of 283,958 elements, which is adequate to guarantee a grid-independent solution. Moreover, the results of the velocity profile, wall shear stress and pressure for all the six flow rates within the side and main microchannels were plotted for evaluation versus the width of the channels (Figure 9).
As mentioned above, for the three parallel microchannel geometry and for this configuration, it is possible to observe how, in the proximity of the micropillars, the velocity and the shear stress decrease. Furthermore, the presence of flow rate in the main microchannel has led to an increase in the values of both the parameters, velocity and shear stress.
In this geometry (Figure 9), the micropillars have larger dimensions and gap space (with a length of 120 μm, a width of 100 μm, and a distance of 50 μm) than those designed previously in three parallel channels (length 100 μm, width 50 μm, and distance 20 μm). This difference led to the formation of fluctuations in the proximity of micropillars, generating a less homogeneous shear stress profile near the micropillars (Figure 9a–c—red circles), which was compared to the one that was obtained in the previous simulation for the parallel channels’ microfluidic device (Figure 7g,h—red circles). Therefore, this simulation indicated that both the size and gap space between the micropillars are the two parameters that can be manipulated to control the shear stress within the device.
Furthermore, the viscosity of cell suspensions will not influence the flow parameters as the viscosity of the medium is very similar to the water viscosity. According to the Navier–Stokes Equation (2), an increasing cell concentration on the floor of the channel should not change the flow profile [40]. Frequently, in CFD simulation studies of in vitro culture systems, the culture medium is considered a Newtonian fluid for rheological and computational modelling purposes, as the widely used commercial culture media (DMEM and RPMI) supplemented with typical concentrations of FBS exhibit Newtonian behavior [59]. Moreover, it was shown that the viscosity of the culture medium is similar to the Newtonian behaviour of water. However, changes in the culture medium are affected by various experimental conditions such as seeding densities, substrate, the geometry of the device, the media formulation itself, and flow conditions [59].
A similar result was obtained by Kim et al. [30], who studied the effect of gap spacing between the micropillars on wall shear stress within a five parallel channel device separated by rows of micropillars. However, their study aimed to design a microfluidic device with a micropillar gap spacing below 30 μm that was capable of generating homogeneous shear stress gradients, whereas, by using greater gap distances, the pillars led to oscillations of the shear stress profile. However, in this study, we designed a microfluidic device that is capable of producing homogeneous shear stress within the centre of the main channel even with a greater gap spacing micropillar (50 µm). Additionally, the pressure was also evaluated in this study as another parameter to simulate within the side and main microchannels. As shown in Figure 9d, the pressure in the main microchannel is lower than in the side microchannels for two reasons: first, the width of the main microchannel (350 μm) is bigger than the side microchannels (250 μm), and second, the flow rates in the main microchannel are lower than in the side microchannels for the second and third simulation experiments (Figure 8). In fact, based on Equation (6), the width and pressure are inversely proportional, while the pressure and flow rate are directly proportional. Therefore, as the side microchannels have a smaller width and a higher flow rate than the main microchannel, the resulting pressure in the side microchannels will be higher. Moreover, in vivo and in vitro studies have shown that haemodynamic forces (i.e., shear stress, velocity, flow rate, pressure) can significantly influence the gene expression and phenotype of vascular cells that induce functional changes in response to mechanical stress [60]. In addition, when the cells are exposed to microenvironmental signals such as cell-cell interactions, cell-extracellular matrix, and physical forces, this can result in the activation of cell behaviour. For instance, this type of geometry allows the injection of extracellular matrix into the main microchannel so that the cells located in the side microchannels can interact with it. In specially designed microdevices, the essential signals in cellular microenvironments can be controlled precisely compared to macroscale devices, and this can allow more accurate modelling of physical situations for both drug development and fundamental research [61].

3.5. Effect of Microchannel Height within a Microfluidic Device

The height of a microfluidic device is another parameter that has been studied to evaluate how this geometric feature can influence the fluid dynamic parameters such as velocity and wall shear stress within a microenvironment. For this study, we compared the velocity and wall shear stress results obtained for the circular, longitudinal, and three parallel channel geometries with a height of 200 µm to those obtained within the same devices but with a height of 60 µm. This particular height (60 µm) was chosen based on the literature where similar geometries were analysed [22,26,55].
The circular microchamber device (Figure 10a,b) demonstrated that as the height decreases, both the velocity and wall shear stress profiles tend to show a plateau region. As mentioned above, this is due to the ratio between the width of the cultivation chamber (diameter = 1 mm) and the height (60 μm), which tends to decrease the ratio between these two parameters (width and height), leading to a plateau region in the velocity and wall shear stress profiles. Figure 10b shows the different values of wall shear stress moving from the bottom (h = 0 μm, solid lines) to the middle (h = 30 μm, dotted lines) of the microchamber.
Furthermore, similar results were found for the longitudinal microchannel device (Figure 10c,d), where the ratio between the width (250 μm) and the height (60 μm) decreased, demonstrating a plateau region for the velocity and wall shear stress profiles (bottom and middle) within the microchannel. Figure 10d shows the values of wall shear stress at the bottom (h = 0 μm, solid lines) and in the middle (h = 30 μm, dotted lines) of the microchannel. Furthermore, the results of the velocity magnitude and wall shear stress of the designed three parallel microchannels (Figure 10e,f) showed that decreasing the height (60 μm) of the microchannels resulted in the formation of a plateau region for both the velocity and wall shear stress profiles within the side microchannels. The different values of wall shear stress moving from the bottom (h = 0 μm, solid lines) to the middle (h = 30 μm, dotted lines) of the microdevice are shown in Figure 10f.
Figure 11 shows the aspect ratio between the height (h) and width (w). The figure demonstrates that by increasing the aspect ratio between the h and w of the channel, the parabolic profile changes, becoming more horizontal [46]. Additionally, based on Equation (5) when the height of the microchannels reduced, the shear stress as well as the velocity profile was increased, indicating that they are directly proportional [22,26].

4. Conclusions

This study demonstrated different designed and simulated microfluidic channel geometries and the influence of fluid dynamic parameters within their microenvironment. It has emerged that various designed geometrical parameters coupled with fluid dynamic parameters have a significant impact on the wall shear stress and velocity magnitude. Subsequent numerical simulations identified the width and height as geometrical parameters capable of controlling both the velocity profile and the wall shear stress within the microfluidic channels. The simulation of microchannels indicated that as the width of the microchannels decreases, the velocity and wall shear stress values tend to increase, whilst as the height of the microchannels decreases, the velocity and wall shear stress values increase, demonstrating that the width and height of microchannels contribute to the control of shear stress. Moreover, utilising six different flow rates, we showed another way to control the wall shear stress within the microchannels. Furthermore, the pressure was shown to be inversely proportional to the width and directly proportional to the flow rate within the microfluidic channels. The simulations also showed that the velocity and wall shear stress assumed different values at different flow rates. Shear stress, flow rate, and pressure parameters play an important role in controlling or predicting the cellular microenvironment. This method can be applied to optimise the microchannel geometries and to keep these parameters within physiological values, which can enhance nutrition and oxygen delivery, thus increasing cell morphology, proliferation, function and the long-term survival of many cell types. In particular, the magnitude of shear stress regulates cell morphology, phenotype transformation, and gene expression. Likewise, pressure plays an important role in cell functions and can cause damage to cells, resulting in apoptosis. The physiological values of shear stress in the human vascular system are in the range of 0.05 to 12 Pa, so when the shear stress values are below this range, the cells can undergo apoptosis, and if these values are above this range, the cells can be washed away by the fluid flow. In future work, fabrication of the above-designed microfluidic devices with an in vitro 3D cell culture applying the simulated fluid dynamic and geometrical parameters to be compared with this study could provide a quantitative measure of the efficiency of the analysed geometries. This will reveal a suitable strategy to predict or control the effects of these forces within the different designs of microfluidic channels and the potential as an alternative to conventional cell culture, which could transform many areas of basic research and drug development.

Author Contributions

Conceptualisation, M.R.; Methodology, F.P. and M.R.; Software, F.P.; Formal analysis, F.P. and M.R.; Writing—original draft, F.P. and M.R.; Reviewing and editing, F.P., W.B., M.R.; Supervision, M.R. All authors have read and agreed to the published version of the manuscript.

Funding

No funding was received for conducting this study.

Acknowledgments

The authors would like to thank Brunel University Library for the technical help with SolidWorks and COMSOL Software.

Conflicts of Interest

The authors declare no conflict of interest.

Abbreviations

CFDComputational fluid dynamics
ECMExtracellular matrix
MFDsMicrofluidic devices
OOCOrgan-on-a-chip
PDMSPolydimethylsiloxane
2DTwo-dimensional
3DThree-dimensional

References

  1. Kaptoge, S.; Pennells, L.; De Bacquer, D.; Cooney, M.T.; Kavousi, M.; Stevens, G.; Riley, L.M.; Savin, S.; Khan, T.; Altay, S.; et al. World Health Organization cardiovascular disease risk charts: Revised models to estimate risk in 21 global regions. Lancet Glob. Health 2019, 7, e1332–e1345. [Google Scholar] [CrossRef] [Green Version]
  2. Wouters, O.J.; McKee, M.; Luyten, J. Estimated research and development investment needed to bring a new medicine to market. JAMA 2020, 323, 844–853. [Google Scholar] [CrossRef]
  3. O’Neill, H.S.; Gallagher, L.B.; O’Sullivan, J.; Whyte, W.; Curley, C.; Dolan, E.; Hameed, A.; O’Dwyer, J.; Payne, C.; O’Reilly, D.; et al. Biomaterial-enhanced cell, and drug delivery: Lessons learned in the cardiac field and future perspectives. Adv. Mater. 2016, 28, 5648–5661. [Google Scholar] [CrossRef] [PubMed] [Green Version]
  4. Müller, P.; Lemcke, H.; David, R. Stem cell therapy in heart diseases- cell types, mechanisms, and improvement strategies. Cell. Physiol. Biochem. 2018, 48, 2607–2655. [Google Scholar] [CrossRef] [PubMed]
  5. Patel, H.; Bonde, M.; Sarinivasan, G. Biodegradable polymer scaffold for tissue engineering. Trends Biomater. Artif. Organs 2011, 25, 20–29. [Google Scholar]
  6. Curtis, M.W.; Russell, B. Cardiac tissue engineering. J. Cardiovasc. Nurs. 2009, 24, 87–92. [Google Scholar] [CrossRef] [Green Version]
  7. Marc, N.H.; Hansen, A.; Eschenhagen, T. Cardiac tissue engineering. Circ. Res. 2014, 114, 354–367. [Google Scholar] [CrossRef] [Green Version]
  8. Ott, H.C.; Matthiesen, T.S.; Goh, S.K.; Black, L.D.; Kren, S.M.; Netoff, T.I.; Taylor, D.A. Perfusion-decellularized matrix: Using nature’s platform to engineer a bioartificial heart. Nat. Med. 2008, 14, 213–221. [Google Scholar] [CrossRef]
  9. Yacoub, M.H.; Takkenberg, J.J.M. Will heart valve tissue engineering change the world? Nat. Clin. Pract. Cardiovasc. Med. 2005, 2, 60–61. [Google Scholar] [CrossRef]
  10. Ciofania, G.; Migliore, A.; Raffa, V.; Menciass, A.; Dario, P. Bicompartmental device for dynamic cell coculture: Design, realization and preliminary results. J. Biosci. Bioeng. 2008, 10, 536–544. [Google Scholar] [CrossRef]
  11. Pasirayi, G.; Auger, V.; Scott, S.M.; Rahman, P.K.S.M.; Islam, M.; O’Hare, L.; Ali, Z. Microfluidic bioreactors for cell culturing: A review. Micro Nanosyst. 2011, 3, 137–160. [Google Scholar] [CrossRef] [Green Version]
  12. Convery, N.; Gadegaard, N. 30 years of microfluidics. Micro Nano Eng. 2019, 2, 76–91. [Google Scholar] [CrossRef]
  13. Wasson, E.M.; Dubbin, K.; Moya, M.L. Go with the flow: Modeling unique biological flows in engineered in vitro platforms. Lab Chip 2021, 21, 2095–2120. [Google Scholar] [CrossRef]
  14. Bhatia, S.; Ingber, D. Microfluidic organs-on-chip. Nat. Biotechnol. 2014, 32, 760–772. [Google Scholar] [CrossRef]
  15. Kim, H.J.; Ingber, D.E. Gut-on-a-chip microenvironment induces human intestinal cells to undergo villus differentiation. Integr. Biol. 2013, 5, 1130–1140. [Google Scholar] [CrossRef] [PubMed] [Green Version]
  16. Kimura, H.; Sakai, Y.; Fujii, T. Organ/body-on-a-chip based on microfluidic technology for drug discovery. Drug Metab. Pharmacokinet. 2018, 33, 43–48. [Google Scholar] [CrossRef] [PubMed]
  17. Takayama, S.; Ostuni, E.; LeDuc, P.; Naruse, K.; Ingber, D.E.; Whitesides, G.M. Laminar flows: Subcellular positioning of small molecules. Nature 2001, 411, 1016. [Google Scholar] [CrossRef] [Green Version]
  18. Xi, C.; Yu, S.Z.; Xinping, Z.; Changsheng, L. Organ-on-a-chip platforms for accelerating the evaluation of nanomedicine. Bioact. Mater. 2021, 6, 1012–1027. [Google Scholar] [CrossRef]
  19. Carvalho, V.; Rodrigues, R.O.; Lima, R.A.; Teixeira, S. Computational Simulations in Advanced Microfluidic Devices: A Review. Micromachines 2021, 12, 1149. [Google Scholar] [CrossRef]
  20. Sidorov, V.Y.; Samson, P.C.; Sidorova, T.N.; Davidson, J.M.; Lim, C.C.; Wikswo, J.P. I-Wire Heart-on-a-Chip I: Three-dimensional cardiac tissue constructs for physiology and pharmacology. Acta Biomater. 2017, 15, 68–78. [Google Scholar] [CrossRef] [Green Version]
  21. Ingber, D.E. Developmentally inspired human organs on chips. Development 2018, 145, dev156125. [Google Scholar] [CrossRef] [PubMed] [Green Version]
  22. Kobuszewska, A.; Tomecka, E.; Zukowski, K.; Jastrzebska, E.; Chudy, M.; Dybko, A.; Renaud, P.; Brzozka, Z. Heart-on-a-Chip: An investigation of the influence of static and perfusion conditions on cardiac (H9C2) cell proliferation, morphology, and alignment. SLAS Technol. 2017, 22, 536–546. [Google Scholar] [CrossRef] [PubMed] [Green Version]
  23. Atmaramani, R.; Black, B.J.; Lam, K.H.; Sheth, V.M.; Pancrazio, J.J.; Schmidtke, D.W.; Alsmadi, N.Z. The effect of microfluidic geometry on myoblast migration. Micromachines 2019, 10, 143. [Google Scholar] [CrossRef] [PubMed] [Green Version]
  24. Hedieh, F.; Jun, Z.; Jordan, N.; Hoang-Phuong, P.; Nam-Trung, N. Stretchable Inertial Microfluidic Device for Tunable Particle Separation. Anal. Chem. 2020, 92, 12473–12480. [Google Scholar] [CrossRef]
  25. Tomecka, E.; Zukowski, K.; Jastrzebska, E.; Chudy, M.; Brzozka, Z. Microsystem with micropillar array for three-(gel-embedded) and two-dimensional cardiac cell culture. Sens. Actuators B Chem. 2018, 254, 973–983. [Google Scholar] [CrossRef]
  26. Green, J.V.; Kniazeva, T.; Abedi, M.; Sokhey, D.S.; Taslimb, M.E.; Murthy, S.K. Effect of channel geometry on cell adhesion in microfluidic devices. Lab Chip 2008, 9, 677–685. [Google Scholar] [CrossRef]
  27. Zohreh, S.; Pooria, A.; Navid, K. Advances in numerical approaches for microfluidic cell analysis platforms. J. Sci. Adv. Mater. Devices 2020, 5, 295–307. [Google Scholar] [CrossRef]
  28. Letourneau, A.; Kegel, J.; Al-Ramahi, J.; Yachinich, E.; Krause, H.B.; Stewart, C.J.; McClean, M.N. A Microfluidic Device for Imaging Samples from Microbial Suspension Cultures. MethodsX 2020, 7, 100891. [Google Scholar] [CrossRef]
  29. Wang, X.; Lee, J.; Ali, M.; Kim, J.; Lacerda, C.M.R. Phenotype transformation of aortic valve interstitial cells due to applied shear stresses within a microfluidic chip. Ann. Biomed. Eng. 2017, 45, 2269–2280. [Google Scholar] [CrossRef]
  30. Kim, T.H.; Lee, J.M.; Ahrberg, C.D.; Chung, B.G. Development of the microfluidic device to regulate shear stress gradients. BioChip J. 2018, 12, 294–303. [Google Scholar] [CrossRef]
  31. Sontheimer-Phelps, A.; Hassell, B.A.; Ingber, D.E. Modelling cancer in microfluidic human organs-on-chips. Nat. Rev. Cancer 2019, 19, 65–81. [Google Scholar] [CrossRef] [PubMed]
  32. Jigar, P.H.; Kent, N.J.; Knox, A.J.S.; Harris, L.F. Microfluidics in Haemostasis: A Review. Molecules 2020, 25, 833. [Google Scholar] [CrossRef] [PubMed] [Green Version]
  33. Azizgolshani, H.; Coppeta, J.R.; Vedula, E.M.; Marr, E.E.; Cain, B.P.; Luu, R.J.; Lech, M.P.; Kann, S.H.; Mulhern, T.J.; Tandon, V.; et al. High-throughput organ-on-chip platform with integrated programmable fluid flow and real-time sensing for complex tissue models in drug development workflows. Lab Chip 2021, 21, 1454–1474. [Google Scholar] [CrossRef]
  34. Carvalho, V.; Rodrigues, N.; Ribeiro, R.; Costa, P.F.; Teixeira, J.C.F.; Lima, R.A.; Teixeira, S.F.C.F. Hemodynamic study in 3D printed stenotic coronary artery models: Experimental validation and transient simulation. Comput. Methods Biomech. Biomed. Eng. 2020, 24, 623–636. [Google Scholar] [CrossRef] [PubMed]
  35. Carvalho, V.; Rodrigues, N.; Ribeiro, R.; Costa, P.F.; Lima, R.A.; Teixeira, S.F. 3D printed biomodels for flow visualization in stenotic vessels: An experimental and numerical study. Micromachines 2020, 11, 549. [Google Scholar] [CrossRef]
  36. Doutel, E.; Viriato, N.; Carneiro, J.; Campos, J.B.; Miranda, J.M. Geometrical effects in the hemodynamics of stenotic and non-stenotic left coronary arteries—Numerical and in vitro approaches. Int. J. Numer. Methods Biomed. Eng. 2019, 35, e3207. [Google Scholar] [CrossRef]
  37. Mosavati, B.; Oleinikov, A.V.; Du, E. Development of an organ-on-a-chip-device for study of placental pathologies. Int. J. Mol. Sci. 2020, 21, 8755. [Google Scholar] [CrossRef]
  38. Peng, J.; Fang, C.; Ren, S.; Pan, J.; Jia, Y.; Shu, Z.; Gao, D. Development of a microfluidic device with precise on-chip temperature control by integrated cooling and heating components for single cell-based analysis. Int. J. Heat Mass Transf. 2019, 130, 660–667. [Google Scholar] [CrossRef]
  39. Hynes, W.F.; Pepona, M.; Robertson, C.; Alvarado, J.; Dubbin, K.; Triplett, M.; Adorno, J.J.; Randles, A.; Moya, M.L. Examining metastatic behavior within 3D bioprinted vasculature for the validation of a 3D computational flow model. Sci. Adv. 2020, 6, eabb3308. [Google Scholar] [CrossRef]
  40. Bruus, H. Acoustofluidics 1: Governing equations in microfluidics. Lab Chip 2011, 11, 3742–3751. [Google Scholar] [CrossRef] [Green Version]
  41. Spurk, J.; Aksel, N. Fluid Mechanics, 2nd ed.; Springer: Berlin, Germany, 2008. [Google Scholar]
  42. Huber, D.; Oskooei, A.; Casadevalli, S.X.; DeMello, A.; Kaigala, G.V. Hydrodynamics in cell studies. Chem. Rev. 2018, 118, 2042–2079. [Google Scholar] [CrossRef] [PubMed] [Green Version]
  43. Schlichting, H.; Gersten, K.; Krause, E.; Oertel, H. Boundary-Layer Theory, 9th ed.; Springer: Berlin, Germany, 2017; p. 8. [Google Scholar]
  44. Bukowska, D.M.; Derzsi, L.; Tamborski, S.; Szkulmowski, M.; Garstecki, P.; Wojtkowski, M. Assessment of the flow velocity of blood cells in a microfluidic device using joint spectral and time domain optical coherence tomography. Opt. Express 2013, 21, 24025–24038. [Google Scholar] [CrossRef] [PubMed]
  45. Tanyeri, M.; Ranka, M.; Sittipolkula, N.; Schroeder, C.M.A. Microfluidic-based hydrodynamic trap: Design and implementation. Lab Chip 2011, 11, 3742–3751. [Google Scholar] [CrossRef] [PubMed]
  46. Yun, J.H.; Chun, M.S.; Jung, H.W. The geometry effect on steady electrokinetic flows in curved rectangular microchannels. Phys. Fluids 2010, 22, 052004. [Google Scholar] [CrossRef] [Green Version]
  47. Ertl, P.; Sticker, D.; Charwat, V.; Kasper, C.; Lepperdinger, G. Lab-on-a-chip technologies for stem cell analysis. Trends Biotechnol. 2014, 32, 245–253. [Google Scholar] [CrossRef]
  48. Esch, M.B.; Post, D.J.; Shuler, M.L.; Stokol, T. Characterization of in vitro endothelial linings grown within microfluidic channels. Tissue Eng. Part A 2011, 17, 23–24. [Google Scholar] [CrossRef] [Green Version]
  49. Cheng, C.P.; Herfkens, R.J.; Taylor, C.A. Comparison of abdominal aortic hemodynamic between men and women at rest and during lower limb exercise. Ann. Vasc. Surg. 2003, 37, 118–123. [Google Scholar] [CrossRef] [Green Version]
  50. Cheng, C.P.; Herfkens, R.J.; Taylor, C.A. Abdominal aortic hemodynamic conditions in healthy subjects aged 50–70 at rest and during lower limb exercise: In vivo quantification using MRI. Atherosclerosis 2003, 168, 323–331. [Google Scholar] [CrossRef]
  51. Koutsiaris, A.G.; Tachmitzi, S.V.; Batis, N.; Kotoula, M.G.; Karabatsas, C.H.; Tsironi, E.; Chatzoulis, D.Z. Volume flow and wall shear stress quantification in the human conjunctival capillaries and post-capillary venules in-vivo. Biorheology 2007, 44, 375–386. [Google Scholar]
  52. Tsao, C.; Yeh, L.; Cheng, Y. Mechanical-stress microfluidic device for stem cell stimulation. In Proceedings of the IEEE International Nanoelectronics Conference (INEC), Sapporo, Japan, 28–31 July 2014; pp. 1–2. [Google Scholar] [CrossRef]
  53. Song, L.; Butler, P.; Wang, Y.; Hu, Y.; Han, D.C.; Usami, S.; Guan, J.L.S.; Chien, S. The role of the dynamics of focal adhesion kinase in the mechanotaxis of endothelial cells. Proc. Natl. Acad. Sci. USA 2002, 99, 3546–3551. [Google Scholar] [CrossRef] [Green Version]
  54. Nenad, F.; Milica, N.; Tijana, S. Simulation of organ-on-a-chip systems. New Technologies and Future Prospects. Woodhead Publ. Ser. Biomater. 2020, 28, 753–790. [Google Scholar] [CrossRef]
  55. Sang, S.; Tanga, X.; Feng, Q.; Jian, A.; Zhang, W. A zero-flow microfluidics for long-term cell culture and detection. AIP Adv. 2015, 5, 2158–3226. [Google Scholar] [CrossRef] [Green Version]
  56. Jessanne, Y.L.; Yue, L.; Seunghyun, K. Numerical Analysis of a Trapezoidal Microchannel for Hydrodynamic Detachment of Cells. Int. J. Eng. Adv. Technol. (IJEAT) 2020, 9, 2249–8958. [Google Scholar]
  57. Figueroa-Morales, N.; Mino, G.L.; Rivera, A.; Caballero, R.; Clément, E.; Altshuler, E.; Lindner, A. Living on the edge: Transfer and traffic of E. coli in a confined flow. Soft Matter 2015, 11, 6284–6293. [Google Scholar] [CrossRef] [PubMed] [Green Version]
  58. Nam, U.; Kim, S.; Park, J.; Jeon, J.S. Lipopolysaccharide-Induced Vascular Inflammation Model on Microfluidic Chip. Micromachines 2020, 11, 747. [Google Scholar] [CrossRef]
  59. Poon, C. Measuring the density and viscosity of culture media for optimized computational fluid dynamics analysis of in vitro devices. bioRxiv 2020. [Google Scholar] [CrossRef]
  60. Heldin, C.H.; Rubin, K.; Pietras, K.; Östman, A. High interstitial fluid pressure—An obstacle in cancer therapy. Nat. Rev. Cancer 2004, 4, 806–813. [Google Scholar] [CrossRef]
  61. Jastrzebska, E.; Flis, S.; Rakowska, A. A Microfluidic System to Study the Cytotoxic Effect of Drugs: The Combined Effect of Celecoxib and 5-Fluorouracil on Normal and Cancer Cells. Microchim. Acta 2013, 180, 895–901. [Google Scholar] [CrossRef] [Green Version]
Figure 1. The circular microchamber: (a) top view; (b) front view; (c) side view (D = diameter).
Applsci 12 03829 g001
Figure 2. The longitudinal microchannel: (a) top view; (b) front view; (c) side view (D = diameter).
Applsci 12 03829 g002
Figure 3. The three parallel microchannels: (a) top view with high micropillar magnification; (b) front view; (c) side view.
Applsci 12 03829 g003
Figure 4. The closed microchannel structure: (a) top view with high micropillar magnification; (b) front view; (c) side view.
Applsci 12 03829 g004
Figure 5. Simulated shear stress and velocity magnitude along the red line are plotted versus the width of the circular microchamber using three different flow rates of 2, 6 and 10 µL/min. (ac) The fluid flow; (df) wall shear stress simulations within the circular microchamber with a microchannel height of 200 µm and flow rates of 2, 6 and 10 µL/min; (g) the velocity profiles; (h) wall shear stress profiles at h = 0 µm (solid lines), which is at the bottom of the microchamber, and h = 100 µm (dotted lines), which is the shear stress at the middle of the microchamber; (i) generated mesh density study of the circular microchamber. The small dots in Figure 5a–c are the velocity direction arrows.
Applsci 12 03829 g005
Figure 6. Simulated shear stress and velocity magnitude along the red line plotted versus the width of the microchannel using three different flow rates: 2, 6 and 10 µL/min. (ac) fluid flow; (df) wall shear stress simulations of the longitudinal microchannel with a height of 200 µm; (g) the velocity profile; (h) wall shear stress profile at the bottom of the microchannel (h = 0 µm- solid lines) and at the middle of the microchannel (h = 100 µm- dotted lines); (i) generated mesh density study of the longitudinal microchannel.
Applsci 12 03829 g006aApplsci 12 03829 g006b
Figure 7. The fluid flow simulation of the three parallel microchannels separated by two rows of micropillars with (a) flow rates of 2 µL/min; (b) 6 µL/min and (c) 10 µL/min, which are plotted versus the width of the device using three different flow rates within the side microchannels. The wall shear stress simulation in the three parallel microchannels device with a height of 200 µm and three different flow rates within the side microchannels at (d) 2 µL/min; (e) 6 µL/min and (f) 10 µL/min (simulated shear stress and velocity magnitude along red line); (g) the velocity profile; (h) wall shear stress profile at the bottom of the microchannels (h = 0 µm, solid lines) and wall shear stress profile at the middle of the microchannels (h = 100 µm, dotted lines); (i) generated mesh density study for three parallel microchannels separated by two rows of micropillars. Red circles highlight the velocity and shear stress fluctuations near the micropillar structures.
Applsci 12 03829 g007aApplsci 12 03829 g007b
Figure 8. Simulated shear stress and velocity magnitude along the red line. (ac) the fluid flow; (df) wall shear stress; (gi) pressure simulations in a closed microchannel structure with a height of 200 µm using six different flow rates; (a,d,g) flow rates of 3 µL/min for the main microchannels and 2 µL/min for the side microchannels; (b,e,h) 5 µL/min for the main microchannels and 6 µL/min for the side microchannels; (c,f,i) 7 µL/min for the main microchannels and 10 µL/min for the side microchannels. (j) generated mesh density study for a closed microchannel structure.
Applsci 12 03829 g008
Figure 9. The velocity, wall shear stress (at h = 0 µm, the bottom) and in the middle (h = 100 µm) of the microchannel, and pressure profiles using six flow rates within the side and main microchannels versus the width of the microchannel. (a) the velocity magnitude; (b) wall shear stress at h = 0 µm and; (c) at h = 100 µm; (d) pressure using flow rates of 3 µL/min (main microchannel) and 2 µL/min (side microchannels) (blue line); 5µL/min (main microchannel) and 6 µL/min (side microchannels) (dotted green line); and 7 µL/min (main microchannel) and 10 µL/min (side microchannels) (red line). Red circles highlight the velocity and shear stress fluctuations near the micropillar structures.
Applsci 12 03829 g009aApplsci 12 03829 g009b
Figure 10. The influence of height in microfluidic devices using different heights of 30 and 60 μm. The velocity magnitude and wall shear stress profile at the bottom microchannels (h = 0 µm) and in the middle of the microchannels (h = 30 µm). (a,b) the circular microchamber; (c,d) the longitudinal microchannel; and (e,f) the three parallel microchannels with a height of 60 µm using flow rates of 2, 6, and 10 µL/min for the side channels. Red circles in (e,f) highlight the velocity and shear stress fluctuations near the micropillar structures.
Applsci 12 03829 g010
Figure 11. The variations of the velocity profile for different values of the aspect ratio of height (h) and width (w).
Applsci 12 03829 g011
Publisher’s Note: MDPI stays neutral with regard to jurisdictional claims in published maps and institutional affiliations.

