1. Introduction
The current explosion of Information and Communication Technologies (ICT) and embedded systems represents the introduction of a novel technology: Internet of Things (IoT). It allows objects and individuals in virtual environments and the physical world to interrelate with one another [
1,
2]. A considerable number of appliances deploying IoT as a major data collection element, form smarter environments such as smart cities, homes, healthcare, and smart transportation [
3]. The amalgamation of IoT and cloud-oriented online appliances perform better than usual cloud-oriented appliances with respect to effectiveness [
4,
5,
6]. The rising number of appliances in industries such as banking, military and the medical field can employ this amalgamation. Particularly, the cloud-oriented IoT helps offer proficient services to health care appliances for accessing and monitoring records from distant locations.
The healthcare industry has shown substantial growth in recent years, contributing significantly to revenue and employment. In the past few years, the diagnosis of diseases and abnormalities in the human body was possible only after having a physical examination in the hospital. Most of the patients remained in the hospital throughout their treatment process, which resulted in higher healthcare costs and strain on rural and remote health facilities. Through the technological advancements achieved over time, it is now possible for miniaturized devices such as smartwatches to diagnose various diseases and monitor their health.
IoT-based medical appliances collect the required information such as recurrent transformations in health constraints and update the rigorousness of health constraints all within a standardized time interval [
7,
8,
9]. In addition, IoT devices and medical parameters related to sensor readings will be deployed for identifying diseases within the correct timeframe before reaching the rigorous state. Machine learning schemes are playing the most important task in making decisions and handling a larger quantity of data [
10,
11,
12,
13]. The procedure of adapting data analysis schemes to the definite areas involves defining data types such as volume, variety and velocity [
14,
15].
The benchmark data analysis models include Neural Network (NN), clustering and classification methods in addition to effectual schemes [
16,
17,
18,
19]. Data can be produced from a variety of sources with specific data types, and are also significant for developing techniques capable of managing the data features. In IoT, a larger volume of sources produces the essential data without crisis in real time. However, the efficient diagnosis of disease in IoT requires further enhancements in terms of energy efficiency.
The main contributions of the presented methodology are listed below:
Introduction of a new disease diagnosis model in IoT via an energy-efficient optimal clustering approach. Further deep learning-based disease prediction is carried out.
Introduction of an alert system, which determines the severity of the disease risk level using the correntropy-based method. This insists that the patient requires help from a health care center or hospital for emergency treatment.
Introduction of a new Hybrid Elephant and Moth Flame with Adaptive Learning for solving optimization issues such as optimal weight selection in Deep Convolutional Neural Network (DCNN) and optimal centroid selection for clustering.
In this paper,
Section 2 describes a review on IoT-based healthcare models. The proposed energy-efficient IoT-based healthcare model is represented in
Section 3.
Section 4 portrays network creation and energy-efficient clustering.
Section 5 depicts disease diagnosis in IoT and
Section 6 portrays the albert system: proposed severity level estimation.
Section 7 depicts the proposed HEM-AL algorithm for optimal centroid selection and weight optimization.
Section 8 and
Section 9 explain the results and conclusions, respectively.
2. Literature Review
2.1. Related Works
In 2019, Shreshth et al. [
20] developed a novel approach termed HealthFog that integrated “ensemble deep learning in Edge computing” and employed it to produce a realistic appliance for the automated analysis of heart disease. HealthFog delivered medical care as fog services using IoT and effectively managed health information of heart patients that arrived upon the user’s request. In addition, FogBus was deployed for testing the performance of the developed approach in terms of jitter, accuracy, execution time, latency, and network bandwidth and power utilization.
In 2020, Bharathi et al. [
21] presented an Energy Efficient Particle Swarm Optimization (EEPSO) method for the effectual assortment of Cluster Heads (CHs) amongst varied IoT devices. The IoT devices deployed for finding medical data were clustered and a Cluster Head (CH) was selected using EEPSOC. The chosen CH forwarded the information to cloud servers. Subsequently, the CH was accountable for conveying information from IoT devices to cloud servers via fog devices. Following this, an Artificial Neural Network (ANN) classifier was used for diagnosing the medical data in the cloud server to recognize the severity of disease.
In 2020, Akhbarifar et al. [
22] presented a health monitor scheme, which applied a lightweight block encryption technique for the remote provision security of health data in cloud-oriented IoT. Here, the health status of patients was portrayed via forecasting essential circumstances through data mining techniques. It was used for examining their biological information by smarter health IoT, where a lightweight secured block encryption method was deployed for ensuring the patients’ confidential data. The investigational outcome demonstrated that the K-star technique achieved the most results with high recall, precision, and accuracy.
In 2018, Priyan et al. [
9] presented a novel efficient model for diabetic disease and the associated health data were produced by exploiting the “UCI Repository dataset” and the medicinal sensors were used for forecasting the individuals who were suffering from diabetes. Moreover, a Neural Classifier was proposed for treating the diseases with rigorousness. Finally, experiments were conducted that proved the effectiveness of the suggested scheme over extant models.
In 2017, Prabal et al. [
3] adopted a novel IoT-oriented cloud-centric framework for disease diagnosis that predicted the probable disease and its severity level. Major terminologies were described to produce user-based health measures by analyzing the concepts of computational science. The resultants were evaluated after processing the health measures in a definite environment. Diagnostic systems were deployed using diverse algorithms and the results were evaluated depending on varied metrics.
In 2020, Arwinder et al. [
23] introduced IoT-Pulse for predicting alcoholic obsession that offered realistic data using machine-learning in fog surroundings. Here, data were gathered from 300 patients with alcoholism as a case study for training machine-learning schemes. The performances of IoT Pulse were evaluated over extant works using different parameters together with precision, specificity and sensitivity and accuracy that showed higher improvements.
In 2019, Pravin et al. [
24] proposed an effective technique for identifying individuals affected by dengue at previous stages, so that the health check team could offer treatments. The technique presented here classified the individuals based on their symptoms and sent an alert to the individuals instantaneously via mobile device. The model aids medical professionals in discovering the impacts of disease by examining the results and acting efficiently within a restricted time period.
In 2018, Tuan et al. [
25] proposed a Fog-oriented model for health monitoring and fall recognition. With this system, both e-health waveforms such as body temperature, glucose, ECG and contextual data such as air quality, humidity and room temperature were remotely monitored in real-time. In addition, the system offered many sophisticated services such as distributed storage, security, etc. Subsequent results showed that the proposed model worked perfectly with high energy efficiency.
2.2. Review
Table 1 shows the reviews on IoT-based healthcare systems. At first, Bagging Classifier was introduced in [
20] offering high accuracy and minimal execution time. However, cost-optimal execution was not considered. Artificial neural network (ANN) was exploited in [
21] that offered better specificity and enhanced accuracy, but compressive sensing should be of more concern. K-star classification method was used in [
22] that resulted in a better F-score and offered high precision. However, it requires greater consideration regarding real physical cloud-oriented implementation. In addition, the Fuzzy Rule was implemented in [
9] that accomplished better specificity with minimal response time; nevertheless, it requires more security for medical data. The regression method presented in [
3] raised the specificity with better accuracy, but requires consideration regarding the refinement of Scale-COND. Moreover, k-Nearest Neighbors (KNN) implemented in [
23] provided increased accuracy and posed minimal latency. Nevertheless, cost-optimal execution was not considered. In addition, a Fog computing-based model was suggested in [
24] which offered minimal computational and minimal delay times. However, cost issues need to be better resolved. The AES algorithm introduced in [
25] minimized power consumption with higher energy efficiency. However, issues on fall cases require further attention. Therefore, these limitations must be considered for improving the performance of IoT-based healthcare systems in the current research work.
3. Proposed Energy-Efficient IoT Based Healthcare Model
The implemented energy-efficient IoT-based healthcare modeling encompasses three most important phases, namely: (i) Energy-efficient clustering (ii) Disease diagnosis (iii) Alert system.
Initiation of data and Clustering: Initially, the medical data, are extracted via the Thinkspeak IoT platform and each data are stored in a cloud subsystem. The medical data consists of breast cancer data, heart data and lung cancer data. The nodes or devices are subjected to energy-efficient clustering based on the constraints such as energy and distance. Here, the clustering was conducted with optimal centroid.
Disease Diagnosis: The disease diagnosis was conducted in two phases, namely “feature extraction and classification”. During feature extraction, the statistical and higher-order features were extracted. These extracted features were then classified via Optimized DCNN, in which weights were optimally tuned by a new hybrid algorithm.
Alert System: Based on the diagnosed disease, the severity level is assessed. This finalizes the need of medical assistants for emergency treatment.
In this work, optimization algorithms play a key role in efficient disease diagnosis. Particularly, optimal centroid selection during the clustering process and weights of DCNN are also chosen during diagnosis. For this, a new HEM-AL model has been introduced that assists in attaining the defined objective function for optimal training.
Figure 1 shows a pictorial representation of the presented IoT-based healthcare framework.
4. Network Creation and Energy-Efficient Clustering
The developed work concerns three sets of medical data that include breast cancer data, heart data and lung cancer data. The breast cancer data comprise 289 records and 9 attributes (289 × 9), heart data comprise 270 records and 14 attributes (270 × 14) and lung cancer data comprise 22 records and 14 attributes (22 × 57). Accordingly, the total number of records is considered as the total number of nodes, i.e., (289 + 270 + 22 = 578 nodes). Further, the energy of nodes is assigned between 0 and 1 for each node (in IoT with BS). In the developed model, the energy-efficient clustering of nodes takes place by considering distance and energy.
Distance [26]: It is computed as per Equation (1), where
represents the distance amongst nodes and centroid (CH) as shown in Equation (3) and distance amongst centroid (CH) and Base Station (BS) as specified in Equation (2), here
refers to distance amongst two nodes as specified in Equation (4). Here,
lies amongst [0, 1].
Energy Model [26]: Energy utilization is another major concern. In fact, the battery cannot be re-energized as there is no power supply. However, additional energy is required for transmitting information to BS from all nodes. Therefore, the energy model for transferring whole data is revealed in Equation (5), where
signifies the electronic energy relied and
signifies the energy necessary for transferring
bytes of packets at
distance. The energy model is shown in Equation (6), wherein
refers to the energy utilization during data collection. The whole energy needed for
packets at distance
is shown in Equation (7). Equation (8) indicates the amplification energy and
denotes the “power amplifier energy” and
denotes the energy required for employing the free-space technique.
Usually, the entire network energy is determined as shown in Equation (10), wherein
denotes the energy at idle state and
denotes energy cost.
5. Disease Diagnosis in Internet of Things: A Deep Learning-Based Model
The disease diagnosis is carried out in IoT. At first, the statistical features and higher-order statistical features are extracted from the data that are described in the below section.
5.1. Extraction of Statistical Features
Initially, the statistical features were determined from the data. Here, the statistical measures such as mean, mode, median, variance and standard deviation are determined. The extracted statistical features are denoted by .
5.2. Extraction of Higher-Order Statistical Features
Skewness [27]: “It is a symmetry measure or the lack of symmetry exactly. A data set or distribution is symmetric only if it is similar to the left and right of the centre point”. The mathematical expression of skewness
is given in Equation (11).
In Equation (11), , , …, , indicates the mean value, denotes the standard deviation and refers to the number of data points. Moreover, is calculated with present in the denominator rather than while computing the skewness. Further, the skewness value is near zero for any symmetric data, and zero for the skewness for a normal distribution.
Kurtosis [27]: “It is a measure that identifies whether the data are light-tailed or heavy-tailed and related to the normal distribution”. Datasets with less kurtosis [
27] tends to provide a lack of outliers or lower tails. Moreover, a dataset with larger kurtosis tends to provide outliers, or heavy tails. The mathematical formula of kurtosis
for univariate data such as
,
, …,
, is expressed in Equation (12).
The standard deviation is calculated by the value present in the denominator rather than while computing the kurtosis.
Entropy feature [28]: Entropy is computed as in Equation (13), where
and
are the coordinates of the co-occurrence matrix.
Second Moment [
28]: “It is a measure of the uniformity of data” and it is computed as in Equation (14).
Percentile [29]: It provides an idea of ‘how the data values are spread over the interval from the smallest value to the largest value’. About
percent of data values come under
percentile, and around 100-
percentage of data values exceed the
percentile. The percentile features are denoted by
. The higher-order statistical features are indicated as
, and is given in Equation (15).
Accordingly, the extracted statistical and higher-order statistical features are summed up as . These features are given as input to optimized DCNN for classification.
5.3. Optimized DCNN
The extracted features are subjected to DCNN [
30], which include 3 varied layers, namely “convolutional layer, pooling layer, and fully-connected layers”. All neurons in the feature map are connected to neighboring neurons in the previous layer. At a position
in
layer of
feature map, the values of features are evaluated as per Equation (16).
In Equation (17),
denotes the weight that is tuned optimally using the HEM-AL scheme and
denotes the bias term of
filter related to
layer. In addition, at the centered location
of
layer, the patch input is indicated by
. The activation value
related to convolutional features
is evaluated as given in Equation (17).
Pooling layer: Pooling layers in the DCNN perform the down sampling operations with the outcomes acquired from the convolutional layers. For each pooling function
related to
, the
value is computed as given in Equation (18), where,
refers to a neighborhood near a location
.
The output layer is the last layer of DCNN, in which the prediction results occur. The loss of DCNN is symbolized by
and is computed as in Equation (19).
The general constraint related with and is specified by . Here exist counts of output–input relation . The input feature, the labels and output are specified by , and , respectively.
6. Alert System: Proposed Severity Level Estimation
After the disease diagnosis, the severity level is estimated using the entropy method.
Correntropy
The correntropy-variation technique [
31] is utilized for evaluating the similarities between the diagnosed outcome
and the actual outcome
. The correntropy
of
and
features are computed as per Equation (20). Here,
is the kernel size and
are the features of the expected values, and
is the Gaussian kernel function. Mathematically
is expressed as per Equation (21). In addition, the correntropy is computed as per Equation (22).
The absolute variation
is normalized to acquire the risk level
as in Equation (23).
Over the normal samples, the acquired minimum and maximum correntropy values are denoted as and , respectively. When is higher, the risk level will be higher and thus the patient will be prompted to call the ambulance. When is lesser, the risk level is said to be less and thus the patient is prompted to attend the hospital. When is medium, the risk level is said to be neutral and thus the patient is asked to contact their doctor.
7. Proposed HEM-AL Scheme for Optimal Selection of Centroid and DCNN Weights
7.1. Solution Encoding and Objective Function
In this work, the centroids are optimally chosen for attaining energy-efficient clustering. Furthermore, for disease diagnosis in IoT, optimized DCNN was deployed, where the weights were also elected optimally for better training. For optimization purposes, a new HEM-AL model is introduced in this work. The input solution for optimal centroid selection is illustrated in
Figure 2, wherein,
,
and
represent the centroids for lung cancer, breast cancer and heart disease, respectively. The minimal and maximal values of lung cancer data form the bounds of
, minimal and maximal values of breast cancer data form the bounds of
and minimal and maximal values of heart disease data form the bounds of
. The objective function
of the developed model for optimal centroid selection is given in Equation (24), wherein
and
is evaluated as shown in Equations (25) and (26), respectively. In Equation (25),
refers to the cluster.
Further, the nodes are clustered based on the centroid as shown in Equations (27)–(29). If
is small, the data belong to
, if
is small, the data belong to
and if
is small, the data belong to
.
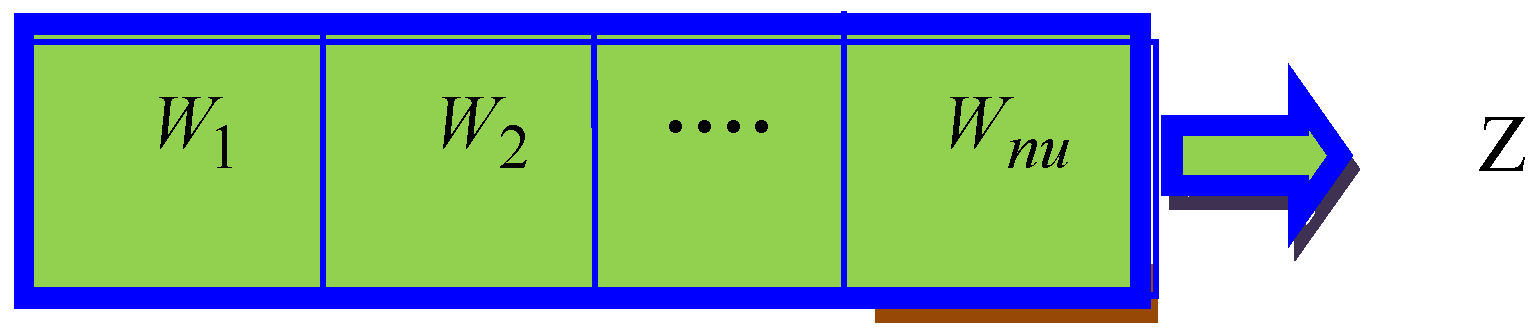
The input solution to the adopted scheme for optimal weight selection is illustrated in
Figure 3, wherein,
,
,
, signifies the weight and
represents the entire weight count. Furthermore, the objective of the developed model denoted by
is given in Equation (30), wherein
signifies the error.
7.2. Proposed HEM-AL Algorithm
The traditional Elephant Herding Optimization (EHO) [
32] approach has several advantages, but also bears several shortcomings that necessitate a progression of the searching quality. Hence, the concept of Moth-flame optimization (MFO) [
33] is incorporated into it to introduce a new algorithm termed as HEM-AL. Hybridized optimization schemes are said to be capable for specific search issues [
19,
34,
35,
36]. The steps followed in the proposed HEM-AL are as follows: In the proposed Algorithm 1, the new position of the best elephant and matriarchs is evaluated, and the rest of the positions are updated using an MFO update.
Elephants are social creatures that live in social groups including calves and females. The group involves a variety of clans, and all clans are headed by a matriarch. Usually, female elephants live with the clans, whereas male elephants leave the clans when they reach adulthood. The below assumptions are considered in EHO:
The population includes numerous clans and each clan includes female and male elephants.
Some of the male elephants leave the clan and live alone.
Each clan is headed by a matriarch.
Clan-updating Operator: As per the nature of the elephants, the elephants in a clan are led by the matriarch. Thus, the matriarch has a major impact on the novel positions of all the elephants. For every elephant in clan , a matriarch affects the subsequent position . Conventionally, the best elephant in each clan is evaluated. However, as per the developed HEM-AL model, the elephants are divided into three groups.
Best elephant in the herd,
Matriarchs of each clan,
Remaining elephants
The proposed new position of the best elephant in the herd, is denoted by
, and is updated as per Equation (31), wherein,
refers to inertia weight,
refers to impact factor and
is computed as per Equation (32). Further,
is computed as shown in Equation (33). Here,
and
refers to new and old speed of elephant
,
refers to middle position of matriarchs and
refers to the number of clans.
In addition, the proposed new position of matriarchs of each clan, denoted by
is updated as per Equation (34), wherein,
is computed as per Equation (35). In Equation (35),
refers to acceleration coefficient and
refers to normally distributed random integer (0, 1).
Further, the remaining elephants
are updated based on the MFO models shown in Equation (36), where
is calculated as the average distance of
moth with
flame (i.e.,
),
denotes the shape of the logarithmic spiral,
is an arbitrary number that lies within the range [−1, 1].
| Algorithm 1: Pseudocode of HEM-AL method. |
| input: |
| output: |
| initialization |
| compute the fitness as per Equations (24) and (30) |
| repeat |
| | arrange all the elephants according to their fitness |
| | clan updating |
| | for to (for each clan of elephant population) do |
| | | for to (for every elephant in the clan ) do |
| | | | update new position of best elephant in the herd, as per Equation (31) |
| | | | update new position of matriarchs of each clan as per Equation (34) |
| | | | update remaining elephants based on MFO algorithm as per Equation (36) |
| | | end for |
| | end |
| | end for |
| | evaluate the population by the newly updated positions |
| until (Maximum number of generations) |
8. Results and Discussion
8.1. Simulation Set Up
The introduced IoT-based healthcare model via HEM-AL + DCNN was implemented with
MATLAB. The implementation was performed with respect to “accuracy, sensitivity, specificity, precision, F1-score, Negative Predictive Value (NPV), Matthews Correlation Coefficient (MCC), False Negative Rate (FNR), False Discovery Rate (FDR) and False Positive Rate (FPR)” by varying the test cases from 1, 2 and 3 (three diseases). Consequently, the enhancement of the developed HEM-AL + DCNN model was measured by evaluating it over extant schemes, namely MFO + DCNN [
33], EHO+ DCNN [
32], Whale Optimization Algorithm (WOA) + DCNN [
37], and EEPSO + DCNN [
21] models. Here, convergence analysis was computed for different iterations numbering 0, 5, 10, 15, 20 and 25.
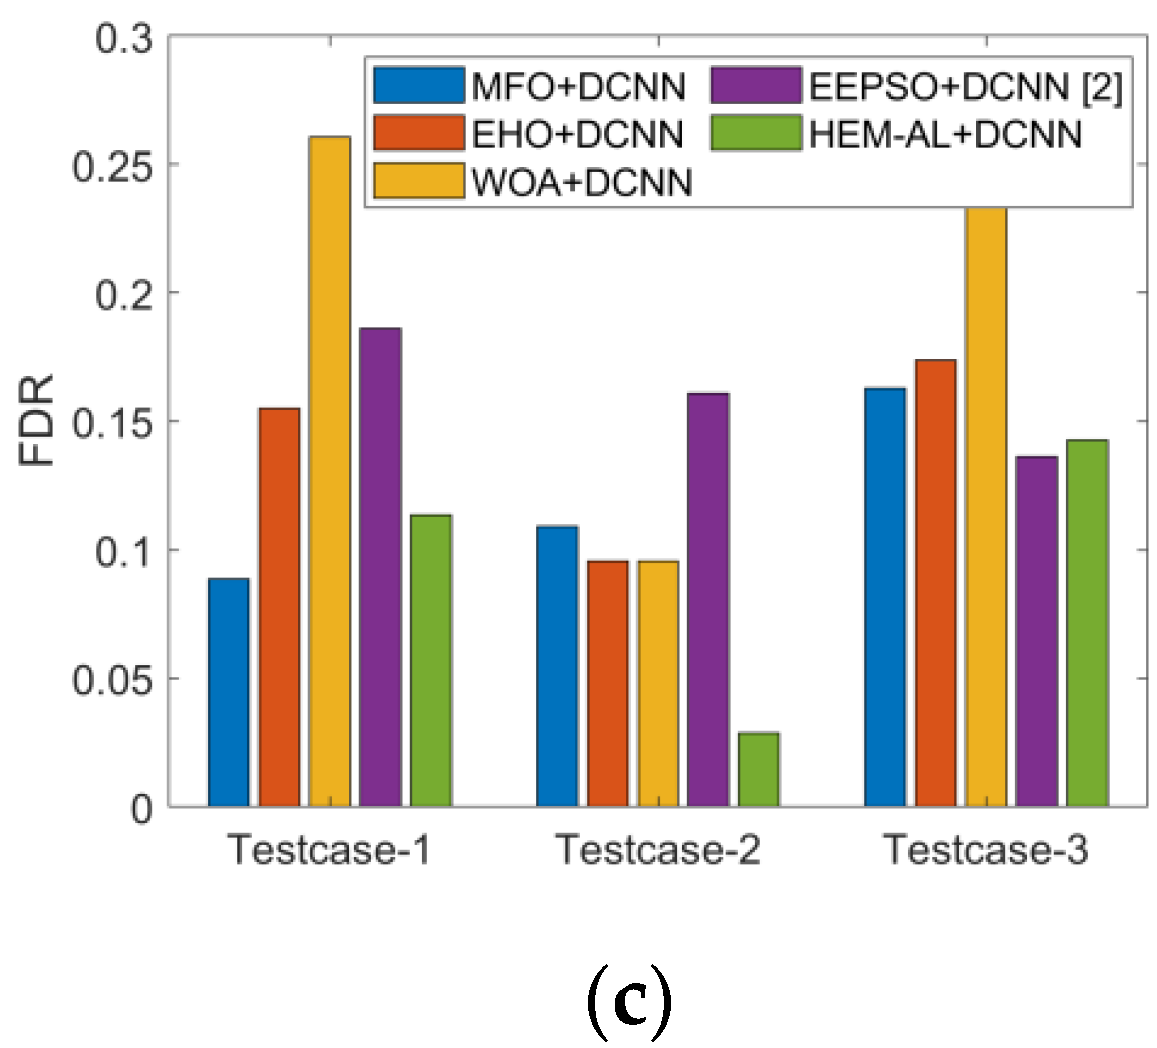
8.2. Performance Analysis
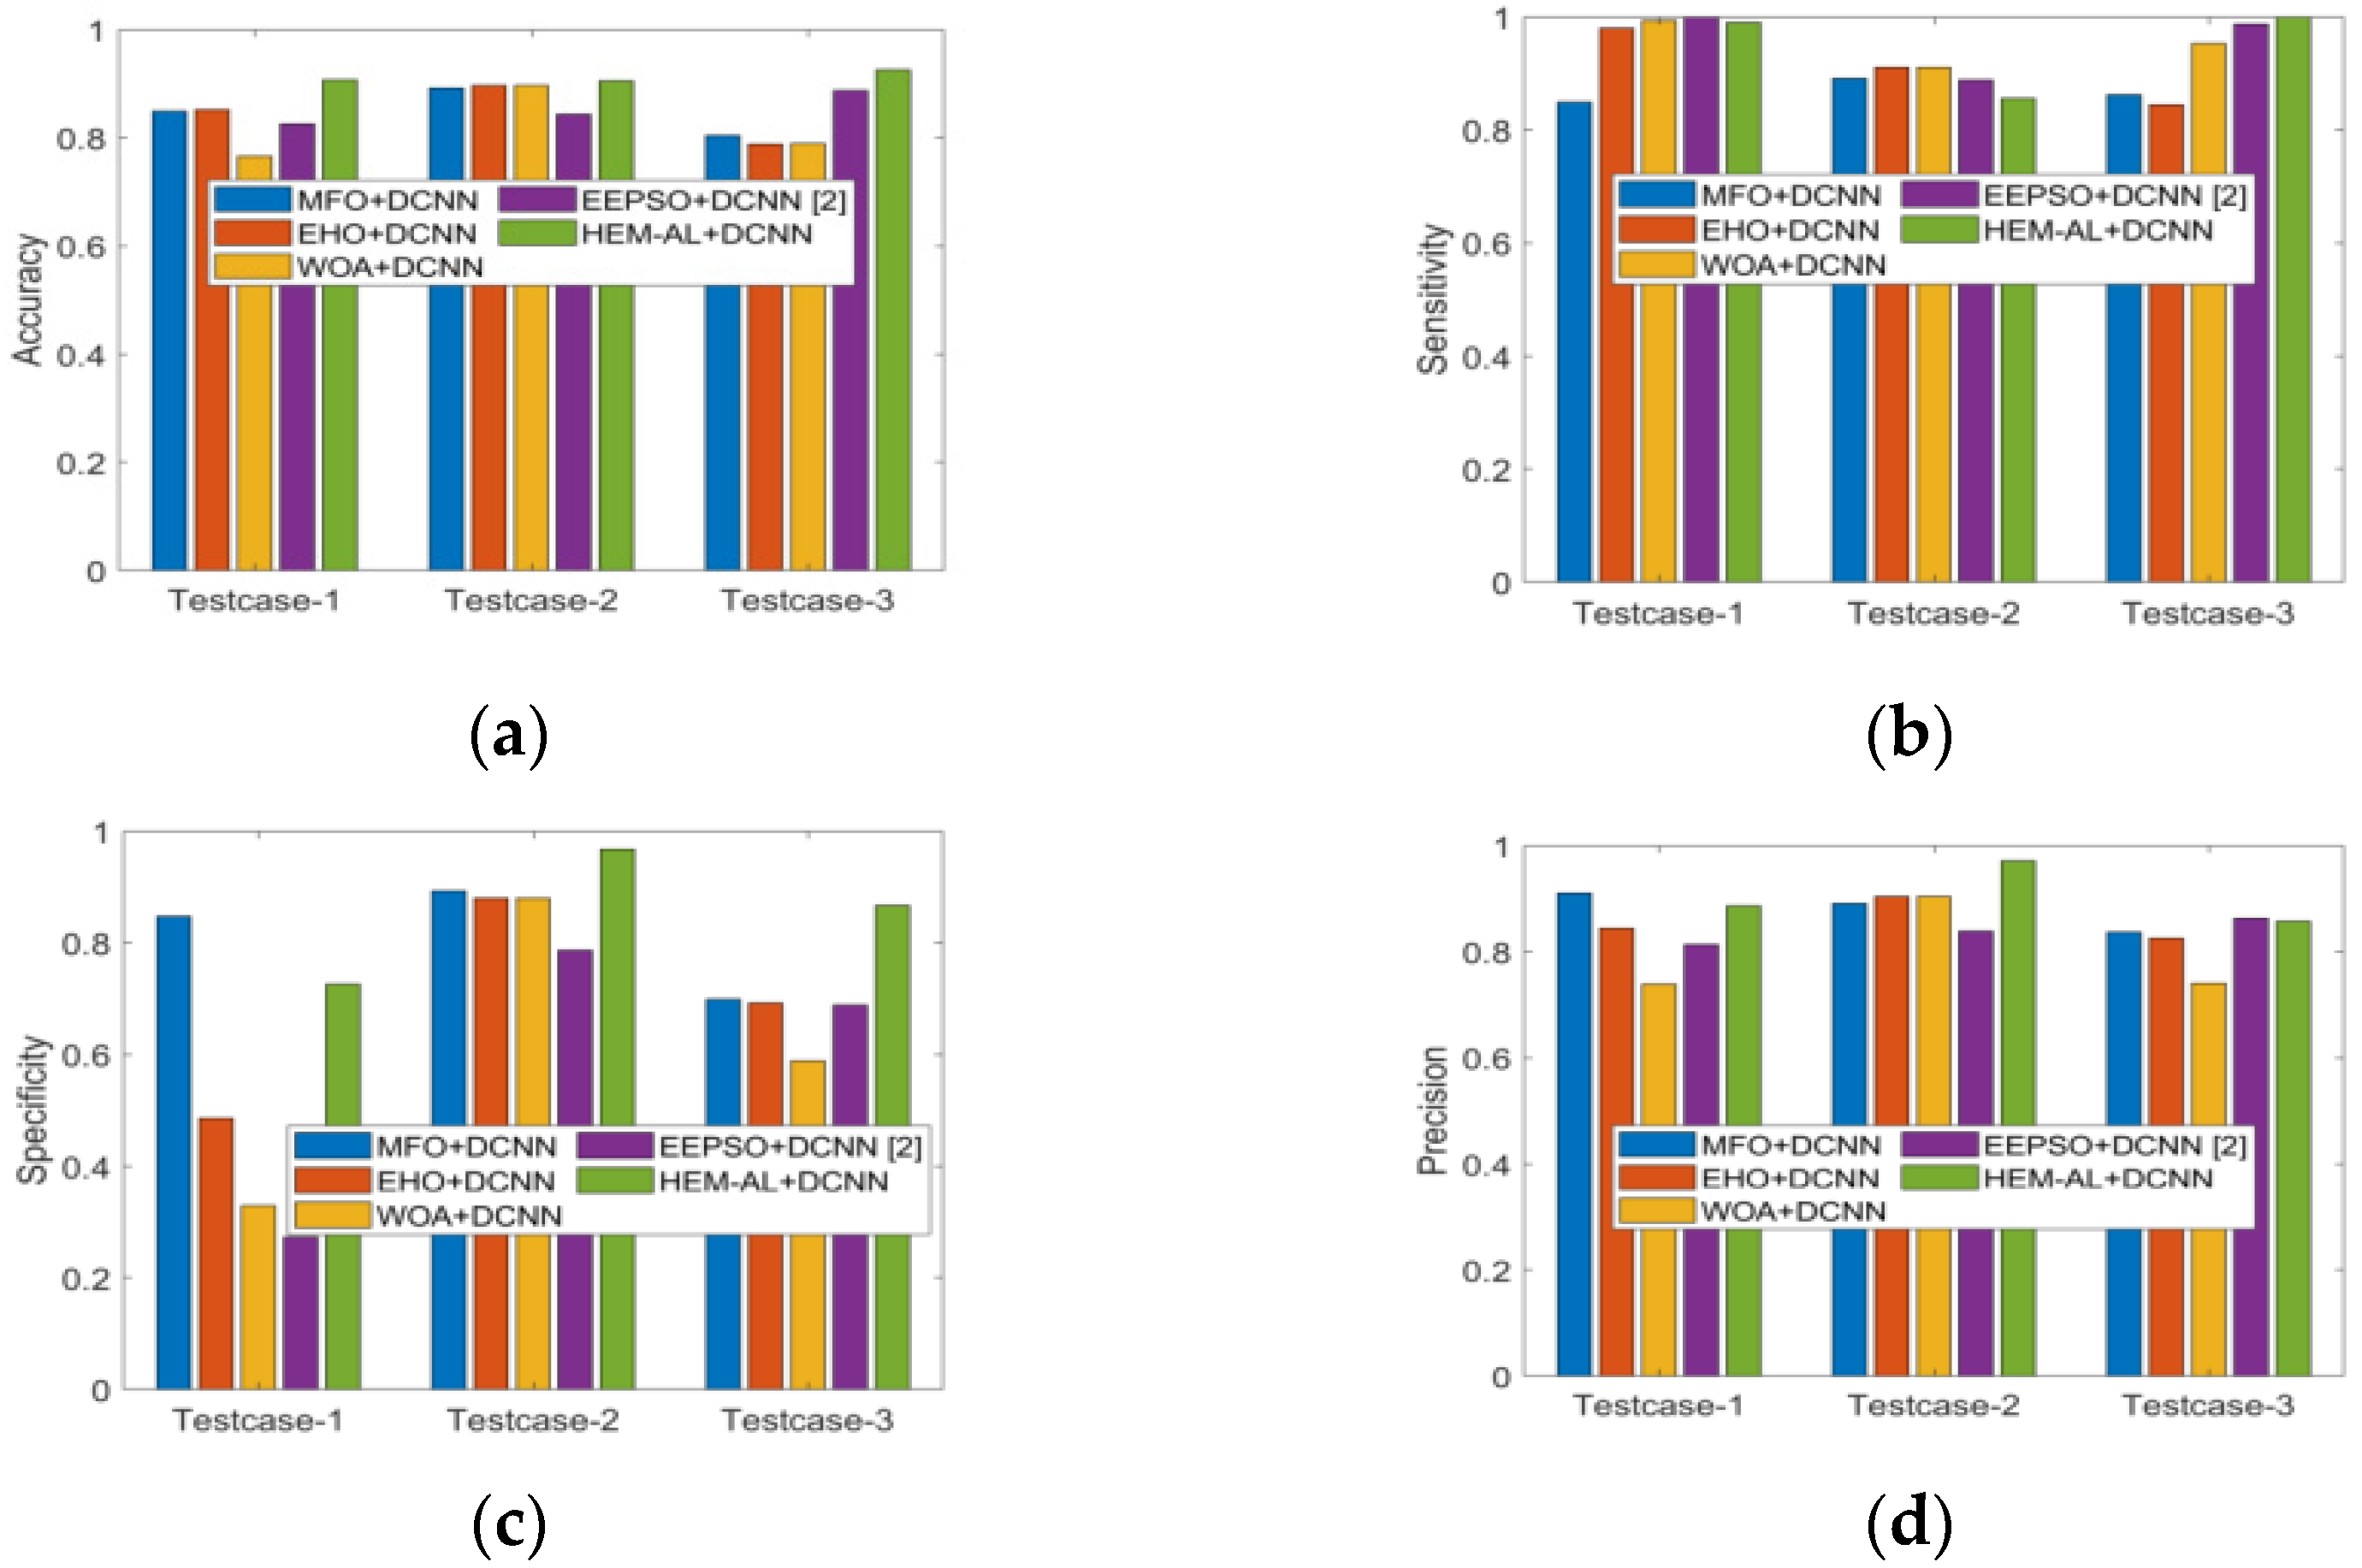
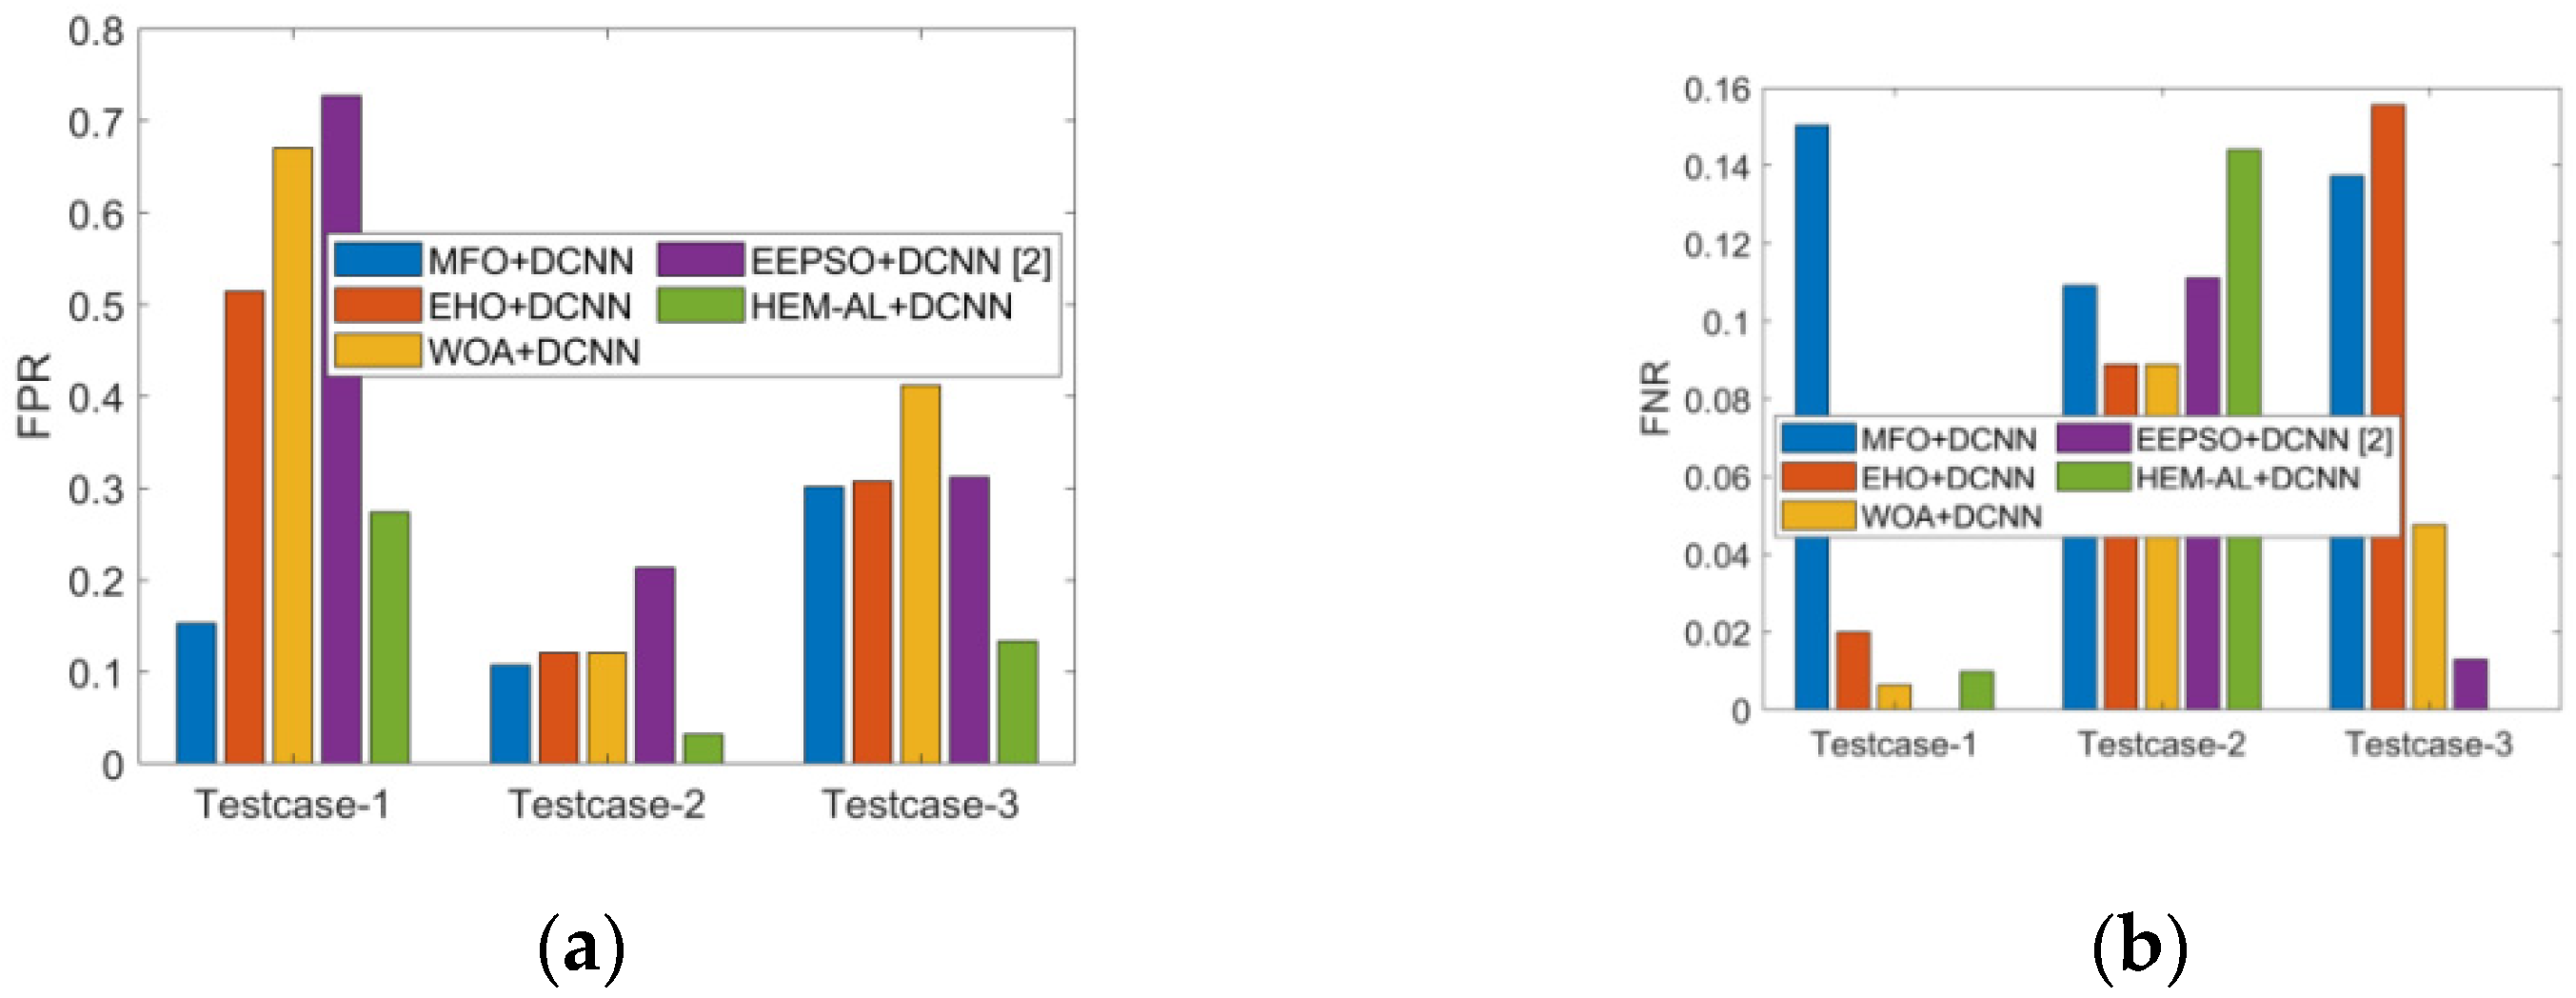
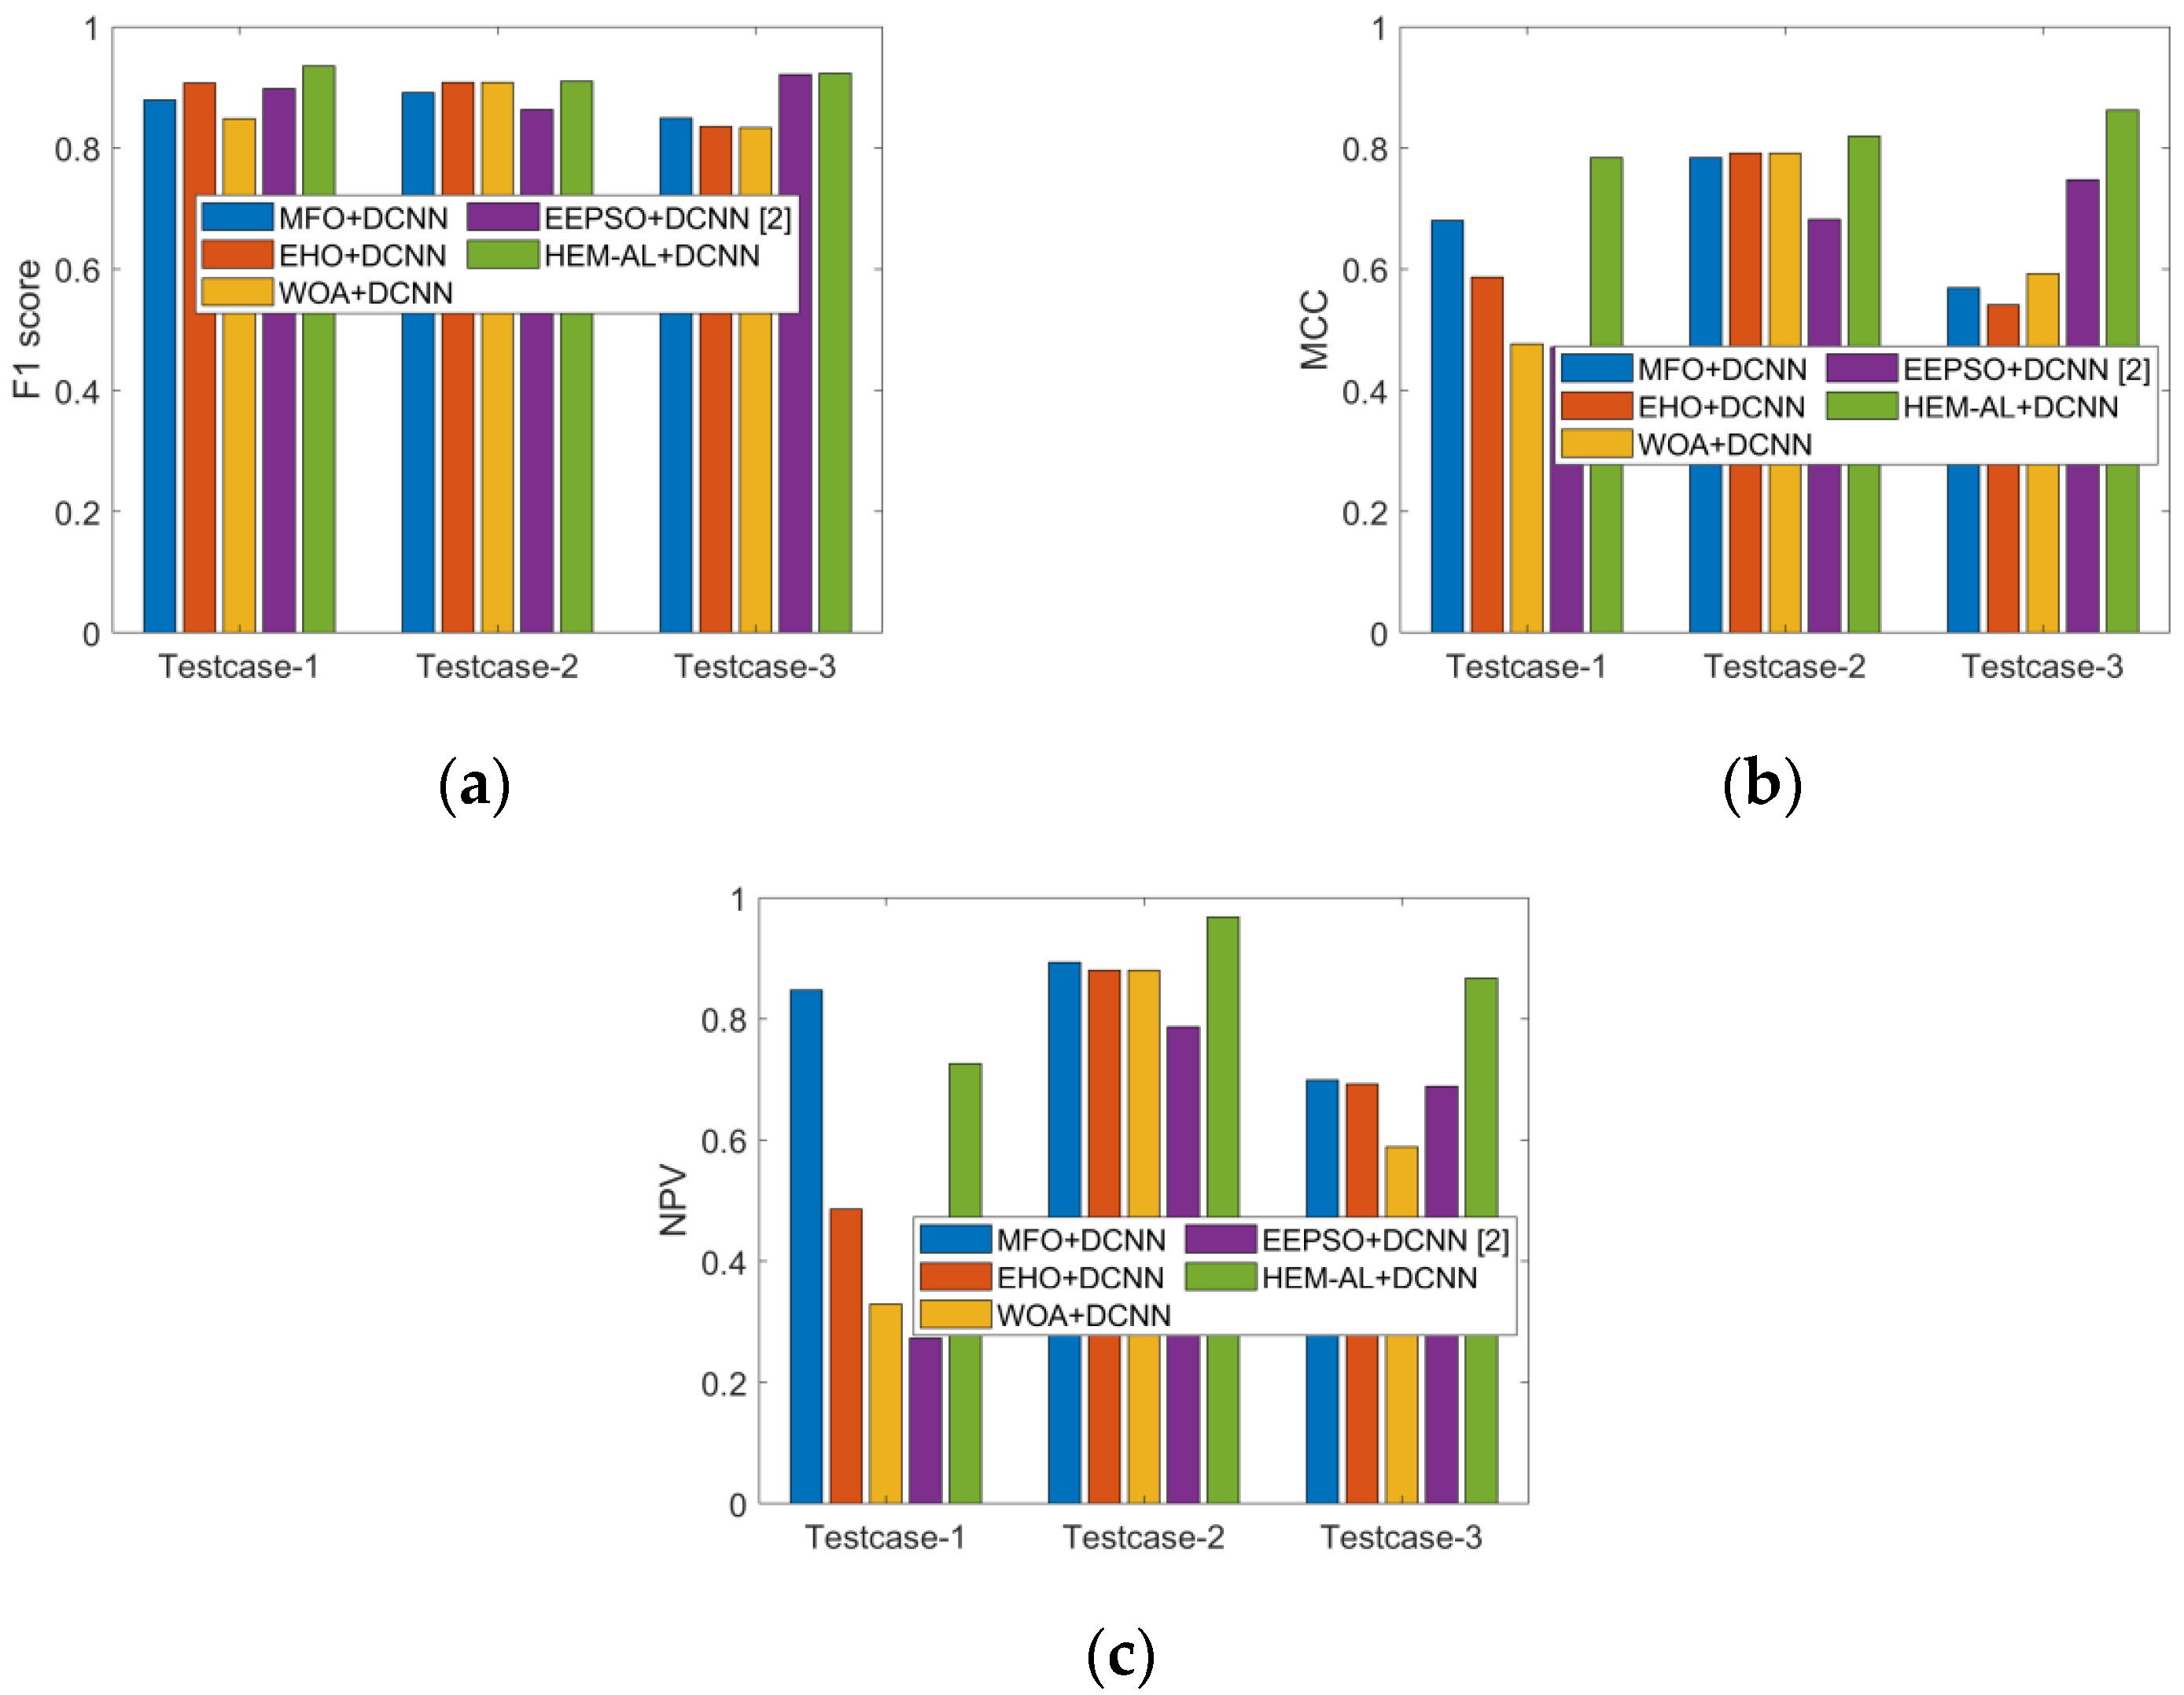
The performances of the developed HEM-AL + DCNN model were evaluated over extant models for disease diagnosis regarding “positive measures such as accuracy, sensitivity, specificity, precision, neutral metrics such as F1-score, NPV, MCC and negative measures such as FNR, FDR, FPR”. Consequently, the results for positive metrics, negative metrics and neutral metrics were exposed in
Figure 4,
Figure 5 and
Figure 6, respectively. Upon analysis of all graphs, the presented HEM-AL + DCNN model obtained better outcomes than compared schemes. Minimal negative values guaranteed the enhanced detection rate of the model.
- ❖
As shown in
Figure 4a, the presented HEM-AL + DCNN model has achieved better accuracy values (accurate diagnosis of disease), which show a 5.56%, 5.56%, 13.33% and 10% improvement over MFO + DCNN, EHO + DCNN, WOA + DCNN and EEPSO + DCNN models for test case 1.
- ❖
As shown in
Figure 4b, the sensitivity measure has gained a higher value of 100 for the adopted scheme for test case 3, which is far superior to the values attained by traditional methods such as MFO + DCNN, EHO + DCNN, WOA + DCNN and EEPSO + DCNN. Thus, the high rates of positive measures and lower rates of negative measures have ensured the development of the suggested model.
- ❖
Altogether, the performance of the proposed HEM-AL + DCNN was proven superior over other schemes for accurate disease diagnosis.
8.3. Analysis of Classifier
Table 2 describes the classification analysis of the adopted HEM-AL + DCNN scheme over traditional schemes.
- ❖
On observing the analysis outcomes, the proposed HEM-AL + DCNN model has attained higher positive values for all metrics when compared to the existing schemes.
- ❖
On observing accuracy as shown in
Table 2, the adopted scheme for test case 1 has attained a higher value (0.99), with 7.41%, 17.34% and 13.41% superiority to traditional NN, CNN and DCNN models.
- ❖
The sensitivity of the introduced scheme for test case 1 was found to be higher for the presented model.
- ❖
The F1-score of the suggested approach was 17.75%, 16.74% and 16.74% superior to traditional NN, CNN and DCNN models.
- ❖
Upon consideration of FPR, the developed scheme exhibited lower values than the extant approaches, thus ensuring the better development of the introduced model.
- ❖
The assessment proves the improvement of the suggested scheme for disease diagnosis.
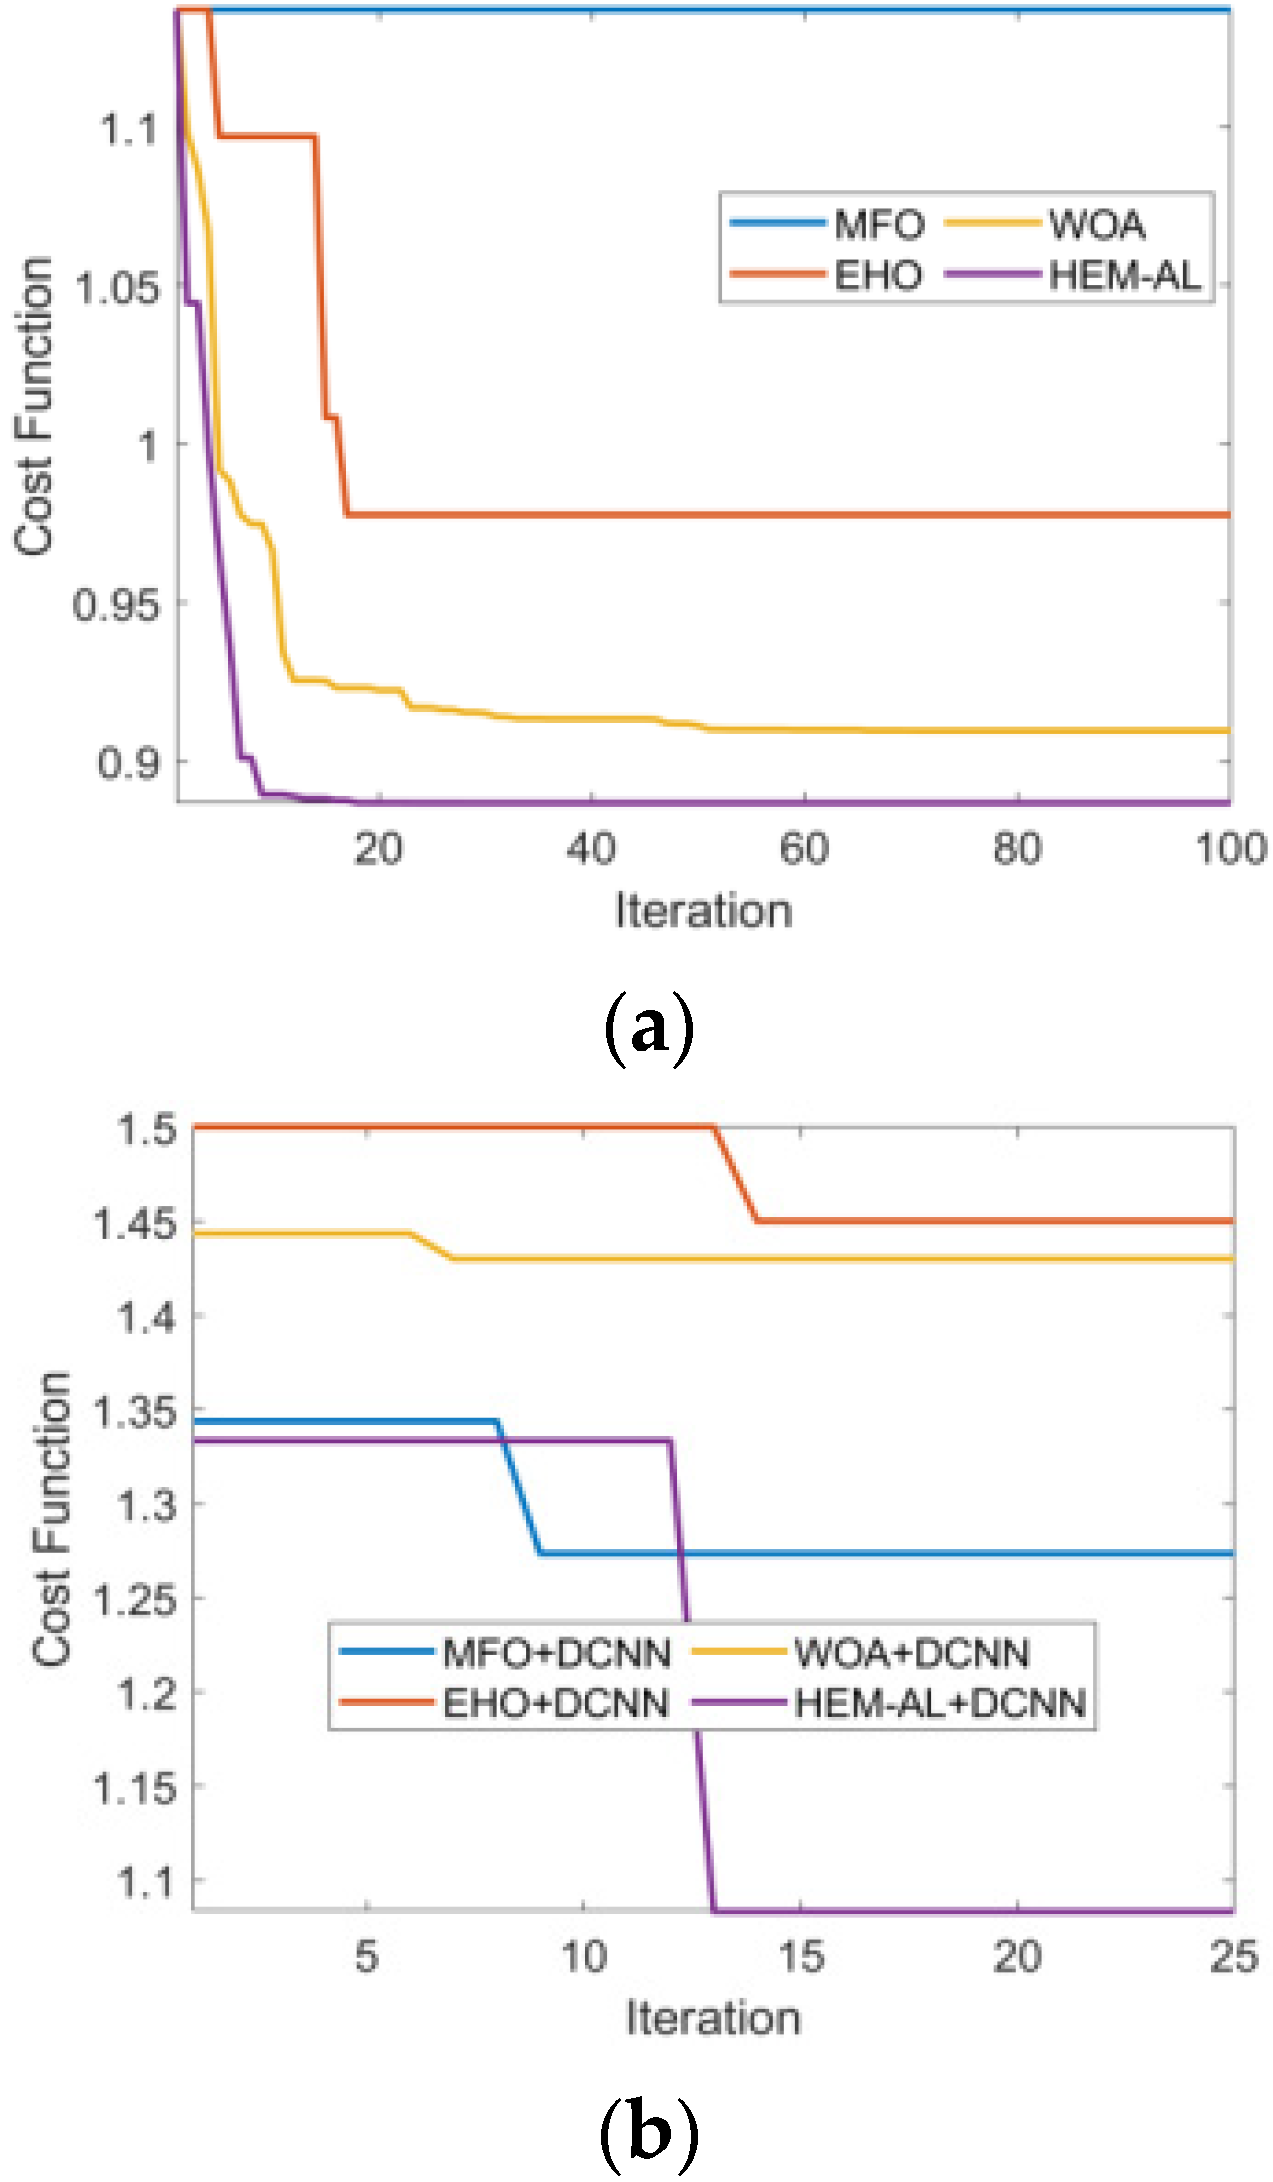
8.4. Convergence Analysis
Figure 7 describes the convergence (cost) analysis of the developed model over traditional optimization schemes regarding cost. Here, analysis was performed for the varied number of iterations that measured 0, 5, 10, 15, 20 and 25. Upon observing the analysis outcomes, the proposed model had attained minimum cost values for all iterations when compared with the existing schemes. As shown in
Figure 7a, the presented model accomplished a lower cost value from the starting iteration to the 100th iteration i.e., until reaching convergence when compared with other optimization methods. Likewise in
Figure 7b, the proposed scheme exhibits little higher value in the starting iterations; however, after the 13th iteration, the suggested approach had attained minimal cost values when compared with all the other models. Furthermore, upon observing the cost function as shown in
Figure 7b, the adopted scheme attained a reduced cost value (1.07), and was 19.16%, 35.51% and 33.64% superior to traditional MFO + DCNN, EHO + DCNN, and WOA + DCNN models, when the number of iterations was 25. Hence, the overall evaluation illustrates the impact of the HEM-AL + DCNN scheme with better results.
9. Conclusions
This paper introduces a new disease diagnosis model, which includes three steps namely, “Energy-efficient clustering, disease diagnosis and alert system”. Initially, energy-efficient clustering was performed, where the optimal centroid was selected based on distance and energy. Further, disease diagnosis was performed that included two phases, namel, “feature extraction and classification”. Here, the statistical and higher-order features were extracted and then classified via Optimized DCNN. To render the classification more precise, the weights of DCNN were optimally tuned by the HEM-AL model. Upon observation of the analysis, the presented HEM-AL + DCNN model achieved accuracy values of 5.56%, 5.56%, 13.33% and 10% greater than MFO + DCNN, EHO + DCNN, WOA + DCNN, and EEPSO + DCNN models for test case 1. Notably, the FPR of the proposed HEM-AL + DCNN method was 60%, 66.67%, 66.67%, and 81.82% superior to traditional methods such as MFO + DCNN, EHO + DCNN, WOA + DCNN, and EEPSO + DCNN models for test case 2. On examining the positive measure precision, the developed approach exposed a higher value over the other schemes, i.e., the adopted model attained a high precision value of 98%, while models such as MFO + DCNN, EHO + DCNN, WOA + DCNN, and EEPSO + DCNN acquired relatively minimal values of 90, 91, 91 and 82, respectively. Thus, from these results, it is evident that the developed HEM-AL + DCNN method is well suited for disease prediction.
Author Contributions
Conceptualization, M.A. and S.S.A.; methodology, M.A.; software, S.S.A.; validation, M.A. and S.S.A.; formal analysis, M.A.; investigation, M.A. and S.S.A.; resources, M.A., and S.S.A.; data curation, S.S.A.; writing—original draft preparation, M.A.; writing—review and editing, S.S.A.; visualization, S.S.A.; supervision, M.A.; project administration, S.S.A.; funding acquisition, M.A. and S.S.A. All authors have read and agreed to the published version of the manuscript.
Funding
This research received no external funding.
Institutional Review Board Statement
Not applicable.
Informed Consent Statement
Not applicable.
Data Availability Statement
Not applicable.
Conflicts of Interest
The authors declare that there is no conflict of interest.
References
- Salahuddin, M.A.; Al-Fuqaha, A.; Guizani, M.; Shuaib, K.; Sallabi, F. Softwarization of Internet of Things Infrastructure for Secure and Smart Healthcare. Computer 2017, 50, 74–79. [Google Scholar] [CrossRef] [Green Version]
- Hossain, M.S.; Muhammad, G. Cloud-Assisted Industrial Internet of Things (IIoT)—Enabled Framework for Health Monitoring. Comput. Netw. 2016, 101, 192–202. [Google Scholar] [CrossRef]
- Prabal, V.; Sandeep, K.S. Cloud-centric IoT based disease diagnosis healthcare framework. J. Parallel Distrib. Comput. 2017, 116, 27–38. [Google Scholar]
- Mahmud, H.; Riazul, S.M.; Farman, A.; Kyung, S.; Ragib, H. An Internet of Things-based health prescription assistant and its security system design. Future Gener. Comput. Syst. 2018, 82, 422–439. [Google Scholar]
- Abawajy, J.H.; Hassan, M.M. Federated Internet of Things and Cloud Computing Pervasive Patient Health Monitoring System. IEEE Commun. Mag. 2017, 55, 48–53. [Google Scholar] [CrossRef]
- Wei, W.; Lei, C.; Qian, Z. Outsourcing high-dimensional healthcare data to cloud with personalized privacy preservation. Comput. Netw. 2015, 88, 136–148. [Google Scholar]
- Kuan, Z.; Xiaohui, L.; Mrinmoy, B.; Rongxing, L.S. PHDA: A priority based health data aggregation with privacy preservation for cloud assisted WBANs. Inf. Sci. 2014, 284, 130–141. [Google Scholar]
- Yan, L.; Changxin, B.; Chandan, K.R. A distributed ensemble approach for mining healthcare data under privacy constraints. Inf. Sci. 2016, 330, 245–259. [Google Scholar]
- Priyan, M.K.S.; Lokesh, P.P. Cloud and IoT based disease prediction and diagnosis system for healthcare using Fuzzy neural classifier. Future Gener. Comput. Syst. 2018, 86, 527–534. [Google Scholar]
- Munish, B.; Sandeep, K.S. A comprehensive health assessment framework to facilitate IoT-assisted smart workouts: A predictive healthcare perspective. Comput. Ind. 2017, 92, 50–66. [Google Scholar]
- Woo, M.W.; Lee, J.; Park, K. A reliable IoT system for Personal Healthcare Devices. Future Gener. Comput. Syst. 2018, 78, 626–640. [Google Scholar] [CrossRef]
- Bahar, F.; Farshad, F.; Victor, C.; Mustafa, B.; Kunal, M. Towards fog-driven IoT eHealth: Promises and challenges of IoT in medicine and healthcare. Future Gener. Comput. Syst. 2018, 78, 659–676. [Google Scholar]
- He, D.; Zeadally, S. An Analysis of RFID Authentication Schemes for Internet of Things in Healthcare Environment Using Elliptic Curve Cryptography. IEEE Internet Things J. 2015, 2, 72–83. [Google Scholar] [CrossRef]
- Ming, T.; Jinglong, Z.; Zhusong, L.; Aniello, C.; Francesco, P. Multi-layer cloud architectural model and ontology-based security service framework for IoT-based smart homes. Future Gener. Comput. Syst. 2018, 78, 1040–1051. [Google Scholar]
- Yi, L.; Yinghui, Z.; Jie, L.; Zhusong, L. Secure and fine-grained access control on e-healthcare records in mobile cloud computing. Future Gener. Comput. Syst. 2018, 78, 1020–1026. [Google Scholar]
- Gunasekaran, M.R.; Varatharajan, D.; Lopez, P.; Malarvizhi, K.; Chandu, T. A new architecture of Internet of Things and big data ecosystem for secured smart healthcare monitoring and alerting system. Future Gener. Comput. Syst. 2018, 82, 375–387. [Google Scholar]
- Mohanty, S.N.; Lydia, E.L.; Elhoseny, M.; Al Otaibi, M.M.G.; Shankar, K. Deep learning with LSTM based distributed data mining model for energy efficient wireless sensor networks. Phys. Commun. 2020, 40, 101097. [Google Scholar] [CrossRef]
- AlSabban, W.H.; Alotaibi, S.S.; Farag, A.T.; Rakha, O.E.; Al Sallab, A.A.; Alotaibi, M. Automatic Categorization of Islamic Jurisprudential Legal Questions using Hierarchical Deep Learning Text Classifier. Int. J. Comput. Sci. Netw. Secur. 2021, 21, 281–291. [Google Scholar]
- Alotaibi, S.S. Human ethnics prediction using facial features and optimized convolutional neural network. Neural Comput. Appl. 2022, 34, 1181–1198. [Google Scholar] [CrossRef]
- Shreshth, T.; Nipam, B.; Rajkumar, B. HealthFog: An ensemble deep learning based Smart Healthcare System for Automatic Diagnosis of Heart Diseases in integrated IoT and fog computing environments. Future Gener. Comput. Syst. 2019, 104, 187–200. [Google Scholar]
- Bharathi, R.; Abirami, T.; Shankar, K. Energy efficient clustering with disease diagnosis model for IoT based sustainable healthcare systems. Sustain. Comput. Inform. Syst. 2020, 28, 100453. [Google Scholar] [CrossRef]
- Akhbarifar, S.; Javadi, H.H.S.; Rahmani, A.M.; Hosseinzadeh, M. A secure remote health monitoring model for early disease diagnosis in cloud-based IoT environment. Pers. Ubiquitous Comput. 2020. [Google Scholar] [CrossRef] [PubMed]
- Arwinder, D.; Ashima, S.; Harpreet, V.; Caroline, E.; Blesson, V.; Sukhpal, S.G. IoTPulse: Machine learning-based enterprise health information system to predict alcohol addiction in Punjab (India) using IoT and fog computing. Enterp. Inf. Syst. 2020. [Google Scholar] [CrossRef]
- Pravin, A.; Jacob, P.; Nagarajan, G. An intelligent and secure healthcare framework for the prediction and prevention of Dengue virus outbreak using fog computing. Health Technol. 2019, 10, 303–311. [Google Scholar] [CrossRef]
- Tuan, N.; GiaImed, B.; DhaouHannu, T. Energy efficient fog-assisted IoT system for monitoring diabetic patients with cardiovascular disease. Future Gener. Comput. Syst. 2018, 93, 198–211. [Google Scholar]
- Sekaran, K.; Rajakumar, R.; Dinesh, K.; Rajkumar, Y.; Latchoumi, T.P.; Kadry, S.; Lim, S. An energy-efficient cluster head selection in wireless sensor network using grey wolf optimization algorithm. Telkomnika 2020, 18, 2822–2833. [Google Scholar] [CrossRef]
- Engineering Statistics Handbook. Available online: https://www.itl.nist.gov/div898/handbook/eda/section3/eda35b.htm#:~:text=Skewness%20is%20a%20measure%20of,relative%20to%20a%20normal%20distribution (accessed on 2 April 2021).
- Pantic, I.; Pantic, S.; Paunovic, J.; Perovic, M. Nuclear entropy, angular second moment, variance and texture correlation of thymus cortical and medullar lymphocytes: Grey level co-occurrence matrix analysis. Anais Acad. Bras. Ciências 2013, 85, 1063–1072. [Google Scholar] [CrossRef] [Green Version]
- Percentile. Available online: https://en.wikipedia.org/wiki/Percentile (accessed on 2 April 2021).
- Jiuxiang, G.; Zhenhua, W.; Jason, K.; Lianyang, M.; Amir, S.; Bing, S.; Ting, L.; Xingxing, W.; Gang, W.; Jianfei, C.; et al. Recent advances in convolutional neural networks. Pattern Recognit. 2018, 77, 354–377. [Google Scholar]
- Nour, M.; Nour, M.; Kim-Kwang, R.C. An Ensemble Intrusion Detection Technique based on proposed Statistical Flow Features for Protecting Network Traffic of Internet of Things. IEEE Internet Things. 2018, 6, 4815–4830. [Google Scholar]
- Gai-Ge, W.; Deb, S.; Coelho, L. Elephant Herding Optimization. In Proceedings of the 3rd International Symposium on Computational and Business Intelligence (ISCBI), Bali, Indonesia, 7–9 December 2015. [Google Scholar] [CrossRef]
- Seyedali, M. Moth-flame optimization algorithm: A novel nature-inspired heuristic paradigm. Knowl. Based Syst. 2015, 89, 228–249. [Google Scholar]
- Renjith, T.; Rangachar, M.J.S. Hybrid Optimization based DBN for Face Recognition using Low-Resolution Images. Multimed. Res. 2018, 1, 33–43. [Google Scholar]
- Devagnanam, J.; Elango, N.M. Optimal Resource Allocation of Cluster using Hybrid Grey Wolf and Cuckoo Search Algorithm in Cloud Computing. J. Netw. Commun. Syst. 2020, 3, 31–40. [Google Scholar]
- Mahammad Shareef, S.K.; Srinivasa, R. A Hybrid Learning Algorithm for Optimal Reactive Power Dispatch under Unbalanced Conditions. J. Comput. Mech. Power Syst. Control 2018, 1, 26–33. [Google Scholar]
- Seyedali, M.; Andrew, L. The Whale Optimization Algorithm. Adv. Eng. Softw. 2016, 95, 51–67. [Google Scholar]
| Publisher’s Note: MDPI stays neutral with regard to jurisdictional claims in published maps and institutional affiliations. |
© 2022 by the authors. Licensee MDPI, Basel, Switzerland. This article is an open access article distributed under the terms and conditions of the Creative Commons Attribution (CC BY) license (https://creativecommons.org/licenses/by/4.0/).


