Article

Digestate-Derived Ammonium Fertilizers and Their Blends as Substitutes to Synthetic Nitrogen Fertilizers

1
RE-SOURCE LAB, Laboratory for BioResource Recovery, Department of Green Chemistry and Technology, Faculty of Bioscience Engineering, Ghent University, Coupure Links 653, 9000 Ghent, Belgium
2
EnviroCORE, Department of Science and Health, Institute of Technology Carlow, Kilkenny Road, R93 V960 Carlow, Ireland
*
Author to whom correspondence should be addressed.
Appl. Sci. 2022, 12(8), 3787; https://doi.org/10.3390/app12083787
Submission received: 13 March 2022 / Revised: 5 April 2022 / Accepted: 6 April 2022 / Published: 8 April 2022
(This article belongs to the Section Environmental Sciences)

Abstract

:
Nutrient recovery from biomass streams generates novel recycling-derived fertilizers (RDFs). The effect of RDFs depends on their nutrient content and variability, which can aid or hinder their use by end-users. Detailed characterization of RDFs can help in evaluating product properties, whereas blending RDFs can optimize their nutrient ratios and reduce nutrient variability. This study assesses ammonium nitrate (AN) from stripping-scrubbing, ammonium water (AW) and concentrate (CaE) from evaporation, and two tailor-made blends (AN + CaE and AW + CaE), for their potential as nitrogen (N) fertilizers in the pot cultivation of lettuce. Parallelly, a soil incubation experiment was conducted to investigate the N release dynamics of the tested RDFs. The RDFs were compared against the commercial calcium ammonium nitrate (CAN) and an unfertilized control. AN and AW fertilization resulted in a similar crop yield and N uptake to the CAN treatment. CaE and blends exhibited poor yield and N uptake, possibly due to the sodium toxicity detected. AN and AW displayed N fertilizer replacement values above 100%, whereas CaE and blends exhibited poor results in the current experiments. The soil incubation experiment showed a positive soil priming effect in AN and AW treatment, as their N release was over 100%. Further research under uncontrolled field conditions utilizing AN and AW for diverse crop types can validate their N replacement potential.

1. Introduction

The use of mineral nitrogen (N) fertilizers in the European Union (EU) agricultural sector remains high, with 10.2 million tons of N consumed in 2018, corresponding to an increase of 1.9% since 2008 [1]. Out of the 174 million tons of ammonia (NH3) synthesized globally on an annual basis [2], more than 85% is used in fertilizers [3]. About 2% of the world’s energy consumption can be accounted for the synthesis of NH3, based on the Haber-Bosch process [4], which is also responsible for about 2.5% of the global fossil-fuel- based carbon dioxide emissions [3].
Emphasis on reducing fossil-fuel dependency and mining of limited natural resources has driven an enhanced attention towards nutrient recovery from biomass streams such as animal manure, household and food waste, and sewage sludge [5,6,7,8,9,10]. The concept of a circular economy deeply highlights the significance of nutrient recovery, with an aim to prevent detrimental environmental effects such as soil salinity, eutrophication of water bodies, accumulation of nitrates in groundwater, heavy metal accumulation in soil, and release of greenhouse gases [11,12]. Commonly, the processing of the above-mentioned biomass streams often commence with anaerobic digestion (AD), followed by myriad nutrient recovery technologies (NRTs), resulting in process-dependent end-products, referred to as recycling-derived fertilizers (RDFs) in the context of this research.
NRTs such as stripping and scrubbing are established in different industrial settings, with its implementation dating back to the 1970s in wastewater treatment [13]. NH3 stripping from the liquid fraction (LF) of digestate is a process involving the transfer of aqueous ammonium (NH4+) to the gaseous NH3 phase, achieved mainly by the adjustment of pH and temperature, among other factors such as air-to-liquid ratio, hydraulic loading rate, etc. [14]. Studies have shown an N separation of 17–33% from the LF of digestate utilizing the stripping-scrubbing technology [15,16]. The end-product of the technology can be ammonium nitrate (AN) or ammonium sulphate, depending on the acid used in the scrubber. Likewise, evaporation can be used to up-concentrate nutrients in the LF of digestate, obtaining an N-rich condensate (ammonium water (AW)), and an NK-rich concentrate (concentrate after evaporation (CaE)). Similar to the principle of stripping-scrubbing, the process of evaporation functions by phase shift of the water-soluble NH4+ towards the gaseous NH3, which is then recovered by condensation as AW. Volatilization of NH3 can be prevented by pH adjustment in the evaporator. Since AW is obtained after evaporation followed by condensation, the RDF is devoid of any free suspended particles, metals, and pathogens. Moreover, since other elements such as phosphorus (P), potassium (K), etc., are not volatilized, AW is a pure N-rich end-product. The current use of AW is limited to industrial applications; however, due to its N-rich characteristic, a valorization pathway in agriculture might be possible.
Being in the developmental stages, there is a scarcity of research on the effects of the above-mentioned RDFs on agronomic performance and soil quality. Previously, these recovered products also lacked legal compliance for use in the market. In tandem with the Circular Economy Action Plan, RDFs from animal manure are now receiving an opportunity to replace synthetically manufactured nutrients, provided that these RDFs have a similar or better overall environmental performance relative to the synthetic fertilizers they aim to replace [17]. Concurrently, EU’s Fertilizing Products Regulation (FPR, 2019/1009) aims to place secondary raw materials and enable recycled fertilizers (e.g., RDFs from digestate processing) access to the EU internal market, so they can compete on the same pedestal as synthetic mineral fertilizers. Both these legislative amendments could give RDFs such as AN and AW, respectively, the much necessary nudge towards influencing an increased market-uptake of these products, provided they exhibit comparable agricultural and environmental performance to their synthetic counterparts. In comparison to raw or primarily-separated biomass, RDFs comprise an up-concentrated nutrient content, i.e., their nutrient availability and content is enhanced, thus improving and increasing their agricultural value [18,19,20,21,22]. A study in the past showed that the certainty of nutrient content of RDFs is a crucial parameter that led to generating the acceptance of these novel products among the farming community [23]. RDFs, in general, are known for their highly variable nutrient composition [22,24,25], making it difficult to apply their correct dosages during fertilization. Unlike the uncertainty of nutrient content of RDFs, synthetic fertilizer composition is known to the farmers [23], which could influence the farmers’ choice and give an upper hand to synthetic fertilizers. Along with uncertain nutrient composition, RDFs obtained from different NRTs might also comprise only a particular nutrient (e.g., AN and AW that contains only N), or contain a mixture of nutrients (e.g., CaE containing N and K), but in insufficient nutrient ratios. An optimal ratio of macronutrients (N, P, and K) is desirable for fertilization, which can be generated by RDF blending. Tailor-made RDF blends might be of interest to achieve desired nutrient compositions, thus reducing the reliance on synthetic fertilizers.
Therefore, this study aimed to determine the potential use of novel RDFs such as AN, AW, CaE, and two tailor-made blends (blend 1: AN + CaE and blend 2: AW + CaE) as substitutes to the synthetic mineral N fertilizer calcium ammonium nitrate (CAN). All the tested RDFs were recovered via NRTs after processing the LF of digestate obtained from AD of different types of biomass such as animal manure/food and other organic wastes. An extensive characterization of the RDFs was performed, and their performance was compared against the synthetic N fertilizer in two experimental set-ups with the aim to:
(i) assess the RDF N dynamics in a soil incubation experiment;
(ii) evaluate the crop performance and N fertilizer replacement value (NFRV) of the RDFs in a plant experiment with lettuce.

2. Materials and Methods

2.1. RDF Sampling, Characterization and Blend Formulation

The AN was obtained from the stripping/scrubbing unit of a pig farm with an AD plant located in Gistel, Belgium. The farm has a capacity of 11,000 fattening pigs with a manure treatment capacity of 60,000 tons y−1. The input for AD treatment included different types of animal manure (65% pig manure, 17% solid fraction (SF) of pig manure, and 9% horse manure) and food waste (9%). The resultant digestate was separated into SF and LF by centrifugation, after which the LF was subjected to NH3 stripping and scrubbing, recovering N in the form of AN. The AW and CaE, both, were collected from an AD plant in Belgium that treats a variety of organic wastes such as wastewater sludge from the agro-food industry, supermarket waste, waste from the biodiesel industry, rejected food products, animal by-products from slaughterhouses, etc. As a technique to recover nutrients from the processed biomass, the company employs the process of evaporation of the LF of digestate that was initially separated by the centrifugation process. Evaporation resulted in two end-products: NH4+ condensate and CaE. The condensate of evaporation passed through an NH3 stripper resulted in AW, whereas the CaE was the residue after evaporation. All the RDFs were collected in air-tight polyethylene sampling bottles of 1 L each. AN and CaE were stored in the refrigerator at a temperature of 4 °C, whereas AW was stored under the fume-hood of the laboratory where the average temperature was between 15–20 °C, according to the instructions from the producer.
The blends formed for this study were formulated to fit the nutrient recommendations of the test crop, lettuce (Lactuca sativa L., cv. Cosmopolia) (200 kg N ha−1, 125 kg P2O5 ha−1 and 240 kg K2O ha−1; personal communication with Inagro vzw). CaE was chosen for blend preparation after analyzing a total of 20 different RDFs (such as digestate, ashes, struvites, composts, etc.). The choice was made based on the consideration that CaE brought about the least amount of P (since Flemish soils are already P-rich), simultaneously fulfilling the K requirements needed as per the nutrient recommendation for lettuce growth. CaE also comprised of negligible heavy metal content in comparison to the other tested RDFs. The blends were assessed by adding them individually into the pots and soil-incubation tubes in the ratio 1:1, rather than actual physical blending. For future research perspectives, it is recommended to produce blends by physically mixing the RDFs to ascertain any potential reactions such as precipitation, foaming, change in pH, etc.

2.1.1. Physicochemical Characterization of RDFs

The determination of dry matter (DM) content of RDFs was conducted by drying them at 105 °C to a constant weight for 48 h and calculating the DM as a percentage of its wet weight. Organic matter (OM) was analyzed only for CaE, since AN and AW are mineral N products. This was conducted by incineration of the oven-dried (at 105 °C) CaE at 550 °C in the muffle furnace (Nabertherm, Lilienthal, Lower Saxony, Germany) for 4 h, and the subsequent loss of mass on ignition was considered as the result. Total and inorganic carbon (C) (also, only for CaE) were analyzed using a CN analyzer (Primacs100, Skalar, The Netherlands) and organic C (OC) was calculated after deducting the inorganic C from the total C. For pH (pH- potassium chloride (KCl), a suspension of CaE was prepared by adding 25 mL of 1 M KCl to 10 g of fresh sample (stirred well and equilibrated for 10 min), after which the pH was measured using a pH meter (Orion Star A211, Thermo Fisher Scientific, Waltham, MA, USA). For the electrical conductivity (EC) analysis of CaE, a water extract was prepared by mixing 10 g of fresh sample in 50 mL of de-mineralized water and shaking the solution for 60 min. The solution was filtered using a Whatman filter paper of pore size 125 mm, and the extracts were analyzed on an EC meter (WTW Tetra Con 96, Xylem Analytics, Weilheim in Oberbayern, Bavaria, Germany). The pH and EC of AN and AW were measured directly using the respective meters. The total N of AW and CaE was determined by Kjeldahl digestion of samples (Gerhardt Vapodest, Königswinter, North Rhine-Westphalia, Germany) followed by distillation using a Kjeltec-1002 distilling unit (Kjeltec, FOSS, Hillerød, Capital (Hovedstaden), Denmark) whereas the total N of AN was determined as a sum of NH4+-N and nitrate-N (NO3-N). The NH4+-N and NO3-N were determined by analyzing extracts prepared in 1M KCl using a continuous flow auto-analyzer (Chemlab System 4, Skalar, Breda, North Brabant, The Netherlands). Since AW and CaE do not contain NO3-N, organic N was calculated as the difference between total and NH4+-N. For AN, the sum of NH4+-N and NO3-N equaled to total N, as AN is 100% a mineral RDF. Total elemental analysis of the RDFs was performed by digesting the products (CaE = 0.3 to 0.4 g; AN and AW = 3 to 4 mL; in 10 mL nitric acid ((HNO3) (65%)) in a closed microwave (CEM MARS 5, Drogenbos, Flemish Brabant, Belgium) (total 60 min; 20 min each spent in three stages: ramping the temperature to 180 °C, holding at 180 °C, and cooling down of the tubes) and analyzing them on the Inductively coupled plasma-Optical emission spectroscopy (ICP-OES) (Vista MPX, Varian, Inc., Palo Alto, CA, USA) to determine other macro- and micronutrients.

2.1.2. Microbiological Characterization of RDFs and the Presence of Pathogens

Microbiological tests were performed on RDFs to investigate their associated microbial loads and the presence of potential pathogens that can give rise to health and safety concerns, particularly Salmonella spp., Escherichia coli, Listeria spp., and Campylobacter spp. The tested RDFs were sent to the Institute of Technology Carlow, Ireland, for analysis of active biological agents. RDFs were stored at 4 °C in air-tight containers before testing. Tests were performed on single batches. Concentrations of mesophilic microorganisms present in the RDFs were estimated by performing aerobic plate counts using the pour-plate technique. RDFs serially diluted in sterile ¼ Strength Ringers solution (Oxoid™) were used to inoculate Plate Count Agar (Neogen®) supplemented with 10 µg mL−1 cycloheximide (ACROS Organics™) and Malt Extract Agar (Neogen®) supplemented with 50 µg mL−1 kanamycin sulphate (Fisher BioReagents™) in triplicate for bacterial and fungal counts, respectively. All agars and diluents were autoclaved at 121 °C, 15 psi to achieve sterilization. Bacterial colony forming units (CFUs) were observed after incubation at 37 °C for 48 h. Fungal CFUs were observed after five days of incubation at 30 °C. Sterile water was used as the control.
RDFs were outsourced to another external accredited laboratory (Agrihealth Laboratory Services, Co., Monaghan, Ireland) to investigate the presence of Salmonella spp., Escherichia coli, Listeria spp., and Campylobacter spp. The detection of Salmonella spp. per 25 g was performed by the selective enrichment technique in a modified semi-solid Rappaport-Vassiliadis agar [26]. Listeria spp. per 25 g of sample was detected by means of an enzyme-linked fluorescence assay using the VIDAS® UP Listeria method [27]. Colony count techniques were employed for the enumeration of Campylobacter spp. [28] and β-glucoronidase-positive Escherichia coli [29] per g mL−1 of RDF sample.

2.2. Soil Sampling and Characterization

The soil used for the study was collected from the surface layer (0 to 30 cm) of an arable field in Wingene, Belgium. This part of Flanders has a predominantly sandy soil, and according to the Belgian soil map, the field’s soil profile is characterized as a Z.c.h. soil type (soil with sandy texture and a moderately poor drainage class with signs of rust deeper than 60 cm and a post-podzol B-horizon) [30]. The field was part of a mixed cattle-extensive vegetable farm, and the crops mainly grown on this farm in 2017 and 2018 were Zea mays (maize) and Solanum tuberosum (early potatoes), respectively. The organic fertilizer mainly used was farmyard manure (with straw at a low N and P content). Italian ryegrass was the catch crop grown mostly in this field.
The soil was sampled before fertilizer application and sowing of the field for an impending trial, approximately 4 months before the start of the first experiment. After air-drying in the greenhouse, the soil was sieved using 2-mm sieves and mixed thoroughly before analyses. The air-dried soil was stored in the greenhouse in plastic bags until the start of the experiment. A sub-sample of the soil was taken, and the soil OC, pH-KCl, EC, and total N were measured. Soil OC was measured in two steps: first, the soil OM was measured using a muffle furnace (Nabertherm, Lilienthal, Lower Saxony, Germany) for 4 h at 550 °C, and secondly, the OC was obtained by dividing the calculated OM by a factor of two [31]. pH-KCl determined the soil potential acidity, and it was measured using a pH meter (Orion Star A211, Thermo Fisher Scientific, Waltham, MA, USA) by adding 25 mL of 1 M KCl to 10 g of air-dried soil and letting it equilibrate for 10 min [32]. For the EC analysis, water extracts of 10 g of air-dried soil were prepared using de-mineralized water (after shaking for 60 min), and these extracts were filtered using a Whatman filter paper (pore size 125 mm). An EC meter (WTW Tetra Con 96, Xylem Analytics, Weilheim in Oberbayern, Bavaria, Germany) was used to determine the conductivity of the extracts. Total N was determined by the Kjeldahl digestion of samples (Gerhardt Vapodest, Königswinter, North Rhine-Westphalia, Germany), followed by distillation using a Kjeltec-1002 distilling unit (Kjeltec, FOSS, Hillerød, Capital (Hovedstaden), Denmark), and total C by the CN analyzer (Primacs100, Skalar, Breda, North Brabant, The Netherlands). NH4+-N and NO3-N [33,34] were extracted in 1 M KCl by mixing 10 g of soil in 50 mL of KCl. These extracts were prepared after 30 min on a rotary shaker, and the supernatant was filtered out using a Whatman filter paper of pore size 125 mm. It was then analyzed using a continuous flow auto-analyzer (Chemlab System 4, Skalar, Breda, North Brabant, The Netherlands). Total elemental analysis of the soil was performed, first by digesting the soil (1 g soil + 2.5 mL demineralized water) in a solution of aqua regia (2.5 mL HNO3 (65%) + 7.5 mL hydrochloric acid (47%)) on a hot plate (150 °C at 100 W for 2 h), then by analyzing the samples for macro- and micronutrients using the ICP-OES (Varian Vista MPX, Palo Alto, CA, USA). Table 1 presents the physicochemical characterization of the soil.

2.3. RDF Assessment in Comparison to Synthetic N Fertilizer

2.3.1. Experiment to Test Soil N Dynamics of RDFs

The RDFs were tested in a soil incubation experiment to determine their N release potential in comparison to the synthetic fertilizer CAN (N = 30%). The air-dried and sieved soil was pre-incubated at 35% water-filled pore space (WFPS). This pre-incubated soil was placed in the dark at 21 °C for one week after covering it with a pin-holed parafilm to prevent the loss of moisture by evaporation. All the products to be tested were mixed with 259 g of pre-incubated soil at a rate of 200 kg N ha−1, which was the same dose of N applied to the soil in the pot cultivation of lettuce. For each treatment with an amendment, a homogenized mixture of soil and product was placed in polyvinyl chloride tubes of 18 cm length and 4.6 cm diameter. For the unamended control, plain soil was placed in the tubes. The soil in the tube was brought to a bulk density of 1.4 g cm−3 by compacting it using a wooden cylindrical block to a height of 10 cm. The moisture content in the soil was adjusted to 50% WFPS to ensure that no denitrification occurred, since WFPS > 60% can cause denitrification [35]. Additionally, the homogenous mixing of the product and soil and the lack of airflow at the soil surface during the incubation will ensure that no NH3 is volatilized during the experimental duration [35,36]. The tubes were covered with a pin-holed gas-permeable parafilm to avoid the loss of moisture by evaporation. The treatments tested were: (i) control (unamended soil); (ii) CAN; (iii) AN; (iv) AW; (v) CaE; (vi) AN + CaE; (vii) AW + CaE. The treatments with the two tailor-made blends were tested by the addition of an individual RDF (ratio of 1:1) to form the blend in the soil, rather than the actual mixing of two products. Hence, tubes containing AN + CaE were considered as blend 1, and those containing AW + CaE were considered as blend 2. Since CAN is in granular form, it was first ground to a fine powder consistency for the ease of homogenization with soil. This powder was then dissolved in demineralized water to reach the desired concentration, and the solution was applied to the soil. In total, 126 tubes (seven treatments × three replicates × six sampling moments) were randomized for their treatments and incubated in the dark at an average temperature of 21 °C for a total experimental duration of 120 days. The moisture content was monitored every fortnight by weighing the tubes, and it was adjusted to 50% WFPS for the tubes where loss was observed. Three replicates of each treatment were sampled on days 20, 40, 61, 82, 100, and 120. The soil from the intact tubes was removed, mixed thoroughly, and 10 g from this mixture was taken to prepare KCl extracts to be analyzed for NH4+-N and NO3-N (described in Section 2.2). The mineral N in the unfertilized control at day zero was determined again to include the effects of drying and re-wetting of soil.

2.3.2. Experiment to Assess Crop Response of RDFs

A pot experiment with lettuce was performed to test the performance of the RDFs relative to the commercial synthetic fertilizer CAN. The experiment was conducted using seedlings of lettuce obtained from Inagro vzw. The seedlings were placed in the growth chamber of the laboratory for 9 days before the commencement of the experiment, under 8 h of artificial light (Brite-grow bio-growth light) of 2000 lux. The watering of seedlings was performed five days before the experiment, where approximately 5 L of water was added uniformly to the entire set of seedlings (conditions of seedlings maintained as per personal communication with Inagro). Soil and sand (river sand) were mixed in 1:1 ratio to be filled into the pots. The sand used in the experiment was rinsed with water thoroughly to eliminate any possible contaminants and air-dried before use. Each pot (height = 18 cm; top diameter = 12.6 cm) contained 1.65 kg of the soil-sand mixture. One day prior to setting up the experiment, 160 mL of demineralized water was added per 1 kg of air-dried soil-sand mixture, in order to ensure homogenous mixing of the medium with the RDFs. First, 1 kg of soil-sand mixture was added directly to each pot. RDFs were added to the remaining 650 g of the soil-sand mixture in a container and thoroughly mixed for homogeneity.
The experimental design comprised treatments with three RDFs, two blends, one synthetic reference, and an unfertilized control, similar to the soil incubation experimental set-up. Each treatment except the unfertilized control was tested at two dosages, i.e., 100% and at 50% recommended NPK dosage, in quadruplicate pots. The material application rates were calculated as per the nutrient requirements for lettuce growth (Table 2). To supplement the growth of crops and ensure an equal application of P and K in all treatments, synthetic fertilization was conducted using triple super phosphate (TSP; 46% P2O5) and potassium sulphate (PAT; 30% K2O, 10% MgO, and 42.5% SO3). An important point to be considered here is the additional application (2.2 times the recommended dosage) of K2O from the treatment with CaE, which was a consequence of satisfying the N requirements of lettuce with this RDF. Hence, to ensure that every treatment received an equal application, additional K2O was added to all other fertilized treatments, accordingly, using PAT. For application in the current pot trial, a very small quantity of the RDFs AN and AW was needed (Table 2) due to their high N content, which necessitated mixing AN and AW, each with demineralized water (to reach the required concentration), thus enabling that a substantial quantity of product (6.25 mL of each product) could be pipetted out and mixed with the soil homogenously.
After fertilization, the seedlings were transplanted into each pot, and an additional 100 mL of demineralized water was added to reach a water holding capacity of 60%. Watering was performed thrice per week or as per loss of moisture, and the position of pots was randomized once every week.

Plant and Soil Analysis after Harvest

After 54 days of growth in the pots, the lettuce was harvested using trimming scissors. The plants were clipped from the shoot above the soil level, and any remnant soil particles were cleaned off the plants by wiping it with tissues. This was followed by the fresh weight (FW) determination. The DM determination was conducted by oven drying the samples at 50 °C for 72 h. The dried material was ground using a mortar and pestle, and these ground samples were used for all further analyses. The total N was analyzed using a CN analyzer (Primacs100 Skalar, Breda, North Brabant, The Netherlands). Macro- and micronutrients such as P, K, and Na (0.2 g sample) were analyzed following the same methodology described in Section 2.3.1. The plant nitrate analysis was performed using ion chromatography (Metrohm, Herisau, Switzerland) from an external certified laboratory (Innolab, Oostkamp, Belgium).
The entire soil from each pot was transferred to a plastic bag, roots removed, mixed thoroughly, and a sub-sample was taken and frozen for mineral N analysis. Moisture content was also determined at this point by drying a sub-sample of the soil at 105 °C for 24 h. The remaining soil was air-dried and sieved using a 1 mm sieve to remove smaller roots. The physicochemical characterization of the soil samples was performed following the same methods as described in Section 2.2.

2.4. Calculations and Statistical Analysis

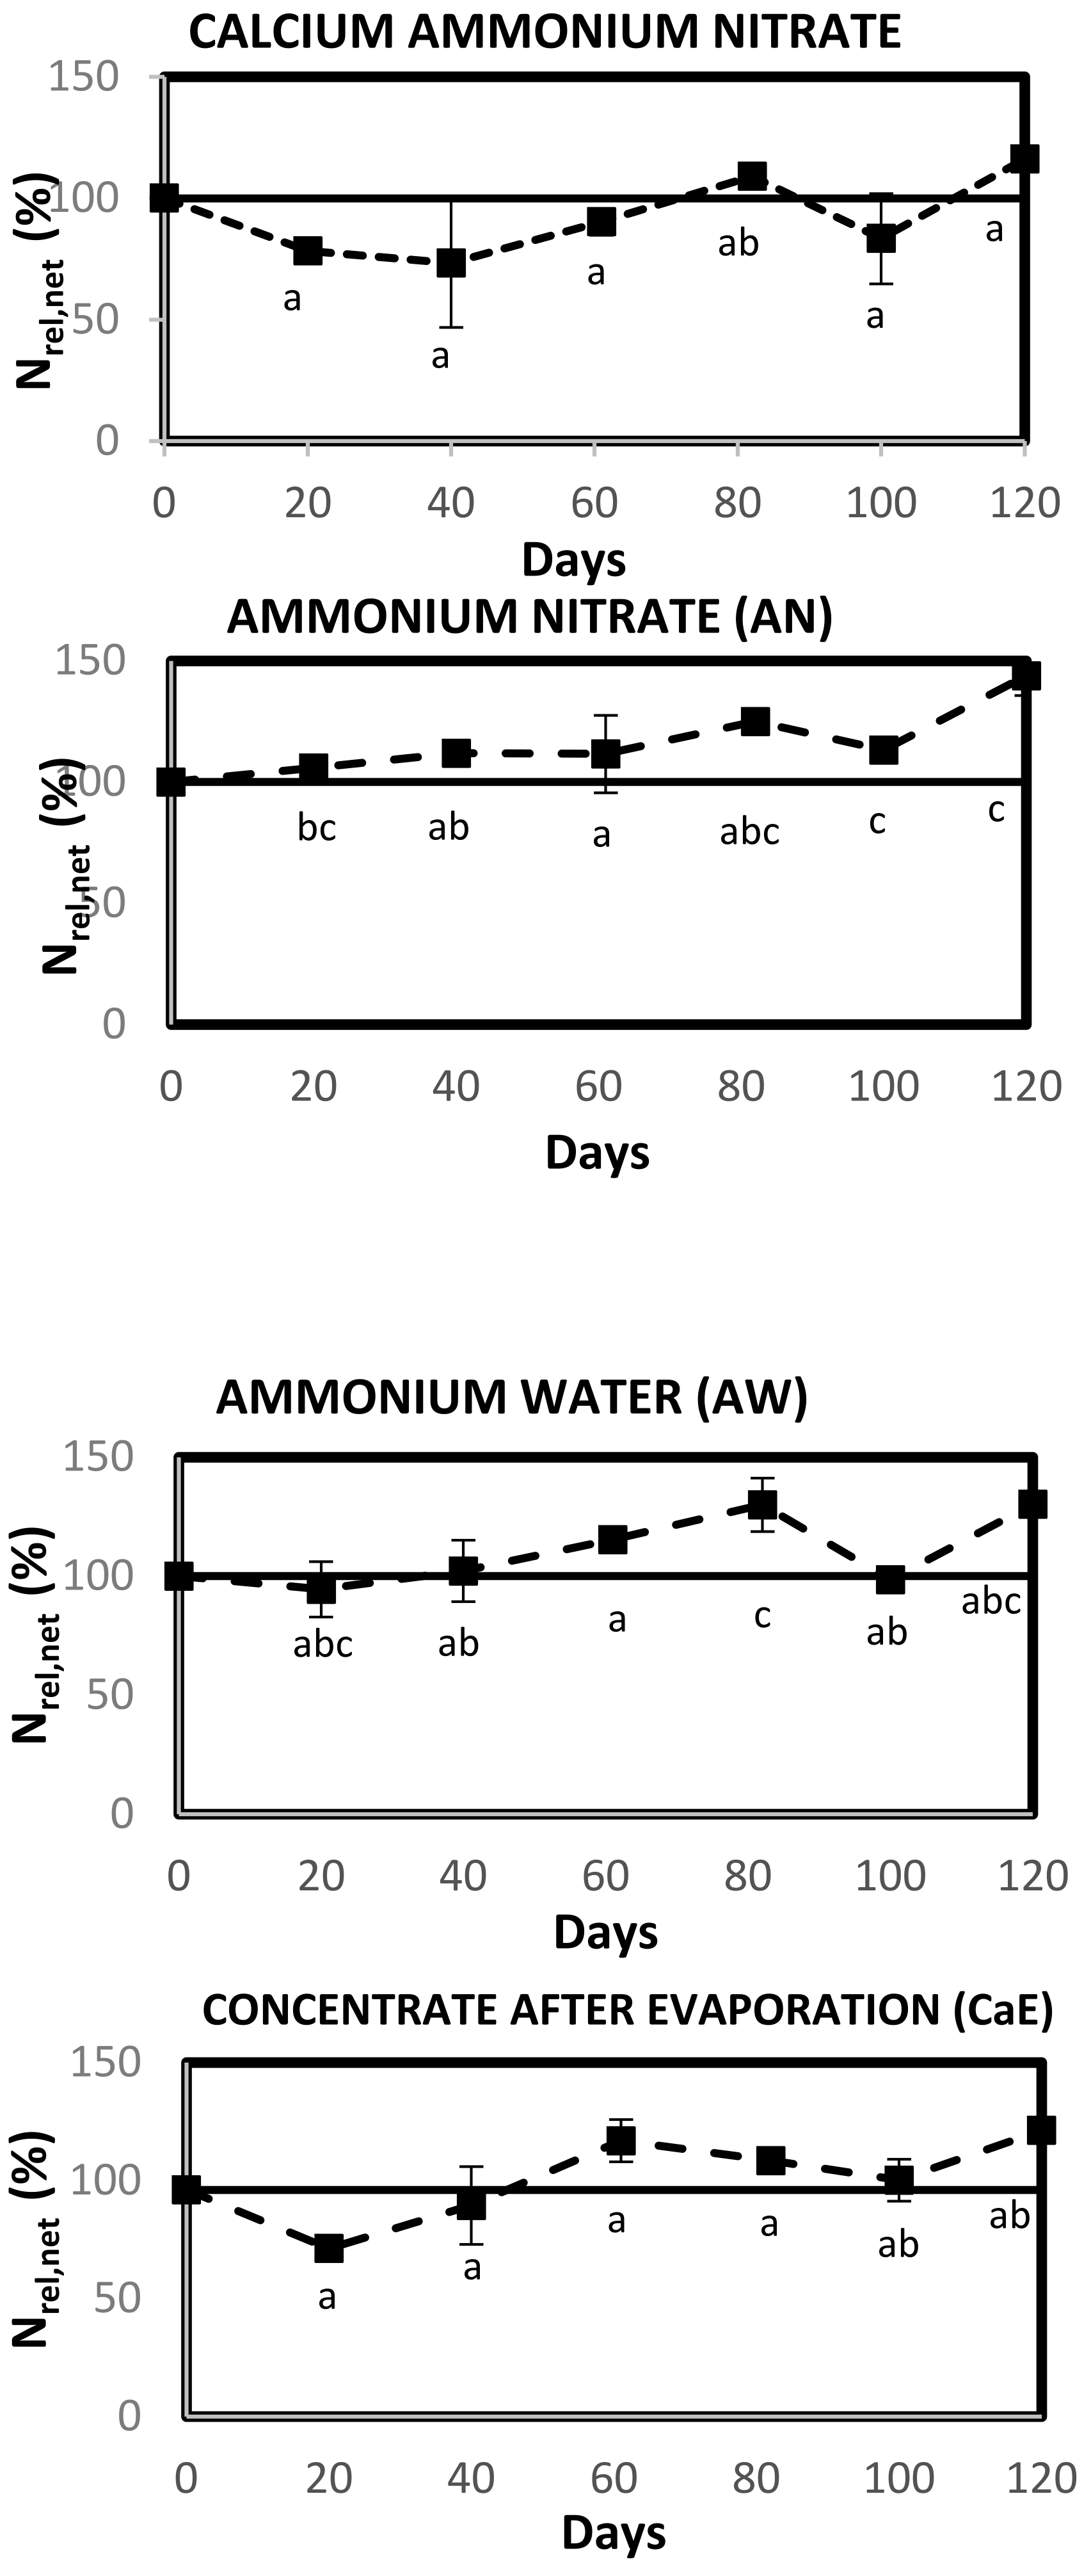
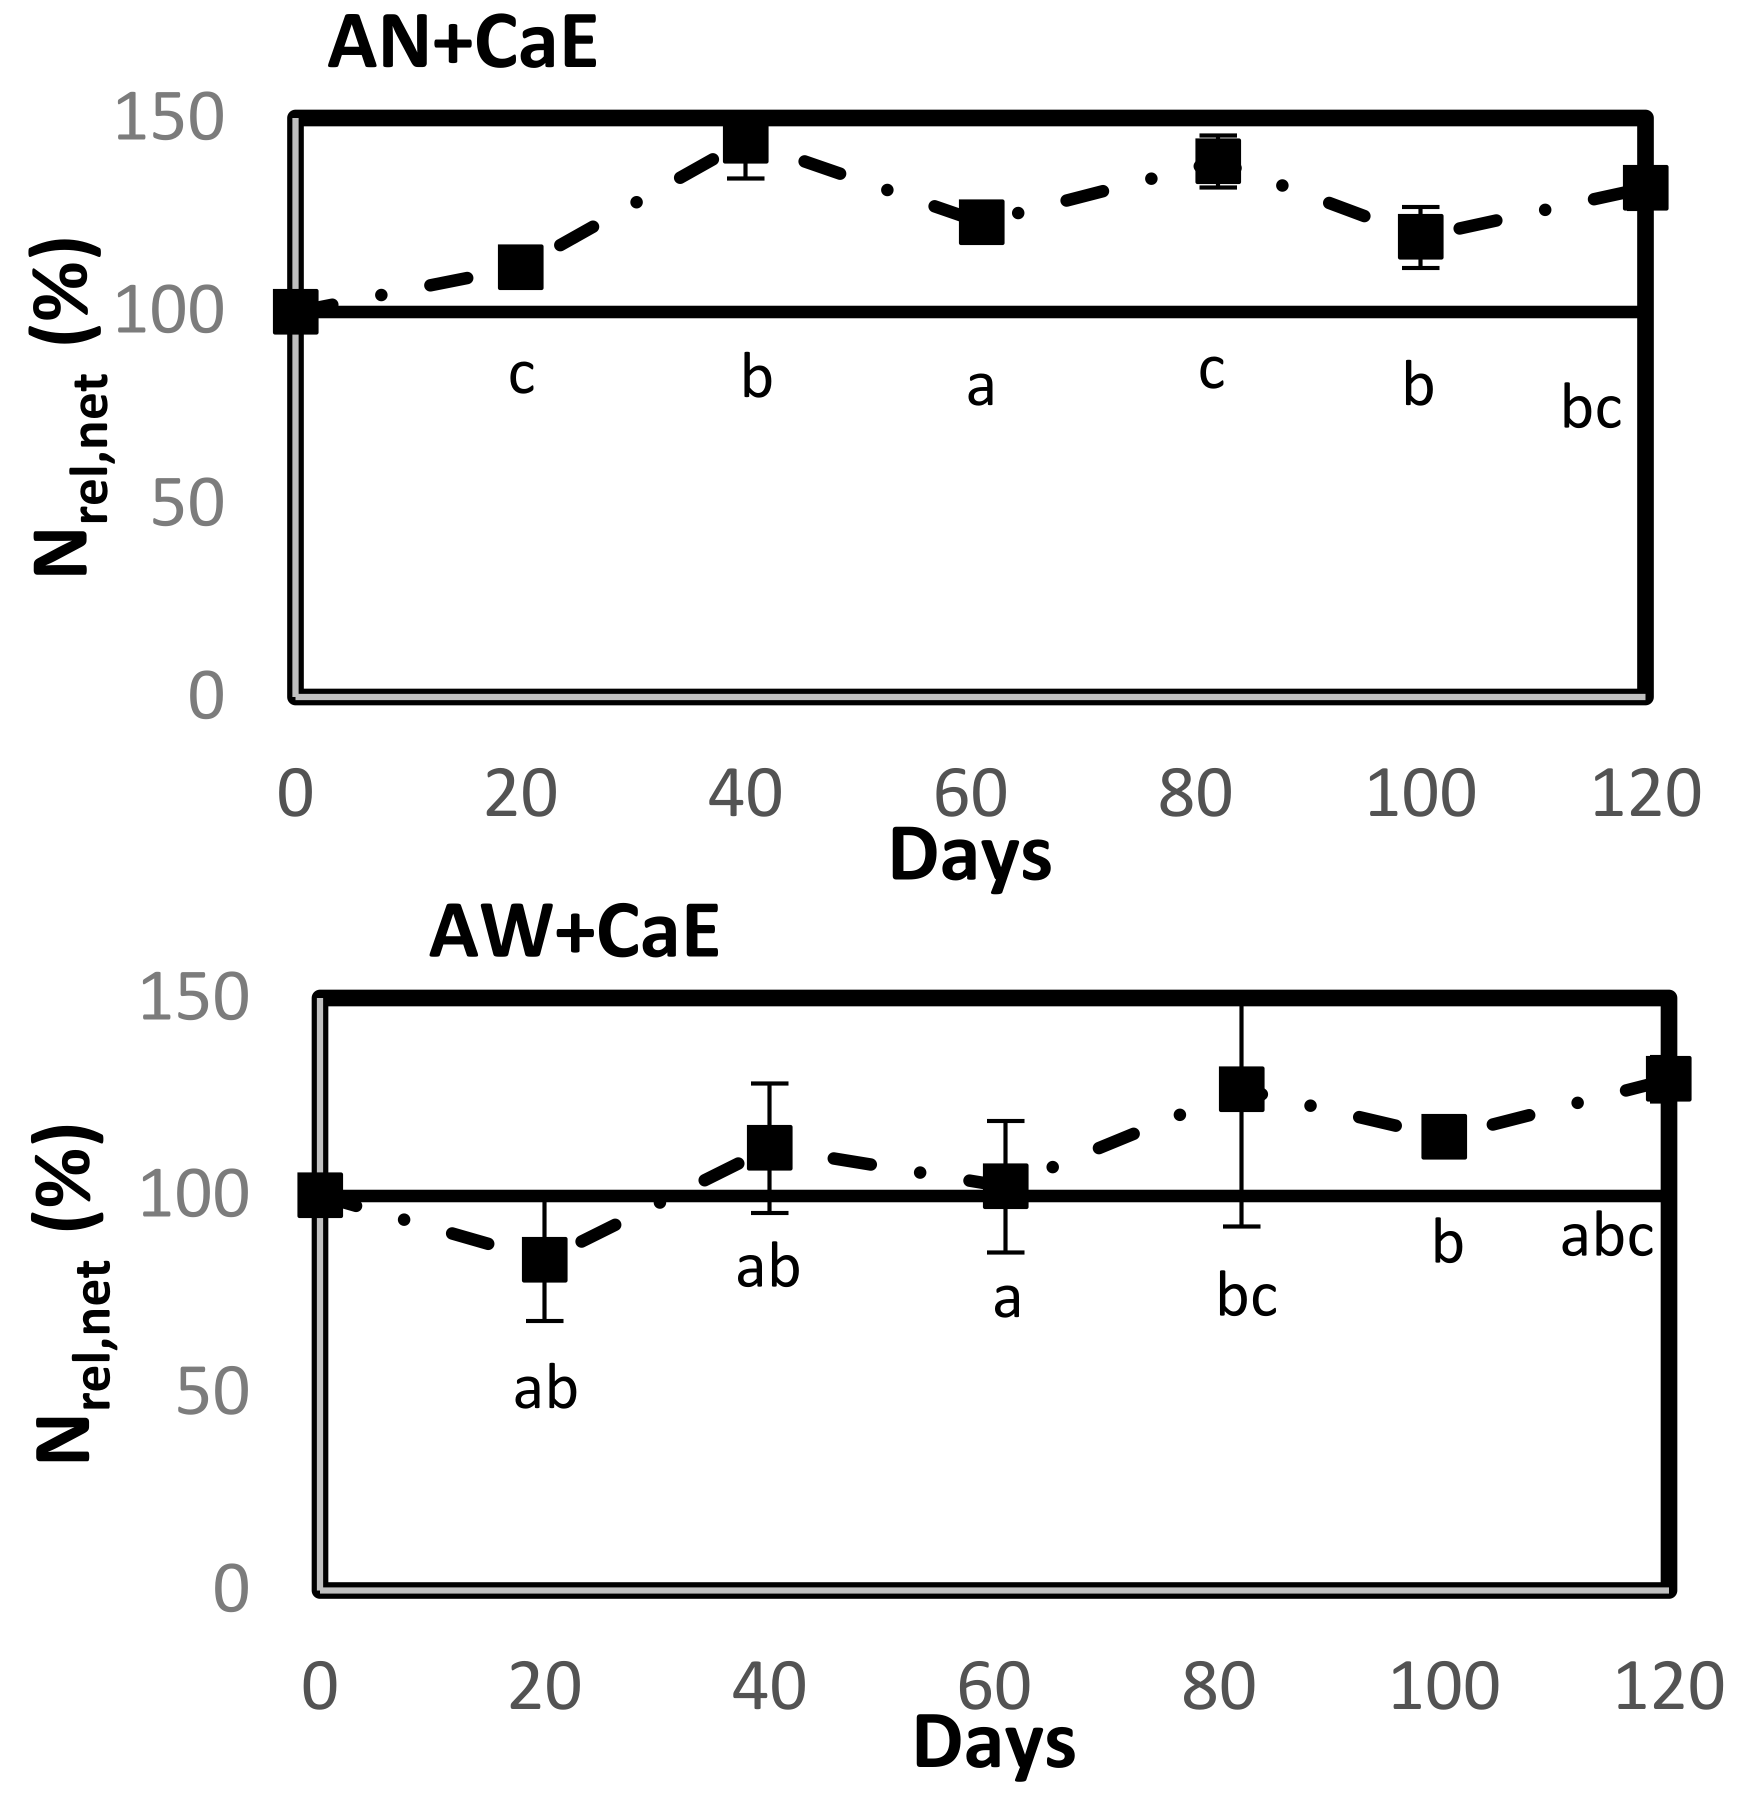
In the soil incubation experiment, net N release and net N mineralization were determined. Net N release (Nrel,net) presented the difference between the mineral N measured in the amended soil (soil treated with fertilizer) from the mineral N measured in the unamended soil (the control). Nrel,net was calculated by the formula [37]:
N rel , net   ( % ) =   ( [ N O 3 N , t r e a t m e n t N O 3 N , c o n t r o l ] ) + [ N H 4 + N , t r e a t m e n t N H 4 + N , c o n t r o l ] N t o t a l   a p p l i e d   ×   100
At t = 0, the Nrel,net (%) equals the product Nmineral/Ntotal ratio × 100.
Net N mineralization (Nmin,net) gave the N mineralized from the organic fraction of the product (expressed as a percentage of the total N in the product) and was calculated by deducting the amount of mineral N present in the product at time zero (t = 0) from the amount of mineral N at time t as [38]:
Nmin,net (t; % total N) = (Nrel,net (t) − Nrel,net (t = 0))
A positive Nmin,net value indicates net N mineralization, and a negative Nmin,net indicates net N immobilization. Statistical analysis was performed using the SPSS statistical software IBM SPSS version 27.0. A parametric one-way ANOVA test was performed to evaluate significant differences in Nrel,net (%) between different tested treatments for each sampling moment, followed by Tukey’s post-hoc test to identify differences between treatments. Normality within and variance between treatments were determined by the Shapiro-Wilk test and Levene’s test, respectively.
The analyses of plant and soil samples from the pot experiment gave insights into various parameters, including fresh and dry yield of the plant, nutrient uptake, apparent N recovery (ANR), and NFRV. The calculation of ANR and NFRV [39,40,41] was conducted as follows:
ANR   ( kg   ha 1 ) =   ( N   u p t a k e   T R E A T M E N T   ( kg   ha 1 ) ) ( N   u p t a k e   C O N T R O L   ( kg   ha 1 ) ) T o t a l   N   a p p l i e d   T R E A T M E N T   ( kg   ha 1 )
NFRV   ( % ) = A N R   R D F A N R   s y n t h e t i c   N   f e r t i l i s e r     ×   100
A non-parametric Mann–Whitney test was performed to observe significant differences in treatments for plant FW, DM, nutrient concentration in plants, ANR and NFRV, and soil parameter analysis, since the data for these results did not meet the assumptions of the parametric one-way ANOVA. The Mann–Whitney was performed to compare each treatment with the unfertilized control and synthetic fertilizer references (p = 0.05).

3. Results

3.1. RDF Characterisation

3.1.1. Physicochemical Parameters

All three RDFs and, subsequently their blends, were N-rich products, of which AN and AW contain only N (8% and 15%, respectively), whereas CaE also contains P and K (0.1% and 1%, respectively) (Table 3). The tested RDFs had a DM content between 13 and 23%. The pH measurements indicated more basic values for AW and for CaE, amounting to 11 and 9.1, respectively. In AN, mineral N was present as both NH4+-N and NO3-N (50% each), whereas, in AW, it was present entirely as NH4+-N. The presence of other macro- and micronutrients was quite low, except for the sodium (Na) content of 15 g kg−1 observed in CaE.

3.1.2. Micro-Biological Parameters

Concentrations of mean total viable bacterial and fungal cells per g ml−1 of RDF products were estimated (Table 4). High levels of bacteria were detected in CaE, as well as in the blends using this RDF (AN + CaE and AW + CaE), while AN and AW contained either none or negligible amounts. Very little or no fungi were present amongst all RDFs with the exception of AN + CaE. The results of the detection and isolation methods revealed an absence of Salmonella spp. or Listeria spp. in any RDF sample when 25 g mL−1 of each were tested. The enumeration of Escherichia coli and Campylobacter spp. showed the presence of <10 CFU per g mL−1 of all samples.

3.2. Soil N Dynamics Assessment

During the initial stage of the incubation experiment, all amended treatments (except AN and AN + CaE) showed immobilization, which was seen from a decreased Nrel,net (Figure 1). Treatments with AN and AN + CaE showed 100% or more Nrel,net since the first sampling moment, while for AW, CaE, and AW + CaE treatments, this was observed from day 40 onwards. The CAN treatment showed transient immobilization for the longest period, i.e., until day 60, after which Nrel,net was observed. For day 120, AN exhibited the highest Nrel,net release amounting to 144 ± 8%, followed by AN + CaE displaying a Nrel,net release of 132 ± 5%. Treatments with AW (130 ± 4%), AW + CaE (129 ± 6%), CaE (121 ± 5%), and CAN (116 ± 4%) exhibited Nrel,net in the stated order, respectively. All the tested RDFs showed an average Nrel,net greater than 100% and displayed a Nrel,net higher than the synthetic CAN on day 120. Significant differences were indicated for each treatment per sampling moment and are presented in Figure 1.
The highest Nmin,net (% of total N) on day 120 was observed in treatment with AN (44 ± 8%), followed by AN + CaE (32 ± 5%), AW (30 ± 4%), AW + CaE (29 ± 6%), CaE (25 ± 5%), and CAN (16 ± 4%). The tested RDFs were almost completely inorganic in nature (i.e., 100% mineral N). CaE contained some organic N, and AN + CaE and AW + CaE contained some negligible amounts of organic N owing to the contribution from CaE. There was no organic N contribution from any other tested treatment.

3.3. Lettuce Growth Experiment

3.3.1. Crop Yield and Nutrient Concentration

Lettuce fertilized with AN100%, AN50%, and AW + CaE50% exhibited significantly higher plant FW (61 ± 2.2 g, 57 ± 3 g and 56 ± 4.4 g, respectively), whereas treatment with CaE100% (32 ± 12 g) showed significantly lower plant FW compared to the unfertilized control (46 ± 4 g) (Table 5). When comparing RDFs at 100% dose with CAN100% (56 ± 6.1 g), it was noticed that CaE100% and AN + CaE100% (32 ± 12 g and 28 ± 22 g, respectively) produced significantly lower plant FW. AN50% and AW + CaE50% showed significantly higher FW than CAN50% (49 ± 1 g). Except for AW + CaE, none of the tested treatments showed any significant difference in yield between the two dosages.
For DM yield, it was observed that, in comparison to the unfertilized control (3 ± 0.53 g), CaE100% and AN + CaE50% (1.4 ± 0.59 g and 1.7 ± 0.48 g, respectively) had significantly lower plant DM. No differences were detected between RDFs and CAN at either dose. Similar to FW, a comparison of the two dosages of each treatment indicated a significant difference in DM only between AW + CaE100% (2.0 ± 0.47 g) and AW + CaE50% (2.9 ± 0.59 g).
As expected, all fertilized treatments (except AW + CaE100%) showed a significantly higher crop total N compared to the unfertilized plants (Table 6). Comparison of RDFs with CAN and between applied dosages yielded no significant differences. No significant differences were observed between the treatments with respect to P and K concentrations.
It was observed that treatments with CaE and AN + CaE at both doses, and AW + CaE100%, demonstrated significantly higher Na content in the plant samples in comparison to the unfertilized control. CaE and AN + CaE, at both doses, also exhibited significantly higher Na content in comparison to the treatment with CAN. Upon comparison of dosages with each other, CaE100% displayed a higher Na content than CaE50%. No other RDFs showed differences between dosages applied.
Finally, all tested treatments, except for AN50%, showed significantly higher nitrate contents in comparison to the unfertilized control. A comparison to CAN and between dosages only showed differences in the case of AW + CaE100%.

3.3.2. ANR and NFRV

The ANR of all fertilized treatments and the NFRV of tested RDFs were evaluated on the basis of N uptake calculated in the plant samples (Table 7). It was observed that the N uptake of CAN and AN, at both doses, and AW100% was significantly higher than that of the unfertilized treatment. CaE and AN + CaE, at both doses, and AW + CaE100% showed no significant differences, but on average, they had a lower N uptake relative to the unfertilized control. Since ANR and NFRV are directly dependent on the N uptake of plants, treatments with the aforementioned RDFs exhibited negative ANR and NFRV values. Hence, statistical analysis was not performed on the negative results. Upon comparison to CAN at both N doses, CaE exhibited a significantly lower N uptake. AN + CaE50% also exhibited a significantly lower N uptake in comparison to CAN50%. A comparison between doses of each RDF showed that AW100% demonstrated a significantly higher N uptake compared to AW50%, but this difference was not reflected in the yield of lettuce. No differences were observed between other tested RDFs and CAN at respective doses, or between the dosages of individual treatments. AN and AW at both doses showed NFRV above 100%. No difference in results between applied dosages were observed. AW + CaE50% showed a high NFRV, albeit, with a very high standard deviation.

3.3.3. Effect of RDFs on Soil Properties

Table 8 presents the results of soil pH-KCl, EC, and total Na content. The pH-KCl of the amended soil samples showed significant differences with the unfertilized soil in some treatments, such as CAN, AW, and CaE at 100% dose and AN + CaE at both doses. No difference between RDFs and CAN at either dose was observed, nor between individual treatment at different doses. The determination of EC, on the other hand, showed some conspicuous differences. Relative to the unfertilized control treatment, CAN100% and AN100%, and CaE, AN + CaE, and AW + CaE at both doses, exhibited significantly higher EC values.

4. Discussion

4.1. RDF Characterization

The AD plant that produces AW and CaE adds AW to the CaE at the end of the process, increasing its total N by 0.3% to market the CaE as an N fertilizer (personal communication with the RDF producer). Hence, the CaE is observed to have a high pH value, and total and mineral N content. The pH of AN was found to be slightly acidic, which can be owed to the addition of HNO3 in the scrubber, but its value was very similar to that of the soil pH. The EC of AN was on the higher end, and both, the pH and EC can vary depending on the HNO3 added to the scrubber during the process [14]. CaE was slightly basic, whereas AW had a higher basicity, thus increasing the possibility of NH3 volatilization from the product. The evaporation process of the NH4+-rich LF of digestate necessitated an increased pH during the process in order to drive the equilibrium from the water-soluble NH4+ towards gaseous NH3, which eventually volatilized during evaporation. The volatilized vapor was later obtained as AW after stripping the NH4+ condensate. The general handling of AW during the study demanded additional care in the form of nose and eye protective gear due to its pungent odor and risk of eye irritation. This could also indicate constraints in the practical use of AW in larger-scale field application and could be one of the hindering aspects in its potential use as an agricultural nutrient. Reduction in NH3 volatilization can alleviate this problem, and exploration towards ascertaining reduction strategies should be conducted. A study in the past investigated the acidification of digestate derivatives to reduce their pH and eventually to lower the NH3 volatilization, and positive results were obtained [42]. In general, the acidification of volatile N fertilizer products has proven to significantly reduce the NH3 volatilization [26,43]. In the USA, where (synthetically produced) aqua NH3 (AW) is used as a popular liquid N fertilizer, the injection of the product is conducted in the soil (in fields) using a shallow nutrient applicator [44]. Similarly, improved approaches should be evaluated in future studies for NH3 volatilization mitigation.
Out of the three tested RDFs, AN and AW contained N entirely in the mineral form, similar to the synthetic CAN. Hence, the Nmin/Ntotal ratio of AN and AW was 1, whereas of CaE it was 0.96. The isolated and concentrated form of N seen in AN and AW can be attributed to the processing involved in their production. The use of HNO3 in the scrubber contributed to the NO3-N of the AN, simultaneously increasing the N content [45]. The European Commission’s Joint Research Centre (JRC) defined a new category of N RDFs termed as RENURE (recovered nitrogen from manure) materials if they fulfill certain criteria in regard to composition. The philosophy behind these RENURE materials is that they reflect upcycled fertilizing products originating from animal manure, which can then cease to be considered as manure and function as synthetic fertilizer substitutes. RDFs, such as AN, obtained from the stripping-scrubbing process are a top-priority RENURE material, that complies with the requisite parameters such as total OC:total N ratio ≤ 3 or a mineral N:total N ratio ≥ 90% [17]. In the case of AW, the evaporation of LF of digestate followed by the NH3 stripping concentrated N in the final product. A characterization result that established significance in this study was the 1.5% Na content detected in CaE, which can be consequential to detrimental growth in salt-sensitive plants. Physiologically, salinity imposes, firstly, a water-deficit resulting from relatively high solute concentrations in the soil, and secondly, it causes ion-specific stresses resulting from altered Na+ (or K+) ratios [46]. AN and AW had negligible Na, similar to that of other nutrients such as P and K. CaE, on the other hand, being the evaporator residue, was comprised of 1% K.
Biomass streams are known to contain pathogens, and several factors influence the survival of pathogens during the treatment processes [47,48,49]. For example, in biogas plants, parameters influencing pathogen survival in AD processes include temperature and time, pH, and the initial number of pathogens, to name a few [50]. The current EU FPR (EU) 2019/1009 as set out by European Parliament outlines the standards for pathogens in fertilizers, stating that Salmonella spp. should be absent per 25 g/25 mL of fertilizer tested, and Escherichia coli or Enterococcaceae should not exceed 1000 CFUs per g mL−1 of fertilizer [51]. The determination of microbial loads revealed that some types of RDFs have high concentrations of bacteria present, particularly those that contain OM or OC, such as CaE, AN + CaE, and AW + CaE. Though bacteria were abundant in these products, tests performed for the detection of the pathogens Salmonella spp. and Listeria spp. confirmed their absence per 25 g or 25 mL of sample material, and enumeration methods employed for pathogens Escherichia coli and Campylobacter spp. exhibited <10 CFUs per 1 g or 1 mL of all RDF samples. With the exception of the blend AN + CaE, viable mesophilic fungal cells were few to non-existent. Results confirmed that the RDF products would conform with the EU FPR 2019/1009 [51], suggesting that these RDF products are safe for application as a substitute to synthetic N fertilizer products. Furthermore, JRC’s RENURE material criteria requirement of <10 CFUs g−1 Escherichia coli was met by AN (Huygens et al., 2020). However, it is important to highlight that RDFs need to be tested immediately after production and on different batches of product for complete confidence due to the loss of microbial viability associated with long storage periods.

4.2. Soil N Dynamics Assessment

The initial stage of incubation exhibited transient immobilization in some treatments, which can be attributed to the soil manipulations such as the drying and rewetting of soil prior to the commencement of the experiment [38,52,53,54,55]. Particularly observed for a longer duration of 60 days in CAN, such transitory immobilization of N in soil has been observed in general in studies conducted in a similar experimental set-up [38,56,57]. Similarities in the Nrel,net pattern were observed between each blend and the corresponding N RDF it comprised.
Despite the complete lack of organic N, soil amended with AN and AW and with the negligible amounts of organic N and soil amended with AN + CaE and AW + CaE, showed N mineralization. The increased mineral N as a result of the transformation of soil organic N was studied due to the addition of N fertilizers in the soil [58,59], called the priming effect. N priming can be defined as an increase or decrease in the amount of native soil N released by microbial mineralization or taken up by plants with a fertilizer addition compared to unamended/unfertilized treatments [60]. A study on the influence of fertilizers on soil biological properties showed that the addition of organic fertilizers stimulated soil biological activities, probably by enriching the soil OM, and the mineral fertilizer-enhanced soil porosity, thus paving the way towards a positive priming effect of the native soil OM [61]. In contrast, another study found that organic fertilizers tend to reduce the mineralization of N from soil OM, but the addition of inorganic fertilizers tended to increase the priming effect [62]. It can be assumed that the mineralization effect seen in the case of treatments amended with mineral RDFs of the type tested in this study, could be due to the positive priming effect induced by these products on the soil, since the tested RDFs were mostly inorganic in nature. Various factors, such as soil and fertilizer type, and environmental factors are thought to affect the native soil N priming dynamics [63,64,65,66,67,68,69]. Hence, soil incubation experiments in differing soil types and environmental conditions should be performed to conclusively claim the positive priming effect demonstrated in the current set-up. Furthermore, it is extremely important to highlight that the testing of N dynamics in this experiment was conducted in the absence of plants, whose presence might affect the N release and mineralization processes quite otherwise. Hence, the significance of testing RDFs in field trials to evaluate their impact on crop yield and potential NO3-N is highly emphasized.

4.3. Crop Response Assessment

Overall, the performance of AN100% and AW at both doses being similar to CAN is attributed to their mineral nature, i.e., 100% of total N in these products is in the plant-available form. The performance of AN50% was observed to be significantly higher than CAN50%. In a previous study conducted on lettuce growth using AN sourced from the same producer, a similar outcome was observed, where the plants fertilized with AN had a significantly higher yield than those treated with CAN [45]. Furthermore, in this study, AW + CaE50% was the only treatment that showed significant differences in FW on the basis of dosage applied, wherein plants with 50% N dose had a significantly higher FW than the ones with 100% N. This result could be explained by the fact that the plants with 50% dosage also received less Na from the CaE content of AW + CaE, thus being subjected to lesser osmotic stress. Although, it is confounding why the same outcome was not seen in the case of AN + CaE50%. Plants treated with CaE (and subsequently the blends, except for AW + CaE50%) demonstrated low N uptake values. Moreover, they also showed significantly higher Na content in comparison with the unfertilized control and CAN. Treatments with blends were included in the experimental set-up to study the effect of optimization of NPK from RDFs for effective crop growth. A past study that attempted a tailor-made blend formulation for tomato growth demonstrated a better yield in treatments utilizing blends [70]. In the current study, similar results could not be replicated due to the impeding characteristic of Na present in CaE. A negative correlation between the N uptake and Na content of plant samples (Pearson correlation = −0.723; p < 0.001) was observed, leading to the hypothesis that the higher Na content (e.g., as symptomatic for salt stress) could have limited the N uptake and hence caused poor growth of the plants. A negative correlation observed between Na content and plant FW (Pearson correlation = −0.796; p < 0.001) further validated this supposition. Other studies reported experiments with wheat and rice, where the presence of Na+ ions impaired the uptake of NH4+ ions to the plant [71,72]. The effect of osmotic stress was seen as a rapid inhibition of the state of the expansion of the young leaves and reduced the stomatal conductance of the mature leaves [73]. Inexplicably, a higher Na content was not observed for AW + CaE50%, which also contained CaE. Hence, the N uptake, and subsequently the FW, were not affected in this treatment.
Since vegetables are considered to be a potential source of nitrate accumulation [74], and the presence of nitrate has been associated in the occurrence of methemoglobinemia, its content in edible plant tissues is an important criterion of vegetable quality [75]. All fertilized treatments showed nitrate content within the prescribed legal limit of 5000 mg kg−1 FW for lettuce grown under cover and harvested in winter between 1 October to 31 March [76].
ANR and NFRV are agri-environmental tools used to determine the fertilizer performance of RDFs [22,39,77]. NFRV is the amount of synthetic fertilizer saved when using a bio-based alternative, while attaining the same crop yield, i.e., it indicates the substitutability of an RDF relative to a synthetic fertilizer. AN and AW at both doses showed NFRV above 100%. A study previously conducted to test the AN obtained from the same producer also demonstrated similar results of NFRV, i.e., above 100% [45]. The distribution of N forms in AN (59% NH4+-N and 41% NO3-N) was almost similar to that of the synthetic CAN (50% NH4+-N and NO3-N each), thus deriving the obtained results. Though the volatility of AW raises some concerns over N losses, the very small quantity of product applied teamed with the fast incorporation of the product into soil, the soil’s buffering characteristic, and the controlled moisture conditions of the experiment caused negligible NH3 volatilization, thus ensuring ANR results comparable to the synthetic fertilizer treatment. Nevertheless, it must be considered while making conclusions that the results show high standard deviations. This was particularly evident in the case of AW + CaE50%. The replicates of this treatment exhibited a non-homogenous N uptake, thus resulting in variable NFRV results within the treatment.
The analysis of soil parameters after harvest gave further insights into the effect of tested RDFs on plant growth. The high pH of AW, as discussed before, could result in its volatilization after application into the medium. Proper fertilizer management techniques can help in reducing N volatility to the environment [78,79], and care must be taken while applying such concentrated volatile N products on field scales. The RDFs AN and AW inherently have high EC values, but due to their higher N content, smaller quantities of the RDFs (882 mg and 468 mg, respectively) were applied in each pot. Hence, no significant impacts on crop growth were observed, but, overall, a negative correlation was detected between the EC of soil and the fresh weight of plants (Pearson Correlation = −0.647; p < 0.001). Research shows that salinity in soil can curb plant growth by creating osmotic stress [80,81,82]. Since lettuce is a salt-sensitive plant [83], the poor yield observed in plants fertilized with CaE and AN + CaE could be a result of osmotic stress, also made apparent by previous correlations. Furthermore, as expected, a positive correlation was discovered between the EC and soil Na content (Pearson Correlation = 0.845; p < 0.001). CaE and the blends have inputs of Na from the product. As seen before, in the case of plant Na concentration and N uptake, the soil treated with these products also shows significant differences with the unfertilized control. CaE100% and both blends at both doses exhibited a significantly higher total Na in the soil in comparison to the CAN at the respective doses. However, stronger conclusions regarding the behavior of these RDFs cannot be made before testing them under field conditions in long-term trials and with diverse crop types.

5. Conclusions

In soil incubation, the N release of AN and AW was not only similar to that of CAN, but it also manifested a positive priming effect on soil treated with these RDFs and their respective blends. The effect of RDFs on lettuce growth indicated a positive fresh yield and nutrient concentration results in the case of AN and AW fertilization, whereas CaE and both blends demonstrated poor performance in comparison to the synthetic N fertilizer CAN. The Na toxicity induced by CaE fertilization led to a low N uptake and, subsequently, a lower yield seen in these treatments. This also impacted the attempt at optimization of NPK by blend formation. The NFRV results exhibited that AN and AW both had high N replaceability potential over the synthetic CAN. Overall, the current study gave a positive insight into RDFs such as AN and AW, while raising further research questions about CaE and opening new investigative avenues into its suitability towards less (salt; Na) sensitive plants. Emphasis is laid on the full field validation of the tested RDFs in diverse environmental conditions and, soil and crop types for data collation on their agronomic properties and environmental impacts. In parallel, the development of fertilizer management strategies for novel products such as CaE and AW needs to be set in motion in order to generate market for these products.

Author Contributions

The conceptualization of the experiment was conducted by A.S., I.S. and E.M.; A.S. and D.R. conducted the experiments, analyzed the data, and wrote the manuscript. I.S., K.G., D.N.D. and E.M. reviewed the manuscript and supervised the work. E.M. approved the manuscript for publication. All authors have read and agreed to the published version of the manuscript.

Funding

This research was conducted as a part of the ReNu2Farm project and funded by INTERREG NORTH-WEST EUROPE PROGRAMME, grant number NWE601.

Institutional Review Board Statement

Not applicable.

Informed Consent Statement

Not applicable.

Data Availability Statement

Not applicable.

Conflicts of Interest

The authors declare no conflict of interest. The funders had no role in the design of the study; in the collection, analyses, or interpretation of data; in the writing of the manuscript; in the decision to publish the results.

References

  1. EC. Agri-Environmental Indicator—Mineral Fertiliser Consumption. Available online: https://ec.europa.eu/eurostat/statistics-explained/index.php?title=Agri-environmental_indicator_-_mineral_fertiliser_consumption#Analysis_at_EU_level (accessed on 29 September 2021).
  2. USGS. Mineral Commodity Summaries 2014; U.S. Geological Survey: Reston, VA, USA, 2014; p. 196.
  3. Pfromm, P.H. Towards sustainable agriculture: Fossil-free ammonia. J. Renew. Sustain. Energy 2017, 9, 034702. [Google Scholar] [CrossRef] [Green Version]
  4. Sutton, M.A.; Bleeker, A.; Howard, C.; Erisman, J.; Abrol, Y.; Bekunda, M.; Datta, A.; Davidson, E.; De Vries, W.; Oenema, O. Our Nutrient World. The Challenge to Produce More Food & Energy with Less Pollution; Centre for Ecology & Hydrology: Edinburgh, UK, 2013. [Google Scholar]
  5. González-Ponce, R.; López-De-Sá, E.G.; Plaza, C. Lettuce response to phosphorus fertilization with struvite recovered from municipal wastewater. HortScience 2009, 44, 426–430. [Google Scholar] [CrossRef] [Green Version]
  6. Leogrande, R.; Lopedota, O.; Fiore, A.; Vitti, C.; Ventrella, D.; Montemurro, F. Previous crops and organic fertilizers in lettuce: Effects on yields and soil properties. J. Plant Nutr. 2013, 36, 1945–1962. [Google Scholar] [CrossRef]
  7. Vaish, B.; Singh, P.; Singh, P.K.; Singh, R.P. Biomethanation potential of Algal biomass. In Algal Biofuels; Springer: Cham, Switzerland, 2017; pp. 331–346. [Google Scholar] [CrossRef]
  8. Vaish, B.; Srivastava, V.; Singh, P.K.; Singh, P.; Singh, R.P. Energy and nutrient recovery from agro-wastes: Rethinking their potential possibilities. Environ. Eng. Res. 2020, 25, 623–637. [Google Scholar] [CrossRef]
  9. Vaneeckhaute, C.; Meers, E.; Michels, E.; Buysse, J.; Tack, F.M.G. Ecological and economic benefits of the application of bio-based mineral fertilizers in modern agriculture. Biomass Bioenergy 2013, 49, 239–248. [Google Scholar] [CrossRef] [Green Version]
  10. Wang, J.; Zhao, J.; Deng, S.; Sun, T.; Du, Y.; Li, K.; Xu, Y. Integrated assessment for solar-assisted carbon capture and storage power plant by adopting resilience thinking on energy system. J. Clean. Prod. 2019, 208, 1009–1021. [Google Scholar] [CrossRef]
  11. Basosi, R.; Spinelli, D.; Fierro, A.; Jez, S. Mineral nitrogen fertilizers: Environmental impact of production and use. In Fertilizers: Components, Uses in Agriculture and Environmental Impacts; Lopez-Valdez, F., Fernandez-Luquenos, F., Eds.; Nova Science Publishers: New York, NY, USA, 2014; pp. 3–44. [Google Scholar]
  12. Savci, S. Investigation of effect of chemical fertilizers on environment. Apcbee Procedia 2012, 1, 287–292. [Google Scholar] [CrossRef] [Green Version]
  13. Adams, C.E. Removing nitrogen from waste water. Environ. Sci. Technol. 1973, 7, 696–701. [Google Scholar] [CrossRef]
  14. Brienza, C.; Sigurnjak, I.; Michels, E.; Meers, E. Ammonia stripping and scrubbing for mineral nitrogen recovery. In Biorefinery of Inorganics: Recovering Mineral Nutrients from Biomass and Organic Waste; Meers, E., Velthof, G., Michels, E., Rietra, R., Eds.; John and Wiley and Sons: Hoboken, NJ, USA, 2020; pp. 95–106. [Google Scholar]
  15. Bolzonella, D.; Fatone, F.; Gottardo, M.; Frison, N. Nutrients recovery from anaerobic digestate of agro-waste: Techno-economic assessment of full scale applications. J. Environ. Manag. 2018, 216, 111–119. [Google Scholar] [CrossRef]
  16. Ledda, C.; Schievano, A.; Salati, S.; Adani, F. Nitrogen and water recovery from animal slurries by a new integrated ultrafiltration, reverse osmosis and cold stripping process: A case study. Water Res. 2013, 47, 6157–6166. [Google Scholar] [CrossRef]
  17. Huygens, D.; Orveillon, G.; Lugato, E.; Tavazzi, S.; Comero, S.; Jones, A.; Gawlik, B.; Saveyn, H. Technical Proposals for the Safe Use of Processed Manure above the Threshold Established for Nitrate Vulnerable Zones by the Nitrates Directive (91/676/EEC); EUR 30363 EN; Publications Office of the European Union: Luxembourg, 2020; ISBN 978-92-76-21539-4. [Google Scholar] [CrossRef]
  18. Buckwell, A.; Nadeu, E. Nutrient Recovery and Reuse (NRR) in European Agriculture: A Review of the Issues, Opportunities, and Actions; RISE Foundation: Brussels, Belgium, 2016. [Google Scholar]
  19. Burton, C. The potential contribution of separation technologies to the management of livestock manure. Livest. Sci. 2007, 112, 208–216. [Google Scholar] [CrossRef]
  20. Case, S.; Oelofse, M.; Hou, Y.; Oenema, O.; Jensen, L. Farmer perceptions and use of organic waste products as fertilizers–A survey study of potential benefits and barriers. Agric. Syst. 2017, 151, 84–95. [Google Scholar] [CrossRef]
  21. Dalgaard, T.; Hansen, B.; Hasler, B.; Hertel, O.; Hutchings, N.J.; Jacobsen, B.H.; Jensen, L.S.; Kronvang, B.; Olesen, J.E.; Schjørring, J.K. Policies for agricultural nitrogen management—trends, challenges and prospects for improved efficiency in Denmark. Environ. Res. Lett. 2014, 9, 115002. [Google Scholar] [CrossRef]
  22. Sigurnjak, I. Animal Manure Derivatives as Alternatives for Synthetic Nitrogen Fertilizers; Ghent University: Ghent, Belgium, 2017. [Google Scholar]
  23. Tur-Cardona, J.; Bonnichsen, O.; Speelman, S.; Verspecht, A.; Carpentier, L.; Debruyne, L.; Marchand, F.; Jacobsen, B.H.; Buysse, J. Farmers’ reasons to accept bio-based fertilizers: A choice experiment in seven different European countries. J. Clean. Prod. 2018, 197, 406–416. [Google Scholar] [CrossRef]
  24. European Commission. Summary Note on Biogas Status and Trends in EU; European Commission: Brussels, Belgium, 2014. [Google Scholar]
  25. Galvez, A.; Sinicco, T.; Cayuela, M.; Mingorance, M.; Fornasier, F.; Mondini, C. Short term effects of bioenergy by-products on soil C and N dynamics, nutrient availability and biochemical properties. Agric. Ecosyst. Environ. 2012, 160, 3–14. [Google Scholar] [CrossRef]
  26. Stevens, R.; Laughlin, R.; O’Bric, C.; Carton, O.; Lenehan, J. The efficiency of the nitrogen in cattle slurry acidified with nitric acid for grass production. J. Agric. Sci. 1997, 129, 335–342. [Google Scholar] [CrossRef]
  27. EN-ISO6579-1; Microbiology of Food and Animal Feeding Stuffs—Protocol for the Validation of Alternative Methods. International Organization for Standardization: Geneva, Switzerland, 2003.
  28. ISO10272-1; Microbiology of the Food Chain—Horizontal Method for Detection and Enumeration of Campylobacter spp.—Part 1: Detection Method. International Organization for Standardization: Geneva, Switzerland, 2017.
  29. ISO 16649-2:2001; Microbiology of Food and Animal Feeding Stuffs—Horizontal Method for the Enumeration of Beta-Glucuronidase-Positive Escherichia coli—Part 2: Colony-Count Technique at 44 Degree C Using 5-Bromo-4-chloro-3-indolyl-beta-d-glucuronide. International Organization for Standardization: Geneva, Switzerland, 2001.
  30. Van Ranst, E.; Sys, C. Eenduidige legende voor de digitale bodemkaart van Vlaanderen (Schaal 1: 20,000). Univ. Ghent Lab. Voor Bodemkd. Krijgslaan 2000, 281, S8. [Google Scholar]
  31. Sleutel, S.; De Neve, S.; Singier, B.; Hofman, G. Quantification of organic carbon in soils: A comparison of methodologies and assessment of the carbon content of organic matter. Commun. Soil Sci. Plant Anal. 2007, 38, 2647–2657. [Google Scholar] [CrossRef]
  32. Ranst, E.V.; Verloo, M.; Demeyer, A.; Pauwels, J. Manual for the Soil Chemistry and Fertility Laboratory: Analytical Methods for Soils and Plants Equipment, and Management of Consumables; Ghent University: Ghent, Belgium, 1999. [Google Scholar]
  33. ISO13395:1996; Water quality—Determination of nitrite nitrogen and nitrate nitrogen and the sum of both by flow analysis (CFA and FIA) and spectrometric detection. International Organization for Standardization: Geneva, Switzerland, 1996; p. 18.
  34. ISO11732:1997; Water quality—Determination of ammonium nitrogen by flow analysis (CFA and FIA) and spectrometric detection. International Organization for Standardization: Geneva, Switzerland, 1997; p. 17.
  35. D’haene, K.; Moreels, E.; De Neve, S.; Chaves Daguilar, B.; Boeckx, P.; Hofman, G.; Van Cleemput, O. Soil properties influencing the denitrification potential of Flemish agricultural soils. Biol. Fertil. Soils 2003, 38, 358–366. [Google Scholar] [CrossRef]
  36. Alburquerque, J.A.; De La Fuente, C.; Bernal, M.P. Chemical properties of anaerobic digestates affecting C and N dynamics in amended soils. Agric. Ecosyst. Environ. 2012, 160, 15–22. [Google Scholar] [CrossRef]
  37. De Neve, S.; Hofman, G. Modelling N mineralization of vegetable crop residues during laboratory incubations. Soil Biol. Biochem. 1996, 28, 1451–1457. [Google Scholar] [CrossRef]
  38. Sigurnjak, I.; De Waele, J.; Michels, E.; Tack, F.; Meers, E.; De Neve, S. Nitrogen release and mineralization potential of derivatives from nutrient recovery processes as substitutes for fossil fuel-based nitrogen fertilizers. Soil Use Manag. 2017, 33, 437–446. [Google Scholar] [CrossRef]
  39. Cavalli, D.; Cabassi, G.; Borrelli, L.; Geromel, G.; Bechini, L.; Degano, L.; Gallina, P.M. Nitrogen fertilizer replacement value of undigested liquid cattle manure and digestates. Eur. J. Agron. 2016, 73, 34–41. [Google Scholar] [CrossRef]
  40. Schröder, J.; De Visser, W.; Assinck, F.; Velthof, G. Effects of short-term nitrogen supply from livestock manures and cover crops on silage maize production and nitrate leaching. Soil Use Manag. 2013, 29, 151–160. [Google Scholar] [CrossRef]
  41. Tampio, E.; Salo, T.; Rintala, J. Agronomic characteristics of five different urban waste digestates. J. Environ. Manag. 2016, 169, 293–302. [Google Scholar] [CrossRef]
  42. Pantelopoulos, A.; Magid, J.; Jensen, L.S.; Fangueiro, D. Nutrient uptake efficiency in ryegrass fertilized with dried digestate solids as affected by acidification and drying temperature. Plant Soil 2017, 421, 401–416. [Google Scholar] [CrossRef]
  43. Stevens, R.; Laughlin, R.; Frost, J. Effect of acidification with sulphuric acid on the volatilization of ammonia from cow and pig slurries. J. Agric. Sci. 1989, 113, 389–395. [Google Scholar] [CrossRef]
  44. Kovács, P.; Van Scoyoc, G.E.; Doerge, T.A.; Camberato, J.J.; Vyn, T.J. Anhydrous ammonia timing and rate effects on maize nitrogen use efficiencies. Agron. J. 2015, 107, 1205–1214. [Google Scholar] [CrossRef]
  45. Sigurnjak, I.; Brienza, C.; Snauwaert, E.; De Dobbelaere, A.; De Mey, J.; Vaneeckhaute, C.; Michels, E.; Schoumans, O.; Adani, F.; Meers, E. Production and performance of bio-based mineral fertilizers from agricultural waste using ammonia (stripping-) scrubbing technology. Waste Manag. 2019, 89, 265–274. [Google Scholar] [CrossRef]
  46. Cheeseman, J.M. Mechanisms of salinity tolerance in plants. Plant Physiol. 1988, 87, 547–550. [Google Scholar] [CrossRef] [Green Version]
  47. Arthurson, V. Proper sanitization of sewage sludge: A critical issue for a sustainable society. Appl. Environ. Microbiol. 2008, 74, 5267–5275. [Google Scholar] [CrossRef] [PubMed] [Green Version]
  48. Costa, A.G.C.; Gardoni, D.; Zaninelli, M.; Tambone, F.; Sala, V.; Guarino, M. The effect of anaerobic digestion and storage on indicator microorganisms in swine and dairy manure. Environ. Sci. Pollut. Res. 2017, 24, 24135–24146. [Google Scholar] [CrossRef] [PubMed]
  49. Gerba, C.P.; Tamimi, A.H.; Pettigrew, C.; Weisbrod, A.V.; Rajagopalan, V. Sources of microbial pathogens in municipal solid waste landfills in the United States of America. Waste Manag. Res. 2011, 29, 781–790. [Google Scholar] [CrossRef] [PubMed]
  50. Sahlström, L. A review of survival of pathogenic bacteria in organic waste used in biogas plants. Bioresour. Technol. 2003, 87, 161–166. [Google Scholar] [CrossRef]
  51. European Commission. Regulation (EU) 2019/1009 of the European parliament and of the council of 5 June 2019—Laying down rules on the making available on the market of EU fertilising products and amending Regulations (EC) No 1069/2009 and (EC) No 1107/2009 and repealing Regulation (EC) No 2003/2003. Off. J. Eur. Union 2019, 170, 1–114. [Google Scholar]
  52. De Neve, S.; Hartmann, R.; Hofman, G. Temperature effects on N mineralization: Changes in soil solution composition and determination of temperature coefficients by TDR. Eur. J. Soil Sci. 2003, 54, 49–62. [Google Scholar] [CrossRef]
  53. Fierer, N.; Schimel, J.; Holden, P. Influence of drying–rewetting frequency on soil bacterial community structure. Microb. Ecol. 2003, 45, 63–71. [Google Scholar] [CrossRef]
  54. Fierer, N.; Schimel, J.P. Effects of drying–rewetting frequency on soil carbon and nitrogen transformations. Soil Biol. Biochem. 2002, 34, 777–787. [Google Scholar] [CrossRef]
  55. Patel, K.F.; Myers-Pigg, A.; Bond-Lamberty, B.; Fansler, S.J.; Norris, C.G.; McKever, S.A.; Zheng, J.; Rod, K.A.; Bailey, V.L. Soil carbon dynamics during drying vs. rewetting: Importance of antecedent moisture conditions. Soil Biol. Biochem. 2021, 156, 108165. [Google Scholar] [CrossRef]
  56. Luo, H.; Robles-Aguilar, A.A.; Sigurnjak, I.; Michels, E.; Meers, E. Assessing nitrogen availability in biobased fertilizers: Effect of vegetation on mineralization patterns. Agriculture 2021, 11, 870. [Google Scholar] [CrossRef]
  57. Sørensen, P.; Amato, M. Remineralisation and residual effects of N after application of pig slurry to soil. Eur. J. Agron. 2002, 16, 81–95. [Google Scholar] [CrossRef]
  58. Kuzyakov, Y.; Domanski, G. Carbon input by plants into the soil. Review. J. Plant Nutr. Soil Sci. 2000, 163, 421–431. [Google Scholar] [CrossRef]
  59. Kuzyakov, Y.; Friedel, J.K.; Stahr, K. Review of mechanisms and quantification of priming effects. Soil Biol. Biochem. 2000, 32, 1485–1498. [Google Scholar] [CrossRef]
  60. Jenkinson, D.; Fox, R.; Rayner, J. Interactions between fertilizer nitrogen and soil nitrogen—The so-called ‘priming’effect. J. Soil Sci. 1985, 36, 425–444. [Google Scholar] [CrossRef]
  61. Marinari, S.; Masciandaro, G.; Ceccanti, B.; Grego, S. Influence of organic and mineral fertilizers on soil biological and physical properties. Bioresour. Technol. 2000, 72, 9–17. [Google Scholar] [CrossRef]
  62. Liu, X.-J.A.; van Groenigen, K.J.; Dijkstra, P.; Hungate, B.A. Increased plant uptake of native soil nitrogen following fertilizer addition–not a priming effect? Appl. Soil Ecol. 2017, 114, 105–110. [Google Scholar] [CrossRef]
  63. Ghaley, B.B.; Høgh-Jensen, H.; Christiansen, J.L. Recovery of nitrogen fertilizer by traditional and improved rice cultivars in the Bhutan Highlands. Plant Soil 2010, 332, 233–246. [Google Scholar] [CrossRef]
  64. Glendining, M.; Poulton, P.; Powlson, D.; Jenkinson, D. Fate of 15 N-labelled fertilizer applied to spring barley grown on soils of contrasting nutrient status. Plant Soil 1997, 195, 83–98. [Google Scholar] [CrossRef]
  65. Hgaza, V.; Diby, L.; Oberson, A.; Tschannen, A.; Tie, B.T.; Sangakkara, U.; Aké, S.; Frossard, E. Nitrogen use by yam as affected by mineral fertilizer application. Agron. J. 2012, 104, 1558–1568. [Google Scholar] [CrossRef]
  66. Liu, X.-J.A.; Sun, J.; Mau, R.L.; Finley, B.K.; Compson, Z.G.; Van Gestel, N.; Brown, J.R.; Schwartz, E.; Dijkstra, P.; Hungate, B.A. Labile carbon input determines the direction and magnitude of the priming effect. Appl. Soil Ecol. 2017, 109, 7–13. [Google Scholar] [CrossRef] [Green Version]
  67. Recous, S.; Machet, J.; Mary, B. The fate of labelled 15 N urea and ammonium nitrate applied to a winter wheat crop. Plant Soil 1988, 112, 215–224. [Google Scholar] [CrossRef]
  68. Rowlings, D.W.; Scheer, C.; Liu, S.; Grace, P.R. Annual nitrogen dynamics and urea fertilizer recoveries from a dairy pasture using 15N; effect of nitrification inhibitor DMPP and reduced application rates. Agric. Ecosyst. Environ. 2016, 216, 216–225. [Google Scholar] [CrossRef]
  69. Westerman, R.; Kurtz, L.T. Priming effect of 15N-labeled fertilizers on soil nitrogen in field experiments. Soil Sci. Soc. Am. J. 1973, 37, 725–727. [Google Scholar] [CrossRef]
  70. Shamsuddin, S.; Suhaini, A.M.; Baharulrazi, N.; Hashim, H.; Yunus, N.A. Effect of Tailor-made fertiliser and medium on the growth rate and yield of Solanum Lycopersicum. Chem. Eng. 2020, 78, 13–18. [Google Scholar]
  71. Mahajan, T.; Sonar, K. Effect of NaCl and Na2SO4 on dry matter accumulation and uptake of N, P and K by wheat. J. Maharashtra Agric. Univ. 1980, 5, 110–112. [Google Scholar]
  72. Palfi, G. The effect of sodium salts on the nitrogen, phosphorus, potassium, sodium and amino acid content of rice shoots. Plant Soil 1965, 22, 127–135. [Google Scholar] [CrossRef]
  73. Bartha, C.; Fodorpataki, L.; Székely, G.; Popescu, O. Physiological diversity of lettuce cultivars exposed to salinity stress. Contrib. Bot. 2010, 45, 47–56. [Google Scholar]
  74. Zhong, W.; Hu, C.; Wang, M. Nitrate and nitrite in vegetables from north China: Content and intake. Food Addit. Contam. 2002, 19, 1125–1129. [Google Scholar] [CrossRef]
  75. Demšar, J.; Osvald, J.e.; Vodnik, D. The effect of light-dependent application of nitrate on the growth of aeroponically grown lettuce (Lactuca sativa L.). J. Am. Soc. Hortic. Sci. 2004, 129, 570–575. [Google Scholar] [CrossRef] [Green Version]
  76. European Commission. Commission Regulation (EU) No. 1258/2011 Amending Regulation (EC) No. 1881/2006 as Regards Maximum Levels for Nitrates in Foodstuffs; European Commission: Brussels, Belgium, 2011. [Google Scholar]
  77. Schröder, J. Revisiting the agronomic benefits of manure: A correct assessment and exploitation of its fertilizer value spares the environment. Bioresour. Technol. 2005, 96, 253–261. [Google Scholar] [CrossRef]
  78. Dari, B.; Rogers, C.W.; Wlash, O.S. Understanding Factors Controlling Ammonia Volatilization from Fertilizer Nitrogen Applications; University of Idaho: Moscow, ID, USA, 2019. [Google Scholar]
  79. Jones, C.; Brown, B.D.; Engel, R.; Horneck, D.; Olson-Rutz, K. Management to Minimize Bitrogen Fertilizer Volatilization; Montana State University Extensio: Bozeman, MT, USA, 2020. [Google Scholar]
  80. Allakhverdiev, S.I.; Sakamoto, A.; Nishiyama, Y.; Inaba, M.; Murata, N. Ionic and osmotic effects of NaCl-induced inactivation of photosystems I and II in Synechococcus sp. Plant Physiol. 2000, 123, 1047–1056. [Google Scholar] [CrossRef] [PubMed] [Green Version]
  81. Gupta, B.; Huang, B. Mechanism of Salinity Tolerance in Plants: Physiological, Biochemical, and Molecular Characterization. Int. J. Genom. 2014, 2014, 701596. [Google Scholar] [CrossRef] [PubMed]
  82. Parida, A.K.; Das, A.B. Salt tolerance and salinity effects on plants: A review. Ecotoxicol. Environ. Saf. 2005, 60, 324–349. [Google Scholar] [CrossRef] [PubMed]
  83. Grieve, C.M.; Grattan, S.R.; Maas, E.V. Plant salt tolerance. ASCE Man. Rep. Eng. Pract. 2012, 71, 405–459. [Google Scholar]
Figure 1. Net N release (Nrel,net (%)) relative to the N input of added materials in a 120-day incubation experiment. The value plotted at t = 0 for treatments indicates the percentage of mineral N in the applied material and is presented as a straight line through the experimental duration. Net N mineralization is indicated by the values plotted above this line, and net N immobilization is indicated by values below the line. Standard deviation is indicated by the error bars (n = 3). Lower cases indicate significant differences between treatments at each sampling point (Tukey’s test (p < 0.05)).
Applsci 12 03787 g001aApplsci 12 03787 g001b
Table 1. Physicochemical characterization of air-dried soil.
pH-KClEC (µS cm−1)OM (%)OC (%)Total N (g kg−1)NH4+-N (mg kg−1)NO3-N (mg kg−1)Total P (g kg−1)Total K (g kg−1)Total S (g kg−1)Total Cu (mg kg−1)Total Zn (mg kg−1)
5.8552.61.31.118671.11.00.1750117
EC: electrical conductivity; OM: organic matter; OC: organic carbon.
Table 2. Application rates of products (g pot−1) and macronutrients (mg pot−1) in the pots as per recommended nutrient dosage.
TreatmentsProduct Application (g pot−1)Nutrients Applied (mg pot−1)
CANTSPPATANAWCaENtotalP2O5K2O
Control000000000
CAN100%0.240.100.64---7345192
CAN50%0.120.050.32---36.522.596
AN100%-0.100.640.88--7345192
AN50%-0.050.320.44--36.522.596
AW100%-0.100.64-0.47-7345192
AW50%-0.050.32-0.24-36.522.596
CaE100%-0.02---15.747345192
CaE50%-0.01---7.8736.522.596
AN + CaE100%-0.060.320.44-7.877345192
AN + CaE50%-0.030.160.22-3.936.522.596
AW + CaE100%-0.060.32-0.237.877345192
AW + CaE50%-0.030.16-0.123.936.522.596
CAN: calcium ammonium nitrate; AN: ammonium nitrate; AW: ammonium water; CaE: concentrate after evaporation. Sub-scripts 100% and 50% indicate the dosage of recommended NPK applied to each fertilized treatment.
Table 3. The physicochemical characterization of tested products presented on a fresh weight basis. The pH and EC (of CaE), dry matter, organic matter, mineral N (NH4+-N and NO3-N), and total P, K, and Na results presented as mean ± standard deviation (n = 2).
ParameterTested Products
Ammonium NitrateAmmonium WaterConcentrate after Evaporation
pH-KCl5.7119.1 ± 0.01
Electrical conductivity (mS cm−1)30331292 ± 2.1
Dry matter (%)23 ± 0.05n.d.13 ± 0.11
Organic matter (% of dry matter)n.a.n.a.62 ± 0.90
Organic C (g kg−1)n.a.n.a.31
Total N (g kg−1)821554.6
NH4+-N (g kg−1)48 ± 2.6155 ± 04.4 ± 0.3
NO3-N (g kg−1)34 ± 0.76<0.002<0.002
Organic N (g kg−1)n.a.n.a.0.2
Nmin/Ntotal110.96
C/Ntotaln.a.n.a.6.7
C/Norganicn.a.n.a.155
Norganic/Ntotaln.a.n.a.0.04
Total P (g kg−1)<0.00038<0.000381.0 ± 0.04
Total K (g kg−1)<0.01<0.002310 ± 0.40
Total Na (g kg−1)0.02 ± 0<0.001715 ± 0.54
n.a.: not applicable; n.d.: not determined.
Table 4. Total viable bacterial and fungal mean colony forming units (CFUs) (n = 3) per g or mL of each product and their corresponding standard deviations resulting from total plate counts.
Tested ProductBacterial CFUs/g or mLFungal CFUs/g or mL
Control (sterile water)none detectednone detected
Ammonium nitrate (AN)0.6 ± 0.9 × 101none detected
Ammonium water (AW)none detectednone detected
Concentrate after evaporation (CaE)3.1 ± 9.9 × 1054.0 ± 0.8 × 101
AN + CaE9.3 ± 2.1 × 1051.3 ± 4.1 × 10²
AW + CaE6.8 ± 4.8 × 1058.0 ± 1.7 × 101
Table 5. Mean plant fresh weight (FW; g pot−1) and dry matter (DM; g pot−1) of tested treatments with standard deviation (n = 4).
TreatmentPlant FW (g pot−1)Plant DM (g pot−1)
Control46 ± 3.83.0 ± 0.53
CAN100%56 ± 6.12.6 ± 0.42
CAN50%49 ± 1.02.7 ± 0.47
AN100%61 ± 2.2 *2.7 ± 0.34
AN50%57 ± 3.0 */***2.6 ± 0.17
AW100%53 ± 7.82.7 ± 0.39
AW50%48 ± 142.6 ± 0.69
CaE100%32 ± 12 */**1.4 ± 0.59 *
CaE50%39 ± 121.9 ± 0.68
AN + CaE100%28 ± 22 **1.6 ± 0.99
AN + CaE50%39 ± 121.7 ± 0.48 *
AW + CaE100%40 ± 142.0 ± 0.47
AW + CaE50%56 ± 4.4 */***2.9 ± 0.54
CAN: calcium ammonium nitrate; AN: ammonium nitrate; AW: ammonium water; CaE: concentrate after evaporation. The non-parametric Mann–Whitney test was performed (p = 0.05), and significant differences are indicated by asterisk(s) (*). *: indicates significant differences of unfertilized control with all tested treatments. **: indicates significant differences of CAN100% with RDFs100%. ***: indicates significant differences of CAN50% with RDFs at 50% dose. Differences between dosages of same treatment are not indicated in the table.
Table 6. Average and standard deviation values of total macro-nutrient (P, K, and Na) and nitrate content (g kg−1) in lettuce on dry matter (DM) basis (n = 4).
TreatmentN (g kg−1)P (g kg−1)K (g kg−1)Na (g kg−1)Nitrate (mg kg−1)
Control28 ± 4.44.3 ± 0.6490 ± 2115 ± 2.4133 ± 48
CAN100%42 ± 5.1 *5.1± 0.47124 ± 1314 ± 1.2479 ± 67 *
CAN50%37 ± 5.7 *4.5 ± 0.26113 ± 1315 ± 1.2440 ± 162 *
AN100%42 ± 7.5 *4.9 ± 0.43124 ± 8.113 ± 1.1577 ± 280 *
AN50%41 ± 5.9 *4.7 ± 0.33121 ± 1214 ± 1.9484 ± 237
AW100%44 ± 3.6 *4.4 ± 0.09123 ± 1112 ± 1.2580 ± 200 *
AW50%38 ± 7.4 *4.7 ± 0.78107 ± 1414 ± 1.3508 ± 283 *
CaE100%42 ± 3.9 *5.1 ± 0.83103 ± 1940 ± 7.1 */**330 ± 87 *
CaE50%39 ± 5.8 *5.2 ± 0.85109 ± 1725 ± 4.7 */***380 ± 216 *
AN + CaE100%42 ± 9.4 *4.6 ± 0.1598 ± 1724 ± 4.9 */**797 ± 476 *
AN + CaE50%43± 7.0 *5.0 ± 0.44121 ± 1322 ± 3.1 */***464 ± 202 *
AW + CaE100%41 ± 8.44.7 ± 0.21105 ± 1423 ± 3.5 */**713 ± 60 */**
AW + CaE50%38± 6.0 *4.8 ± 0.62107 ± 1318 ± 1.9264 ± 66 *
CAN: calcium ammonium nitrate; AN: ammonium nitrate; AW: ammonium water; CaE: concentrate after evaporation. The non-parametric Mann–Whitney test was performed (p = 0.05), and significant differences are indicated by asterisk(s) (*). *: indicates significant differences of control with all tested treatments. **: indicates significant differences of CAN100% with RDFs at 100% dose. ***: indicates significant differences of CAN50% with RDFs at 50% dose. Differences between dosages of same treatment are not indicated in the table.
Table 7. Mean ± standard deviation of apparent nitrogen recovery (ANR) for all fertilized treatments, and the nitrogen fertilizer replacement value (NFRV) of the tested products (n = 4).
TreatmentN Uptake (g pot−1)ANRNFRV (%)
Control0.081 ± 0.01--
CAN100%0.11 ± 0.01 *0.36 ± 0.11-
CAN50%0.10 ± 0.0 *0.43 ± 0.12-
AN100%0.11 ± 0.01 *0.42 ± 0.14116 ± 39
AN50%0.10 ± 0.01 *0.63 ± 0.33147 ± 78
AW100%0.12 ± 0.01 *0.51 ± 0.14140 ± 39
AW50%0.10 ± 0.010.43 ± 0.36101 ± 84
CaE100%0.058 ± 0.02 **−0.31 ± 0.29n.a.
CaE50%0.071 ± 0.01 ***−0.27 ± 0.40n.a
AN + CaE100%0.068 ± 0.04−0.19 ± 0.60n.a
AN + CaE50%0.072 ± 0.02 ***−0.26 ± 0.43n.a
AW + CaE100%0.080 ± 0.02−0.02 ± 0.29n.a
AW + CaE50%0.11 ± 0.020.77 ± 0.68181 ± 160
CAN: calcium ammonium nitrate; AN: ammonium nitrate; AW: ammonium water; CaE: concentrate after evaporation. n.a.: not applicable. The non-parametric Mann–Whitney test was performed (p = 0.05), and significant differences are indicated by asterisk (*). *: indicates significant differences of control with all tested treatments. **: indicates significant differences of CAN100% with RDFs at 100% dose. ***: indicates significant differences of CAN50% with RDFs at 50% dose. Differences between dosages of same treatment are not indicated in the table.
Table 8. Mean ± standard deviation of pH-KCl, electrical conductivity (EC), and total Na content in soil samples on a dry matter basis after lettuce harvest (n = 4).
TreatmentpH-KClEC (µS cm−1)Total Na (g kg−1)
Control7.3 ± 0.03126 ± 150.21 ± 0.01
CAN100%7.4 ± 0.03 *190 ± 25 *0.22 ± 0.02
CAN50%7.4 ± 0.04162 ± 170.22 ± 0.03
AN100%7.4 ± 0.05172 ± 3.4 *0.22 ± 0.01
AN50%7.3 ± 0.04139 ± 3.90.20 ± 0.01
AW100%7.4 ± 0.04 *158 ± 260.20 ± 0.02
AW50%7.4 ± 0.08159 ± 470.22 ± 0.02
CaE100%7.4 ± 0.04 *243 ± 21 *0.30 ± 0.03 */**
CaE50%7.4 ± 0.03228 ± 67 *0.29 ± 0.05 *
AN + CaE100%7.4 ± 0.06 *302 ± 54 */**0.33 ± 0.03 */**
AN + CaE50%7.4 ± 0.02 *242 ± 20 */***0.32 ± 0.02 */***
AW + CaE100%7.5 ± 0.06 *218 ± 22 */**0.30 ± 0.03 */**
AW + CaE50%7.4 ± 0.02198 ± 60 */***0.26 ± 0.01 */***
CAN: calcium ammonium nitrate; AN: ammonium nitrate; AW: ammonium water; CaE: concentrate after evaporation. The non-parametric Mann–Whitney test was performed (p = 0.05). *: indicates significant differences of control with all tested treatments. **: indicates significant differences of CAN100% with RDFs at 100% dose. ***: indicates significant differences of CAN50% with RDFs at 50% dose.
Publisher’s Note: MDPI stays neutral with regard to jurisdictional claims in published maps and institutional affiliations.

