1. Possible Risks to Pipelines from Geomagnetic Variations
Space weather is a serious threat to the regular functioning of satellite and ground-based technological systems. One of the most significant space weather hazards is an electric geomagnetically induced current (GIC) in grounded low-resistance industrial structures—power transmission lines and pipelines. GICs are excited by abrupt changes in the geomagnetic field, i.e., large dB/dt. The most severe geomagnetic disturbances and GICs induced by them in technological systems are observed at auroral latitudes.
The actual driver of GIC is the variations in the geoelectric (telluric) field. Modern energy and pipeline systems are large networks with a complex topology that cover vast areas of the Earth’s surface, the local geoelectric properties of which can vary by up to five orders of magnitude. The electric conductivity of the Earth’s interior ranges from ~10−5–10−4 S/m in crystalline silicate rocks up to ~3 S/m in the ocean. However, it is not easy to obtain direct information about geoelectric fields. While variations in the geomagnetic field are monitored by a worldwide network of magnetometers, there are very few regular observations of telluric electric fields. Although the calculation of telluric fields and currents from geomagnetic data is feasible, it requires not only a sufficiently dense network of magnetometers, but also the availability of adequate information on the distribution of electrical conductivity in the Earth.
The information about the geoelectric structure of the Earth’s interior is scarce. For North America, this information was provided by a continental-scale magnetotelluric (MT) sounding project—EarthScope [
1]. Within the framework of this project, an MT survey was carried out on a grid with a distance of 70–100 km between temporary sites, and the corresponding impedance tensors were estimated using these MT data. The impedances of the EarthScope project were further used in [
2] for the estimation of the geoelectric field response to a uniform sinusoidally varying geomagnetic field. In a similar way, an array of MT impedance measurements in Alberta (Canada) was used to map the spatial structure of the geoelectric field resulting from a magnetic storm [
3].
After the Quebec energy blackout of 1989, it was found that space weather not only creates a giant natural plasma laboratory, but also poses a serious threat to the uninterrupted functioning of space- and ground-based technological systems. Nowadays, research is being actively carried out worldwide on the influence of GIC on ground-based technological systems and possible measures to reduce the negative consequences. A negative impact of GICs on power transmission lines and high-voltage transformers is a thoroughly studied phenomenon (see review [
4]). At the same time, there is very little scientific information on the impact of geomagnetic disturbances and associated telluric field variations on pipelines. The development of GIC in pipelines results in an increased corrosion at grounding points or at points with insulation damage, as well as disruption in the operation of cathodic protection. Commonly, the cathodic protection against electrocorrosion feeds a negative potential of ~1–2 V between the pipe and soil. Perturbations in the geomagnetic field induce fluctuations in the pipe-to-soil potential (PSP), which take the pipeline voltage beyond the safe range of electrocorrosion protection. During geomagnetic storm/substorms, changes in PSP can be large enough to expose pipeline sections for extended periods of time. For example, on a pipeline in Quebec (Canada), corrosion damage of a pipeline section developed after 5 years of operation only instead of the expected 20–30 years [
5]. The extensive studies of the effect of space weather on pipelines were carried out on the Finnish gas pipeline [
6,
7]. The number of cases with significant (>10 A) currents in the pipeline in southern Finland correlated well with the number of sunspots, which confirmed the direct relationship of the GIC with the solar/geomagnetic activity [
8]. In the trans-Alaska pipeline during strong magnetic disturbances, current surges up to 200 A occurred [
9]. In Northern Alberta (Canada), failures in the cathodic protection associated with geomagnetic disturbances were identified [
10]. In a pipeline in Northern Norway, it was found that the PSP fluctuates with an amplitude of ~5 V during magnetic disturbances [
11].
Strong geomagnetic disturbances can cause quite significant effects in technological systems at mid-latitudes as well. In Australia and New Zealand, during severe storms, PSP fluctuations on pipelines for a long time were several times higher than the established limits [
12,
13]. In the pipeline in northern Bavaria, the peak current values upon a moderate geomagnetic activity reached ~12 A, and the PSP variations were ~3 V during the magnetic storm main phase [
14]. The largest PSP variations associated with geomagnetic fluctuations were observed in the Bolivia-Brazil gas pipeline buried 0.5 m under the ground at the ends of the pipeline [
15].
The Arctic zone of the Russian Federation is a promising testing ground for the studies of GIC influence on ground-based technological systems. In this territory, the GIC monitoring system along the power transmission line at the Kola Peninsula has permanently been operating since 2011 [
16]. It is the only system that provides the GIC monitoring data for academic research. In this area, especially at the Yamal Peninsula and the Arctic shelf, the centers of the natural gas production and transportation were formed.
In addition to practical applications, ground-based magnetometers form the basis for the studies of electromagnetic processes in near-Earth space. The study of the mechanisms of solar–terrestrial relationships has also led to the creation of a new scientific discipline—the “space climate”. For the space climate studies, it is very important to have long-term time series of geomagnetic observations. The Arctic territory of the Russian Federation, which covers approximately 1/3 of the auroral oval, can be a viable support to satellite missions in the ionosphere and magnetosphere.
Under the harsh Arctic conditions, Russian scientific organizations support long-term observations (the list of institutes maintaining regular magnetometer observations at high latitudes is given at the end of the paper). IKFIA conducts complex observations at a network of stations in Eastern Siberia and the Far East. AARI has deployed magnetic stations along the Arctic coast up to Chukotka. PGI has a complex of observations on the Kola Peninsula and Svalbard. New magnetic stations were installed by GC [
17]. IZMIRAN deployed several stations on the Yamal Peninsula. However, the data of these observations are scattered among various sources and stored in different formats. Although the monitoring of the geomagnetic field in the Russian Arctic zone is extremely important for space and applied science, the availability of data from Russian stations to the world research community is still limited.
This paper describes a new database, which includes an archive of magnetovariational observations in the Russian Arctic and gives examples of its use for scientific and applied problems. Particular attention is paid to the territory of Yamal and Western Siberia, where the active development of the infrastructure is in progress now. These experimental data can serve as a basis for studying the features of geomagnetically induced electric fields. The database is augmented with the global 3D model of the Earth’s conductivity structure. The information on the geoelectric structure makes it possible to obtain estimates of extreme GIC values in infrastructure facilities and assess the possible increase in electrocorrosion of pipelines and the reduction in their service life.
2. Description of the Russian Arctic Database
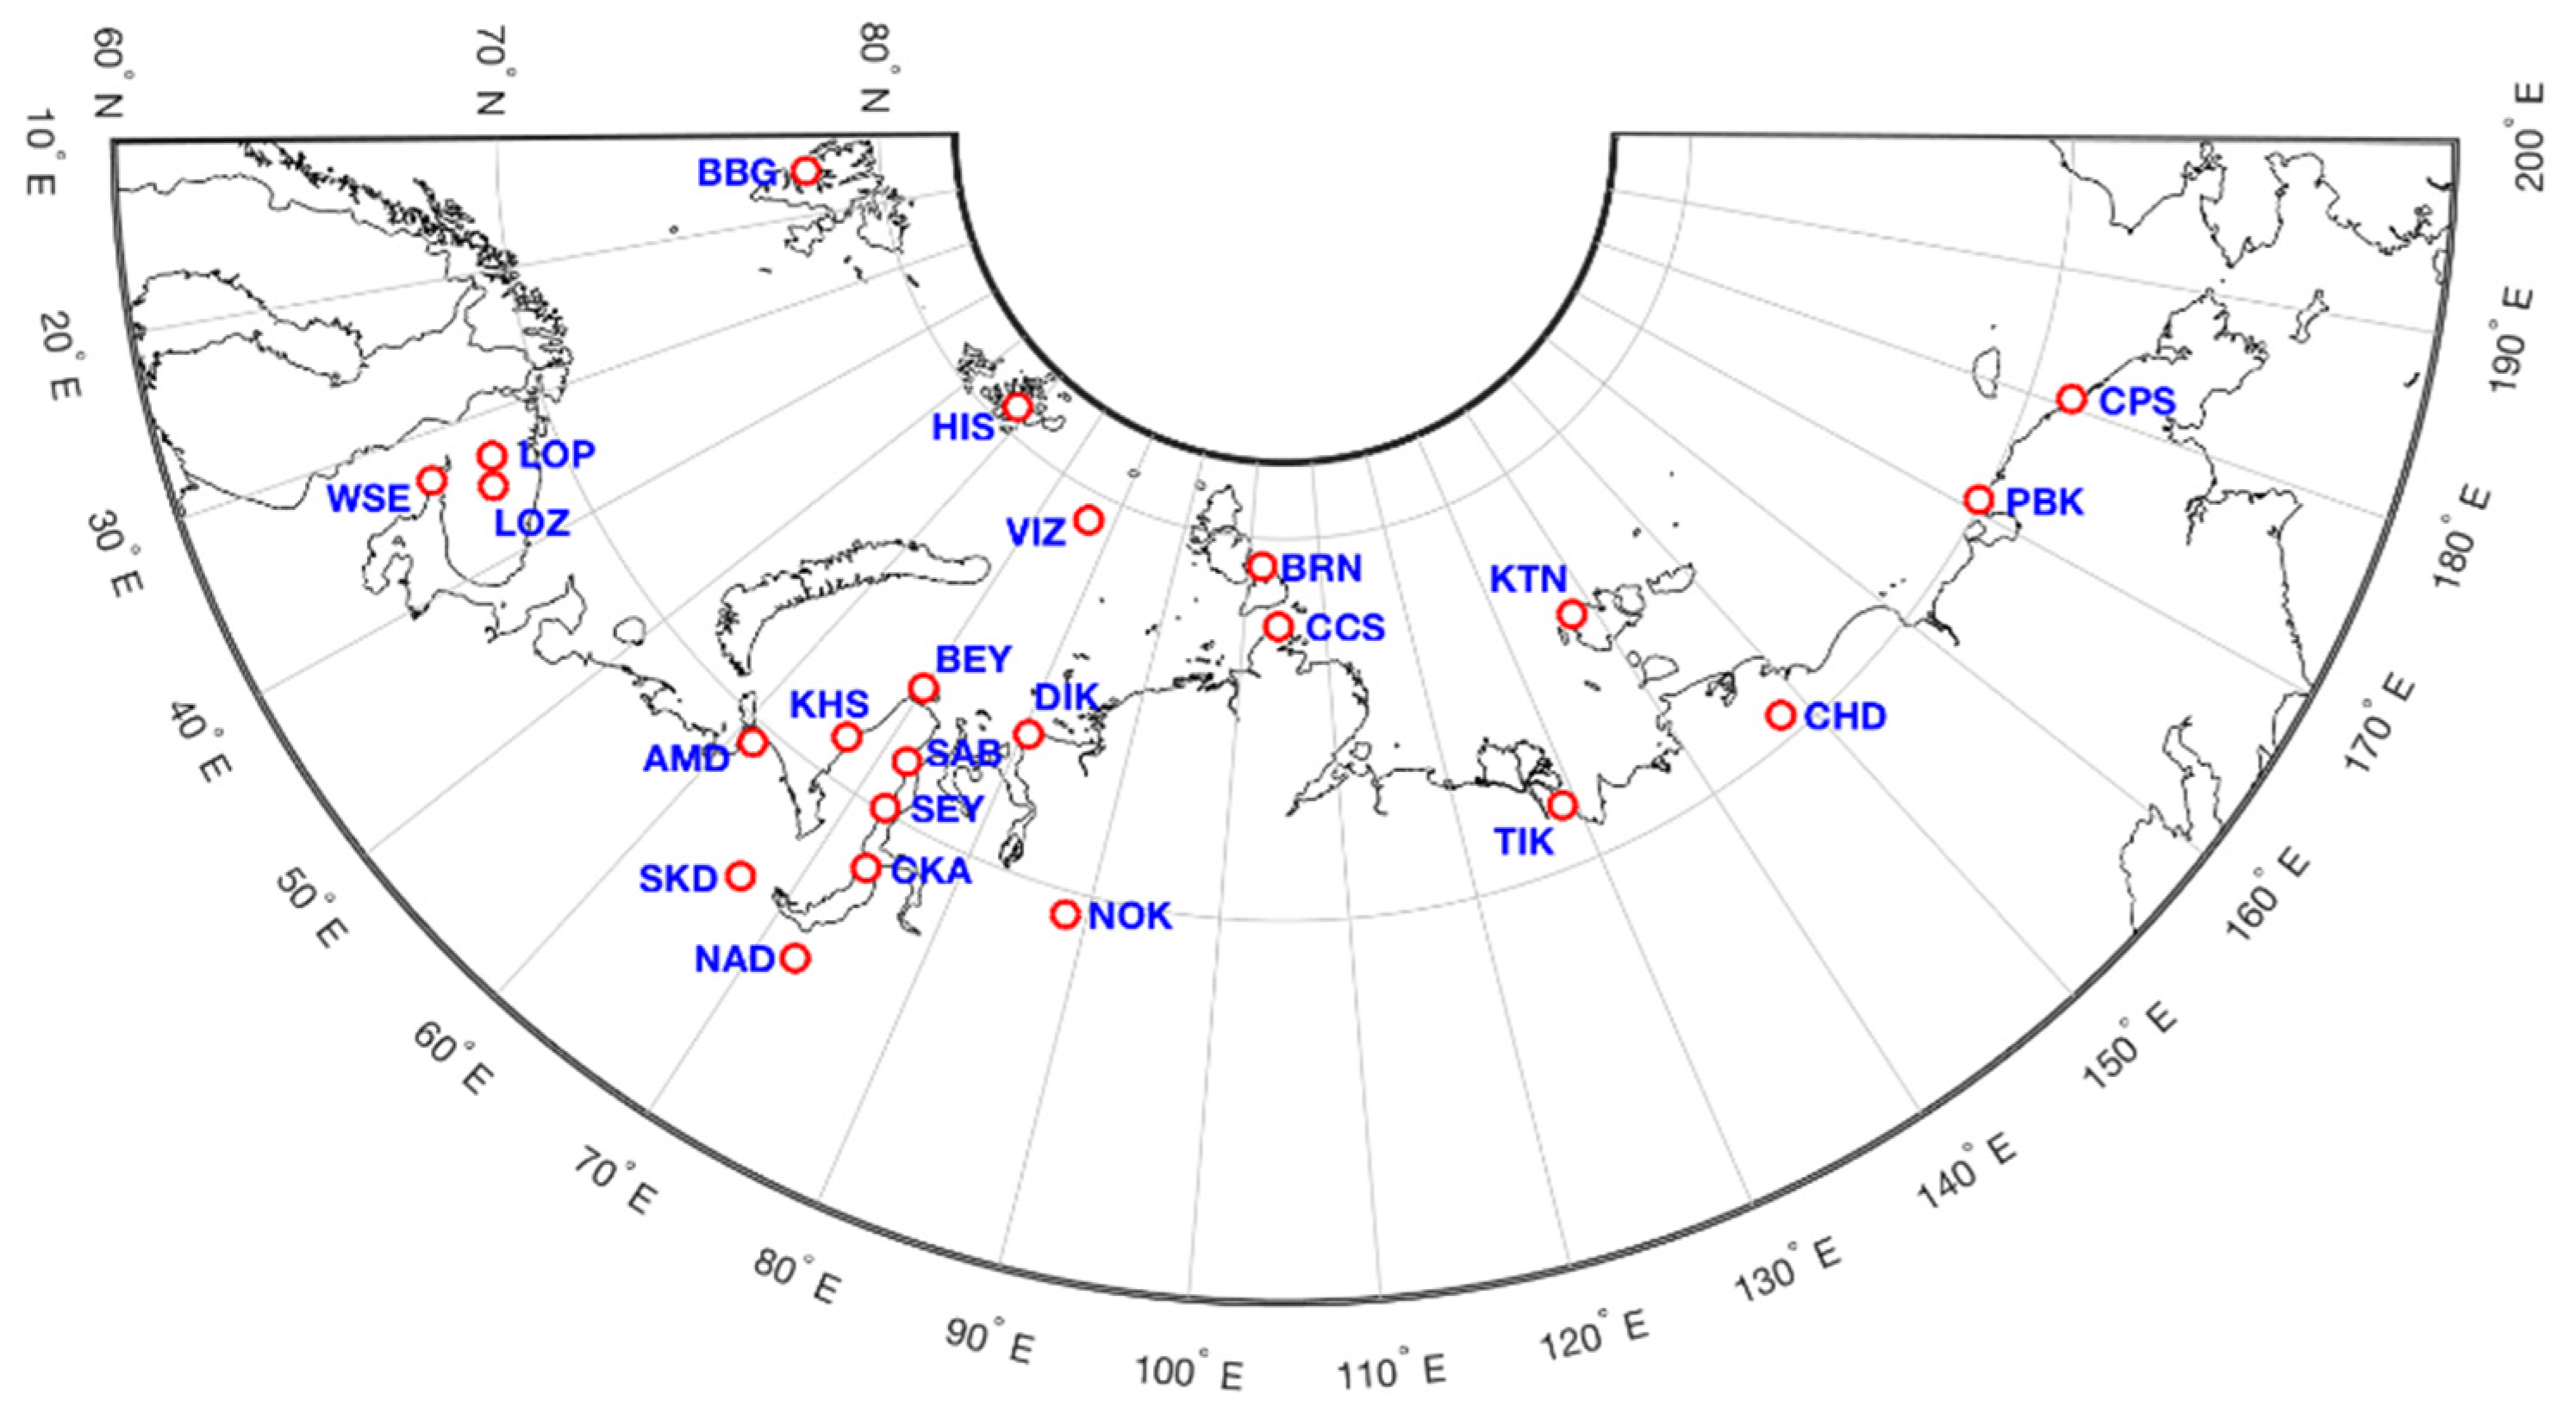
The presented database contains the results of observations of the geomagnetic field variations with a 1 min sampling period at stations in the Russian Arctic. The stations’ geographic and corrected geomagnetic coordinates are given in
Table 1, and the map with the stations’ locations is shown in
Figure 1.
The data of some stations are also available on the SuperMAG portal, some are part of the INTERMAGNET network, and some are included in the IMAGE and MAGDAS networks. Part of the data were taken from the Common Data Center “Analytical Center for Geomagnetic Data”. However, data from several stations, for example, on Yamal, are not included in these archives. Naturally, in each of the above archives, data are stored in their own format.
The measurements of the absolute values of the geomagnetic field are carried out only at stations included in the INTERMAGNET network. Other stations are variational, so only deviations from a reference level have a physical meaning in their records. The data quality and sensitivity are the same as in the data portals mentioned above. All the collected data have been converted into the standard ASCII format IAGA-2002. The names of the files have the format STAYYYYMMDDvmin.min, where STA is the station code from
Table 1, YYYY—year, MM—month, DD—day. Such file names make it easy to select the required intervals for analysis. The data files are sorted by year and stored in a compressed format to speed up the download process. The data are converted into the geomagnetic coordinate system (
H,
E,
Z):
H axis is directed to the geomagnetic pole,
E axis is directed to the geomagnetic east, and
Z axis is directed vertically downward. The magnetograms of all stations were visually examined and evidently defective files were discarded. However, the remaining files may still contain level jumps, data gaps, and intermittent noise, because their correction requires a special analysis.
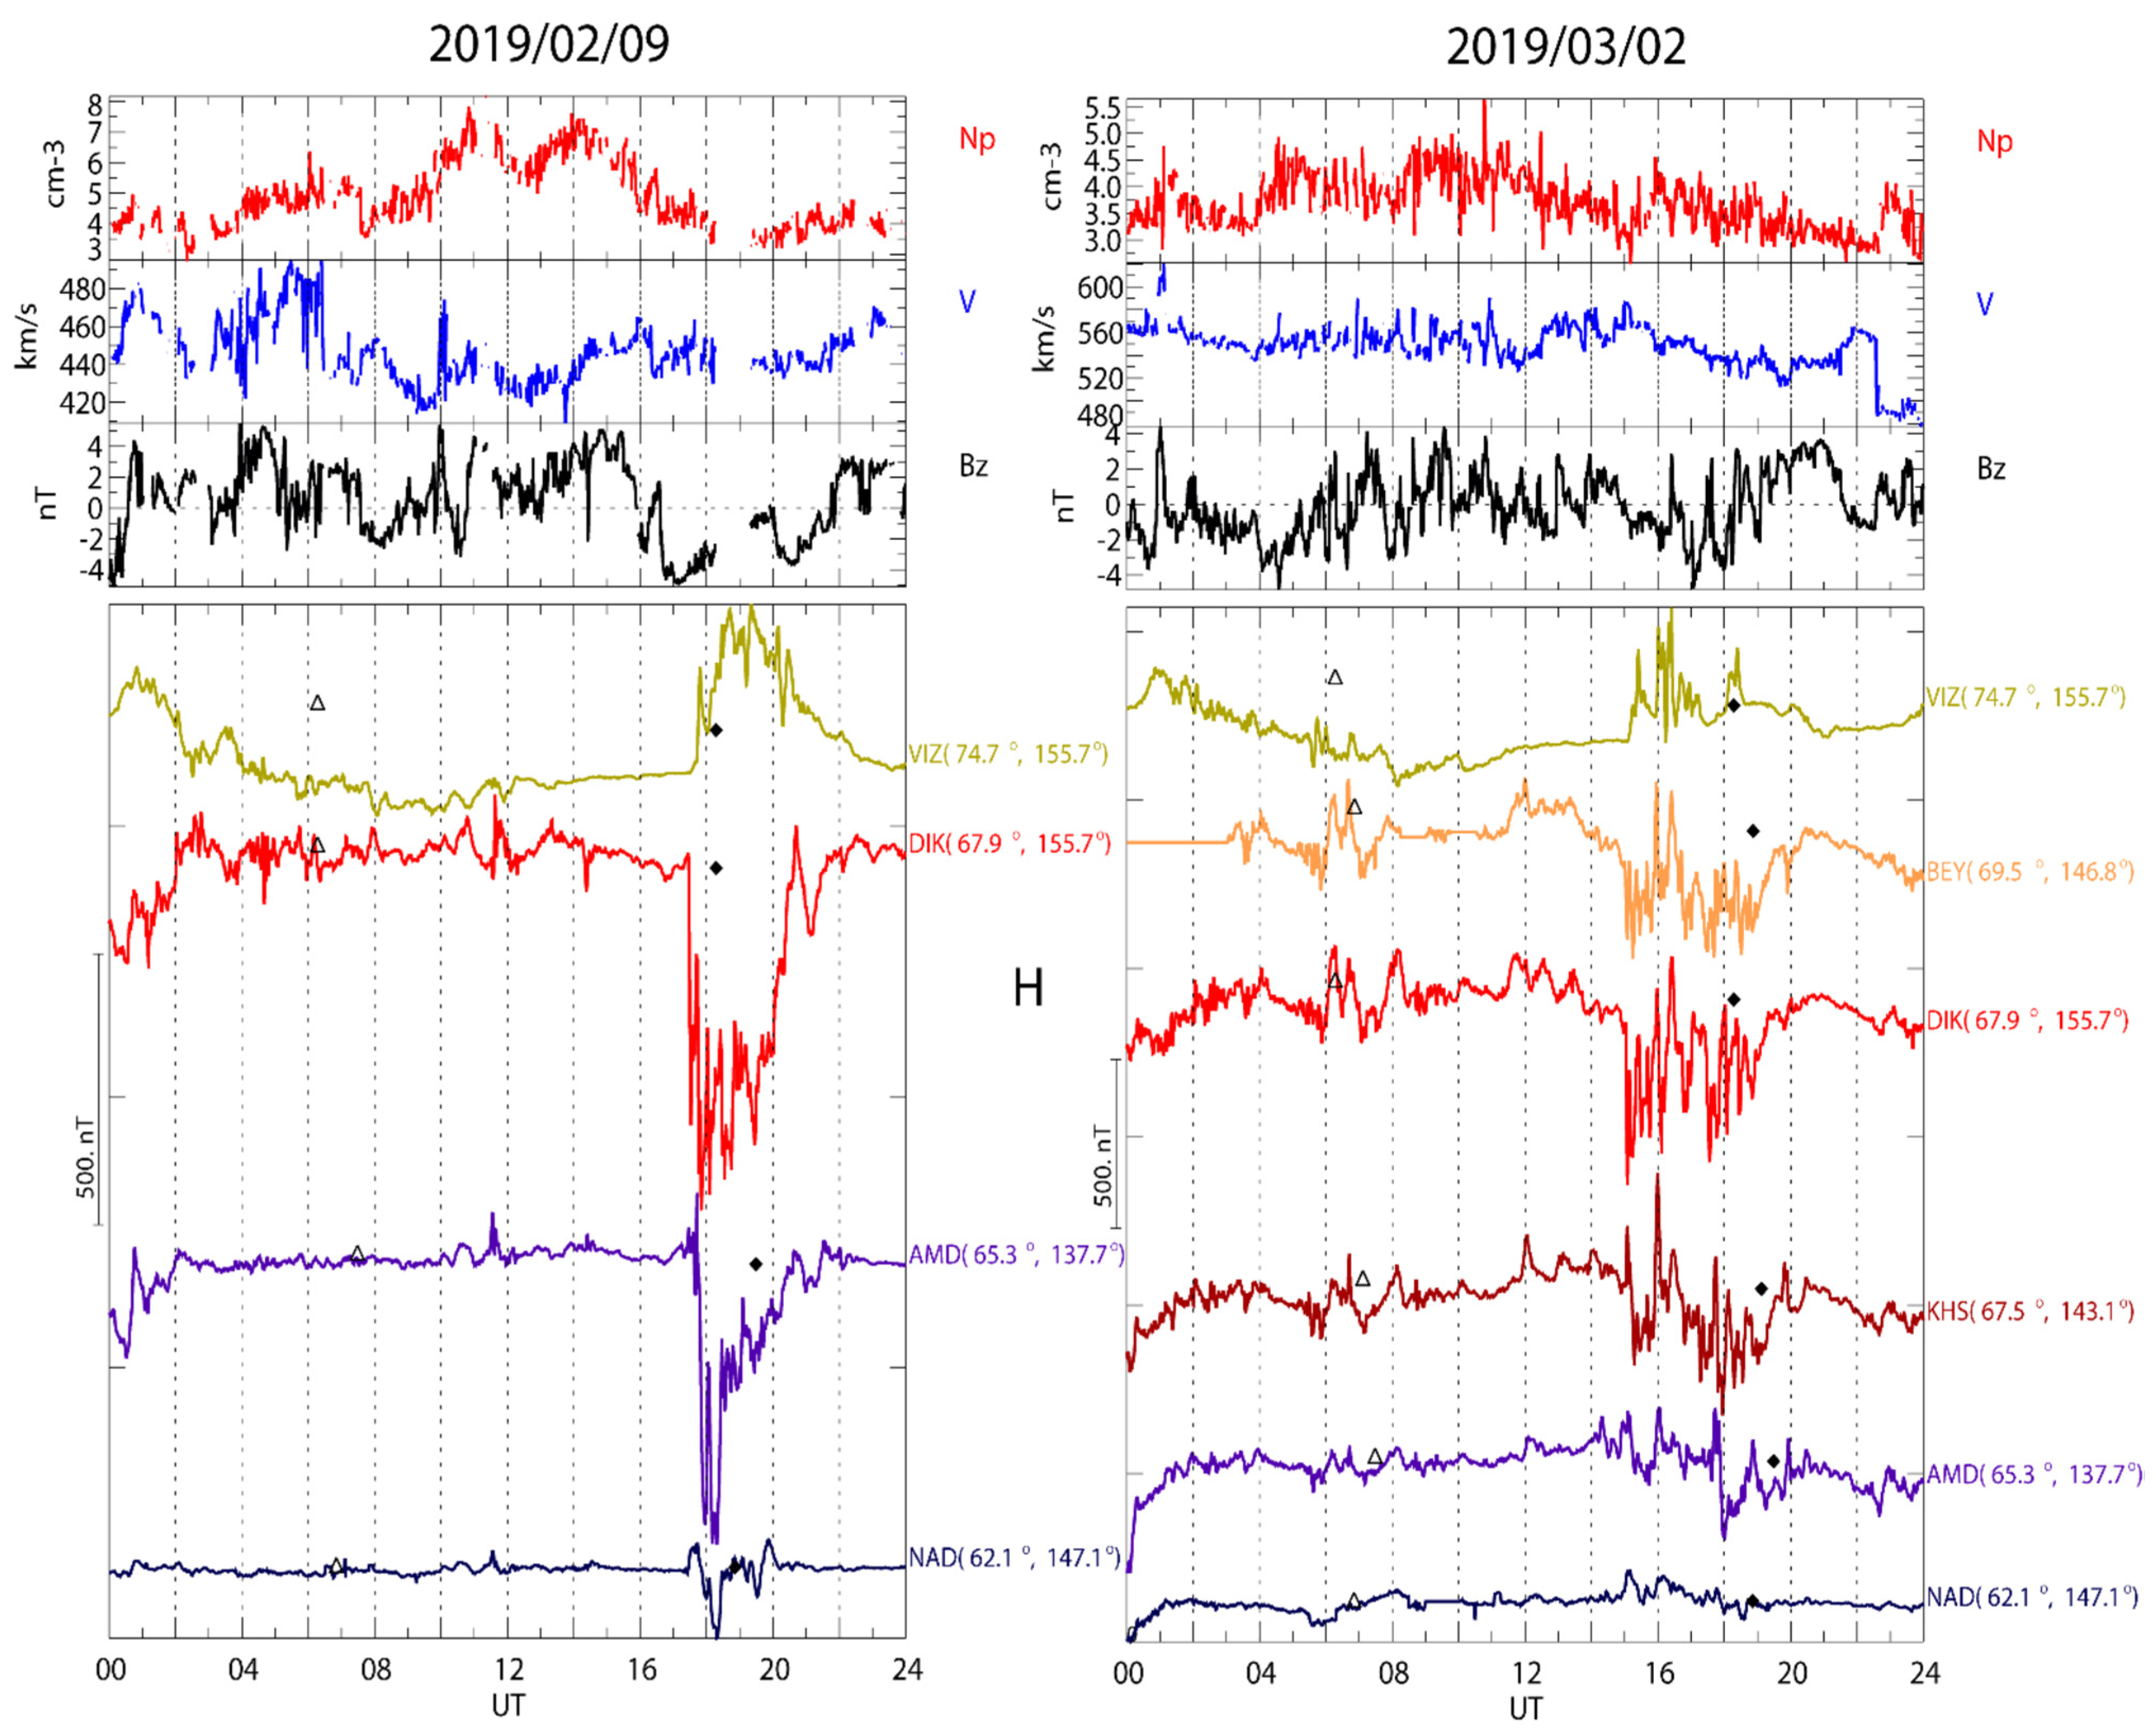
To quickly browse the data, check for the data availability for specific time intervals, and select events, the quick-look magnetograms are drawn. For a general characterization of conditions in interplanetary space from the OMNI database, the same graph shows variations in the solar wind plasma density Np, solar wind velocity V, and the vertical component of the interplanetary magnetic field Bz.
Examples of the constructed magnetogram plots are demonstrated below. The presented events are important for the problem of GIC excitation because they are known to be associated with intense GIC bursts, but their physical nature has not been completely clarified.
3. Examples of Geomagnetic Variations Causing Significant GIC Bursts
The largest magnetic disturbances on the Earth’s surface are caused by an extended large-scale auroral electrojet, intensified during substorms [
18]. However, the most intense GIC bursts are produced by small-scale ionospheric current structures [
19]. The energy of such impulsive or quasiperiodic disturbances is much lower than the energy of magnetospheric storms or substorms, but rapidly changing fields of such disturbances can cause GIC bursts of significant magnitude [
20]. Examples of such impulsive and quasiperiodic disturbances of geomagnetic field are given below based on the data from the Russian Arctic database.
After the expansion phase of a substorm, large-scale magnetic variations are often superimposed by irregular quasiperiodic Pi3 pulsations with characteristic time scales of 3–15 min.
Figure 2 shows quick-look graphs for the substorms on 9 February 2019 (left-hand panel) and 2 March 2019 (right-hand panel) from the Arctic magnetometer database. These Pi3 pulsations are not harmonic oscillations such as Pc5 waves, but a series of nonlinear magnetic pulses with steep fronts. Ps6 pulsations in the same frequency range are morphologically similar [
21]. Due to steep fronts of the Pi3/Ps6 pulses, the associated field variability is high, up to dB/dt~20 nT/s. In many events with extremely large GICs, the currents reached their maximum value (up to hundreds of Amperes) during the subsequent series of Pi3/Ps6 pulses [
22,
23].
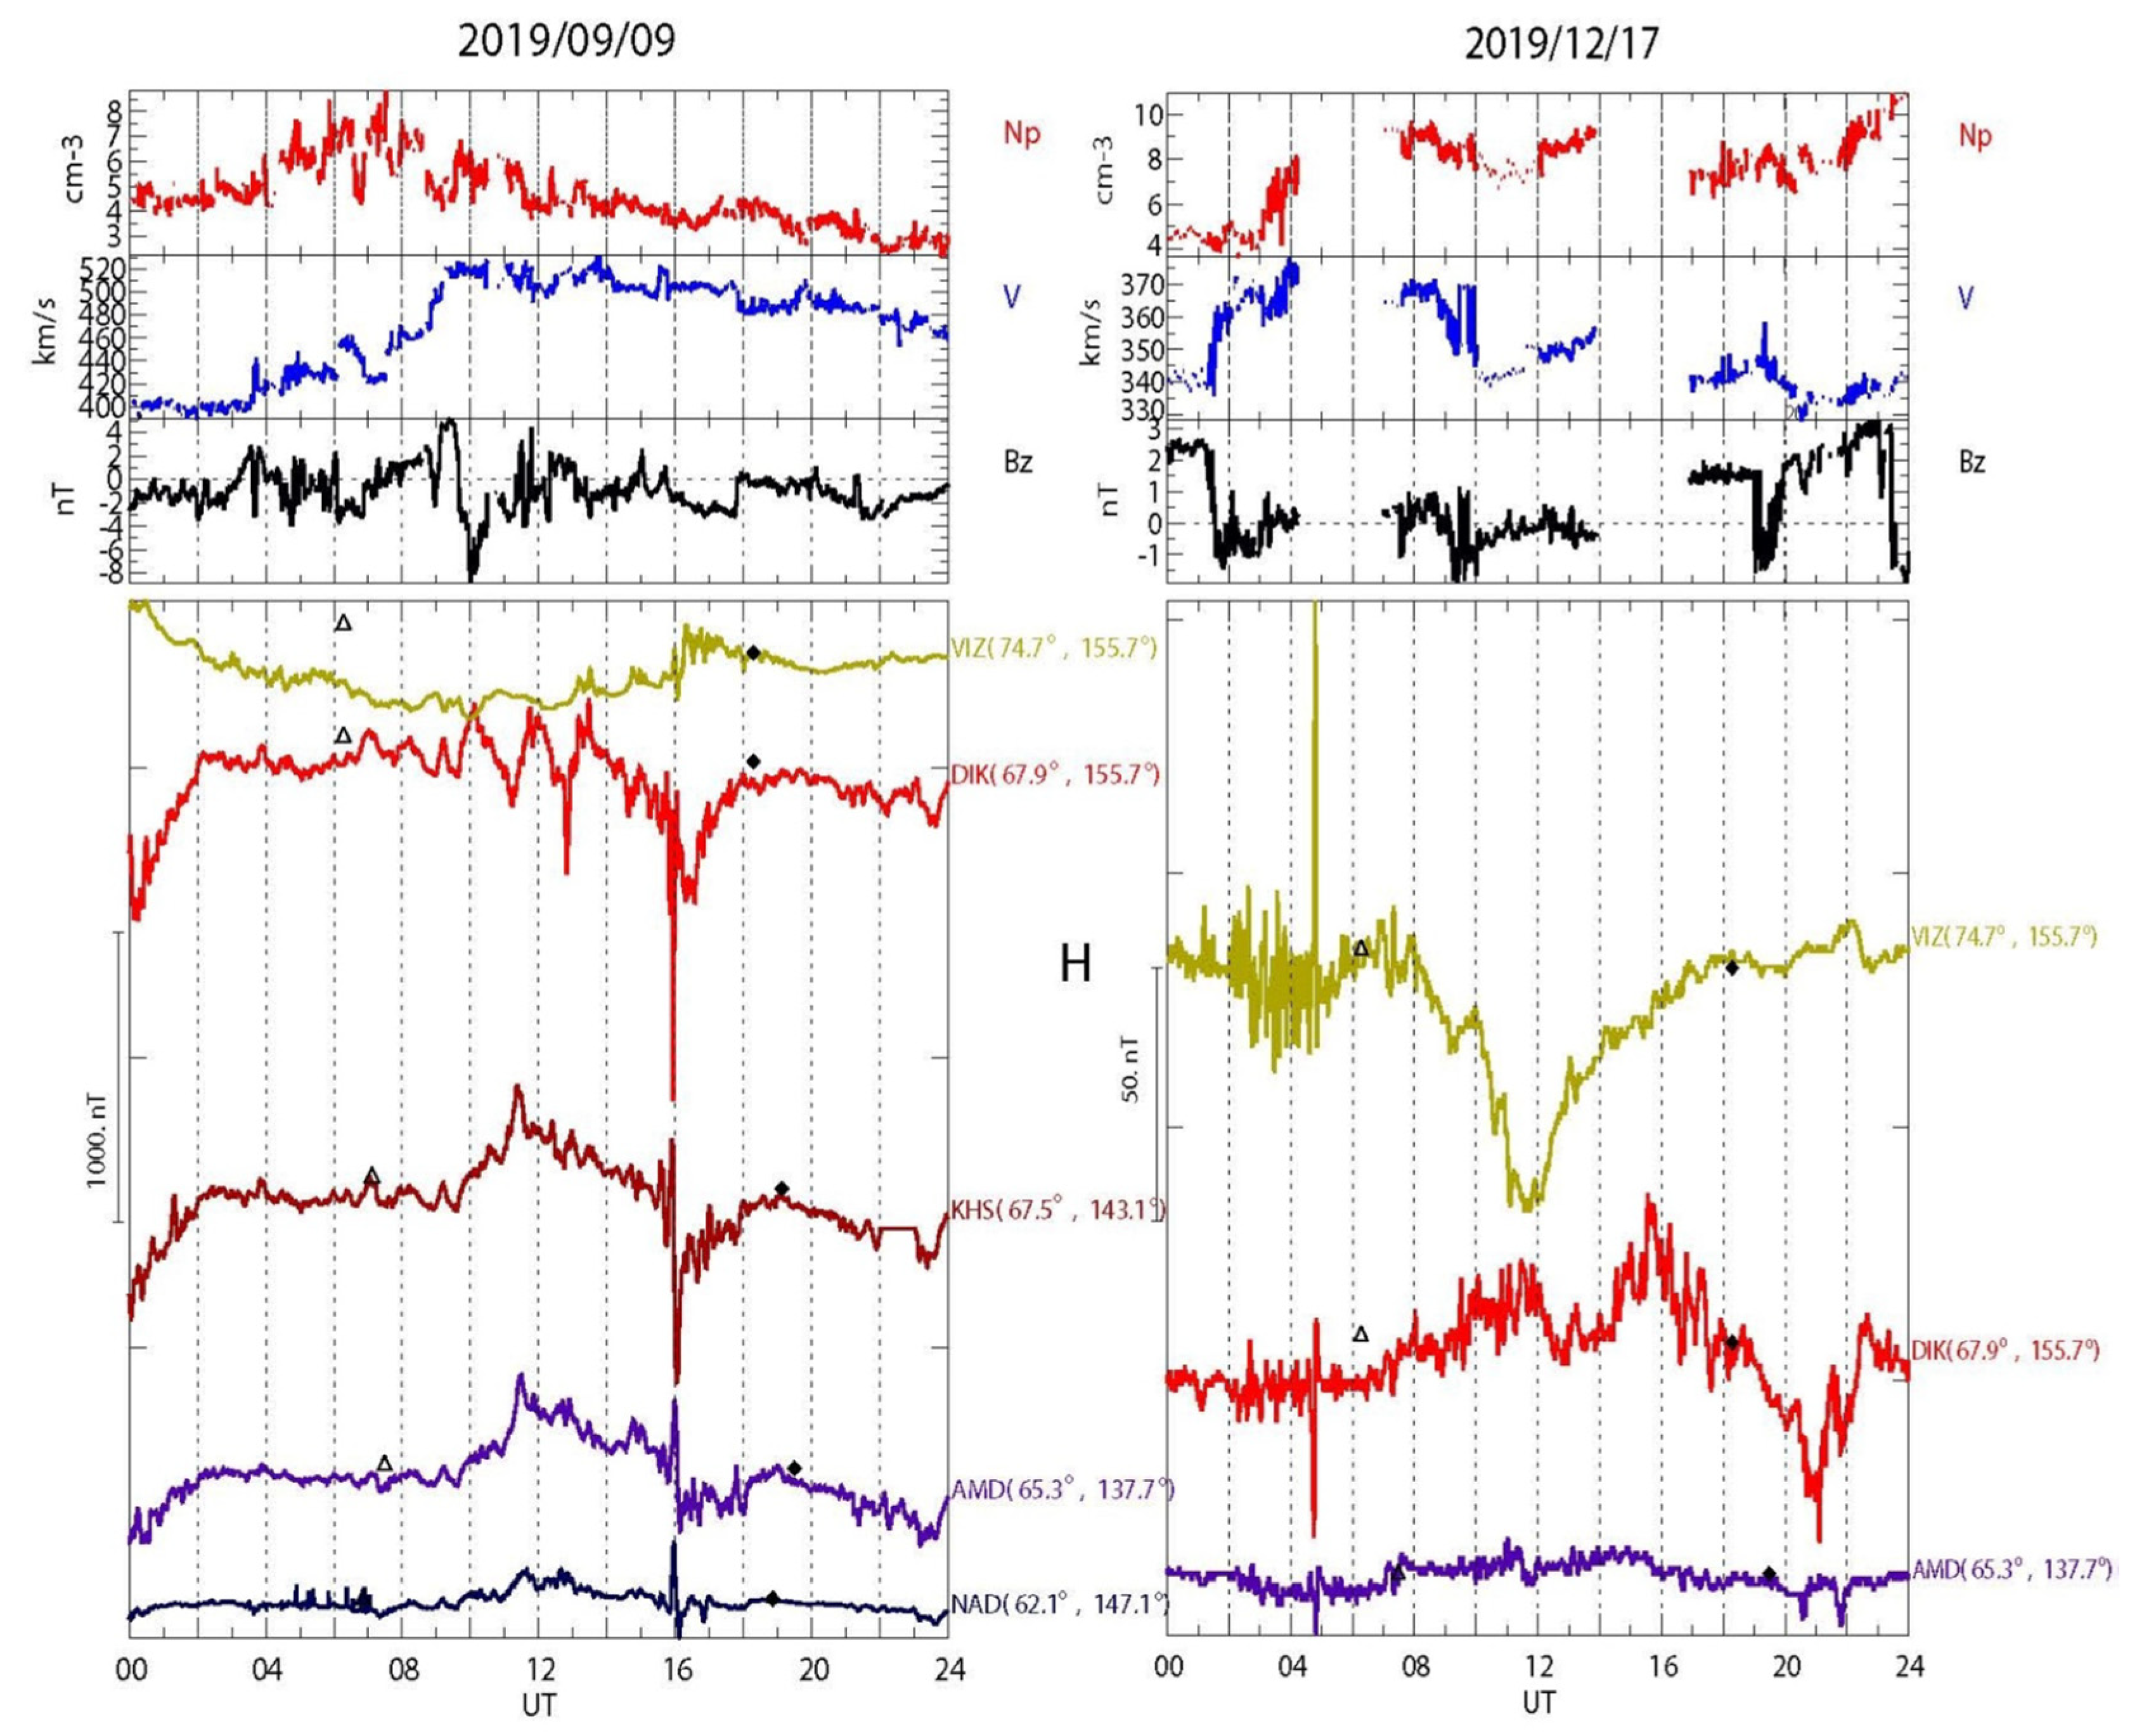
When considering the impacts of space weather, it is usually assumed that disturbed geomagnetic fields are spatially uniform throughout the area of a technological system. However, often against the background of a general field enhancement during substorms, isolated magnetic perturbation events (MPEs) are observed in the magnetic (>100 nT) and telluric (>1 V/km) fields [
24]. The MPEs are spatially localized, so the peak at one station can be several times larger than the regional value of the field on average (at distances of about 500 km).
Figure 3 shows examples of such isolated impulsive disturbances during moderate magnetic activity on 9 September 2019 (at ~16 UT) and 17 December 2019 (at ~05 UT). These magnetic pulses are usually associated with a local intensification of the auroral luminosity. Such pulses may induce sporadic intense bursts of GIC. The physical processes that determine the generation of the MPEs are poorly understood.
There are other geomagnetic disturbances that are hazardous to power transmission and pipeline networks. Due to the high variability of the geomagnetic field of Pc5 pulsations (3–10 min), the magnitude of associated periodic GICs in power lines may increase and exceed 10 A [
25]. The long-lasting Pc5 wave activity can be more dangerous than short-term bursts of GICs during substorm onsets due to cumulative effects—corrosion and premature aging of high-voltage transformers.
4. Modeling Disturbances of the Geoelectric Field
Using information on the geoelectric structure of the underlaying crust, one may reproduce the dynamics of the telluric response for real events from geomagnetic observations, even in the absence of synchronous electric field records. The construction of a detailed global model of the Earth’s electrical conductivity is a task for the future; therefore, nowadays, calculations have to use some approximate scheme [
26]. A comparison of various methods showed that with a good accuracy for calculation of the telluric field, one can use the impedance relation in the plane wave approximation. This approximation, also named the strong skin-effect condition, is valid when the horizontal scale of the disturbance is much larger than the skin-depth
of the electromagnetic field with cyclic frequency
ω in the conducting Earth with electrical conductivity
σ (Wait–Price criterion) [
27,
28]. Under this condition, the actual spatial structure of geomagnetic disturbance does not influence the impedance relationship, so the primary disturbance should not necessarily be a “plane vertically incident” wave. For practically important calculations of GIC, the situation is greatly simplified by the fact that integral estimates of the potential difference throughout an extended system (at least several hundred kilometers) are needed, and therefore the necessary estimates can be performed with a sufficient accuracy with a relatively rare network of magnetometers and a rough model of conductivity.
The geoelectric field in the plane wave approximation is coupled with geomagnetic variations through the surface MT impedance
Z(
ω). In media with a low conductivity, the negative effects of strong magnetic disturbances are most probable, because the excited telluric fields and potential differences turn out to be larger, so the induced currents mainly flow through conductive elements of industrial networks. On the Earth’s surface, the impedance relation holds between the spectral amplitudes of the horizontal electric
E = {
Ex,
Ey} and magnetic
B = {
X,
Y} fields as follows:
, where
Z is the impedance matrix. In a simplified approach, the use of 1D impedance
Z(
ω) in the impedance boundary condition may be sufficient, namely
For uniform conductivity of the Earth, the impedance
(where
ρ = 1/
σ is the electric resistivity) depends on the period of the incident wave as a power law
. In the vicinity of coastal areas with a sharp gradient of conductivity, the use of 3D impedances may be necessary to account for horizontal inhomogeneity [
29]. The telluric field enhancement in such regions may be as high as several times. The voltage on a virtual transmission line modeled using a piecewise 1-D conductivity profile was estimated to differ by 10–20% (depending on orientation relative to the geoelectric field polarization) compared with modeling that accounted for 3-D conductivity structure [
3].
Here, using the recorded time series of
B(t) = {
H,
E} in geomagnetic coordinates and frequency domain MT impedance
Z(
ω), we synthesized the temporal variations in the electric field
E(t) = {
EH,
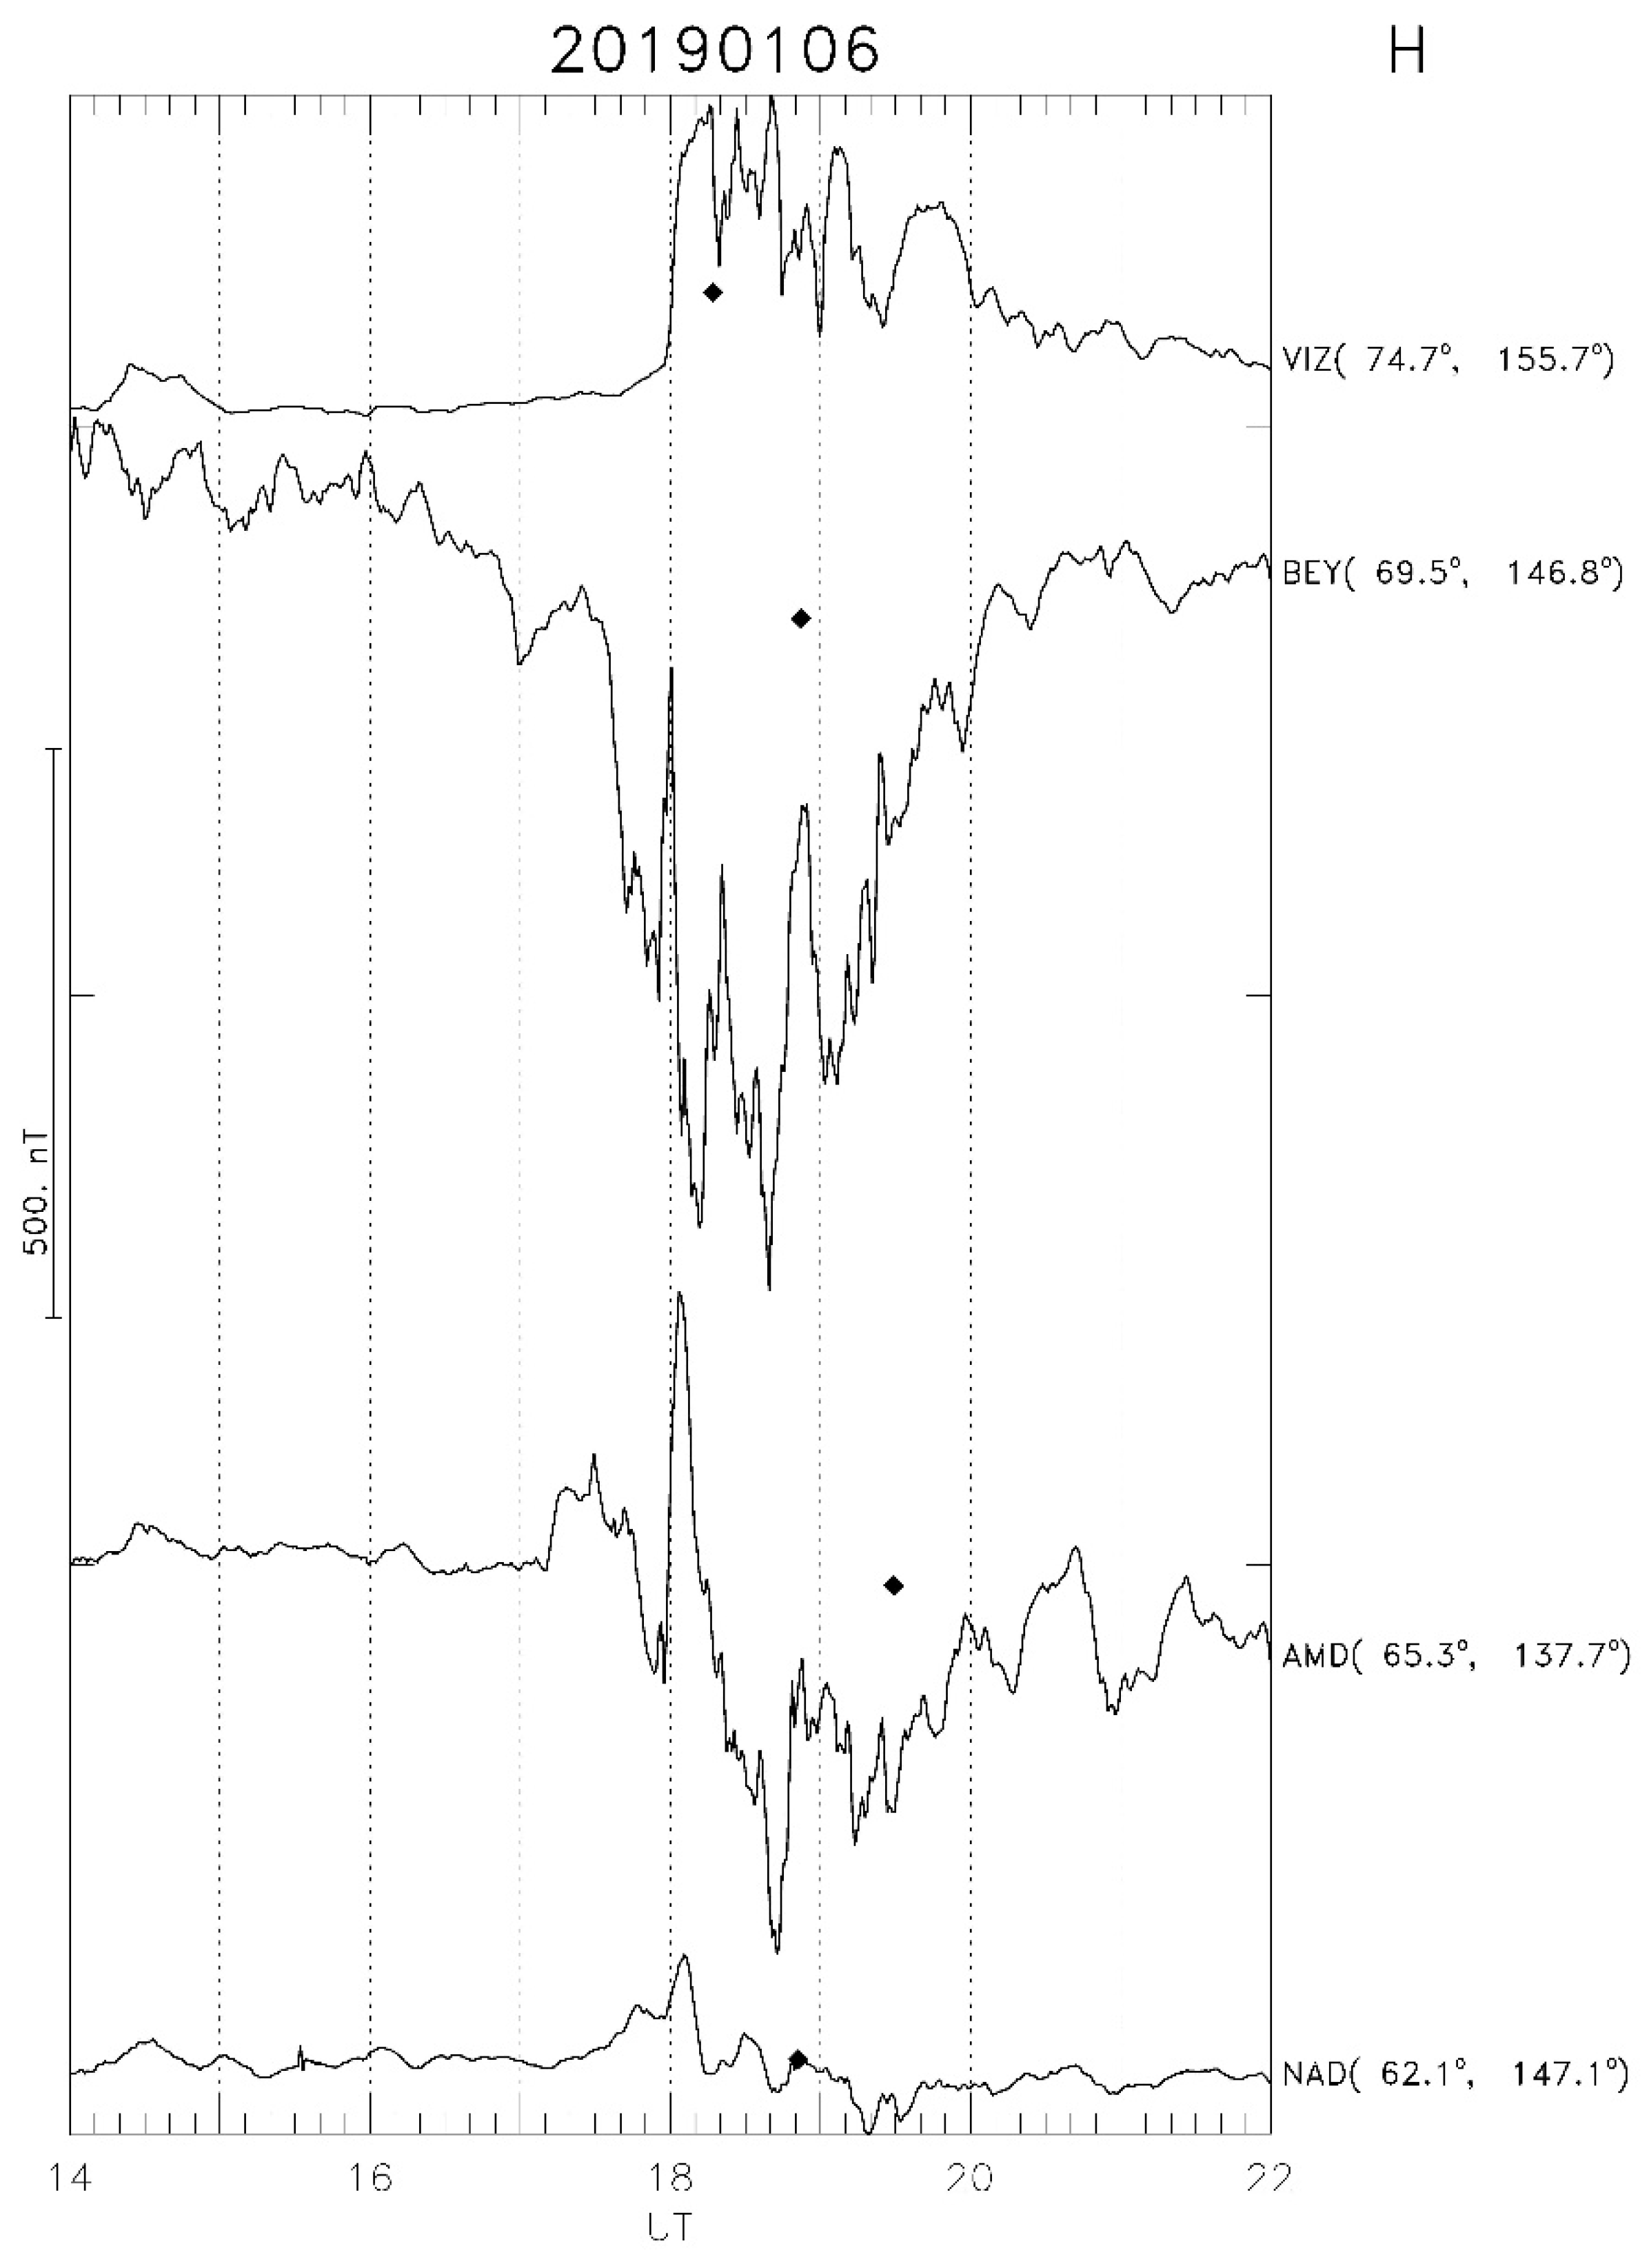
EE} by a two-step procedure. First, a spectral transform of the recorded time series was used in the impedance condition (1), and then, the inverse Fourier transform was applied to the spectrum of the telluric field. The selected example corresponds to the substorm with Pi3 activity recorded at a local latitudinal profile of stations at Yamal. The magnetograms from stations along the latitudinal profile 150° during the event on 6 January 2019 are shown in
Figure 4. The peak magnetic disturbance in the
H component is reached at BEY station Δ
H~350 nT.
To calculate the geoelectric fields that could be excited by this geomagnetic disturbance, we used information on the impedances of the Earth’s crust calculated on the basis of the model from [
30]. This global 3D model was compiled using the results of many regional MT sounding projects, as well as current ideas about the structure of the outer solid shells of the Earth and their electrical properties. The model describes the structure of the electrical conductivity of the Earth in the depth range of 0–100 km, including seawater, crust, and partly the upper mantle. This model was augmented by the data of the upper 10 km of the SMAP conductivity model of Fennoscandia [
31], which was not originally included in [
30]. To describe the conductivity distribution at depths larger than 100 km, the global 1D conductivity profile from [
32] was used.
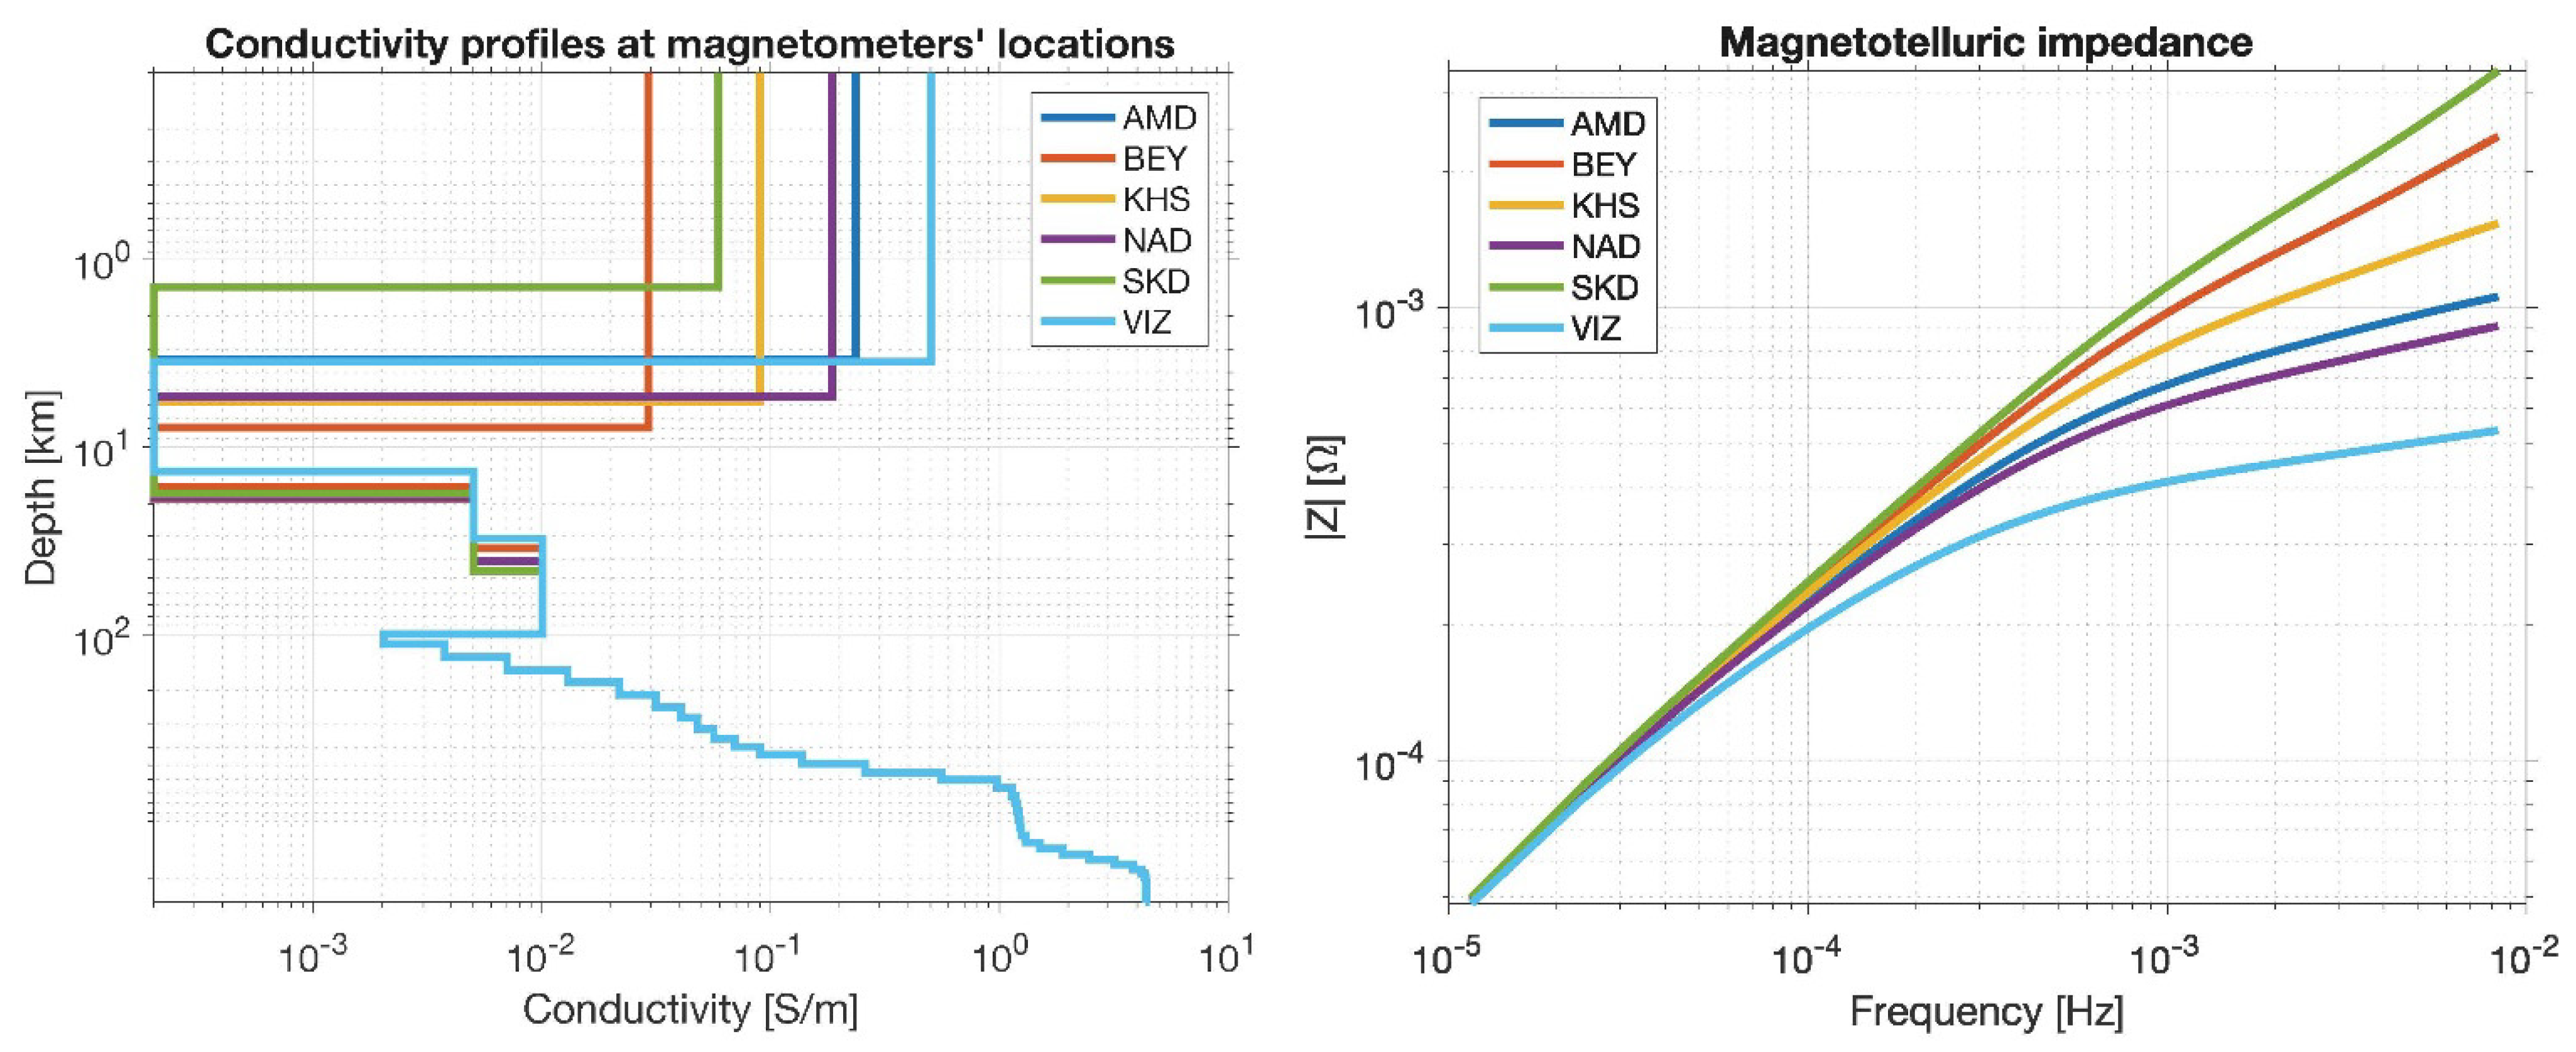
Figure 5 (left-hand panel) demonstrates the vertical conductivity profiles
σ(z) at magnetometer stations’ locations at Yamal, whereas
Figure 5 (right-hand panel) shows the corresponding frequency-dependent impedance
Z(
f). At station SKD, the dependence is close to a power law, which corresponds to the homogeneous conductivity. At other stations, the impedances at
f > 0.5 mHz deviates noticeably from a power law dependence.
Figure 6 demonstrates the results of the synthesis of electric field time series during the substorm event on 6 January 2019 for station BEY. The superposed Pi3 pulsations on a magnetic bay are most evident in the eastward magnetic component E. These pulsations provide a high variability of the geomagnetic field, d
H/dt ~ 5 nT/s, d
E/dt ~ 6.5 nT/s. The synthetic electric field is also highly variable, though its spectral content is evidently different from d
B/dt variations. The highest peak-to-peak variations in the telluric field are
EH~
EE ~ 0.4 V/km. The occurrence of electric field peaks does not coincide with the moment of maximum magnetic field disturbance (cf.
Figure 4).
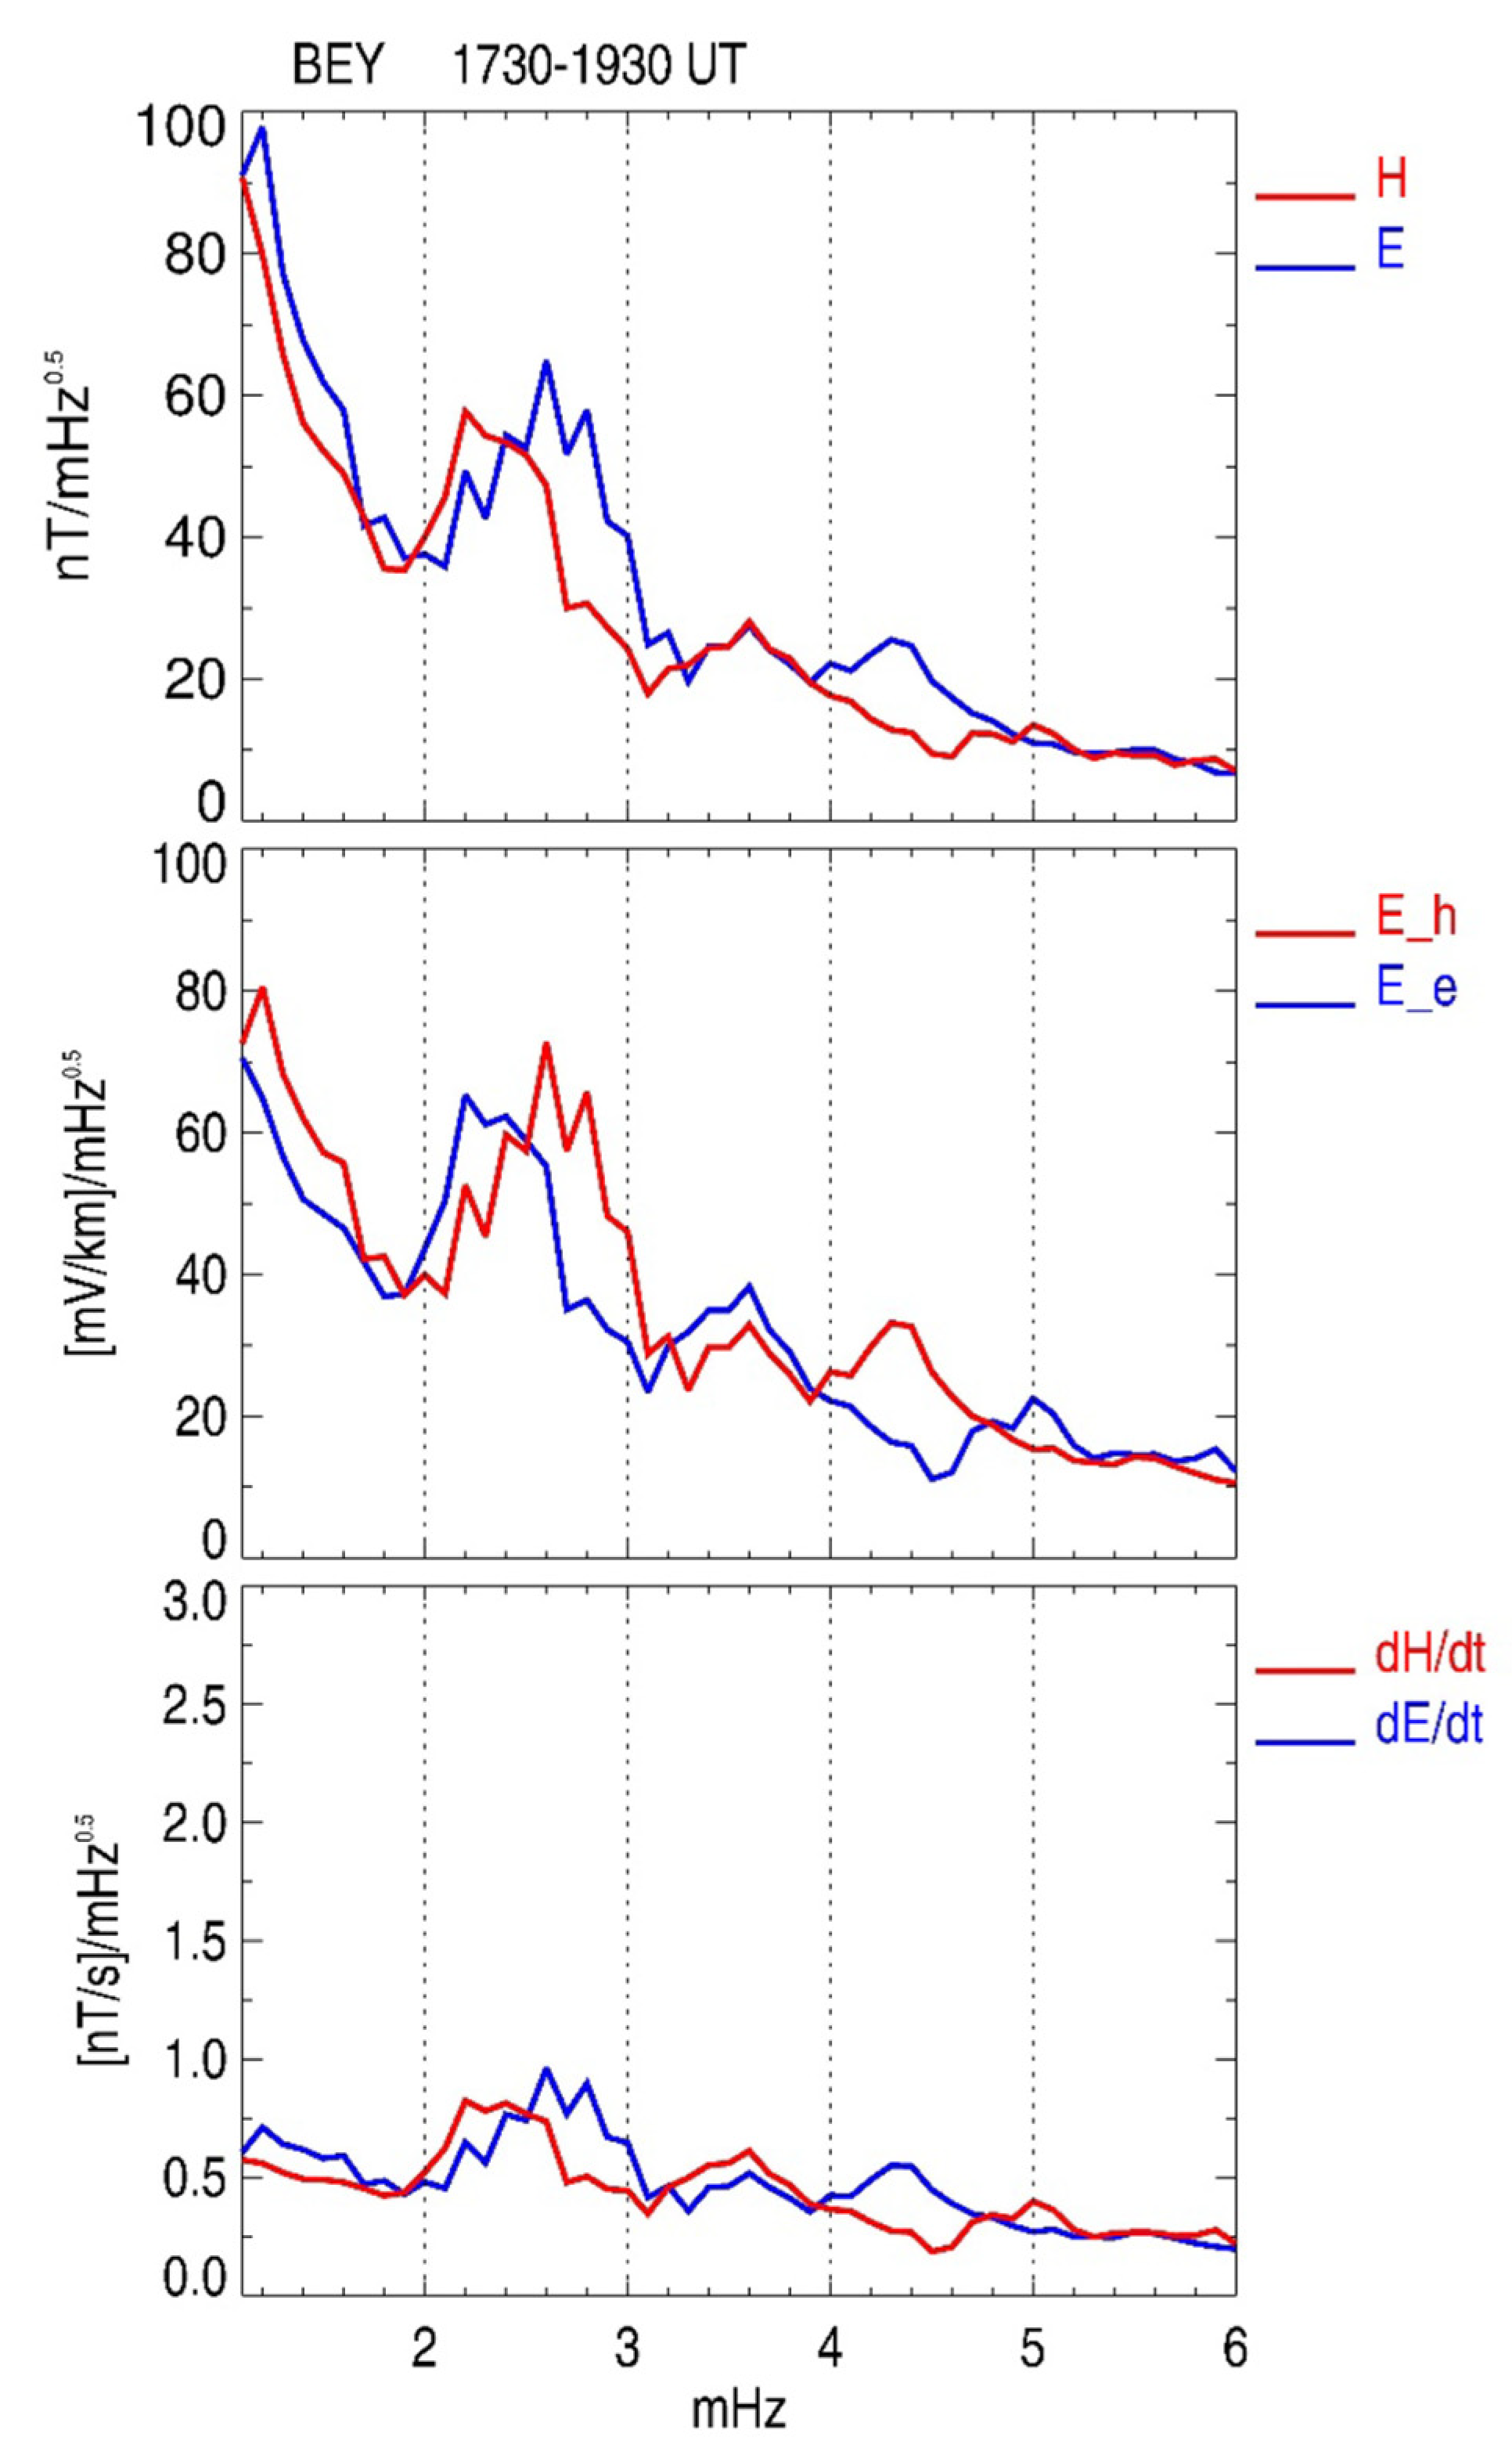
The spectra of magnetic and telluric field variations at station BEY during the 6 January 2019 event (shown in
Figure 6) are presented in
Figure 7. The spectral amplitude of magnetic field variations decays with frequency and has a spectral peak of both components in the band 2–3 mHz caused by Pi3 pulsations. The electric field has similar behavior with spectral peaks in the same band. In contrast, the spectra of magnetic field variability d
H/dt and d
E/dt have a weakly decaying dependence on frequency with only a slightly evident spectral peak at the Pi3 frequency. Thus, this comparison shows that in the telluric field variations, the high-frequency part of the spectrum is substantially suppressed as compared with dB/dt fluctuations [
33]. Indeed, the spectral power of horizontal magnetic components drops ~12.5 times from 1 mHz to 6 mHz, whereas that of the electric field drops ~8 times, and that of d
B/dt drops ~3.5 times only.
The considered event and other observations [
22,
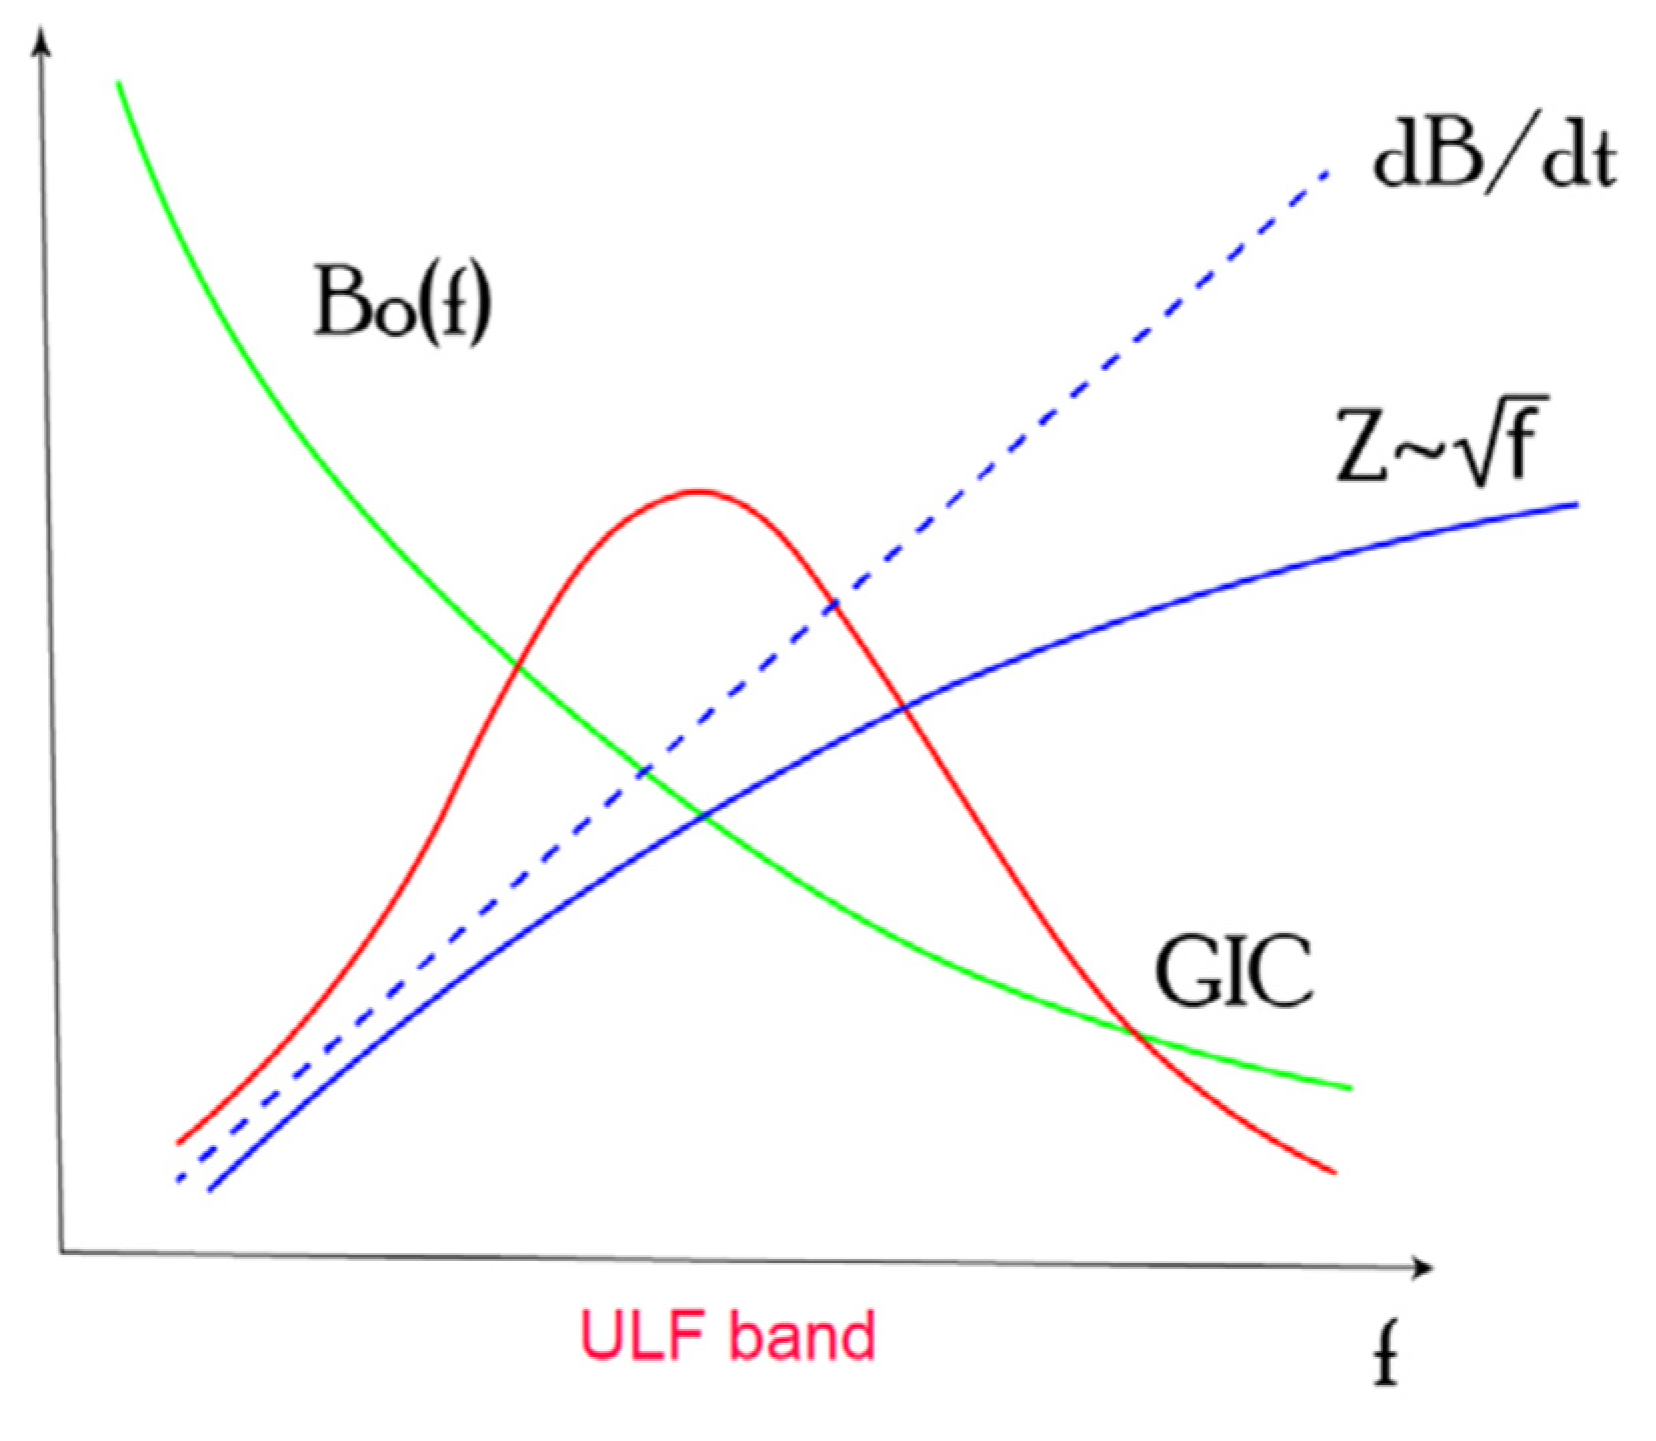
23] showed that the most intense GICs in power transmission lines are excited by geomagnetic fluctuations in the Pi3/Ps6 band. The formation of the highlighted frequency band in the GIC response most vulnerable to geomagnetic variations can be understood from the following simple consideration, illustrated in
Figure 8. GICs can be imagined as currents induced in the electric contour formed by a power transmission line, grounding, and conductive crust. Very approximately, the induced current in this contour according to Faraday’s law is proportional to temporal variations in the geomagnetic field,
J ~ d
B/dt. That is why the magnetic field variability d
B/dt is a commonly used measure of possible GIC, because information on telluric field
E is not easily available. On the other hand, GIC can be imagined as a “discharge current” via a grounded technological system between distant points with different telluric field potentials. These approaches do not contradict each other, because in both cases,
, where α = 1 for the dB/dt scenario and α = 1/2 for the telluric field in homogeneous Earth. The spectral power of magnetic variations
B(
f) typically decays with frequency
f, whereas the power of both d
B/dt variability and
E-field fluctuations grows with frequency. The resulting GIC is a convolution of those two factors and must have a maximum at some intermediate frequencies. Dedicated studies have shown that this frequency band falls into the range of 3–15 min, that is, the Pi3/Ps6 band.
5. Map of Telluric Field Response to a Geomagnetic Disturbance over Northern Russia
For qualitative operative estimates of expected vulnerability of a technological system to geomagnetic variations, it is desirable to have a map with the telluric response amplitude to a given disturbance of the magnetic field. A map, similar to [
2], but for the territory of the Russian Federation, was constructed here. The map is based on the geoelectric model [
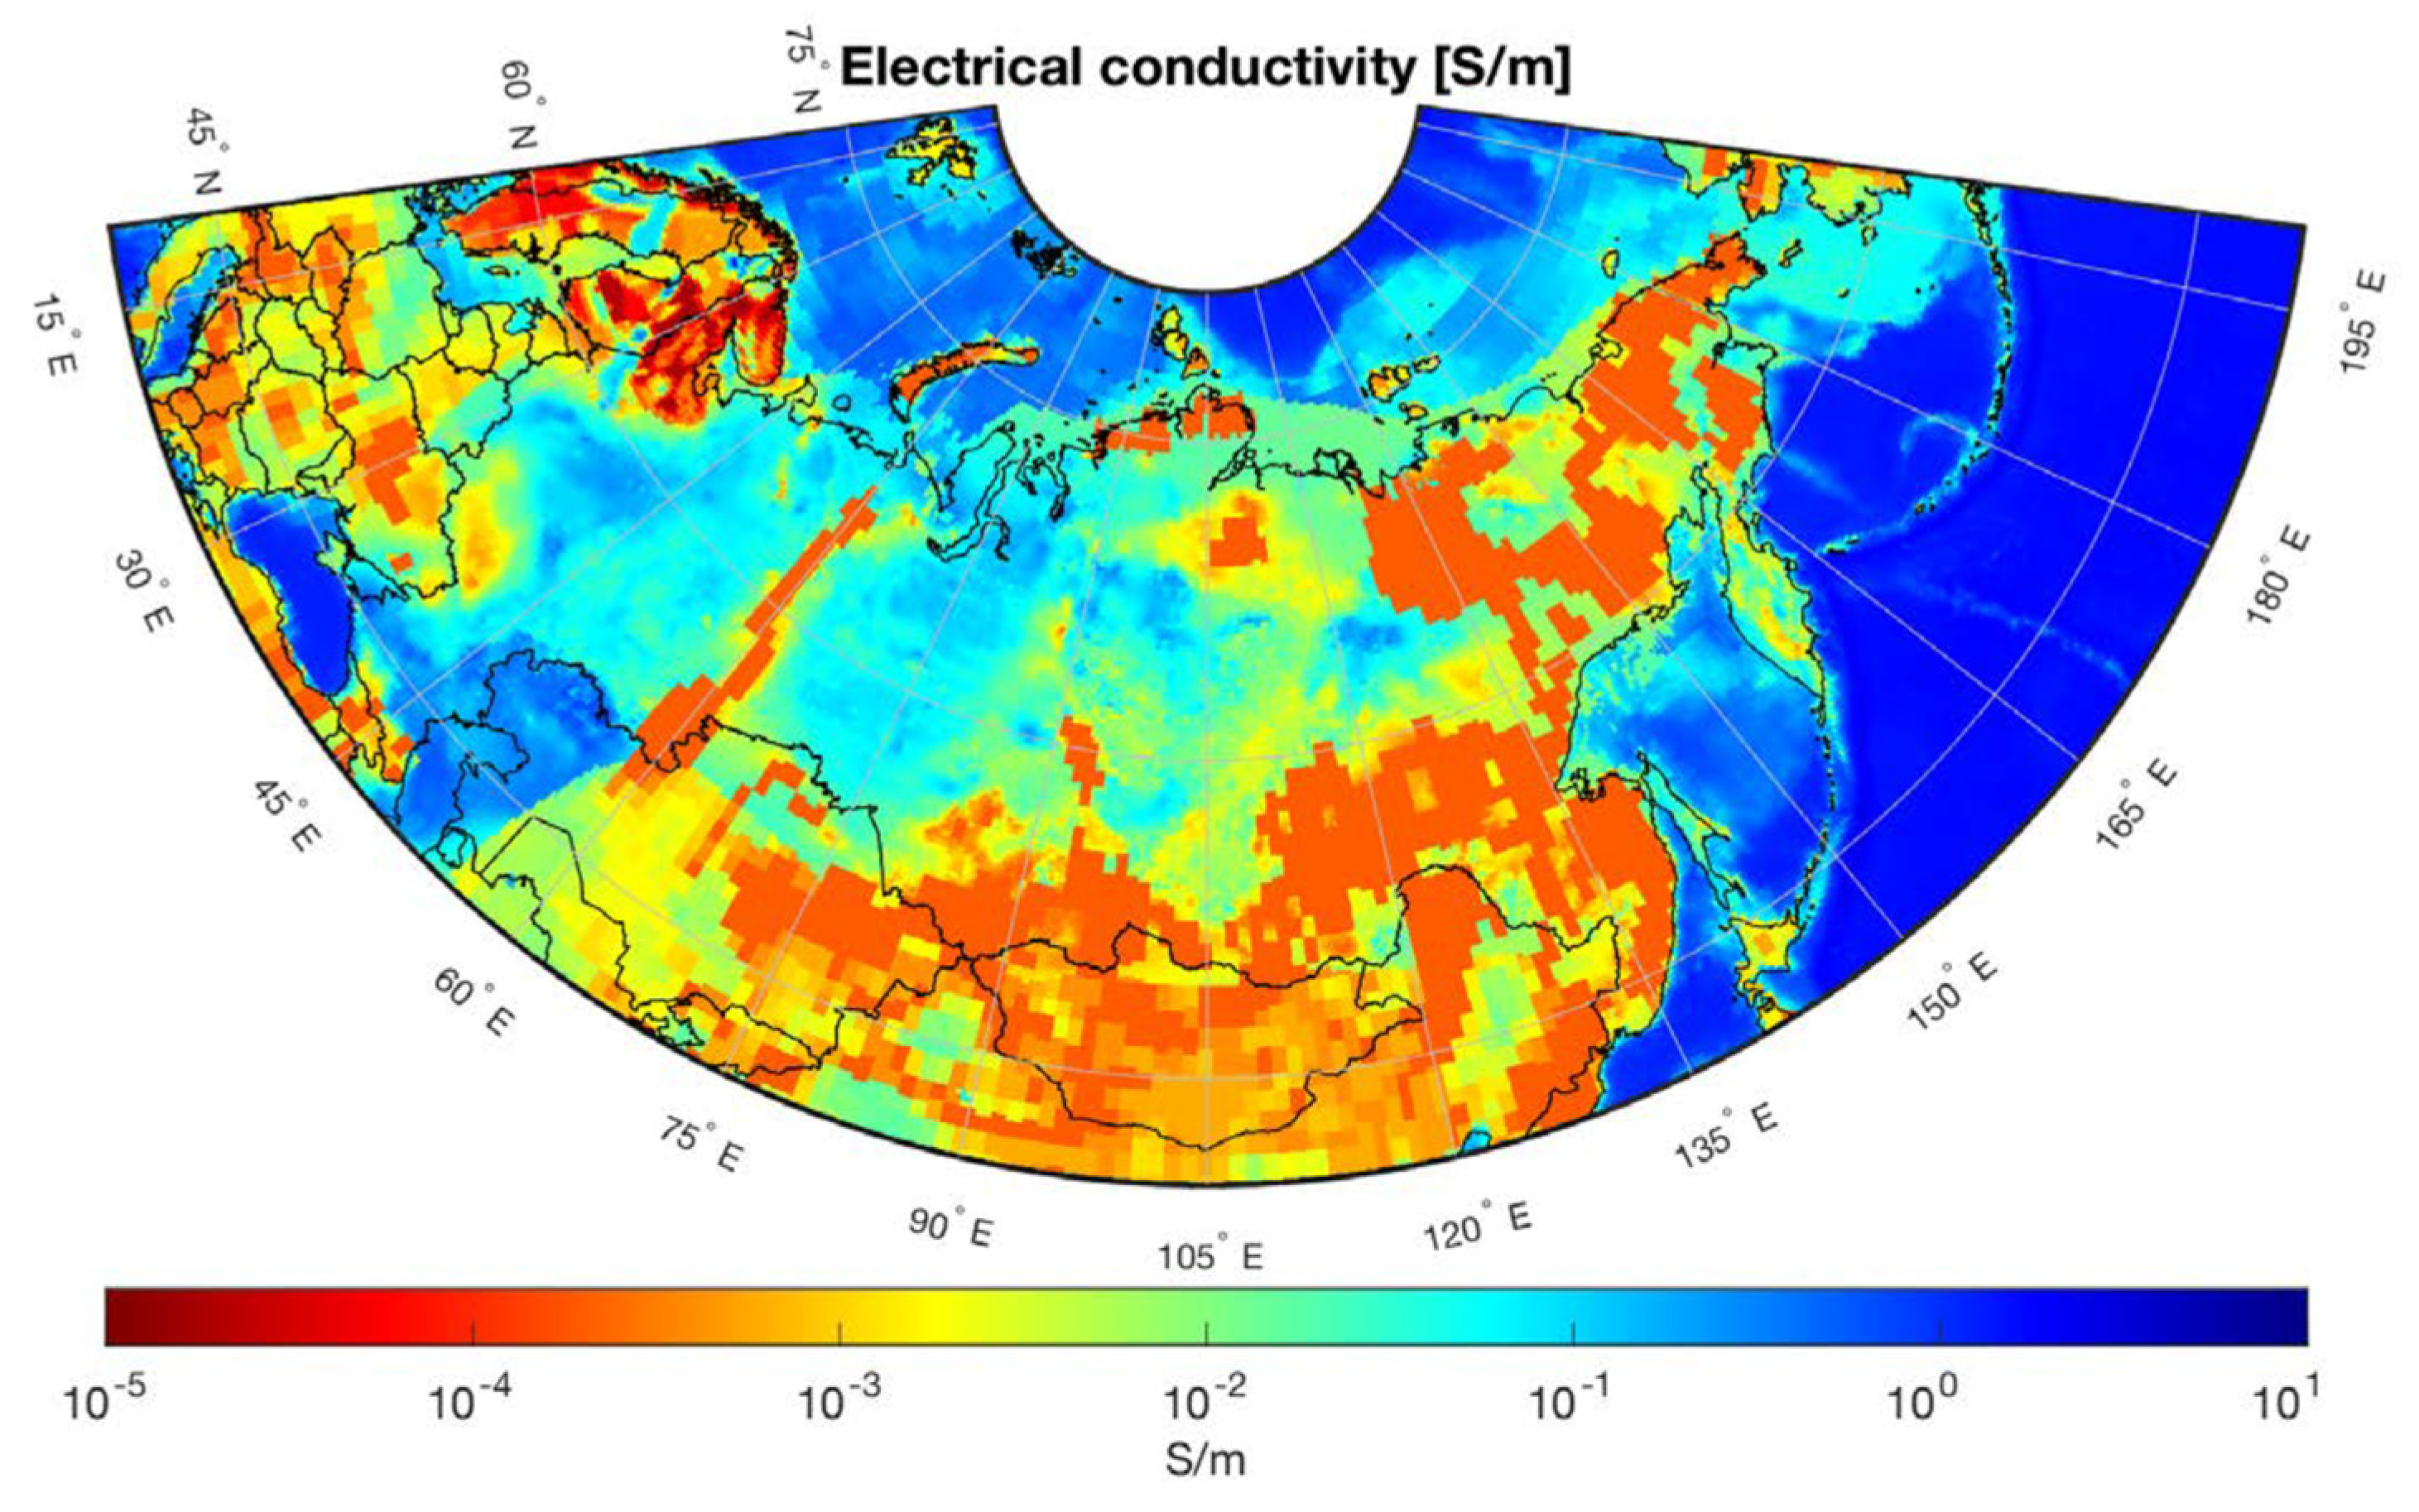
30]. The spatial distribution of the average conductivity in the upper 10 km layer of the Earth’s crust derived from this model for the territory of the Russian Federation is shown in
Figure 9. The lowest conductivities, ~10
−5–10
−4 S/m, correspond to the Precambrian basement outcrops (Fennoscandian Shield) and to the exposed nuclei of the Paleozoic and Mesozoic orogenic structures: Kola Peninsula, Karelia, Urals, Novaya Zemlya, Taimyr, and Chukotka. In the Yamal region covered by thick Mesozoic sedimentary cover, the conductivity is generally quite high.
The spatial distribution of the electric field response to geomagnetic disturbance was calculated from the corresponding impedances using harmonic approximations of geomagnetic disturbances. The simplest approximation of the driving magnetic field was taken in the form of a plane wave with an amplitude of 1 nT and oscillating with a fixed frequency. The magnetic variations were assumed to be in the longitudinal direction, though for the considered 1-D algorithm of the telluric electric field calculation, the actual polarization is not important. The calculation of the electric field according to the available MT impedance was performed on a 0.25° × 0.25° grid using local vertical profiles of conductivity in each node from the model [
30]. The calculated spectral amplitudes were multiplied by the spectral width to obtain the amplitude (in mV/km) of the excited telluric field. The examples given above indicate that the most intense GICs are provided by geomagnetic pulsations with time scales of about 100–1000 s, so these periods were chosen for modeling.
Figure 10 shows a map of the magnitude of synthetic geoelectric fields that could be excited by spatially homogeneous magnetic field variations with
T = 100 s throughout the territory of the Russian Federation. According to this “telluric hazard” map, the highest values of geomagnetically induced fields up to
EH ~ 5 mV/km (normalized to the exciting magnetic field) are typical for the northwest of the Russian Federation. In this region, the magnitudes of the telluric field for different points can differ 3–4 times under the same amplitudes of the magnetic disturbance. In addition, increased values should occur in the Urals. In the Yamal region, the telluric fields are weak, ~0.5 mV/km.
A similar map, but for the driving magnetic disturbance with
T = 1000 s, is shown in
Figure 11. It demonstrates that a lower-frequency variation excites a lower amplitude of telluric currents. The maps in
Figure 9,
Figure 10 and
Figure 11 prove that the geological structure significantly affects the amplitude of geoelectric fields generated by magnetic disturbance. The constructed map of normalized amplitudes of geoelectric responses to external plane-wave geomagnetic excitation provides helpful information for system operators in regard to space weather disturbances.
The horizontal scale of even localized magnetospheric disturbances on the ground (such as magnetic impulses composing Pi3/Ps6 pulsations) is about 200–300 km. For the average resistivity of the crust in the Arctic region of ρ~3–50 Ohm·m, the strong skin-effect condition remains valid for periods under consideration. The impedance approach may cause doubt only for long-period disturbances with time scales 5–20 min above those of high-resistivity regions, such as the Kola Peninsula with ρ~104–105 Ohm·m. In this specific region, the full wave solution of the electromagnetic disturbance structure in the crust may be needed.
Should the PSP changes during strong substorms be taken into account when maintaining the cathodic potential to protect against electrocorrosion? This question may be answered using the constructed map. Different analytical and numerical methods have been elaborated to calculate the induction in a grounded conductor [
34,
35,
36,
37,
38]. Those methods demand prior information on the telluric field intensity, polarization, and spatial structure. According to calculations in [
35], currents in the south of Finland for an electric field of 1.0 V/km should cause a GIC of ~50 A in the pipeline and up to 25 A in its grounding, which, in the case of insulation failure, may well lead to a noticeable enhancement of corrosion. A very crude estimate using the results of the measured PSP in oil pipelines was carried out in [
39]. They showed that the telluric field calculated in the approximation of uniform conductivity is linearly proportional to the measured PSP. The relation found shows that the potential created by telluric fields can exceed the maintained PSP~2 V at
E > 0.5 V/km. According to the constructed map (
Figure 10), applying this result to the Yamal region (the area of oil/gas productive Mesozoic sediments), a geomagnetic disturbance of ~500 nT with a time scale of ~100 s is required to cause a disturbance of PSP menacing the cathodic protection.
6. Conclusions
This paper describes the new freely available database of geomagnetic field monitoring in the Russian Arctic, which may be helpful for fundamental research of the near-Earth space electrodynamics and for practical applications. To assess possible risks associated with space weather phenomena for technological facilities, a thorough analysis of the geoelectric structure of the region is necessary, as inhomogeneities in the distribution of terrestrial electrical conductivity can significantly affect the pattern of GICs and PSPs, modifying their amplitudes and modulating the spectral composition. The constructed map of the distribution of the synthesized telluric fields indicates domains of the Russian Arctic with the most intense responses. The estimates obtained show that the horizontal geoelectric field, induced by harmonic oscillations
B(t) with an amplitude of 1 nT and period of 100 s, varies greatly in magnitude in the range from <1 mV/km to ~120 mV/km. For the considered moderate substorm, the variation in the telluric field in the Yamal Peninsula exceeded 2 V/km. The influence of geomagnetic variations caused by magnetospheric disturbances should be taken into account when maintaining the cathodic protection system of pipelines, as the effect of GIC and PSP can manifest itself both directly during the development of disturbance as failure of the equipment and have a long-term cumulative nature as electrocorrosion or aging of industrial transformers [
40].
The obtained estimates of the possible amplitudes of the geoelectric field can be used in calculating the extreme values of the induced GIC to optimize the cathodic protection of pipelines from the destructive effects of strong geomagnetic disturbances. The constructed map in combination with the Arctic archive of geomagnetic data allows one to quickly assess possible risks to regional infrastructure under various disturbances of the geomagnetic field. Using the proposed magnetic field database and the conductivity model, any researcher can calculate the disturbance of telluric fields in the Russian Arctic for any time period.
The entire database, graphs of magnetograms for quick-look viewing, and maps of telluric fields are freely available on the anonymous FTP site. The database is constantly being supplemented and improved, so the authors will appreciate any suggestions for its improvement and development.
