
Improving a PGNAA Technique to Detect Heavy Metals in Solid Samples

Abstract
:1. Introduction
2. Experimental
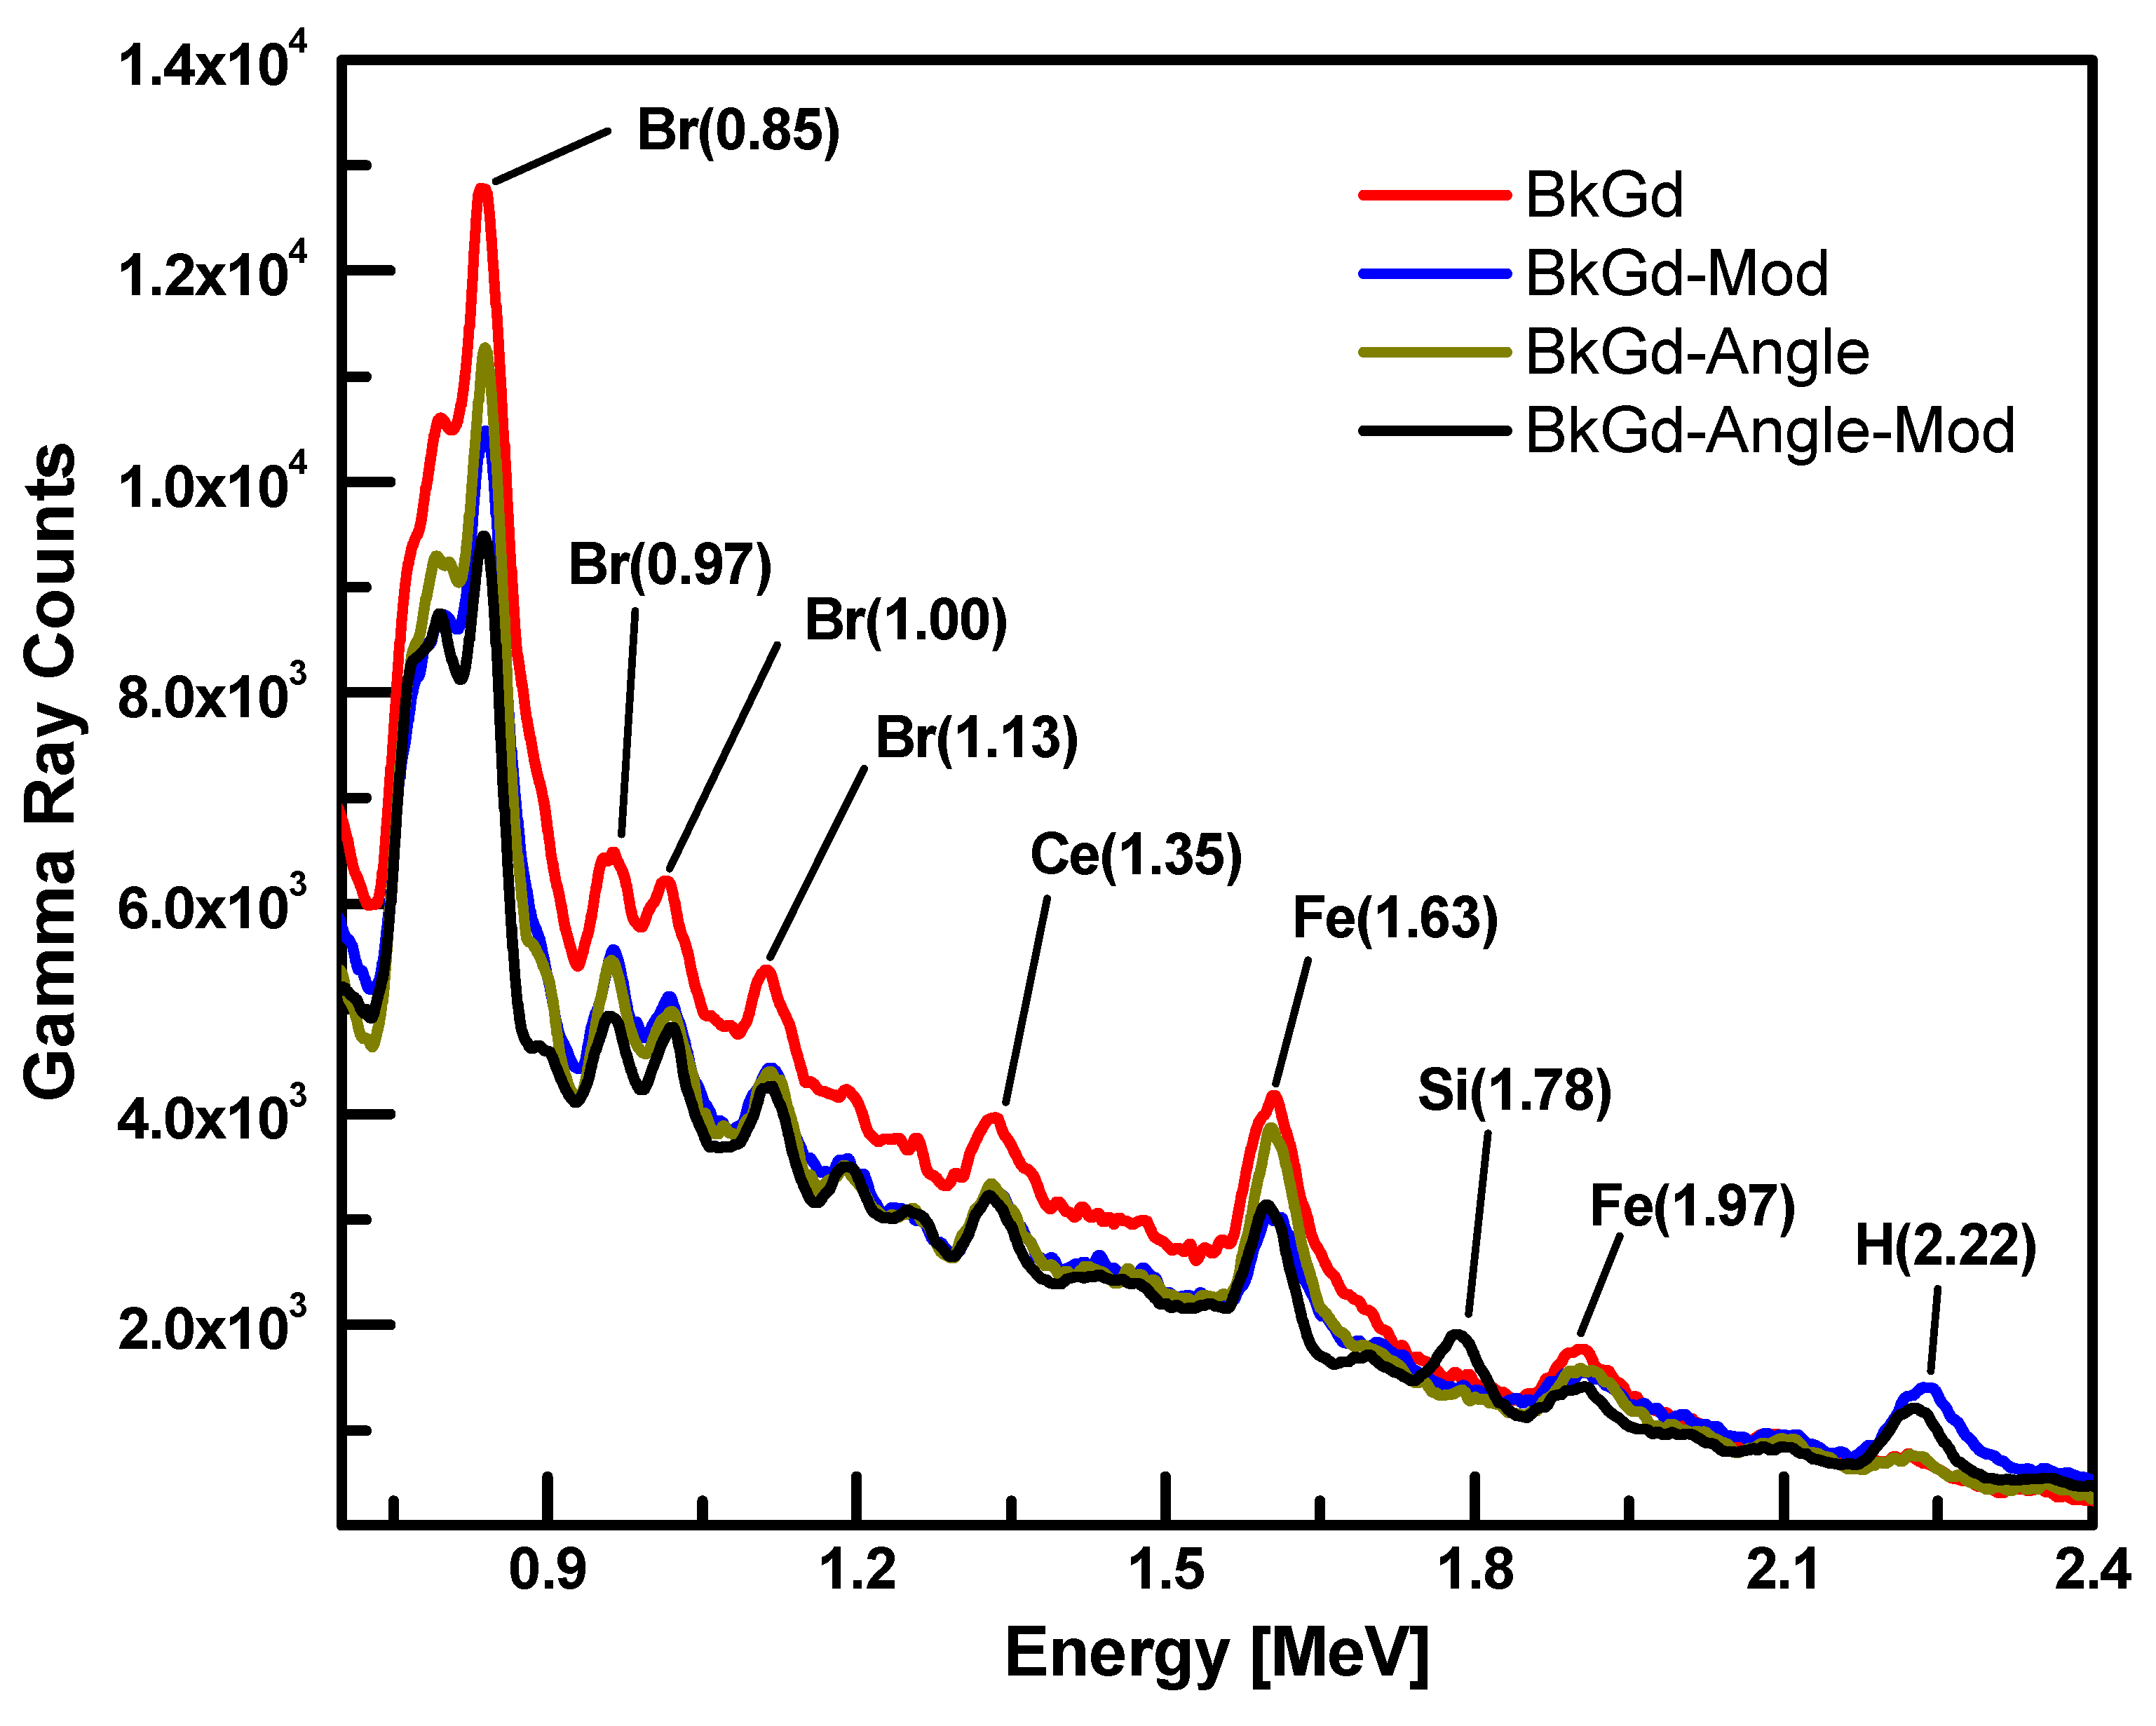
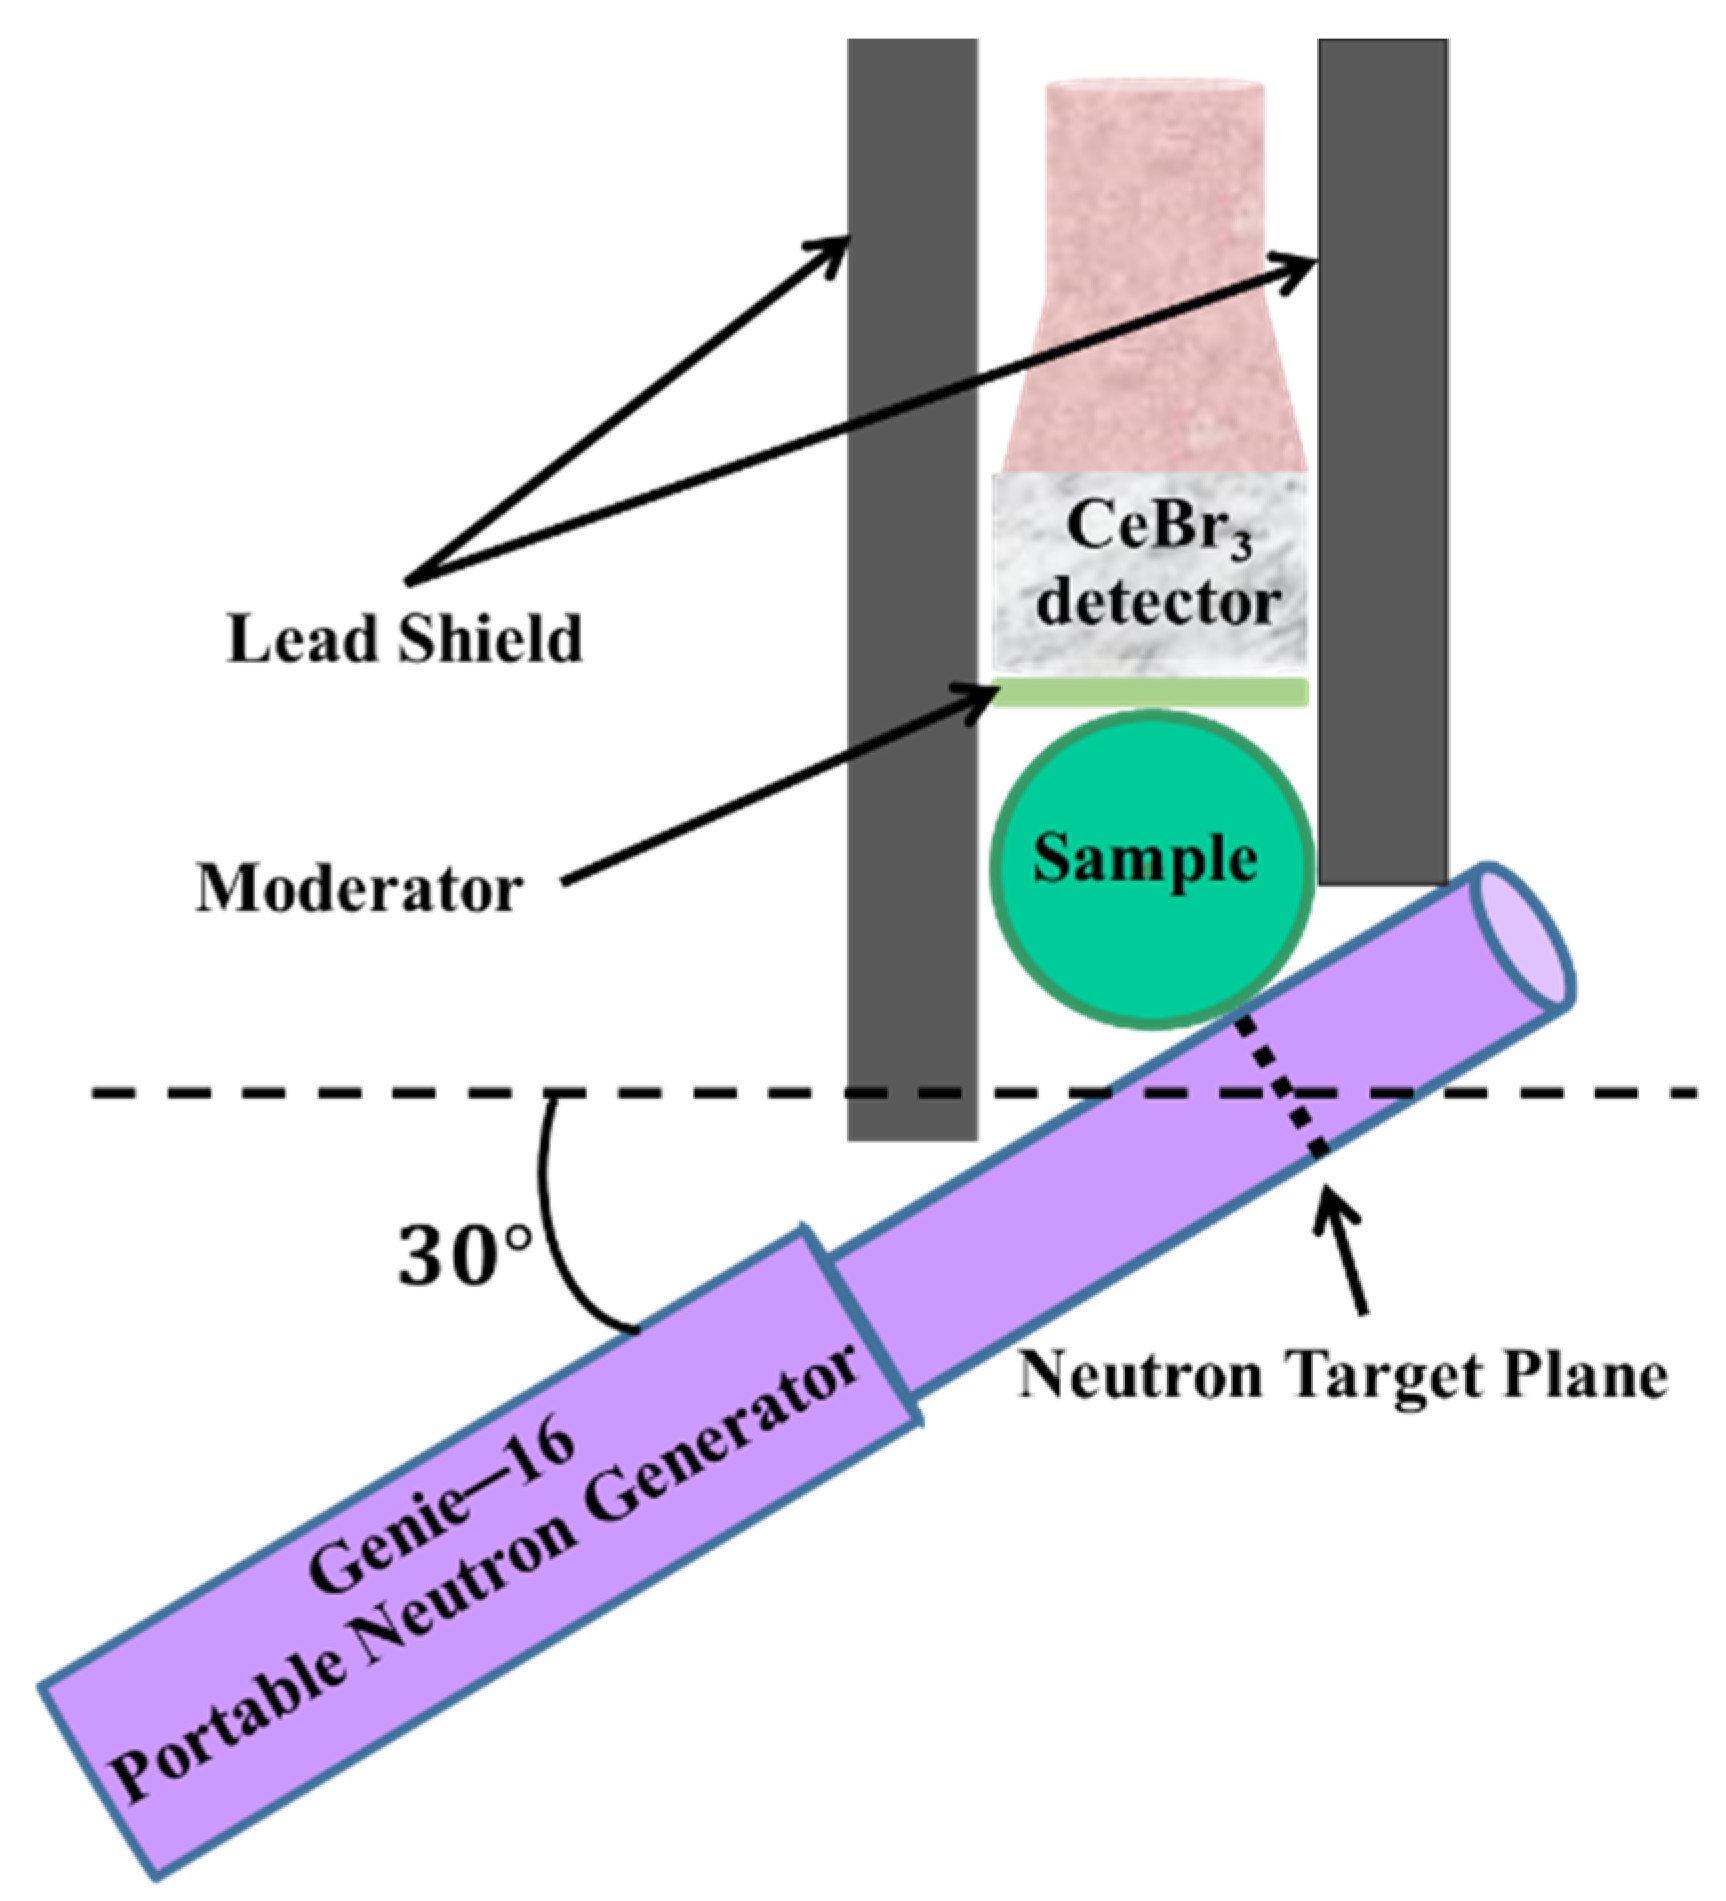
2.1. Optimization
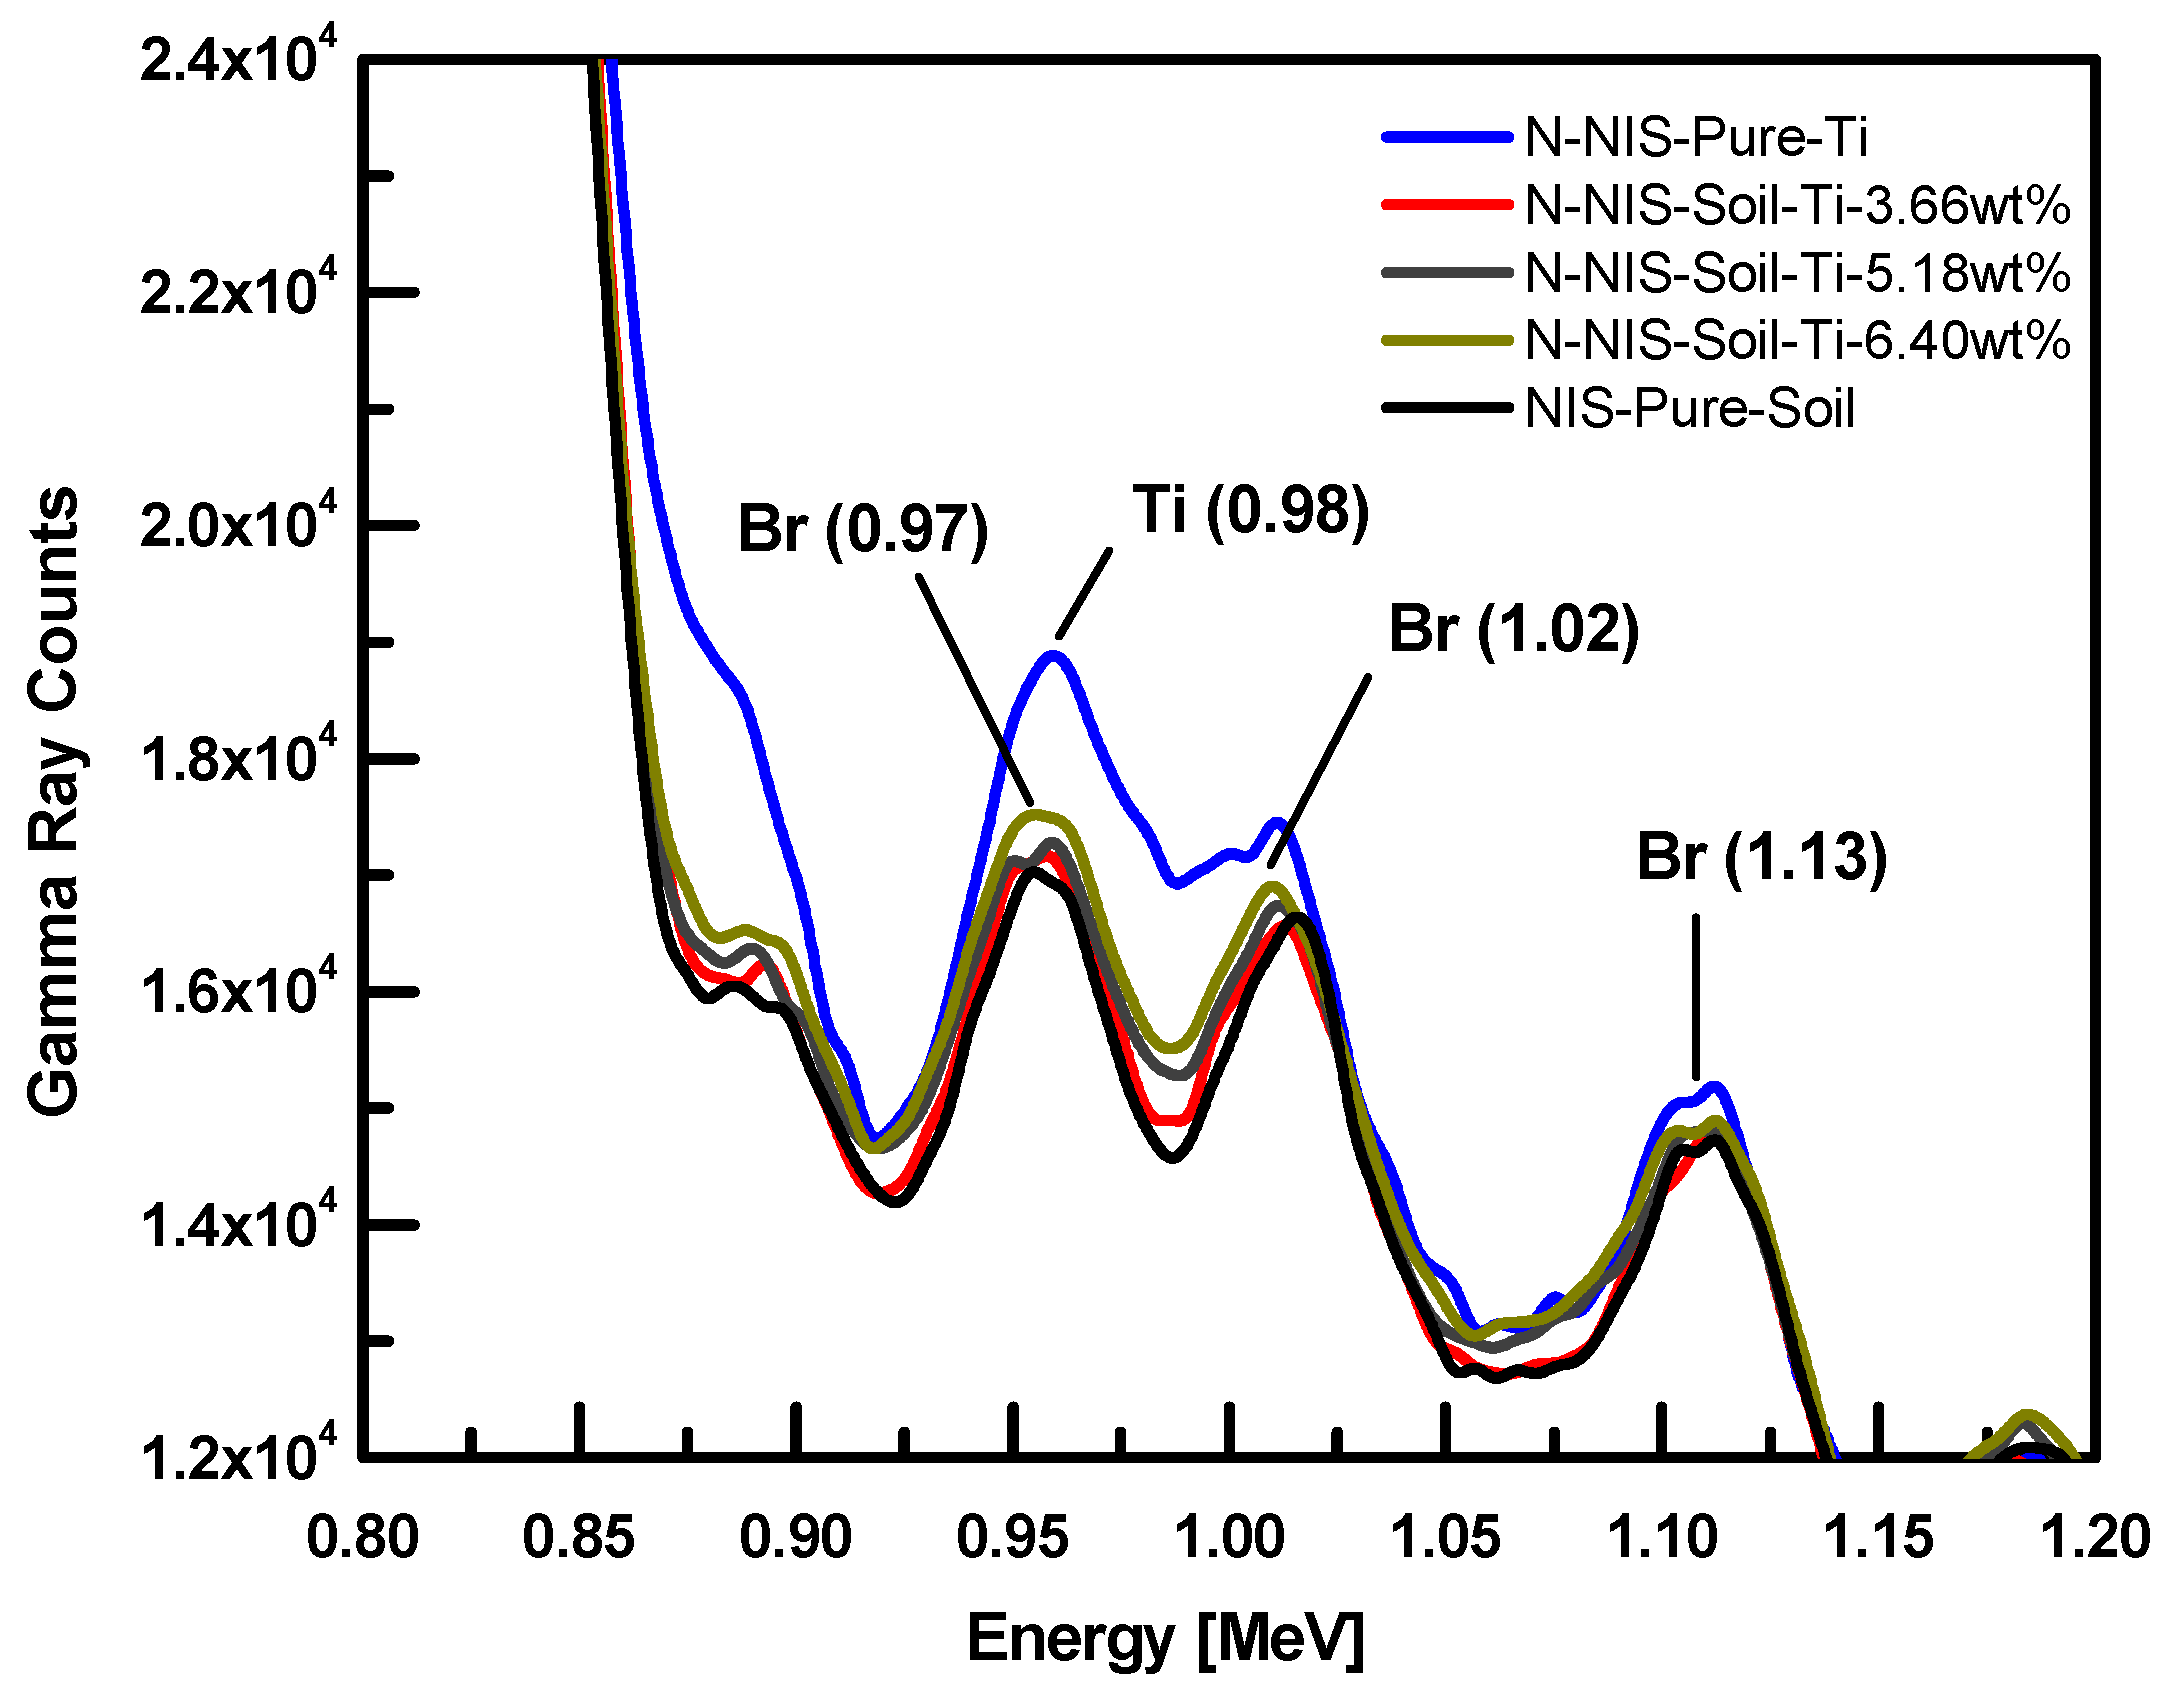
2.2. Sample Preparations
2.3. CeBr3 Detector
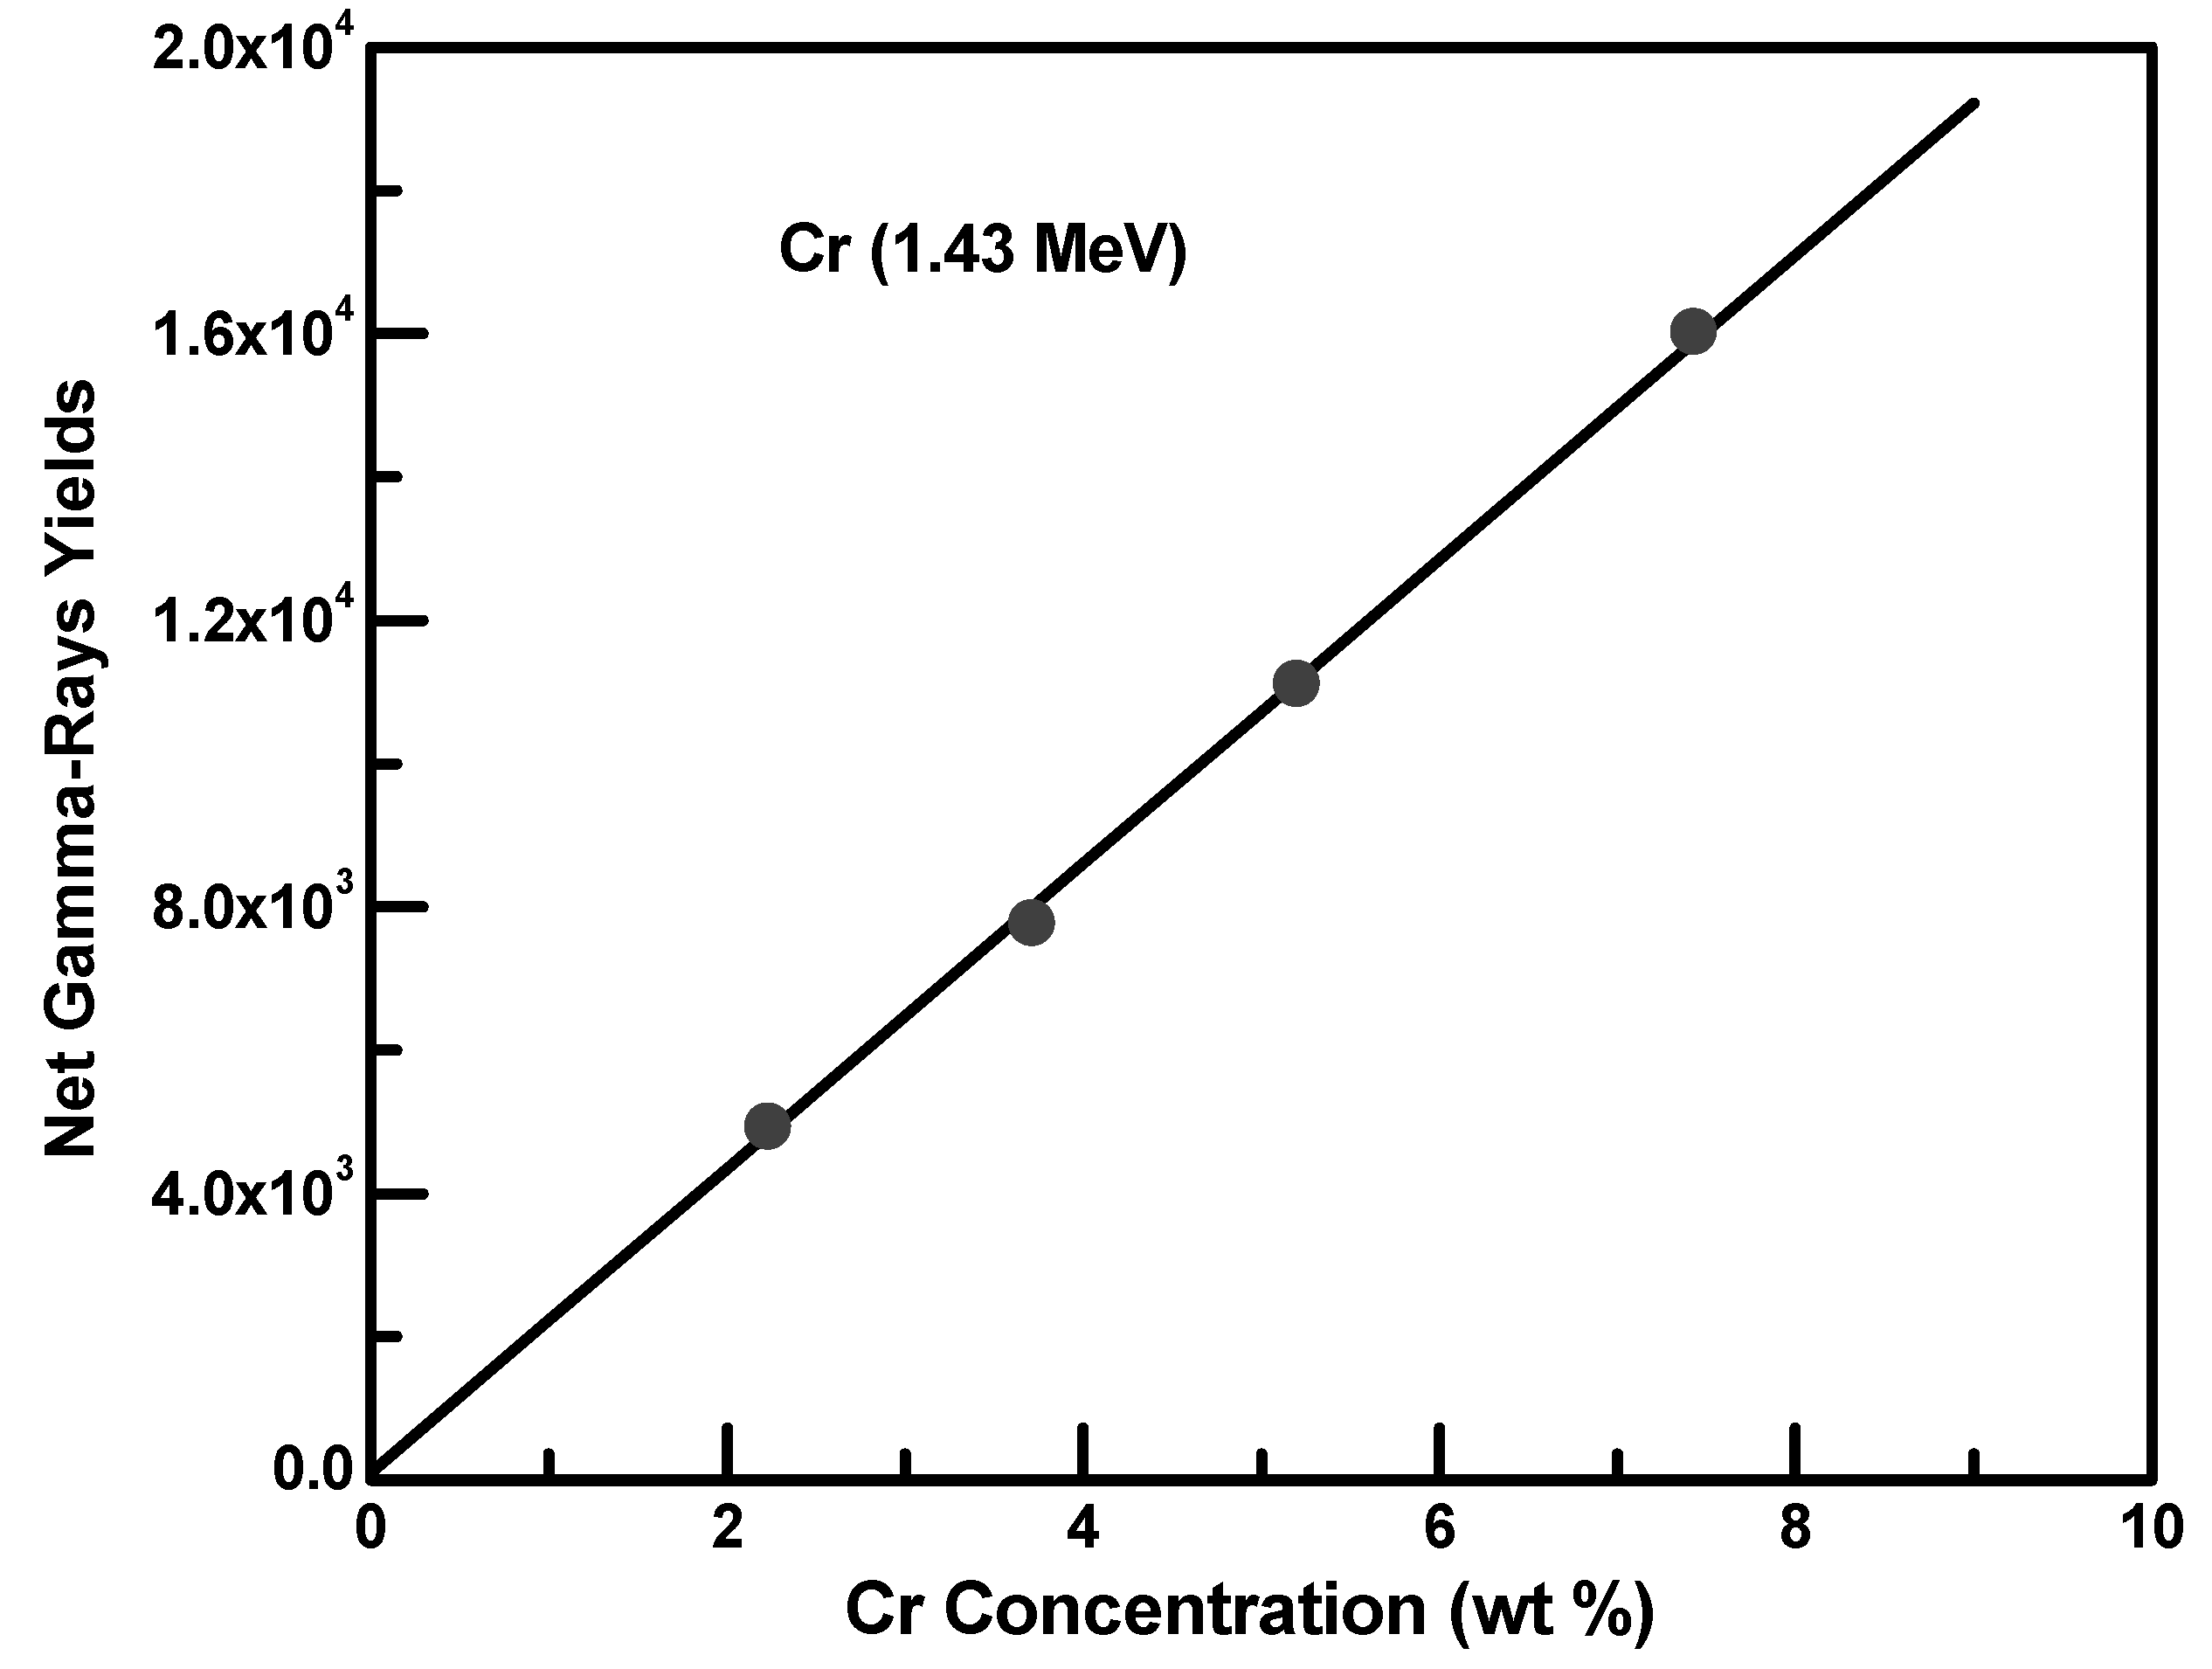
3. Results and Discussions
4. Conclusions
Author Contributions
Funding
Institutional Review Board Statement
Informed Consent Statement
Data Availability Statement
Conflicts of Interest
References
- Lindstrom, R.M. Nuclear analysis at NBS and NIST. J. Radioanal. Nucl. Chem. 2018, 318, 1465–1471. [Google Scholar] [CrossRef]
- Miceli, A.; Festa, G.; Gorini, G.; Senesi, R.; Andreani, C. Pulsed neutron gamma-ray logging in archaeological site survey. Meas. Sci. Technol. 2013, 24, 125903–125908. [Google Scholar] [CrossRef] [Green Version]
- Marchese, N.; Cannuli, A.; Caccamo, M.T.; Pace, C. New generation non-stationary portable neutron generators for biophysical applications of neutron activation analysis. Biochem. Biophys. Acta 2017, 1861, 3661–3670. [Google Scholar] [CrossRef] [PubMed]
- Prompt Gamma Neutron Activation Analysis in Borehole Logging and Industrial Process Control; IAEA-TECDOC-537; International Atomic Energy Agency: Vienna, Austria, 1990.
- Al-Bahi, A.M.; Soliman, A.Y.; Mohamed, N.M.A. Detection of illicit material using neutron activation: Weakness and solutions. J. Radioanal. Nucl. Chem. 2018, 315, 557–564. [Google Scholar] [CrossRef]
- Sun, A.; Jia, W.; Li, J.; Hei, D.; Dai, W.; Cheng, C.; Cai, P.; Tang, Y.; Zhao, D.; Hu, Q. Method for accurate position detection of landmine based on PGNAA technology. J. Radioanal. Nucl. Chem. 2019, 320, 323–328. [Google Scholar] [CrossRef]
- Lupolt, S.N.; Agnew, J.; Burke, T.A.; Kennedy, R.D.; Nachman, K.E. Key considerations for assessing soil ingestion exposures among agricultural workers. J. Expo. Sci Environ. Epidemiol. 2021. Epub ahead of print. [Google Scholar] [CrossRef]
- Durães, N.; Novo, L.A.; Candeias, C.; Silva, E.F. Chapter 2—Distribution, Transport and Fate of Pollutants. In Soil Pollution; Academic Press: Cambridge, MA, USA, 2018; pp. 29–57. ISBN 9780128498736. [Google Scholar]
- Chibuike, G.U.; Obiora, S.C. Heavy metal polluted soils: Effect on plants and bioremediation methods. Appl. Environ. Soil Sci. 2014, 2014, 752708. [Google Scholar] [CrossRef] [Green Version]
- Idowu, G.A.; Olonimoyo, E.A.; Idowu, A.M.; Aiyesanmi, A.F. Impact of gas and oil-fired power plants on proximal water and soil environments: Case study of Egbin power plant, Ikorodu, Lagos State, Nigeria. SN Appl. Sci. 2020, 2, 1352. [Google Scholar] [CrossRef]
- Alloway, B.J.; Ayres, D.C. Chemical Principles of Environmental Pollution, 2nd ed.; Blackie Academic & Professional: London, UK, 1997; pp. 190–217. [Google Scholar]
- Khan, S.; Cao, Q.; Zheng, Y.M.; Huang, Y.Z.; Zhu, Y.G. Health risks of heavy metals in contaminated soils and food crops irrigated with wastewater in Beijing, China. Environ. Pollut. 2008, 152, 686–692. [Google Scholar] [CrossRef]
- Zhang, M.K.; Liu, Z.Y.; Wang, H. Use of single extraction methods to predict bioavailability of heavy metals in polluted soils to rice. Commun. Soil Sci. Plant Anal. 2010, 41, 820–831. [Google Scholar] [CrossRef]
- Duruibe, J.O.; Ogwuegbu, M.O.C.; Egwurugwu, J.N. Heavy metal pollution and human bio toxic effects. Int. J. Phys. Sci. 2007, 2, 112–118. [Google Scholar]
- Greenberg, R.R.; Bode, P.; Fernandes, E.A.D.N. Neutron activation analysis: A primary method of measurement. Spectrochim. Acta Part B At. Spectrosc. 2011, 66, 193–241. [Google Scholar] [CrossRef]
- Maróti, B.; Szentmiklósi, L.; Belgya, T. Comparison of low-energy and coaxial HPGe detectors for prompt gamma activation analysis of metallic samples. J. Radioanal. Nucl. Chem. 2016, 310, 743–749. [Google Scholar] [CrossRef]
- Szentmiklósi, L.; Kis, Z. Characterizing nuclear materials hidden in lead containers by neutron-tomography-driven prompt gamma activation imaging (PGAI-NT). Anal. Methods 2015, 7, 3157–3163. [Google Scholar] [CrossRef]
- Abdelati, M.; Abdelsalam, A.; Mongy, S.E. Design of a novel Nondestructive portable mobile neutron activation system. Measurement 2017, 114, 60–68. [Google Scholar] [CrossRef]
- Liadi, F.A.; Naqvi, A.N.; Khiari, F.Z.; Raashid, M. Phosphorus, sodium and Sulphur measurements in compound samples using 2.5 MeV neutron activation. J. Radioanal. Nucl. Chem. 2022, 331, 1155–1161. [Google Scholar] [CrossRef]
- Naqvi, A.A.; Khiari, F.Z.; Al-Abdallah, T.; Liadi, F.A.; Raashid, M.; Isab, A.A. Detection of sulfur in soil samples using 2.5 MeV neutron activation. J. Radioanal. Nucl. Chem. 2019, 321, 355–360. [Google Scholar] [CrossRef]
- Al-Abdullah, T.; Naqvi, A.A.; Khiari, F.Z.; Raashid, M.; Isab, A.H. Sulfur analysis in bulk samples using a DD portable neutron generator based PGNAA setup. J. Radioanal. Nucl. Chem. 2020, 326, 555–561. [Google Scholar] [CrossRef]
- Jiggins, A.H.; Habbani, F.I. Prompt gamma-ray analysis using 3.29 MeV neutron inelastic scattering. Int. J. Appl. Radiat. Isot. 1976, 27, 689–693. [Google Scholar] [CrossRef]
- Yates, S.W.; Filo, A.J.; Cheng, C.Y.; Coope, D.F. Elemental analysis by gamma-ray detection following inelastic neutron scattering. J. Radioanal. Chem. 1978, 46, 343–355. [Google Scholar] [CrossRef]
- Zhang, C.; Yang, J.; Li, R.; Qiao, Y.; Zhang, X.; Xu, J. Fluka simulation of PGNAA system for determining heavy metal pollution in the soil sample. Nukleonika 2020, 65, 13–17. [Google Scholar] [CrossRef]
- Tian, L.; Zhang, F.; Liu, J.; Wang, X.; Ti, Y. Monte Carlo simulation of Cu, Ni and Fe grade determination in borehole by PGNAA technique. J. Radioanal. Nucl. Chem. 2018, 315, 51–56. [Google Scholar] [CrossRef]
- Genie 16 Neutron Generator. NRC. 2013. Available online: https://www.nrc.gov/docs/ML1408/ML14085A270.pdf (accessed on 3 April 2014).
- Naqvi, A.A.; Khiari, F.Z.; Liadi, F.A.; Khateeb-ur-Rehman; Isab, A.A. Energy resolution measurements of CeBr3 and LaCl3:Ce detectors. J. Radioanal. Nucl. Chem. 2016, 310, 849–855. [Google Scholar] [CrossRef]
- Gedcke, D.A. How Counting Statistics Controls Detection Limits and Peak Precision. ORTEC Application Notes AN59. 2009. Available online: www.ortec-online.com (accessed on 3 April 2014).
- Knoll, G. Radiation Detection and Measurement, 4th ed.; Wiley: New York, NY, USA, 2010. [Google Scholar]
- Bevington, P.R.; Robinson, D.K. Data Reduction and Error Analysis, 3rd ed.; McGraw Hill: New York, NY, USA, 2002; Chapter 6; pp. 98–104. [Google Scholar]


| Optimization | Background | Gross Counts | Net Counts |
|---|---|---|---|
| Zero Angle, No Moderator | 140,057 | 144,589 | 4532 |
| Zero Angle, Moderator | 117,024 | 123,384 | 6360 |
| 30° Angle, No Moderator | 113,087 | 119,939 | 6852 |
| 30° Angle, Moderator | 107,019 | 116,674 | 9655 |
Publisher’s Note: MDPI stays neutral with regard to jurisdictional claims in published maps and institutional affiliations. |
© 2022 by the authors. Licensee MDPI, Basel, Switzerland. This article is an open access article distributed under the terms and conditions of the Creative Commons Attribution (CC BY) license (https://creativecommons.org/licenses/by/4.0/).
Share and Cite
AlMisned, G.; Al-Abdullah, T.; Liadi, F.; Hawsawi, A. Improving a PGNAA Technique to Detect Heavy Metals in Solid Samples. Appl. Sci. 2022, 12, 3714. https://doi.org/10.3390/app12083714
AlMisned G, Al-Abdullah T, Liadi F, Hawsawi A. Improving a PGNAA Technique to Detect Heavy Metals in Solid Samples. Applied Sciences. 2022; 12(8):3714. https://doi.org/10.3390/app12083714
Chicago/Turabian StyleAlMisned, Ghada, Tariq Al-Abdullah, Fatai Liadi, and Adil Hawsawi. 2022. "Improving a PGNAA Technique to Detect Heavy Metals in Solid Samples" Applied Sciences 12, no. 8: 3714. https://doi.org/10.3390/app12083714
APA StyleAlMisned, G., Al-Abdullah, T., Liadi, F., & Hawsawi, A. (2022). Improving a PGNAA Technique to Detect Heavy Metals in Solid Samples. Applied Sciences, 12(8), 3714. https://doi.org/10.3390/app12083714