Article

Deep Learning Applied to Chest Radiograph Classification—A COVID-19 Pneumonia Experience

1
Super Computing Center SENAI/CIMATEC, Av. Orlando Gomes, 1845, Piatã, Salvador 41560-010, Brazil
2
Escola de Administração, Universidade Federal da Bahia, Avenida Reitor Miguel Calmon s/n Vale do-Canela, Salvador 40110-903, Brazil
3
Department of Natural and Earth Sciences, Universidade do Estado da Bahia, Rua Silveira Martins, 2555, Cabula 41150-000, Brazil
4
SAMEDIL—Serviços de Atendimento Médico, Rua Pedro Fonseca, 170-Monte Belo, Vitória 29053-280, Brazil
5
Instituto SENAI de Inovação em Saúde, Av. Orlando Gomes, 1845, Piatã, Salvador 41560-010, Brazil
*
Author to whom correspondence should be addressed.
Appl. Sci. 2022, 12(8), 3712; https://doi.org/10.3390/app12083712
Submission received: 25 February 2022 / Revised: 4 April 2022 / Accepted: 4 April 2022 / Published: 7 April 2022
(This article belongs to the Topic Artificial Intelligence in Healthcare)

Abstract

:

Featured Application

The open-source deep learning algorithm presented in this work can identify anomalous chest radiographs and support the detection of COVID-19 cases. It is a complementary tool to support COVID-19 identification in areas with no access to radiology specialists or RT-PCR tests. We encourage the use of the algorithm to support COVID-19 screening, for educational purposes, as a baseline for further enhancements, and as a benchmark for different solutions. The algorithm is currently being tested in clinical practice in a hospital in Espírito Santo, Brazil.

Abstract

Due to the recent COVID-19 pandemic, a large number of reports present deep learning algorithms that support the detection of pneumonia caused by COVID-19 in chest radiographs. Few studies have provided the complete source code, limiting testing and reproducibility on different datasets. This work presents Cimatec_XCOV19, a novel deep learning system inspired by the Inception-V3 architecture that is able to (i) support the identification of abnormal chest radiographs and (ii) classify the abnormal radiographs as suggestive of COVID-19. The training dataset has 44,031 images with 2917 COVID-19 cases, one of the largest datasets in recent literature. We organized and published an external validation dataset of 1158 chest radiographs from a Brazilian hospital. Two experienced radiologists independently evaluated the radiographs. The Cimatec_XCOV19 algorithm obtained a sensitivity of 0.85, specificity of 0.82, and AUC ROC of 0.93. We compared the AUC ROC of our algorithm with a well-known public solution and did not find a statistically relevant difference between both performances. We provide full access to the code and the test dataset, enabling this work to be used as a tool for supporting the fast screening of COVID-19 on chest X-ray exams, serving as a reference for educators, and supporting further algorithm enhancements.

Graphical Abstract

1. Introduction

The exponential spread of COVID-19 in the world poses substantial challenges for public health services. The disease, caused by the severe acute respiratory syndrome coronavirus 2 (SARS-CoV-2), initially identified in December 2019 in Wuhan, China, causes respiratory tract infections and spreads rapidly through contagion between people, thus overburdening health systems worldwide. It is necessary to evaluate the contagion scenarios and identify as many suspicious cases as possible to define appropriate isolation and treatment strategies [1,2]. Clinically, patients infected with SARS-CoV-2 present fever, cough, dyspnea, muscle aches, and bilateral pneumonia in imaging [3,4]. Even though studies suggest that the Omicron variant has a lower replication competence in human lung, thus reducing the pneumonia occurrence [5], mechanisms for screening and monitoring the evolution of the disease in the lungs are still essential, in the sense that we still do not know how the disease will evolve in the years to come. Imaging in chest radiography or computed tomography (CT) is the most common method to support the diagnosis of pneumonia in symptomatic patients [6]. There are clear recommendations from the WHO (World Health Organization) and the American Radiology Society for the use of imaging only in particular situations, and CT as part of the initial screening stage [7,8,9]. With the progression of the disease in the patient, characteristic chest radiographic patterns become more evident, which allows using X-ray images to support the disease diagnosis and follow-up.
Even with limited resources, many public and private health systems have X-ray machines distributed throughout the country, which makes chest radiography an accessible, fast, and inexpensive alternative for diagnostic screening. In this scenario, an artificial intelligence (AI) system can be a tool to support radiologists or the medical staff directly in a suspected COVID-19 pneumonia patient, especially in areas where no radiology specialist is available [10], and in situations where there is a higher pressure on the health system from a higher demand caused by an epidemic or pandemic situation.
There are many deep learning (DL) algorithms proposed in the literature to detect COVID-19 in radiographs, the majority based on popular convolutional neural networks (CNN) architectures for image classification, such as VGG, Inception, Xception, and Resnet. These algorithms take benefit from the DL characteristic of automatic feature extraction. Nevertheless, learning the features normally requires training the algorithms with a huge amount of annotated images. For a thorough review, please refer to [11,12].
It is difficult to categorize CXR images for COVID-19. The images have few semantic regions (sparsity) and other pulmonary infections generate similar lesions on the lungs, so there is also an inter-class similarity in the images. Recently, some studies that were based on the VGG-16 architecture proposed new methods to enhance feature extraction in CXR images. The work by [13] adopted a novel approach based on the bag of deep visual words (BoDVW) to classify CXR images. The method removes the feature map normalization step and adds the deep features normalization step on the raw feature maps, preserving the semantics of each feature map that might have importance to differentiating COVID-19 from other forms of pneumonia. This method was improved by [14], proposing a multi-scale BoDVW, exploiting three different scales of the pooling layer’s output feature map from a VGG-16 model. The study by [15] used an attention module to capture the spatial relationship between the regions of interest in CXR images. The method produced a classification accuracy of 79.58% in the 3-class problem (COVID vs. No_findings vs. Pneumonia), 85.43% in the 4-class problem (COVID vs. Normal vs. Pneumonia bacteria vs. Pneumonia viral), and 87.49% in the 5-class problem (COVID vs. No_findings vs. Normal vs. Pneumonia bacteria vs. Pneumonia viral).
Despite many algorithms being available for public use, there are still many obstacles to their wide application in clinical practice. A study published in Nature Machine Intelligence [16] systematically reviewed publications of machine learning models for the diagnosis or prognosis of COVID-19 from X-ray or CT images that were published between 1 January 2020 and 3 October 2020. The search identified 2212 studies, of which 415 were included after initial screening, and, after a more rigorous quality screening, 62 studies were included in the systematic review. The conclusion is impressive. None of the models identified are of potential clinical use due to methodological flaws and/or underlying biases. Our review also identified fundamental problems that limit the adoption of algorithms in clinical practice. The source code and the training and testing data are rarely publicly available. It is not possible to replicate the results and evaluate the AI algorithm on different datasets. We noticed that usually, this happens because patient data protection policies prevent the release of data or because there are commercial interests in the developed software tool. Sometimes the researchers provide only part of the source code. In addition, most studies used a limited number of images from local sources and, therefore, their models may not generalize well to other phenotypes and geographic regions’ contexts. Many works used unreliable public datasets for training, did not provide external validation or presented deficient model robustness metrics. Our observations are in line with the findings identified in the studies of [16,17,18]. Table 1 presents the open-source algorithms published in the major peer-reviewed publications to the best of our knowledge. Only two other studies used datasets larger than 25,000 chest X-ray images (CXR) for training, and only one had more than 2000 COVID-19 cases.
We avoided repeating the most common flaws identified in the available studies. We carefully prepared and used a large and multi-centric dataset for training the algorithm. We used an external validation dataset with data carefully labeled by two experienced radiologists and benchmarked our algorithm with a well-known algorithm on the same dataset. We sought to not only validate the hypothesis that supervised AI algorithms applied to chest radiographs can be an alternative for supporting COVID-19 detection, but also to share all the details related to the major methodological decisions taken to develop our proposed solution, providing full access to the code and a valuable annotated external test dataset. Thus, the main contributions of our work are:
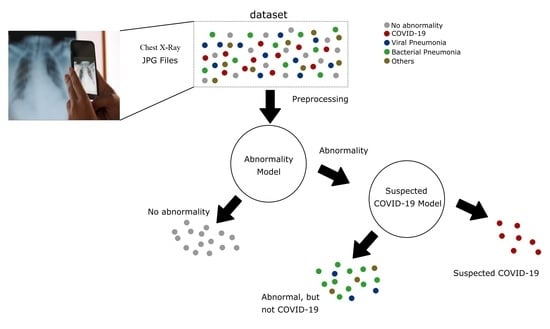
  • The proposal of a new DL system based on the Inception V3 architecture, one that supports the identification of normal and abnormal CXR examinations and the diagnosis of COVID-19.
  • The preparation and publication of an annotated CXR dataset with 1158 images. It is an external validation dataset suitable not only for this but also for future works.
  • The evaluation of the classification metrics of our algorithm in an external validation dataset and a comparison of the performance with a state-of-art algorithm.
  • The guarantee of reproducibility.

2. Materials and Methods

In this work, we present Cimatec_XCOV19, a deep learning system to support the detection of COVID-19 in radiographs. The system is composed of two AI models: one evaluates normal and abnormal examinations, while the second is a binary classifier for being suggestive of COVID-19 or not. Both models are variations of Inception-V3 CNNs [25] trained with pre-processed CXR. Figure 1 shows the system workflow for the evaluation of an image. A CXR image, X, is pre-processed and serves as input for both models simultaneously. The system evaluates the input image in both CNN independently. They have different box colors in the figure. One model evaluates the probability of image X being abnormal, Pabn(X), while the other evaluates the probability of image X being COVID-19, Pcov(X). An outcome suggestive of COVID-19 occurs only when the multiplication of the outputs of the two models is greater than 0.5.
Deep CNNs are often large models and demand much computational power. The widely used Inception-V3 architecture is made of suitably factorized convolutions and aggressive regularization to scale up the networks to efficiently use the available processing capabilities. The model has both symmetric and asymmetric building blocks comprising convolutions layers, average and max pooling operations, concatenation, and fully connected layers. The model uses dropout layers and batch normalization applied to activation inputs. The loss function is a softmax. The Inception architecture innovation is the implementation of inception blocks, which splits the input into different parallel trajectories. There is a concatenation module at the end of the inception blocks to integrate these different paths, as observed in Figure 2. The Supplementary Materials details our network’s architecture, showing the structures in block diagrams. It is possible to notice the modifications they have from a traditional Inception-V3 network.
The dataset was prepared by collecting 44,031 examinations from different sources, mainly from public databases and Brazilian and Spanish healthcare institutions. We did a visual inspection of each database and manually excluded out-of-the-context images and those with bad quality. Table 2, below, details the origins of the datasets.
There were multiple image classifications methods in the datasets. The image tags changed according to the origin of the data. For proper use by the models, we reclassified the CXR labels into three categories: (i) normal, (ii) abnormal, but not COVID-19, and (iii) abnormal, and suggestive of COVID-19. Figure 3 and Figure 4 represent the datasets distributions.
There were 2917 images tagged as COVID-19 (6.7%). This is one of the largest collections of images used to train COVID-19 classifiers, to our knowledge. Before inputting the data into the models, we pre-processed the images for normalization and better feature extraction. A data augmentation process included new images with variations in the gamma contrast, which generated, in total, 132,093 images.
We randomly distributed the dataset to 70% for training, 20% for validation, and 10% for testing, keeping the same distribution of classes from the original dataset. We chose to use a hold-out test dataset instead of doing cross-validation, due to hardware and time constraints. After building a stable system by training and testing it in the general dataset, we did an external validation with a new dataset of CXR from a Brazilian hospital focused on elder people and used explainable AI techniques to show how the algorithms are taking their classification decisions.
During the development of the algorithms, we used one shared computing node with four Nvidia GPUs V100 with 32 MB of memory for each.

2.1. Data Pre-Processing

The system input data are CXR in the JPG format. The source of the images is uncertain. They might come in different formats, usually DICOM or JPG. They also may have different resolutions, sizes, and qualities. To establish a standardization process for the input data, facilitate the model feature extraction and learning, and reduce training time, we perform a pre-processing routine [31]. Three preprocess routines correct the edges of the images, cut a bounding box with the lung area, resize it to 299 × 299 pixels, normalize the data between 0 and 1, and execute a histogram equalization to improve the contrast.
We decided to maintain the standard 299 × 299 pixels image input size of the Inception V3 architecture. A study on the effect of image resolution on DL in radiography by [32], identified that maximum AUCs were achieved at image resolutions between 256 × 256 and 448 × 448 pixels for binary decision networks targeting emphysema, cardiomegaly, hernias, edema, effusions, atelectasis, masses, and nodules. Although the impact of resizing the image in this work is not completely clear, we assumed this resolution had low interference in the feature detection ability of the models.
There are many images with a concentration of pixels in a reduced number of colors, which makes it difficult for the model to identify the inner region of the lung. Therefore, we apply a color histogram equalization to standardize and improve the images, as observed in Figure 5.
To expand the assertiveness of the classification models and their ability for generalization and noise tolerance, we used a technique known as data augmentation. This technique aims to expand the training database of the deep learning models by generating new images from the original dataset, with the intentional introduction of variations in color, brightness contrast, flips, rotations, or spatial distortions. After trying multiple options, we encountered better results when introducing variations in the gamma contrast. In this way, two new images were created from each original image, tripling the training and validation datasets, which generated, in total, 132,093 images.

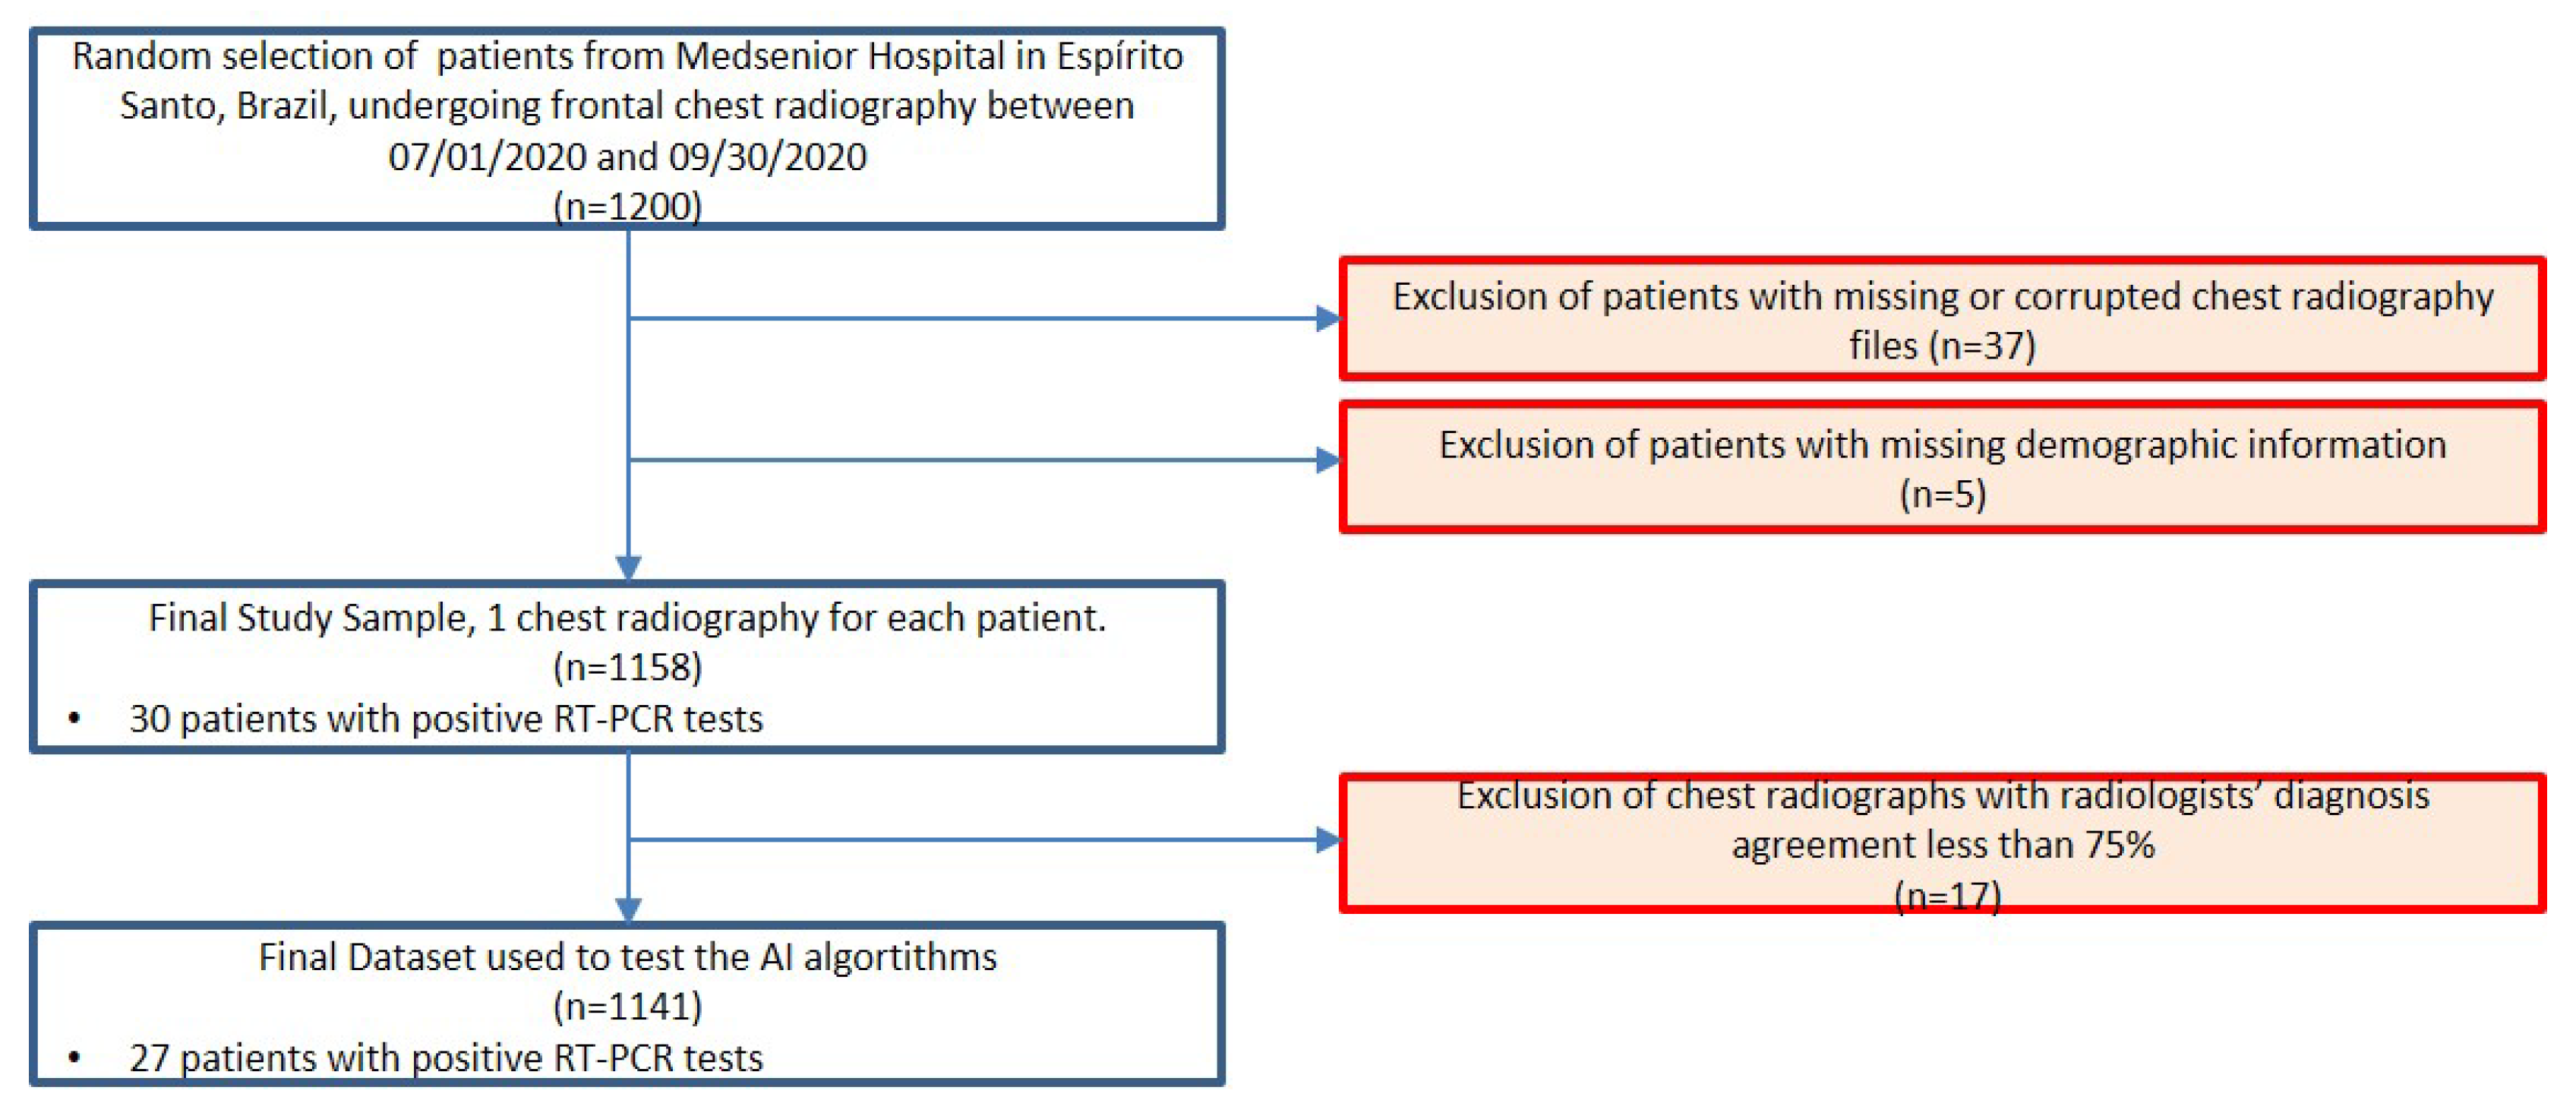
2.2. External Validation Dataset

The test dataset for external validation has frontal chest radiographs from patients from a hospital in Espírito Santo, Brazil, obtained in the period between July and September 2020, during an acute phase of the COVID-19 pandemic. The retrospective study was approved by the Escola Superior de Ciências da Santa Casa de Misericórdia de Vitória—EMESCAM institutional review board (STU# 34311720.8.0000.5065) and was granted a waiver of written informed consent. Figure 6 shows a diagram with the flow of participants. The study sample consisted of 1,158 images, being 830 (71.68%) females, 328 (28.32%) males, with a mean age of 72.56 years ± 10.02 (standard deviation), and 30 cases (2.59%) with a positive RT-PCR test for COVID-19.
Independently, two radiologists (henceforth radiologists A and B), certified by the Brazilian Federal Council of Medicine and by the Brazilian Society of Radiology, both with at least 15 years of practical experience, evaluated the exams. The dataset was randomized and anonymized and accessed via a PACS (picture archiving and communication system), where the radiologists could review the images but had no access to any other clinical data, nor to the review of the other radiologist. They analyzed each image twice at different times and orders. Hence, each image received four diagnoses.
The radiologists issued one of the following seven possible diagnoses: (1) normal examination, (2) severe viral infection, (3) moderate viral infection, (4) mild viral infection, (5) severe bacterial infection, (6) moderate bacterial infection, or (7) mild bacterial infection. We only considered valid a diagnosis with at least three concordant analyses. Of the 1158 images, 1082 (93.43%) had 100% agreement, while 59 cases (5.09%) had 75% agreement. Seventeen images (1.46%) had less than 75% agreement and were excluded from the database. Table 3 presents the radiologists’ analysis of the dataset.
We calculated Cohen’s kappa coefficient of intraobserver and interobserver agreement [33] with a 5% confidence. The intraobserver analysis of radiologist A showed a kappa of 0.847. From the first sampling to the second sampling, radiologist A changed the diagnosis for 13 images. While for radiologist B, the coefficient was 0.507, changing the diagnosis for 66 images. For the interobserver analysis, in the first round, the radiologists differed in 51 diagnoses; the kappa coefficient was 0.595. It increased to 0.699 in the second round, when they only differed in 33 diagnoses. The kappa coefficient varied between moderate and substantial agreement. A complete table with all 1158 diagnoses is available at [34]
According to the radiologists’ agreed diagnosis, 1108 examinations were normal, 19 had a bacterial infection, one had a mild viral infection, and 13 had a moderate or severe viral infection. Interestingly, the 13 cases diagnosed as moderate or severe viral infection correspond to images of patients infected with COVID-19, having tested positive on the RT-PCR test. These results suggest that during a COVID-19 pandemic, it is possible to associate usual diagnoses of moderate and severe viral infection from X-ray examinations with a strong suspicion of COVID-19 infection.

2.3. Benchmark Algorithm

We used the external validation test dataset to evaluate the performance of our AI algorithm and compare it with the results obtained from the same dataset from another public COVID-19 classifier, which we will describe further. We compared the algorithm’s indication of examinations suggestive of COVID-19 with the radiologists’ diagnoses of moderate or severe viral infection.
We chose the DeepCOVID-XR algorithm as the public COVID-19 classifier for benchmarking. The Image and Video Processing Lab (IVPL) at Northwestern University developed the algorithm and shared the code [20]. The DeepCOVID-XR system is an ensemble of six different CNNs, as shown in Figure 7. It uses the entire chest X-ray image and a cropped image with the lung region as the input. Both images are resized to 224 × 224 and 331 × 331 pixels, which amounts to four smaller input images for each X-ray sample in the dataset. The system sends these images into each of the six different previously validated CNN architectures. A weighted average of the predictions from each model produces a single prediction of COVID-19 for each image.
The CNNs were pre-trained on a public dataset with more than 100,000 images before being fitted with images collected from a clinical trial with 14,788 images (4253 positives for COVID-19) using transfer learning. The hold-out test dataset had 2214 images (1192 positives for COVID-19). It generated an 83% accuracy, 75% sensitivity, 93% specificity, and 0.90 AUC ROC (area under curve of receiver operating characteristic).

2.4. Statistical Methods

We calculated the sensitivity and specificity with a confidence interval (CI) of 95% and compared the AUC ROC of the two algorithms with the DeLong test [35]. We used the IBM SPSS 2.8® software to calculate Cohen’s kappa coefficient and the AUC ROC. For the statistical analysis, we used the following Python libraries: sklearn, scipy, and imbalanced learn [36].

3. Results

The Cimatec_XCOV19 system, presented in this study, comprises two CNNs, one to classify the CXR images as normal or abnormal and the other to classify the CXR images as abnormal or suggestive of COVID-19.

3.1. Algorithm Evaluation

To prepare the normal and abnormal classification model, we randomly distributed 70% of the data for training, 20% for validation, and 10% for testing, keeping the same distribution of classes from the original dataset. Figure 8 shows the confusion matrix for the testing dataset.
The model had, overall, an F1 score of 94%, an accuracy of 91%, a sensitivity of 94%, a specificity of 94%, and a precision of 94%. The AUC ROC and PRC (precision-recall curve) curves shown in Figure 9 and Figure 10 complement the results that demonstrate the good performance of this approach. The model has an excellent fit as a screening tool for abnormal images since it generates few false negatives.
Table 3 CNN. We trained it to differentiate an abnormal CXR from a CXR suspicious of COVID-19. We collected the training data from multiple databases, looking to enhance variability, avoiding bias toward a specific one. We used 8493 images, being 70% for training, 20% for validation, and 10% for testing. As observed in the confusion matrix in Figure 11, the model wrongly labeled images as Abnormal in only 3.5% of the COVID-19 image examinations.
The model had an average F1 score of 94%, an accuracy of 94%, a sensitivity of 93%, and a specificity of 96%, which minimizes the possibility that an anomalous image of a patient with COVID-19 is considered non-COVID-19. To complement the results that demonstrate the excellent performance of this module, Figure 12 and Figure 13 show the AUC ROC and PRC curves.
We compared the results of Cimatec_XCOV19 with the published result of the algorithms identified in Table 1. This comparison is only a rough reference, as some of those algorithms were multiclass classifiers and all of them were trained and tested on different datasets. Table 4 shows the results.

3.2. External Validation

We used the 1141 CXR exams with a consensus diagnosis, detailed in Table 3, to perform an external validation. We also used this dataset to compare the performance of our algorithm with the DeepCOVID-XR published open-source algorithm. From the list in Table 1, it was the best fit because it was trained using large datasets, performed external validations, and had rigorous statistical analysis. Another good option would be the algorithm developed by [19] but it missed code documentation.
To evaluate the performance of both AI algorithms, we compared the algorithm´s indication of examinations suggestive of COVID-19 with the radiologists’ diagnoses of moderate or severe viral infection. We expected a worse performance by the AI algorithms than those presented in previous studies, given the variances between the patients’ phenotypes present in the training dataset from those present in the external validation dataset as well as the differences in X-ray images. The quality of X-ray images depends on factors, such as the film quality, type, and the state of the conservation of filters and collimators, exposure time and power (dose), the distance from the beam source to the target, among others [37], but it also varies with the brand and model (year) of the X-ray unit. In particular, resolution and contrast can vary significantly between units. For this reason, it is essential to address the ability of a trained AI to identify patients with COVID-19 using X-ray images obtained with the equipment available in each region. Figure 14 shows the confusion matrix for both algorithms.
The Cimatec_XCOV19 model had a sensitivity of 0.85 (95% CI, 0.54 to 0.97). Only two examinations were false negatives from the 13 abnormal examinations. Specificity was 0.82 (95% CI, 0.80 to 0.84) and the AUC ROC was 0.92 (95% CI, 0.84 to 1). The DeepCOVID-XR had a slightly worst sensitivity of 0.77 (95% CI, 0.46 to 0.94) with three false negatives, but it had a lower false-positive rate, generating a specificity of 0.94 (95% CI, 0.93 to 0.95) and a ROC AUC of 0.97 (95% CI, 0.93 to 0.999). Table 5 presents the algorithms’ performance in the external validation dataset and the performance in the test dataset used in their initial training (previous performance). Both algorithms generalized well for the new dataset.
The DeepCOVID-XR improved its performance in the external validation dataset, confirming the ability to generalize well for images from different regions. We notice a performance decrease in the Cimatec_XCOV19 algorithm specificity and accuracy. Interestingly, there was an increase in sensitivity. Although there is a high number of false positives, it has few false negatives, confirming the algorithm as a good screening tool. As observed in Figure 15, according to the results of DeLong’s test of AUC ROC, z = −0.96 and p = 0.34, we can accept the null hypothesis and conclude that there is no statistically significant difference between the two AUCs.

3.3. Explainability of the AI Models

We asked a radiologist to highlight the findings in four CXRs from the external validation dataset. We compared his findings with the features extracted by the algorithms. Figure 16 provides gradient-weighted class activation mapping heat maps (Grad-CAM) of feature importance for the most representative images from each class of the algorithm’s predictions, thus helping to interpret and explain how each of the AI models performed their predictions. Figure 16a shows the heat maps for the CXR of a male patient, 73 years. It is a true-positive situation for both algorithms. The image label is suggestive of COVID-19. The bounding box highlights infiltrates, and both algorithms classified the image correctly as positive for COVID-19. Figure 16b is a false-positive situation for a 75 years old female patient. Both algorithms incorrectly identified COVID-19 findings in a patient with a moderate bacterial infection. Bounding boxes highlight infiltrates, cardiomegaly, and atelectasis. In Figure 16c, both algorithms correctly did not identify COVID-19 in a normal examination. The patient is female, 58 years old; Figure 16d shows a false-negative situation. Both algorithms failed to identify infiltrates characteristic of viral infection. Bounding boxes highlight cardiomegaly and infiltrates. The patient is female, 83 years old. There are differences in the images’ background color and size because the two AI algorithms use different image pre-processing algorithms.

4. Discussion

The worldwide most available radiographic method to explore lung lesions is still the X-ray examination [38]. In addition, hospitalized patients in intensive care units with suspected COVID-19 pneumonia usually cannot be transported to the radiological centers in the same hospital, however, an X-ray image examination can routinely be performed on the bed of patients. Herein, we detailed the development of a new Inception-V3 based CNN system to support the identification of COVID-19 pneumonia using a chest radiograph. We examined the performance of the algorithms using a dataset from patients treated by a hospital in Espírito Santo, Brazil, during an acute phase of the pandemic and compared it with one previously published algorithm. This study validated in a controlled dataset that the two AI algorithms, Cimatec_XCOV19 and DeepCOVID-XR have, respectively, a specificity of 0.82 and 0.94, a sensitivity of 0.85 and 0.77, and an AUC ROC of 0.92 and 0.97. The performance of both algorithms is good enough to consider them reasonable tools for supporting COVID-19 pneumonia screening. The models generated too many false positives, reinforcing the limitations of the AI systems as a sole diagnostic tool for COVID-19.
The generalization of different datasets is a known problem in AI [39]. This result also reinforces the need for better techniques to adapt the algorithm to the characteristics of new datasets. Advances in the performance of both algorithms might foster the adoption of such systems in scale. In order to facilitate future works and support the development of new AI algorithms in this area, we made all the code freely available [34]. The external validation dataset with labels is also publicly available. They are a good source of images for testing and training new algorithms. The algorithm serves well for educational purposes. We believe that medical staff, under intense work pressure in a pandemic situation, can use the algorithm to help fast screening of COVID-19 cases.
One limitation of this study was the age of the population in the external validation dataset. All patients were older than 50 years and the average age was over 72 years. On one hand, this may limit the ability of the model to extrapolate the analysis to different age groups. Some patients had previous alterations in the chest, though with normal diagnosis. This might represent a bias and could lead to some misclassification of the AI algorithms. Despite this, when we consider that elderly people can be more impacted by COVID-19, these results show that these solutions can be of great help during new COVID-19 pandemic emergences. Furthermore, all of this knowledge, methodology, and source code can be easily applied and adapted to new eventual pandemic situations, by using transfer learning with new data from CXR exams.
The importance of CXR exams is evident as an alternative for supporting COVID-19 fast screening, especially to identify severe cases, as there might be no findings on CXR exams in mild or early-stage COVID-19 patients. AI algorithms can support the detection of pneumonia caused by COVID-19 in chest radiographs, as they are fast, simple, cheap, safe, and a ubiquitous tool for the management of COVID-19 patients. In the absence of a radiologist specialist, Cimatec_XCOV19 and DeepCOVID-XR AI systems might be good tools to support the detection of COVID-19. Future studies should explore other freely available AI models, test new feature extraction techniques, and use the indications of Grad-CAM and other explainable AI techniques to understand and enhance the actual classification algorithms. Cimatec_XCOV19 is now under controlled testing in a hospital in Espírito Santo, Brazil. Feedback from clinical practice will be paramount to evolving the algorithm and mitigating adoption risks.

Supplementary Materials

The following supporting information can be downloaded at: https://www.mdpi.com/article/10.3390/app12083712/s1, Figure S1: Cimatec_XCOV19 normal/abnormal classification model block diagram. Figure S2: Cimatec_XCOV19 COVID-19/abnormal classification model block diagram.

Author Contributions

Conceptualization, A.F. and E.G.S.N.; data curation, A.F., L.A. and T.M.; formal analysis, D.F. and E.G.S.N.; funding acquisition, A.F. and E.G.S.N.; investigation, A.F. and L.A.; methodology, A.F., D.F. and E.G.S.N.; project administration, A.F. and E.G.S.N.; resources, T.M.; software, A.F. and L.A.; supervision, A.F. and E.G.S.N.; validation, R.B. and E.G.S.N.; writing—original draft, A.F.; writing—review and editing, A.F., L.A., D.F., T.M., R.B. and E.G.S.N. All authors have read and agreed to the published version of the manuscript.

Funding

This research was funded by ABDI, SENAI, EMBRAPII, REPSOL SINOPEC BRASIL grant “Missão contra a COVID-19 do Edital de Inovação para a Indústria”.

Institutional Review Board Statement

The retrospective study was conducted in accordance with the Declaration of Helsinki, and approved by the Institutional Review Board (or Ethics Committee) of “Escola Superior de Ciências da Santa Casa de Misericórdia de Vitória—EMESCAM” (STU# 34311720.8.0000.5065 07/08/2020) and was granted a waiver of written informed consent.

Informed Consent Statement

Patient consent was waived in accordance with the evaluation of the Institutional Review Board considering that researchers undertake to maintain confidentiality, not disclosing the names of the participants and, using codes to identify the data generated by them to avoid violating participant privacy.

Data Availability Statement

The model’s source code, the external validation dataset with 1158 CXR images, and a complementary file sheet with the radiologists’ analysis are freely available on the research group GitHub page at https://github.com/CRIA-CIMATEC/covid-19 (accessed on 20 February 2022).

Acknowledgments

We gratefully acknowledge the support of SENAI CIMATEC AI Reference Center and the SENAI CIMATEC/NVDIA AI Joint Center for scientific and technical support, the SENAI CIMATEC Supercomputing Center for Industry Innovation for granting access to the necessary hardware and technical support, Repsol Sinopec Brasil, ABDI, SENAI and EMBRAPII for providing the funding for this research, HP Brazil for providing support, and Hospital Santa Izabel, MedSenior and HM Hospitales for providing data for this research.

Conflicts of Interest

The authors declare no conflict of interest. The funders had no role in the design of the study; in the collection, analyses, or interpretation of data; in the writing of the manuscript, or in the decision to publish the results.

References

  1. Zhu, N.; Zhang, D.; Wang, W.; Li, X.; Yang, B.; Song, J.; Zhao, X.; Huang, B.; Shi, W.; Lu, R.; et al. A Novel Coronavirus from Patients with Pneumonia in China, 2019. N. Engl. J. Med. 2020, 382, 727–733. [Google Scholar] [CrossRef]
  2. Huang, C.; Wang, Y.; Li, X.; Ren, L.; Zhao, J.; Hu, Y.; Zhang, L.; Fan, G.; Xu, J.; Gu, X.; et al. Clinical features of patients infected with 2019 novel coronavirus in Wuhan, China. Lancet 2020, 395, 497–506. [Google Scholar] [CrossRef] [Green Version]
  3. Ai, T.; Yang, Z.; Hou, H.; Zhan, C.; Chen, C.; Lv, W.; Tao, Q.; Sun, Z.; Xia, L. Correlation of Chest CT and RT-PCR Testing for Coronavirus Disease 2019 (COVID-19) in China: A Report of 1014 Cases. Radiology 2020, 296, E32–E40. [Google Scholar] [CrossRef] [Green Version]
  4. Yang, W.; Sirajuddin, A.; Zhang, X.; Liu, G.; Teng, Z.; Zhao, S.; Lu, M. The role of imaging in 2019 novel coronavirus pneumonia (COVID-19). Eur. Radiol. 2020, 30, 4874–4882. [Google Scholar] [CrossRef] [Green Version]
  5. Hui, K.P.Y.; Ho, J.C.W.; Cheung, M.-C.; Ng, K.-C.; Ching, R.H.H.; Lai, K.-L.; Kam, T.T.; Gu, H.; Sit, K.-Y.; Hsin, M.K.Y.; et al. SARS-CoV-2 Omicron variant replication in human bronchus and lung ex vivo. Nature 2022, 603, 715–720. [Google Scholar] [CrossRef]
  6. Pontone, G.; Scafuri, S.; Mancini, M.E.; Agalbato, C.; Guglielmo, M.; Baggiano, A.; Muscogiuri, G.; Fusini, L.; Andreini, D.; Mushtaq, S.; et al. Role of computed tomography in COVID-19. J. Cardiovasc. Comput. Tomogr. 2020, 15, 27–36. [Google Scholar] [CrossRef]
  7. Akl, E.A.; Blažić, I.; Yaacoub, S.; Frija, G.; Chou, R.; Appiah, J.A.; Fatehi, M.; Flor, N.; Hitti, E.; Jafri, H.; et al. Use of Chest Imaging in the Diagnosis and Management of COVID-19: A WHO Rapid Advice Guide. Radiology 2021, 298, E63–E69. [Google Scholar] [CrossRef]
  8. Rubin, G.D.; Ryerson, C.J.; Haramati, L.B.; Sverzellati, N.; Kanne, J.; Raoof, S.; Schluger, N.W.; Volpi, A.; Yim, J.-J.; Martin, I.B.K.; et al. The Role of Chest Imaging in Patient Management during the COVID-19 Pandemic: A Multinational Consensus Statement from the Fleischner Society. Radiology 2020, 296, 172–180. [Google Scholar] [CrossRef] [Green Version]
  9. Simpson, S.; Kay, F.U.; Abbara, S.; Bhalla, S.; Chung, J.H.; Chung, M.; Henry, T.S.; Kanne, J.P.; Kligerman, S.; Ko, J.P.; et al. Radiological Society of North America Expert Consensus Statement on Reporting Chest CT Findings Related to COVID-19. Endorsed by the Society of Thoracic Radiology, the American College of Radiology, and RSNA—Secondary Publication. J. Thorac. Imaging 2020, 35, 219–227. [Google Scholar] [CrossRef]
  10. Shi, H.; Han, X.; Jiang, N.; Cao, Y.; Alwalid, O.; Gu, J.; Fan, Y.; Zheng, C. Radiological findings from 81 patients with COVID-19 pneumonia in Wuhan, China: A descriptive study. Lancet Infect. Dis. 2020, 20, 425–434. [Google Scholar] [CrossRef]
  11. Rahman, S.; Sarker, S.; Al Miraj, A.; Nihal, R.A.; Haque, A.K.M.N.; Al Noman, A. Deep Learning–Driven Automated Detection of COVID-19 from Radiography Images: A Comparative Analysis. Cogn. Comput. 2021. [Google Scholar] [CrossRef]
  12. Abelaira, M.D.C.; Abelaira, F.C.; Ruano-Ravina, A.; Fernández-Villar, A. Use of Conventional Chest Imaging and Artificial Intelligence in COVID-19 Infection. A Review of the Literature. Open Respir. Arch. 2021, 3, 100078. [Google Scholar] [CrossRef]
  13. Sitaula, C.; Aryal, S. New bag of deep visual words based features to classify chest x-ray images for COVID-19 diagnosis. Health Inf. Sci. Syst. 2021, 9, 1–12. [Google Scholar] [CrossRef]
  14. Sitaula, C.; Shahi, T.B.; Aryal, S.; Marzbanrad, F. Fusion of multi-scale bag of deep visual words features of chest X-ray images to detect COVID-19 infection. Sci. Rep. 2021, 11, 1–12. [Google Scholar] [CrossRef]
  15. Sitaula, C.; Hossain, M.B. Attention-based VGG-16 model for COVID-19 chest X-ray image classification. Appl. Intell. 2020, 51, 2850–2863. [Google Scholar] [CrossRef]
  16. Roberts, M.; Covnet, A.; Driggs, D.; Thorpe, M.; Gilbey, J.; Yeung, M.; Ursprung, S.; Aviles-Rivero, A.I.; Etmann, C.; McCague, C.; et al. Common pitfalls and recommendations for using machine learning to detect and prognosticate for COVID-19 using chest radiographs and CT scans. Nat. Mach. Intell. 2021, 3, 199–217. [Google Scholar] [CrossRef]
  17. Born, J.; Beymer, D.; Rajan, D.; Coy, A.; Mukherjee, V.V.; Manica, M.; Prasanna, P.; Ballah, D.; Guindy, M.; Shaham, D.; et al. On the role of artificial intelligence in medical imaging of COVID-19. Patterns 2021, 2, 100269. [Google Scholar] [CrossRef]
  18. López-Cabrera, J.D.; Orozco-Morales, R.; Portal-Diaz, J.A.; Lovelle-Enríquez, O.; Pérez-Díaz, M. Current limitations to identify COVID-19 using artificial intelligence with chest X-ray imaging. Health Technol. 2021, 11, 411–424. [Google Scholar] [CrossRef]
  19. Wang, G.; Liu, X.; Shen, J.; Wang, C.; Li, Z.; Ye, L.; Wu, X.; Chen, T.; Wang, K.; Zhang, X.; et al. A deep-learning pipeline for the diagnosis and discrimination of viral, non-viral and COVID-19 pneumonia from chest X-ray images. Nat. Biomed. Eng. 2021, 5, 509–521. [Google Scholar] [CrossRef]
  20. Wehbe, R.M.; Sheng, J.; Dutta, S.; Chai, S.; Dravid, A.; Barutcu, S.; Wu, Y.; Cantrell, D.R.; Xiao, N.; Allen, B.D.; et al. DeepCOVID-XR: An Artificial Intelligence Algorithm to Detect COVID-19 on Chest Radiographs Trained and Tested on a Large U.S. Clinical Data Set. Radiology 2021, 299, E167–E176. [Google Scholar] [CrossRef]
  21. Jiao, Z.; Choi, J.W.; Halsey, K.; Tran, T.M.L.; Hsieh, B.; Wang, D.; Eweje, F.; Wang, R.; Chang, K.; Wu, J.; et al. Prognostication of patients with COVID-19 using artificial intelligence based on chest x-rays and clinical data: A retrospective study. Lancet Digit. Health 2021, 3, e286–e294. [Google Scholar] [CrossRef]
  22. Wang, L.; Lin, Z.Q.; Wong, A. COVID-Net: A tailored deep convolutional neural network design for detection of COVID-19 cases from chest X-ray images. Sci. Rep. 2020, 10, 19549. [Google Scholar] [CrossRef]
  23. Narin, A.; Kaya, C.; Pamuk, Z. Automatic detection of coronavirus disease (COVID-19) using X-ray images and deep convolutional neural networks. Pattern Anal. Appl. 2021, 24, 1207–1220. [Google Scholar] [CrossRef]
  24. Ozturk, T.; Talo, M.; Yildirim, E.A.; Baloglu, U.B.; Yildirim, O.; Acharya, U.R. Automated detection of COVID-19 cases using deep neural networks with X-ray images. Comput. Biol. Med. 2020, 121, 103792. [Google Scholar] [CrossRef]
  25. Szegedy, C.; Vanhoucke, V.; Ioffe, S.; Shlens, J.; Wojna, Z. Rethinking the Inception Architecture for Computer Vision. In Proceedings of the IEEE Computer Society Conference on Computer Vision and Pattern Recognition, Las Vegas, NV, USA, 26 June–1 July 2016; pp. 2818–2826. [Google Scholar] [CrossRef] [Green Version]
  26. AAnaya-Isaza, A.; Mera-Jiménez, L.; Zequera-Diaz, M. An overview of deep learning in medical imaging. Informatics Med. Unlocked 2021, 26, 100723. [Google Scholar] [CrossRef]
  27. RSNA Pneumonia Detection Challenge. 2018. Available online: https://www.rsna.org/education/ai-resources-and-training/ai-image-challenge/RSNA-Pneumonia-Detection-Challenge-2018 (accessed on 12 February 2022).
  28. Bustos, A.; Pertusa, A.; Salinas, J.-M.; de la Iglesia-Vayá, M. PadChest: A large chest x-ray image dataset with multi-label annotated reports. Med Image Anal. 2020, 66, 101797. [Google Scholar] [CrossRef]
  29. De la Iglesia Vayá, M.; Saborit, J.M.; Montell, J.A.; Pertusa, A.; Bustos, A.; Cazorla, M.; Galant, J.; Barber, X.; Orozco-Beltrán, D.; García-García, F.; et al. BIMCV COVID-19+: A Large Annotated Dataset of RX and CT Images from COVID-19 Patients. Available online: https://arxiv.org/abs/2006.01174v3 (accessed on 12 February 2022).
  30. Cohen, J.P.; Morrison, P.; Dao, L.; Roth, K.; Duong, T.Q.; Ghassemi, M. COVID-19 Image Data Collection: Prospective Predictions Are the Future. Available online: https://github.com/ieee8023/covid-chestxray-dataset (accessed on 20 February 2022).
  31. LeCun, Y.A.; Bottou, L.; Orr, G.B.; Müller, K.R. Efficient BackProp. In Neural Networks: Tricks of the Trade. Lecture Notes in Computer Science; Montavon, G., Orr, G.B., Müller, K.R., Eds.; Springer: Berlin, Heidelberg, Germany, 2012; Volume 7700. [Google Scholar] [CrossRef]
  32. Sabottke, C.F.; Spieler, B.M. The Effect of Image Resolution on Deep Learning in Radiography. Radiol. Artif. Intell. 2020, 2, e190015. [Google Scholar] [CrossRef]
  33. Landis, J.R.; Koch, G.G. The Measurement of Observer Agreement for Categorical Data. Biometrics 1977, 33, 159–174. [Google Scholar] [CrossRef] [Green Version]
  34. Cimatec_XCOV19 Git Page. Available online: https://github.com/CRIA-CIMATEC/covid-19 (accessed on 10 December 2020).
  35. Delong, E.R.; Delong, D.M.; Clarke-Pearson, D.L. Comparing the Areas under Two or More Correlated Receiver Operating Characteristic Curves: A Nonparametric Approach. Biometrics 1988, 44, 837–845. [Google Scholar] [CrossRef]
  36. Lemaître, G.; Nogueira, F.; Aridas, C.K. Imbalanced-learn: A Python Toolbox to Tackle the Curse of Imbalanced Datasets in Machine Learning. J. Mach. Learn. Res. 2017, 18, 1–5. Available online: http://jmlr.org/papers/v18/16-365.html (accessed on 28 August 2021).
  37. Winston, J.; Jackson, D.; Wozniak, D.; Zeisler, J.; Farish, S.; Thoma, P. Quality Control recommendations for diagnostic radiography volume 3 radiographic or fluoroscopic. In Radiographic or Fluoroscopic Machines; CRCPD Publication: Frankfort, KY, USA, 2001; Volume 3. [Google Scholar]
  38. Zhou, J.; Jing, B.; Wang, Z.; Xin, H.; Tong, H. SODA: Detecting COVID-19 in Chest X-rays with Semi-supervised Open Set Domain Adaptation. IEEE/ACM Trans. Comput. Biol. Bioinform. 2021. [Google Scholar] [CrossRef]
  39. Rajpurkar, P.; Joshi, A.; Pareek, A.; Ng, A.Y.; Lungren, M.P. CheXternal: Generalization of deep learning models for chest X-ray interpretation to photos of chest X-rays and external clinical settings. In Proceedings of the Conference on Health, Inference, and Learning, Virtual, 8–9 April 2021. [Google Scholar] [CrossRef]
Figure 1. Cimatec_Xcov19 workflow of DL models for COVID-19 classification.
Applsci 12 03712 g001
Figure 2. (a) Inception block formed by four convolutional trajectories for the same input. (b) General structure of the network with all the elements. Reprinted with permission from Ref. [26]. 2021, Andrés Anaya-Isaza, Leonel Mera-Jiménez, Martha Zequera-Diaz.
Applsci 12 03712 g002
Figure 3. Dataset breakdown.
Applsci 12 03712 g003
Figure 4. Dataset class distribution.
Applsci 12 03712 g004
Figure 5. Histogram equalization example.
Applsci 12 03712 g005
Figure 6. Flowchart for patient inclusion in the external validation dataset.
Applsci 12 03712 g006
Figure 7. The general architecture of the DeepCOVID-XR deep learning weighted average prediction algorithm [20].
Applsci 12 03712 g007
Figure 8. Normal/Abnormal model Confusion Matrix for the test dataset.
Applsci 12 03712 g008
Figure 9. AUC ROC graph for the Normal/Abnormal classifier.
Applsci 12 03712 g009
Figure 10. AUC PRC graph for the Normal/Abnormal classifier.
Applsci 12 03712 g010
Figure 11. Confusion Matrix for COVID-19/Abnormal classification model.
Applsci 12 03712 g011
Figure 12. AUC graph for the COVID-19/Abnormal classifier.
Applsci 12 03712 g012
Figure 13. PRC graph for the COVID-19/Abnormal classifier.
Applsci 12 03712 g013
Figure 14. Confusion matrices for (a) CIMATEC_XCOV19; (b) DeepCOVID-XR.
Applsci 12 03712 g014
Figure 15. AUC ROC comparison using DeLong’s test.
Applsci 12 03712 g015
Figure 16. Heat maps for (a) True positive. Bounding box highlights infiltrates. The patient is male, 73 years old; (b) False positive. Bounding boxes highlight infiltrates, cardiomegaly, and atelectasis. The patient is female, 75 years old; (c) True negative. Bounding box highlights infiltrates. The patient is female, 58 years old; (d) False negative. Bounding boxes highlight cardiomegaly and infiltrates. The patient is female, 83 years old.
Applsci 12 03712 g016
Table 1. A partial list of DL algorithms based on COVID-19 radiographs with publicly available code.
Ref.ObjectiveBase ModelTraining Dataset
(# of CXR)
External Validation Dataset (# of CXR)
[19]Detect common thoracic diseaseDenseNet-121120,70224,500
[19]Diagnose COVID-19 and multiclass classificationDenseNet-12127,825/1571 1China 1899/98 1
China 1034
Ecuador 650/132 1
[20]Detect COVID-19 pneumoniaEnsemble of CNN: Densenet-121, Resnet-50, Inception, Inception-Resnet, Xcepton, EfficientNet-B2Pre-training: NIH-CXR14 dataset >100,000
Fine-tunning: 14,788/4253 1
2214 images/1192 1
[21]Predict COVID-19 severity and progressionVGG-11 and EfficientNet-B01834 all COVID-19 patients475
[22]Detect COVID-19 casesCOVID-Net CNN13,975/358 1300/100 1
[23]Detect COVID-19 (3 binary classifiers)ResNet-507406/3411N/A 2
[24]Detect COVID-19 and Multiclass ClassificationDarkNet-191125/125 1N/A 2
This workDetect COVID-19Inception-V344,031/2917 11158/13 1
1 COVID-19 infection. 2 Did not use external validation. Used 20% of data for testing/5-fold cross-validation.
Table 2. Datasets description and number of images.
DatasetDescription# of CXR
RSNA Pneumonia Detection Challenge [27]Images labeled by the Society for Thoracic Radiology and MD.ai for pneumonia cases found in the chest radiograph database made public by the National Institutes of Health (NIH).25,497
BIMCV PadChest [28]Digital Medical Image Bank of the Valencian Community. Images were interpreted and reported by radiologists at Hospital San Juan (Spain) from 2009 to 2017.14,252
BIMCV COVID-19 [29]Digital Medical Image Bank of the Valencian Community related to COVID-19 cases.1762
HM HospitalesCXR images from patients from the HM Hospitales group in different cities in Spain. Private Dataset.1277
COVID-19 Image Data Collection [30]Data was collected from public sources, as well as through indirect collection from hospitals and doctors organized by a researcher from the University of Montreal.613
HC USP CompetitionImages obtained from patients from the HC hospital in São Paulo used for a competition. Private Dataset.593
Hospital Santa IzabelImages interpreted and reported by radiologists at Hospital Santa Izabel, Salvador, Bahia, Brazil. Private Dataset.37
Table 3. Characteristics of Patients of the External Validation Dataset.
ParameterNumber of ExaminationsAge(y)SexPositive
RT-PCR Test
All Patients115872.56 ± 10.02830 female30
Radiologists’ Diagnosis Breakdown
Lack of Consensus
(agreement < 75%)
1774.35 ± 9.3810 female3
Normal110872.32 ± 9.94802 female12
Mild Viral Infection1711 male1
Moderate Viral Infection378.67 ± 10.012 female3
Severe Viral Infection1081 ± 6.555 female10
Mild Bacterial Infection978.11 ± 11.866 female1
Moderate Bacterial Infection778.43 ± 9.814 male0
Severe Bacterial Infection385.67 ± 16.442 female0
Table 4. Table comparing Cimatec_XCOV19 metrics with other algorithms.
Ref.NameAccuracySensitivitySpecificityROCPRC
[19]Wang et al.N/A 10.930.870.97N/A
[20]DeepCOVID-XR0.900.750.930.83 N/A
[22]COVID-Net0.930.91N/AN/AN/A
[23]Narin etal (Resnet50)111N/AN/A
[24]DarkCovidNet0.980.950.91N/AN/A
This workCimatec_XCOV190.940.930.960.980.96
1 N/A—Not available results.
Table 5. Comparison of metrics between the Cimatec_XCOV19 and DeepCOVID-XR algorithms.
Metrics for “
Suggestive of COVID-19
Infection”
Cimatec_XCOV19
Performance on the
External Validation Dataset
Cimatec_XCOV19
Previous Performance
DeepCOVID-XR
Performance on the External Validation Dataset
DeepCOVID-XR
Previous Performance
Sensitivity0.850.930.770.75
Specificity0.820.960.940.93
Accuracy0.820.940.940.83
AUC ROC0.930.980.970.90
AUC PRC0.480.960.7NA
Publisher’s Note: MDPI stays neutral with regard to jurisdictional claims in published maps and institutional affiliations.

