
Characterization in Relevant Icing Conditions of Two Superhydrophobic Coatings


Abstract
:
1. Introduction
2. Materials and Methods
3. Results
3.1. Coatings’ Characterization
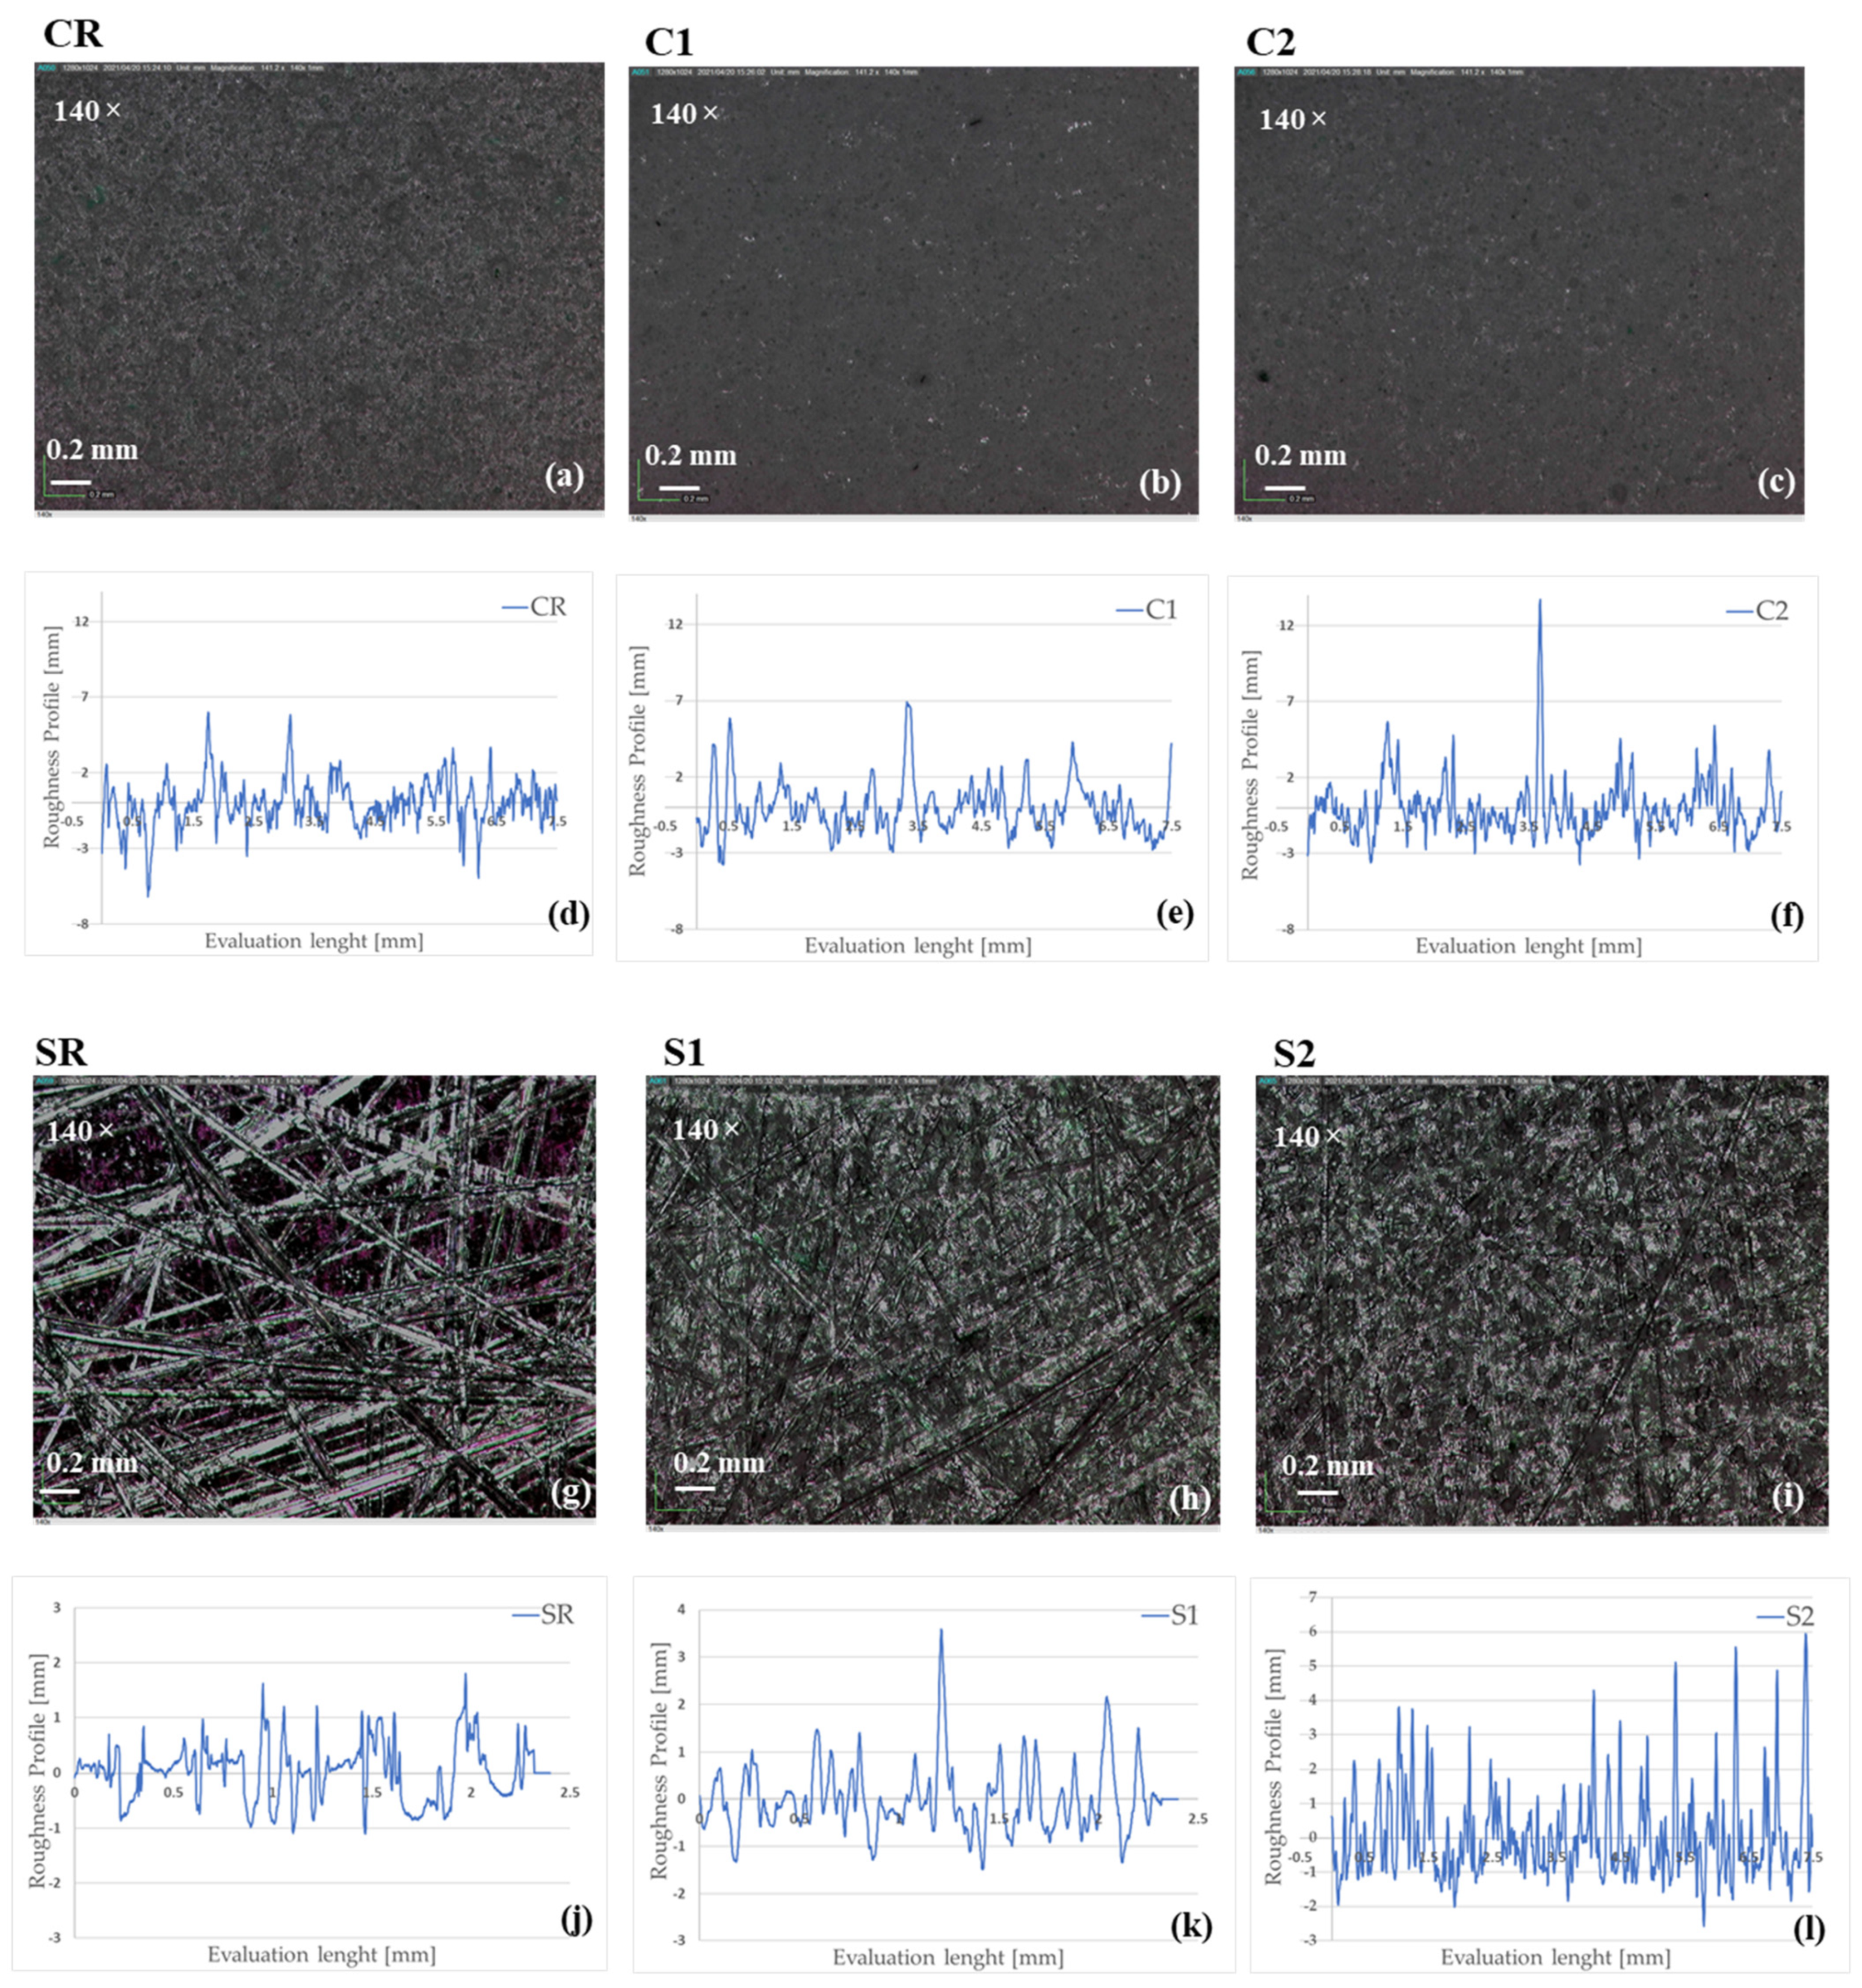
3.1.1. Roughness
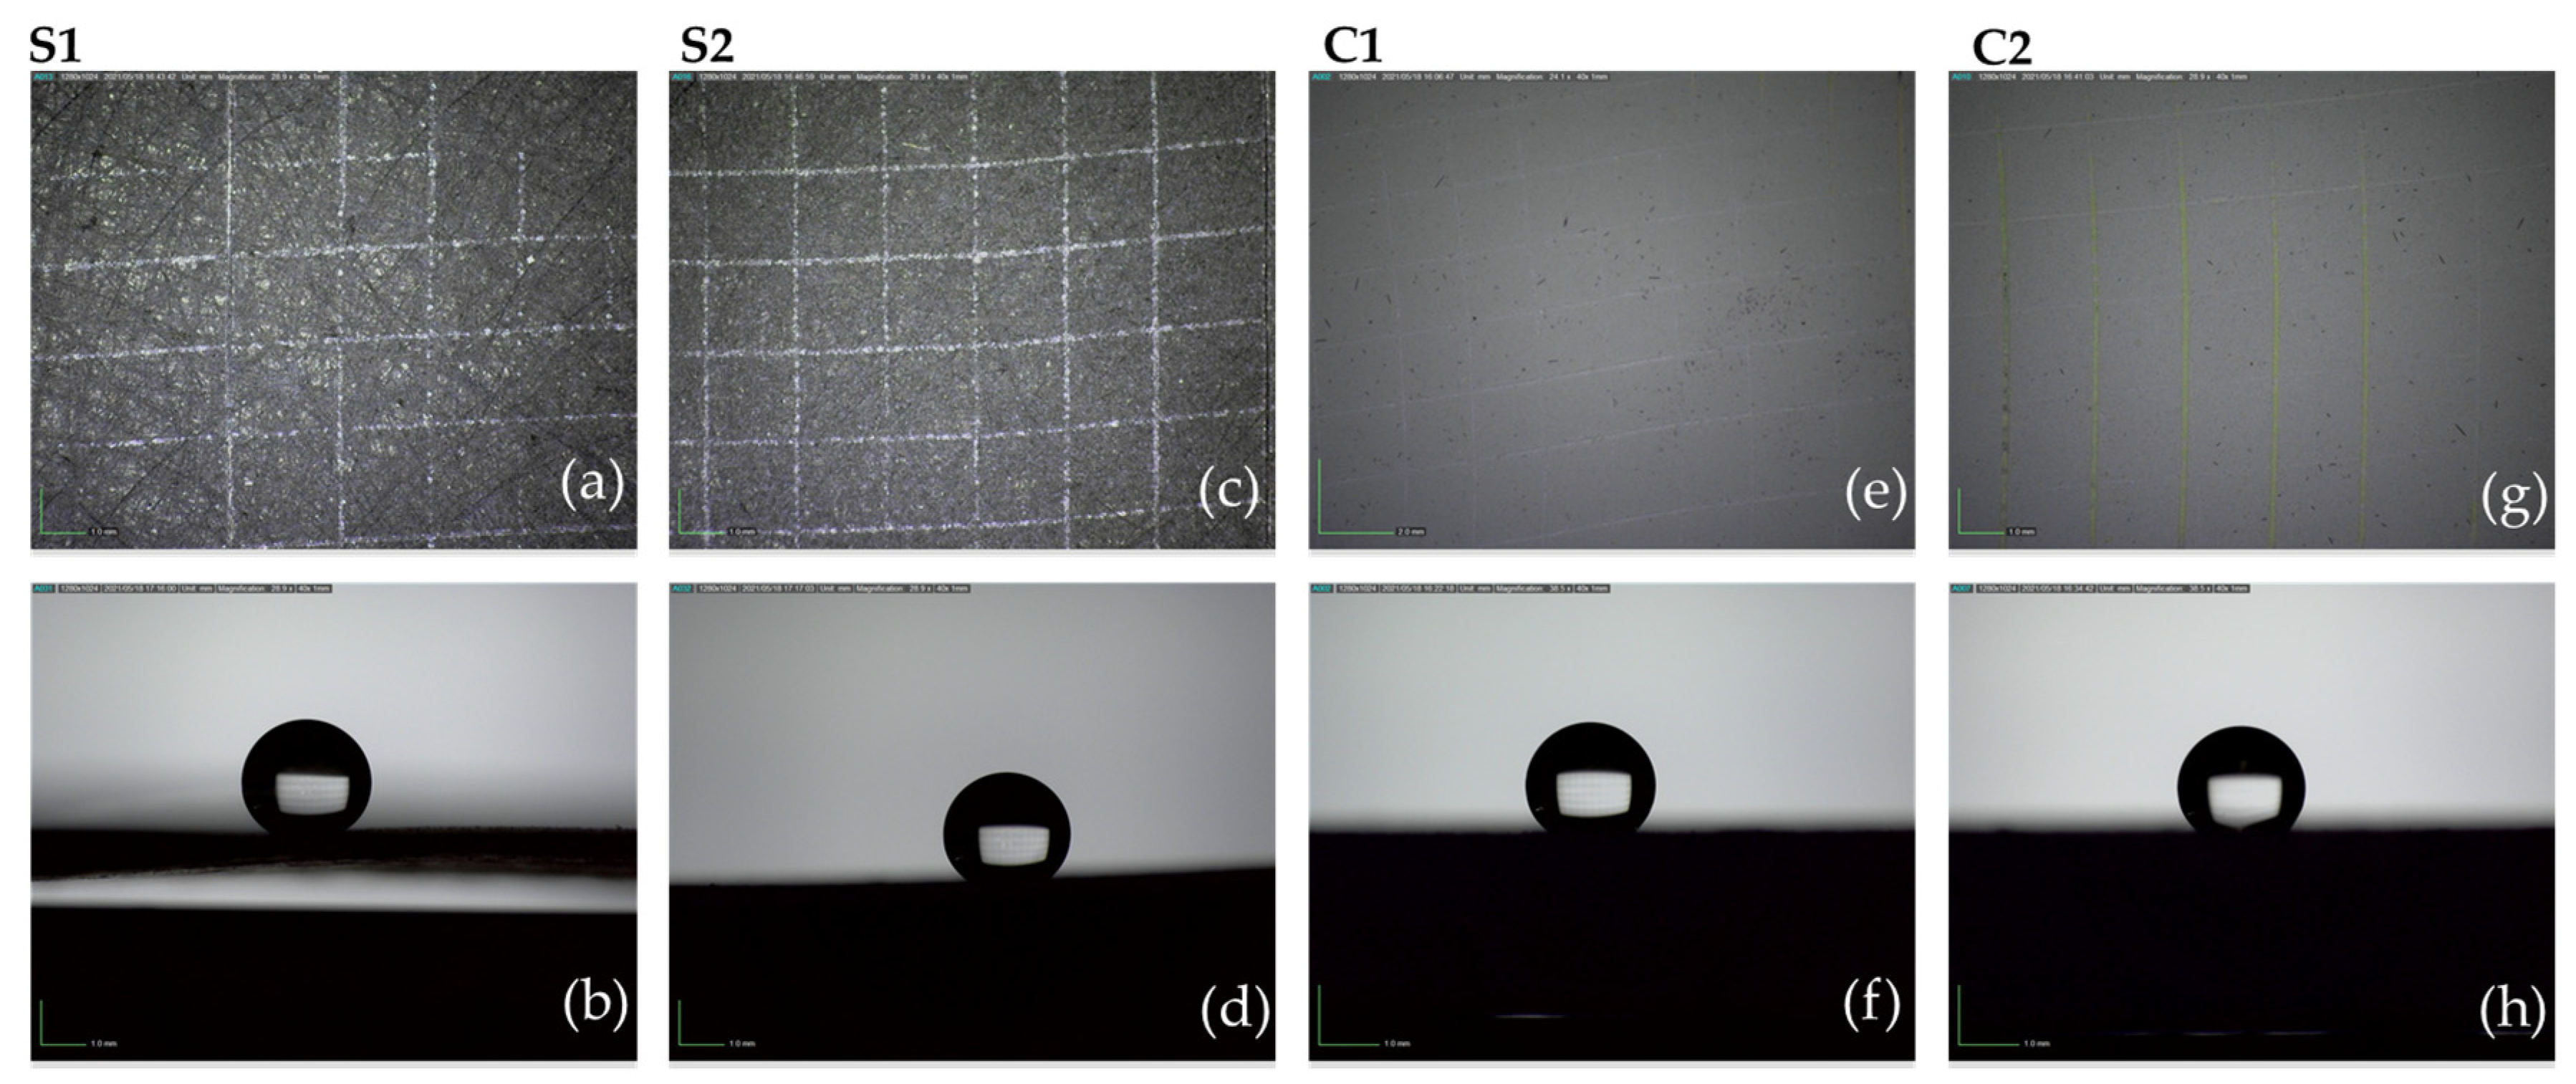
3.1.2. Optical Microscopy
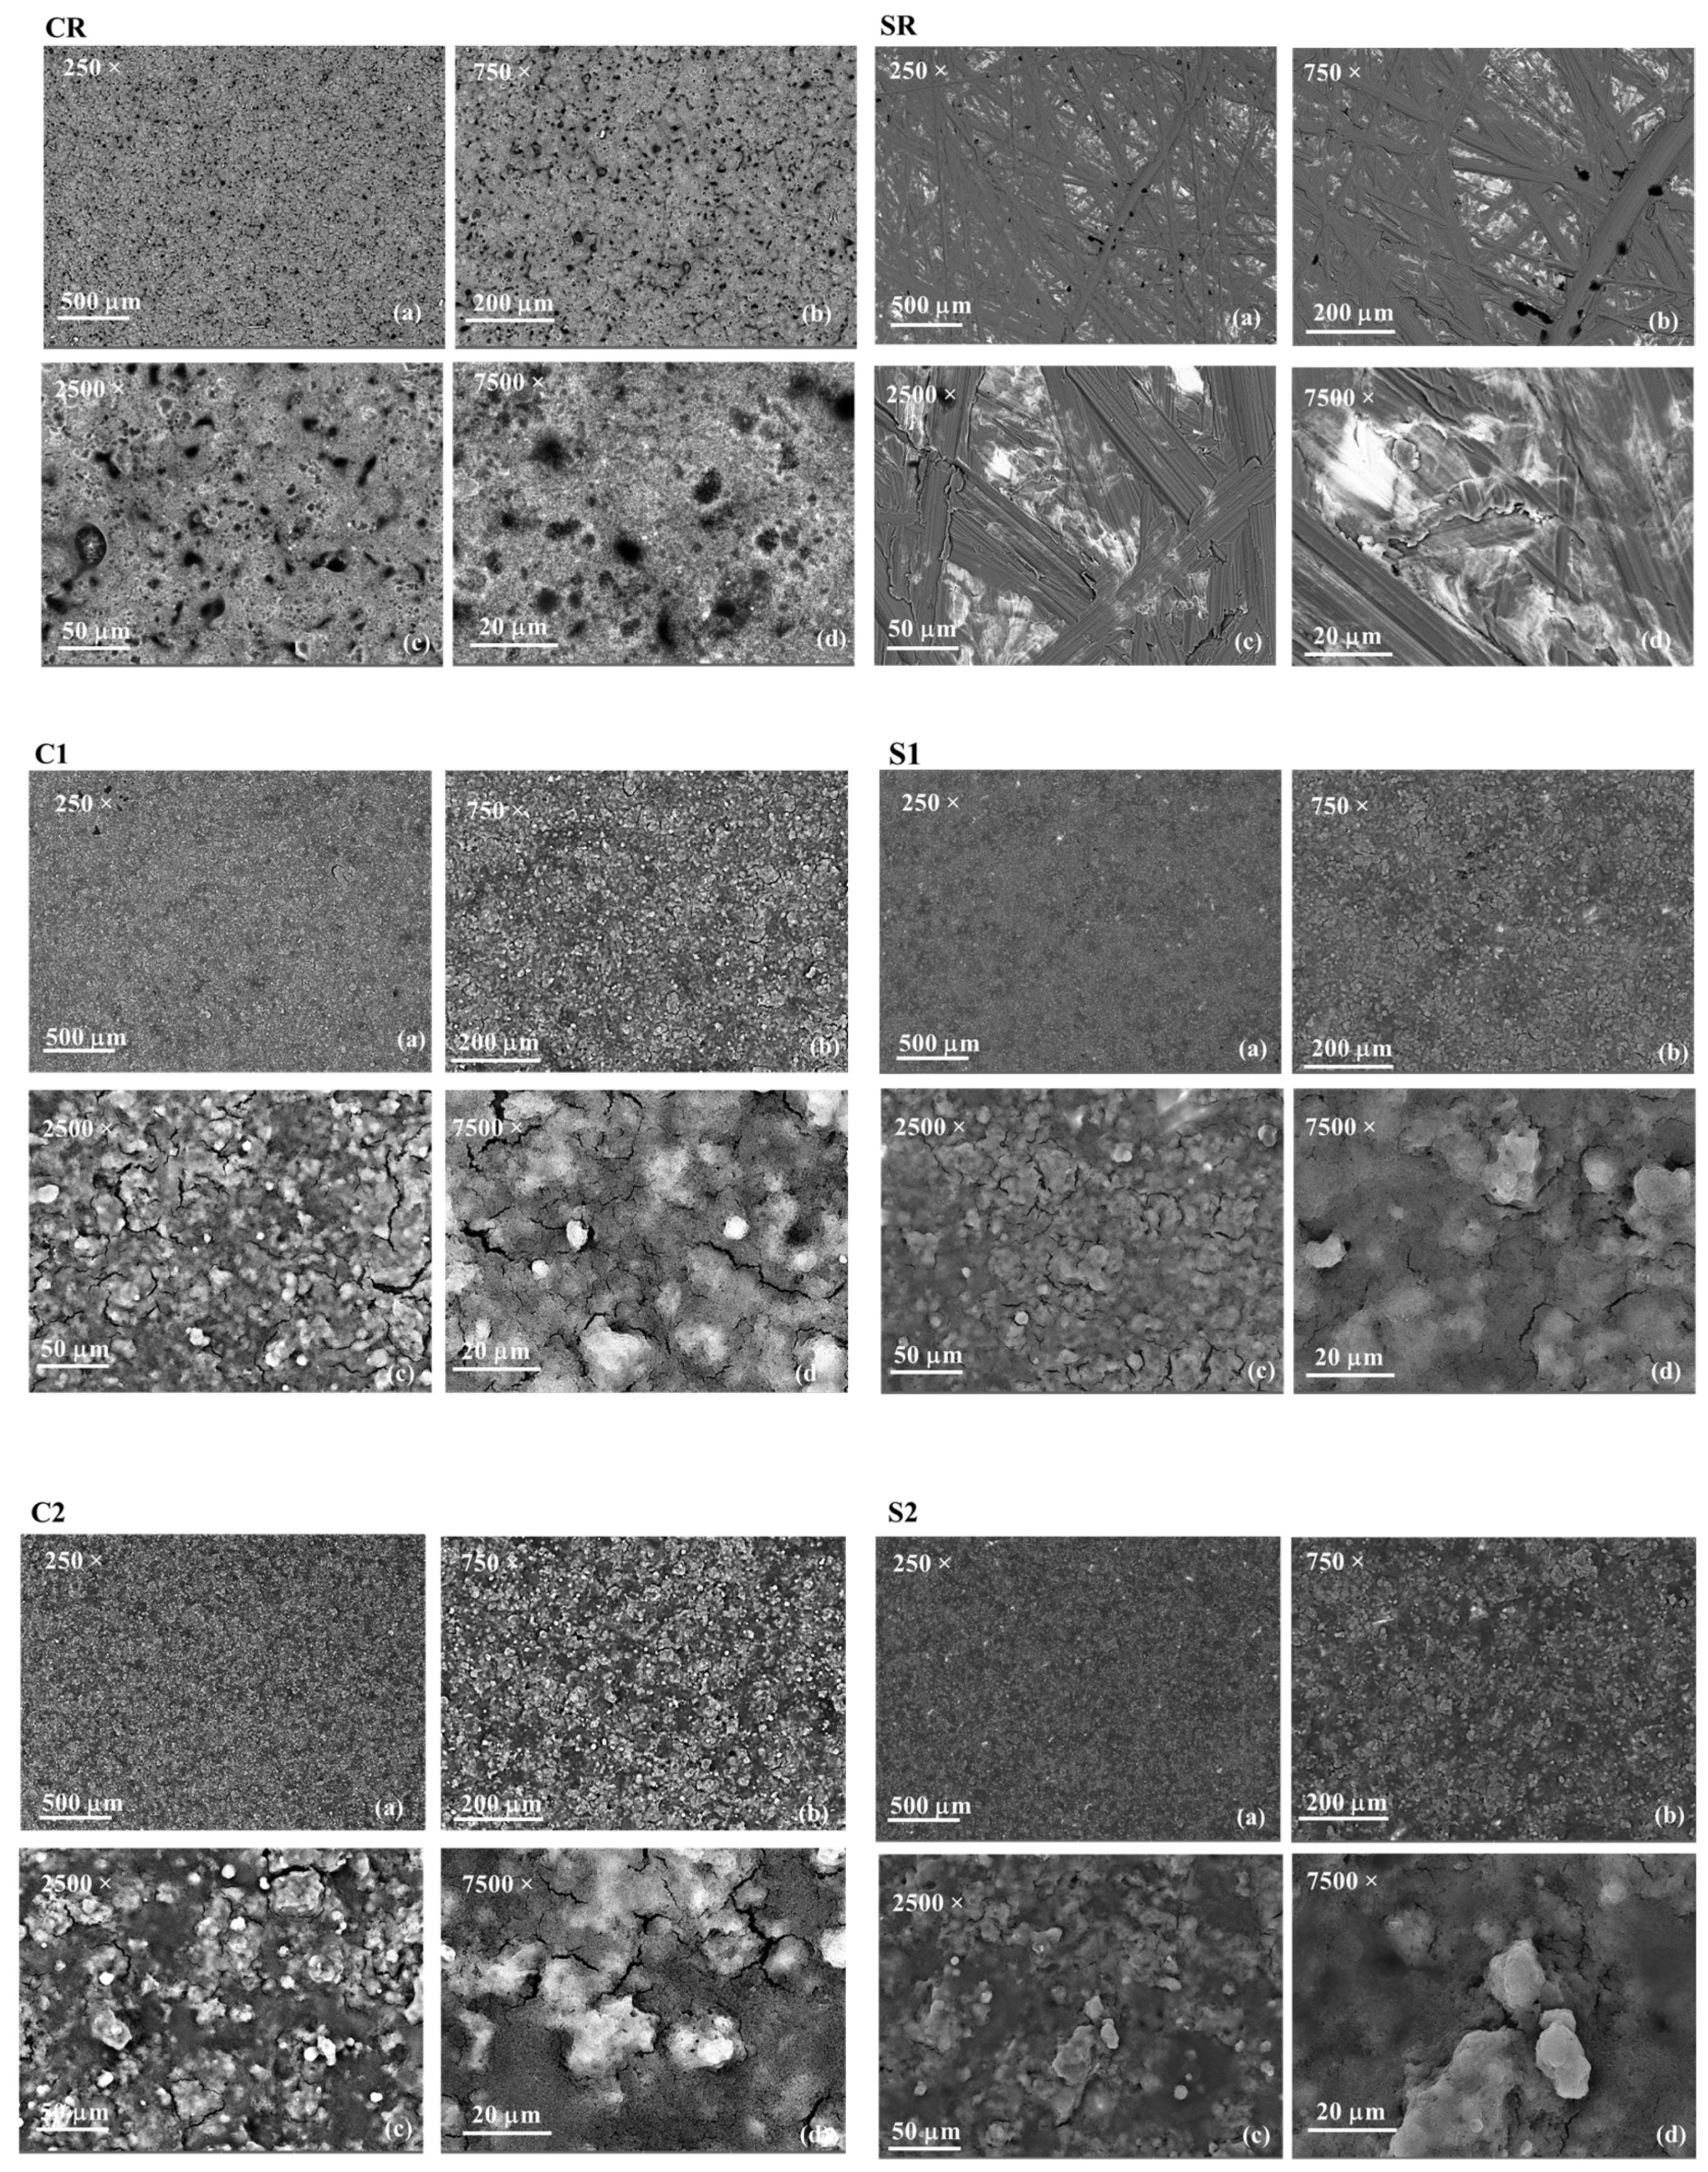
3.1.3. Scanning Electron Microscopy
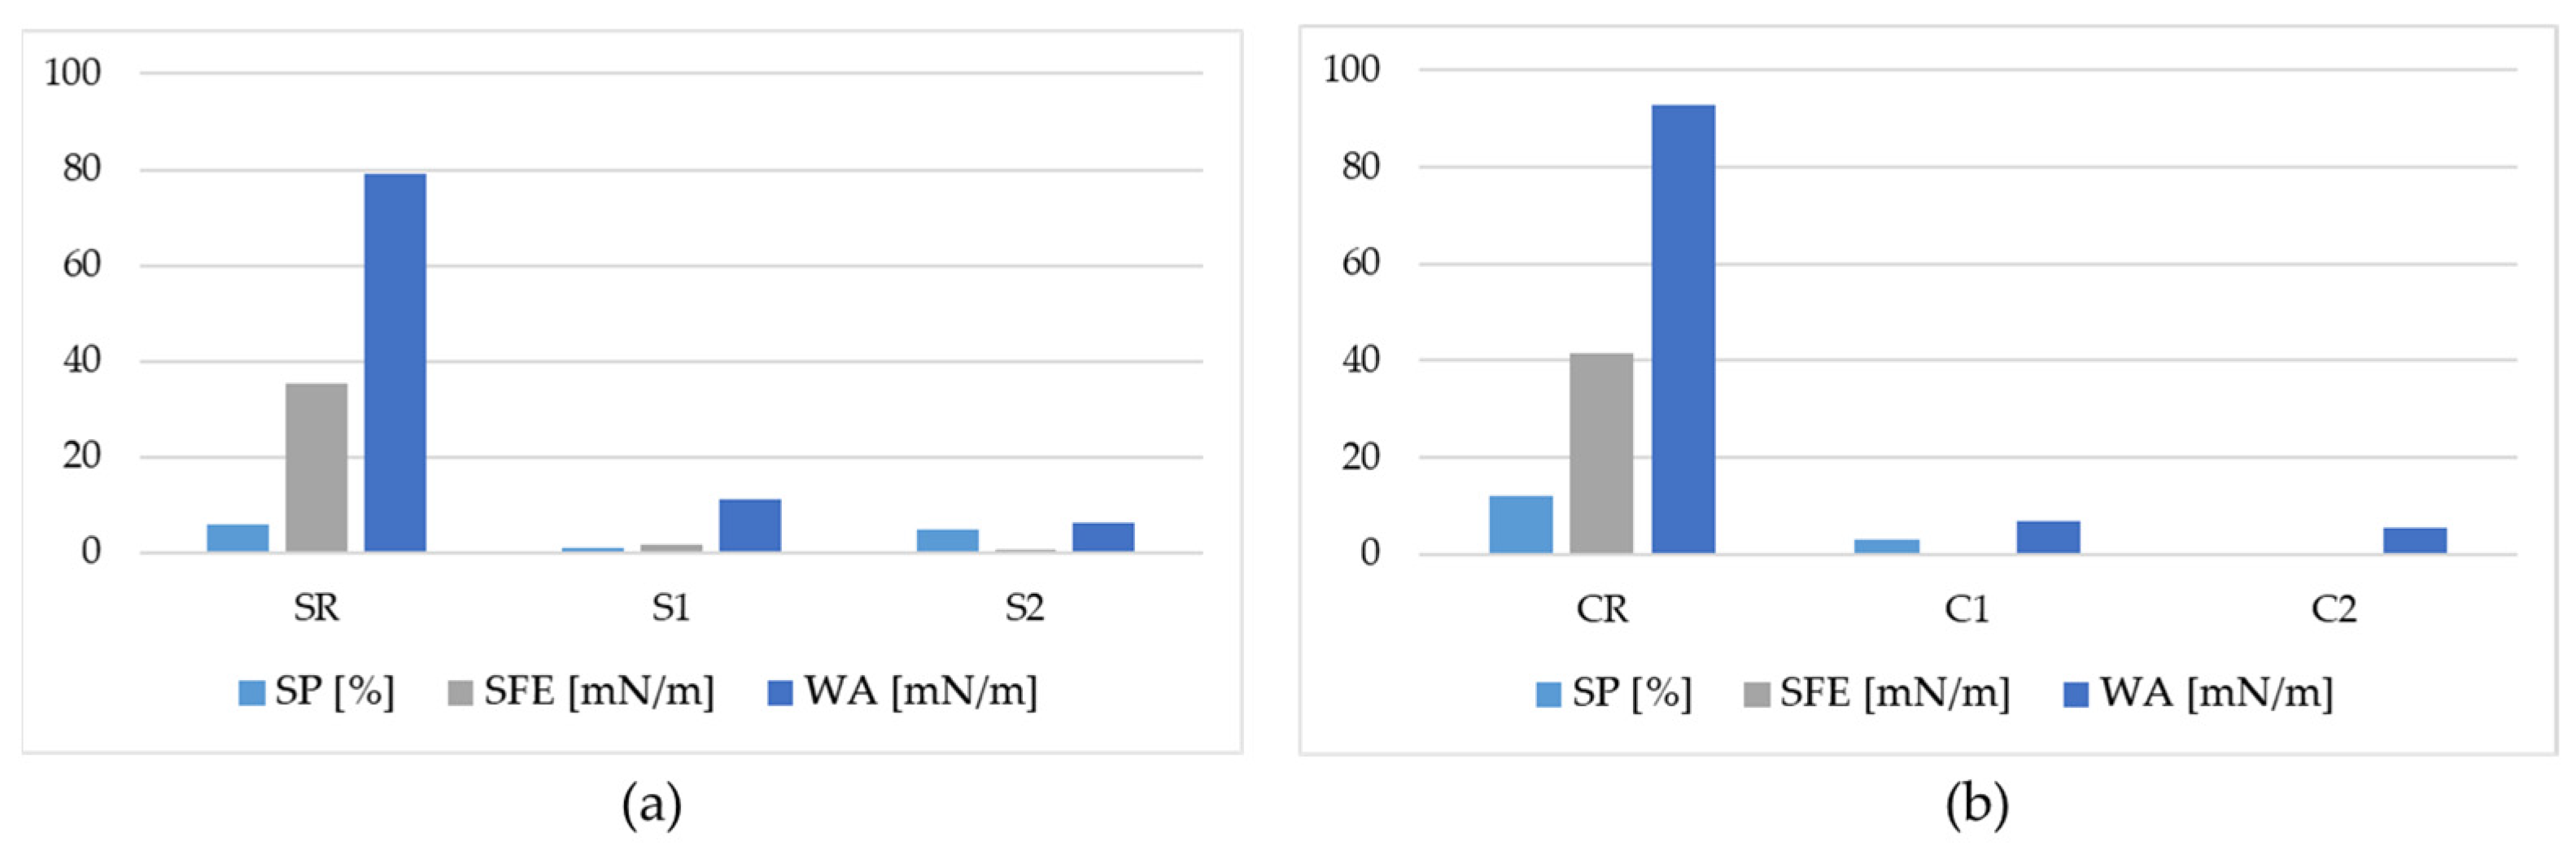
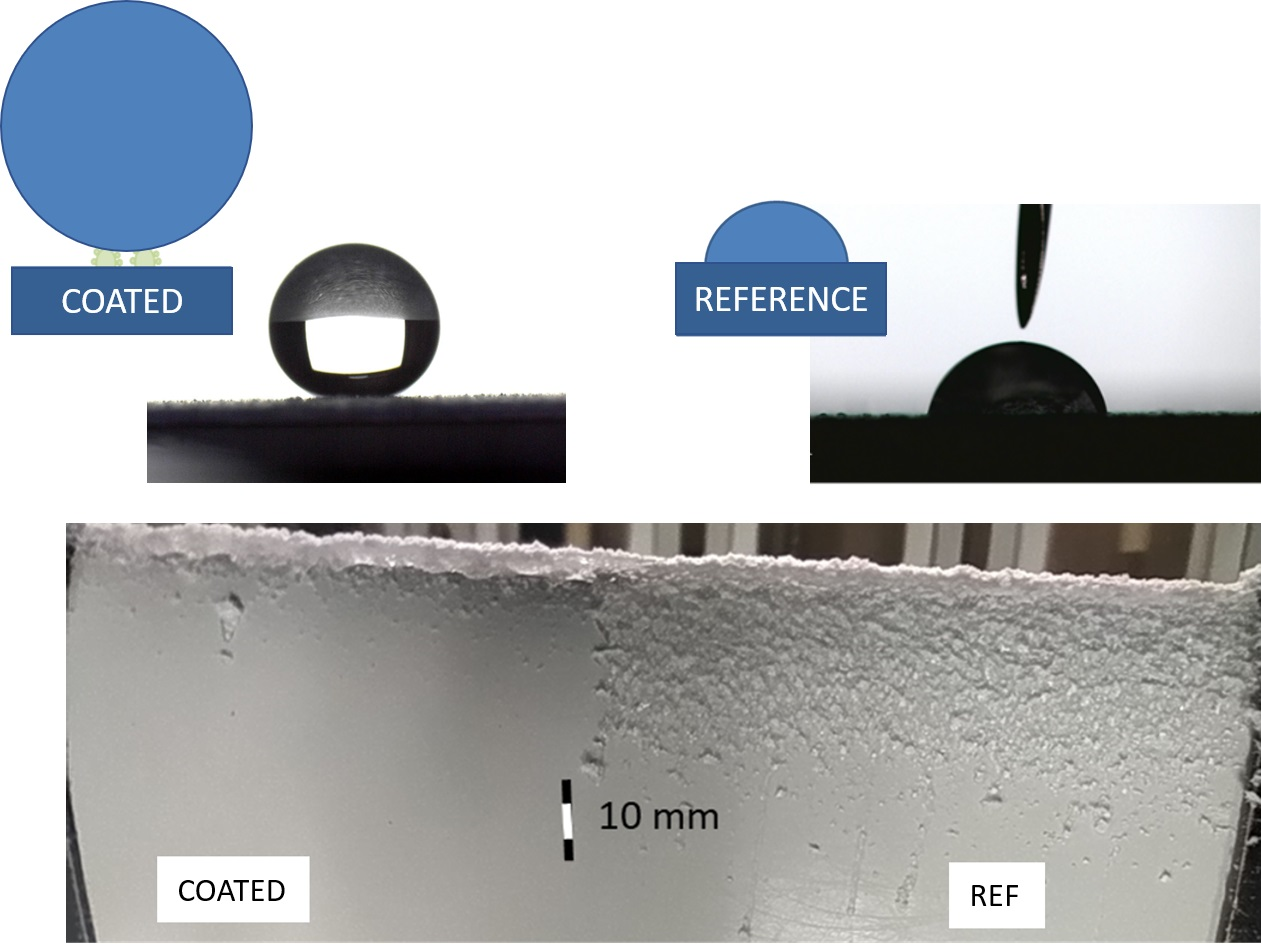
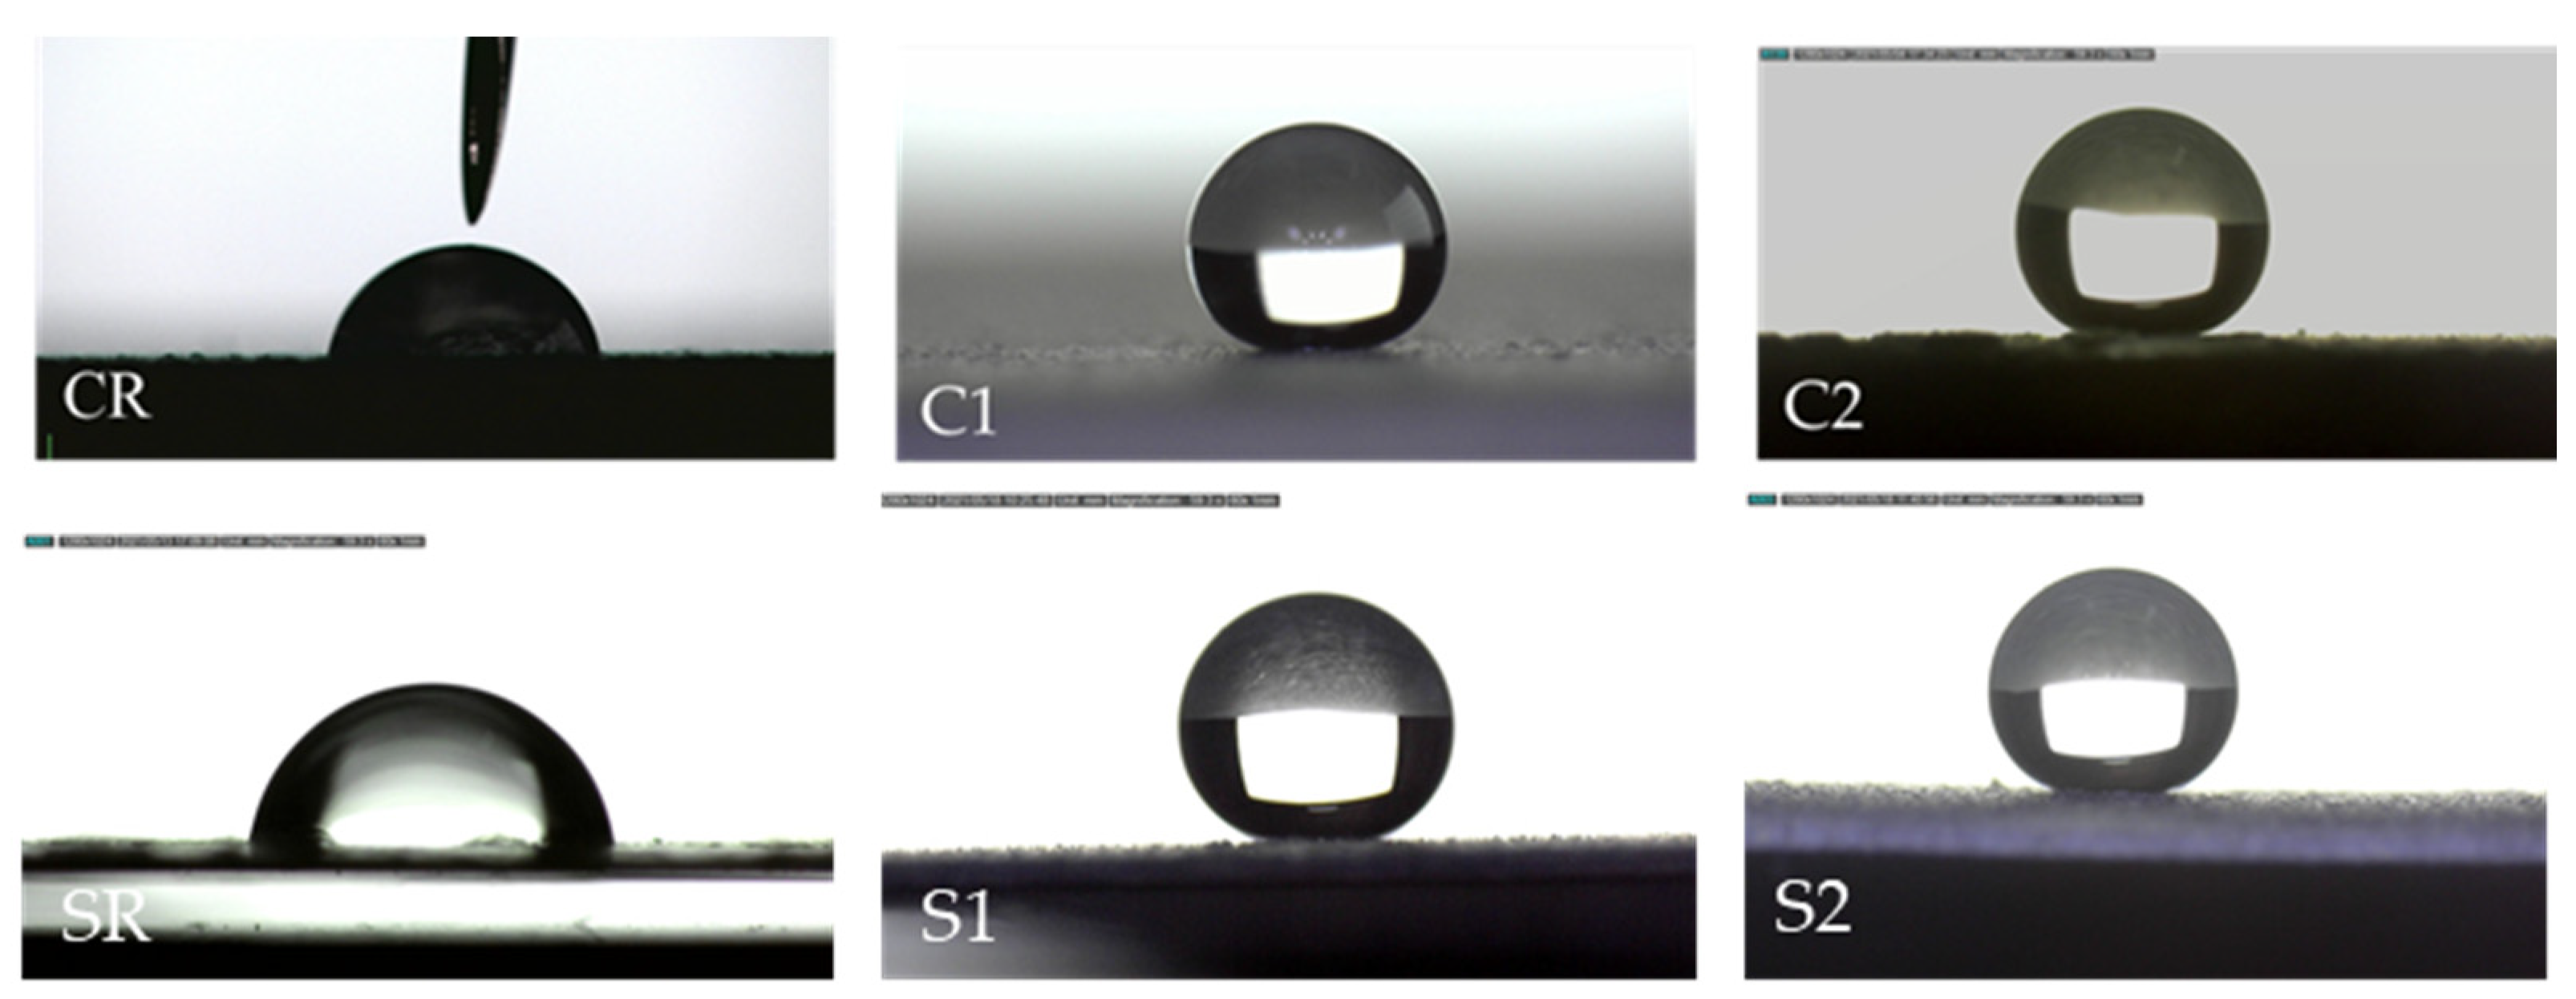
3.1.4. Wettability
3.2. Durability Tests
3.2.1. Cutting and Tape Test
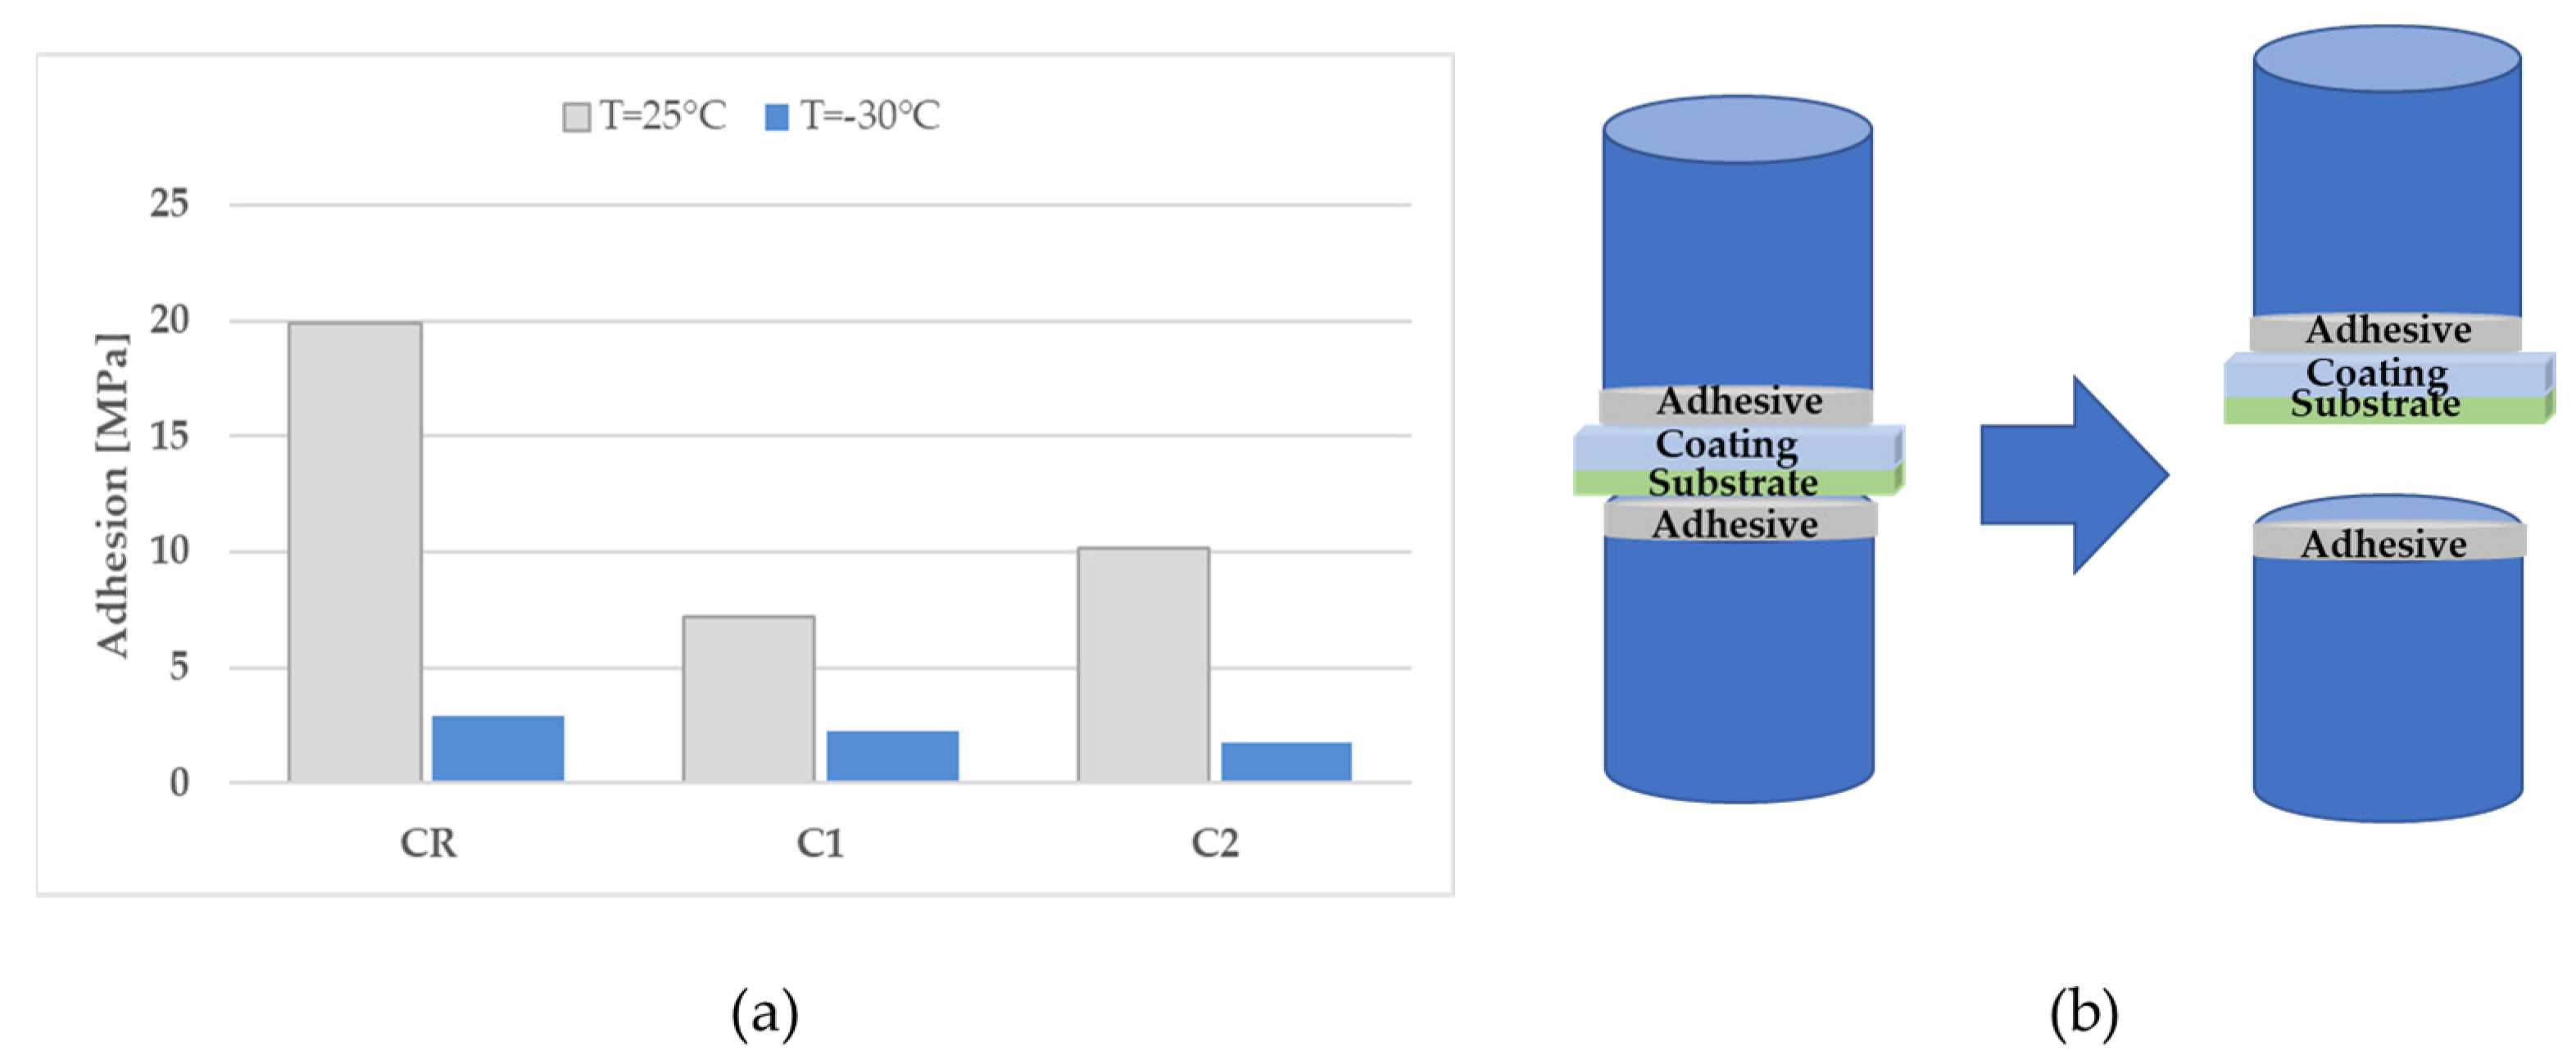
3.2.2. Adhesion Tests
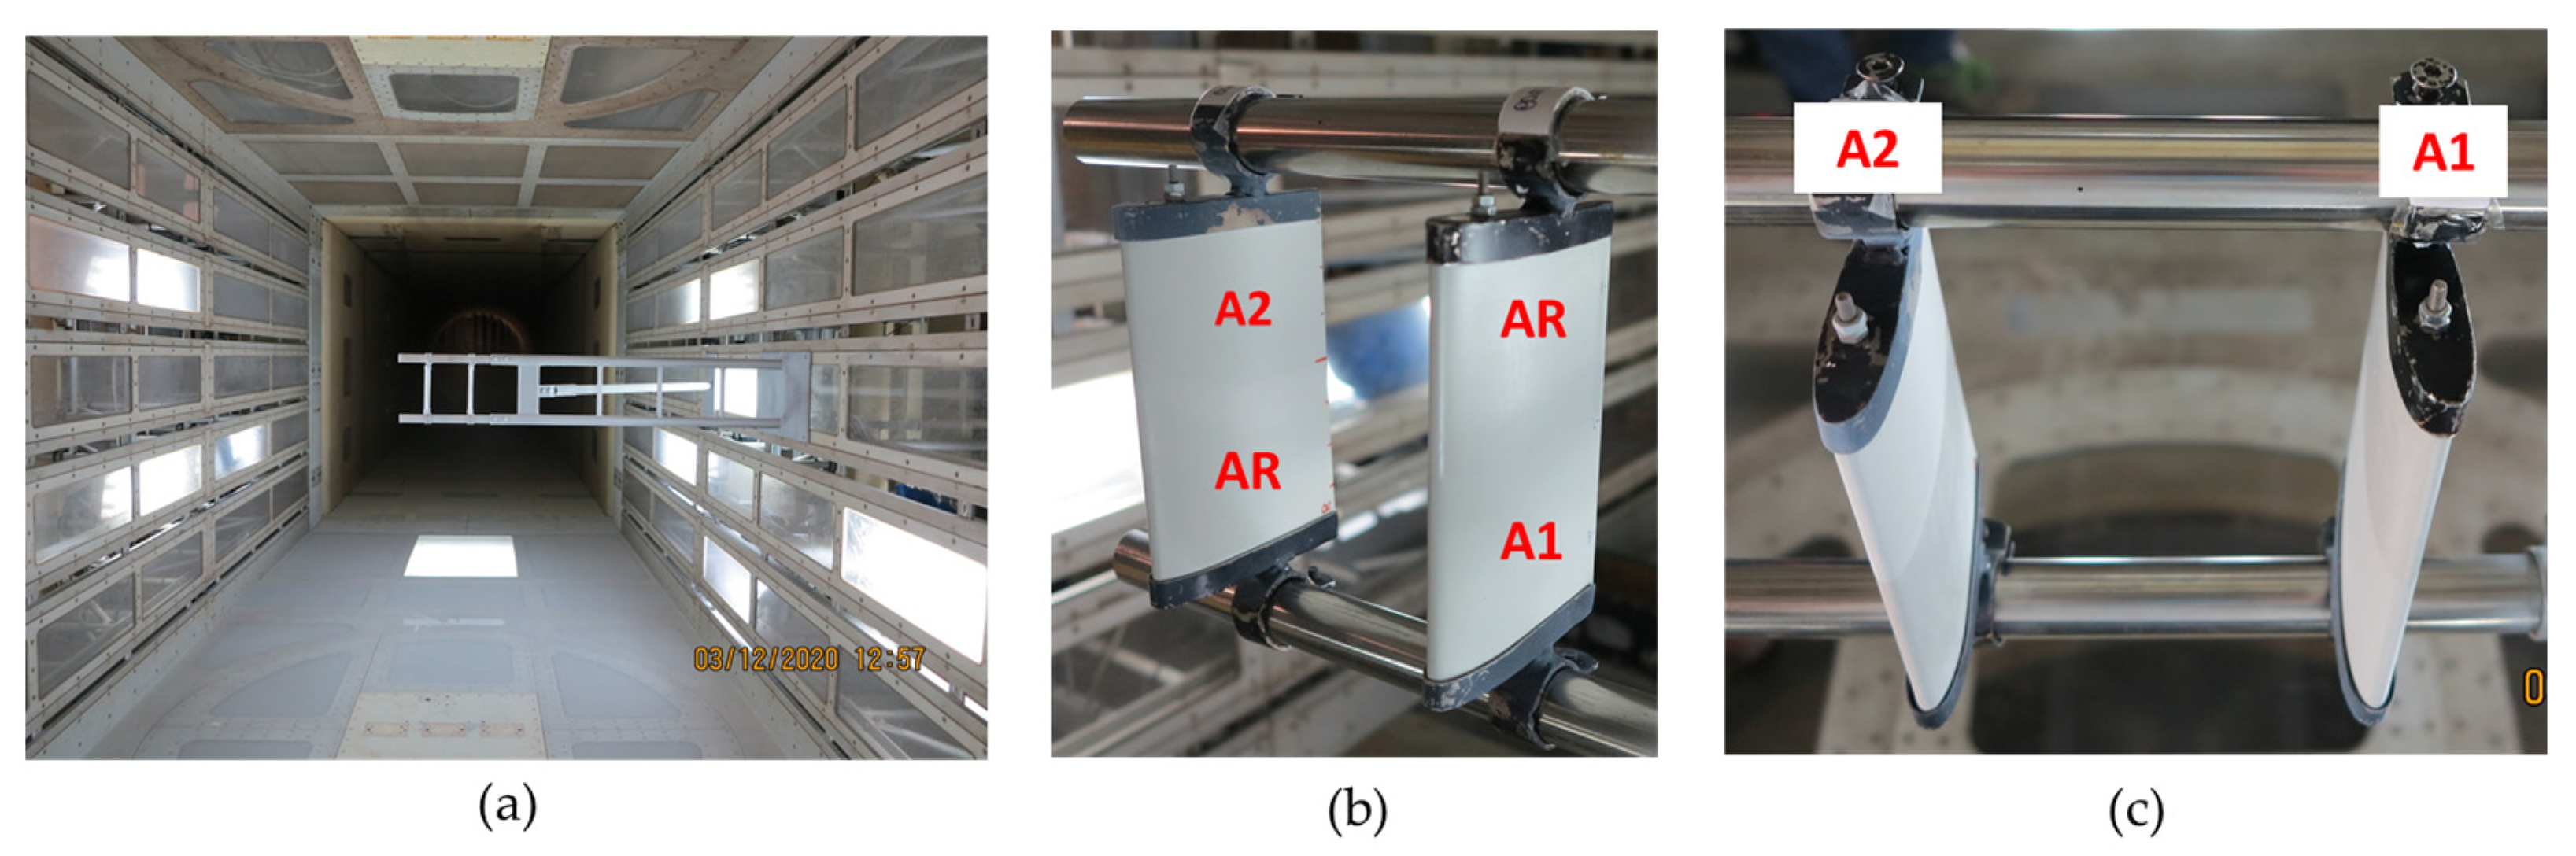
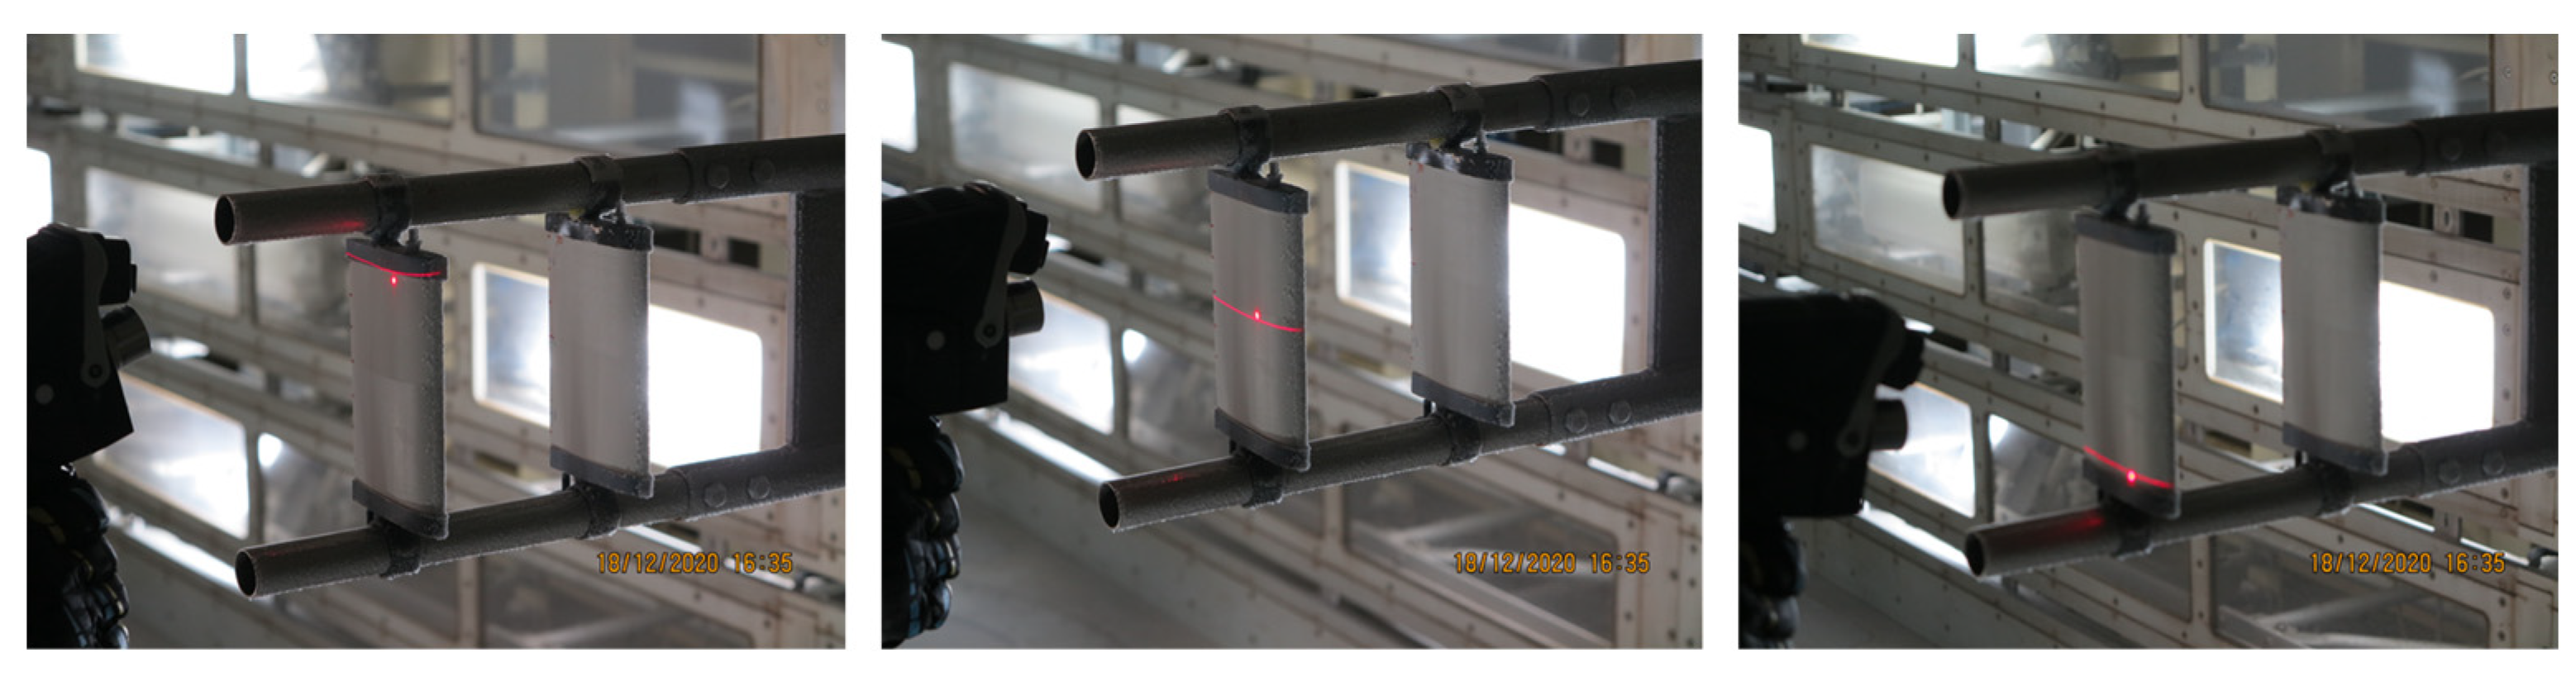
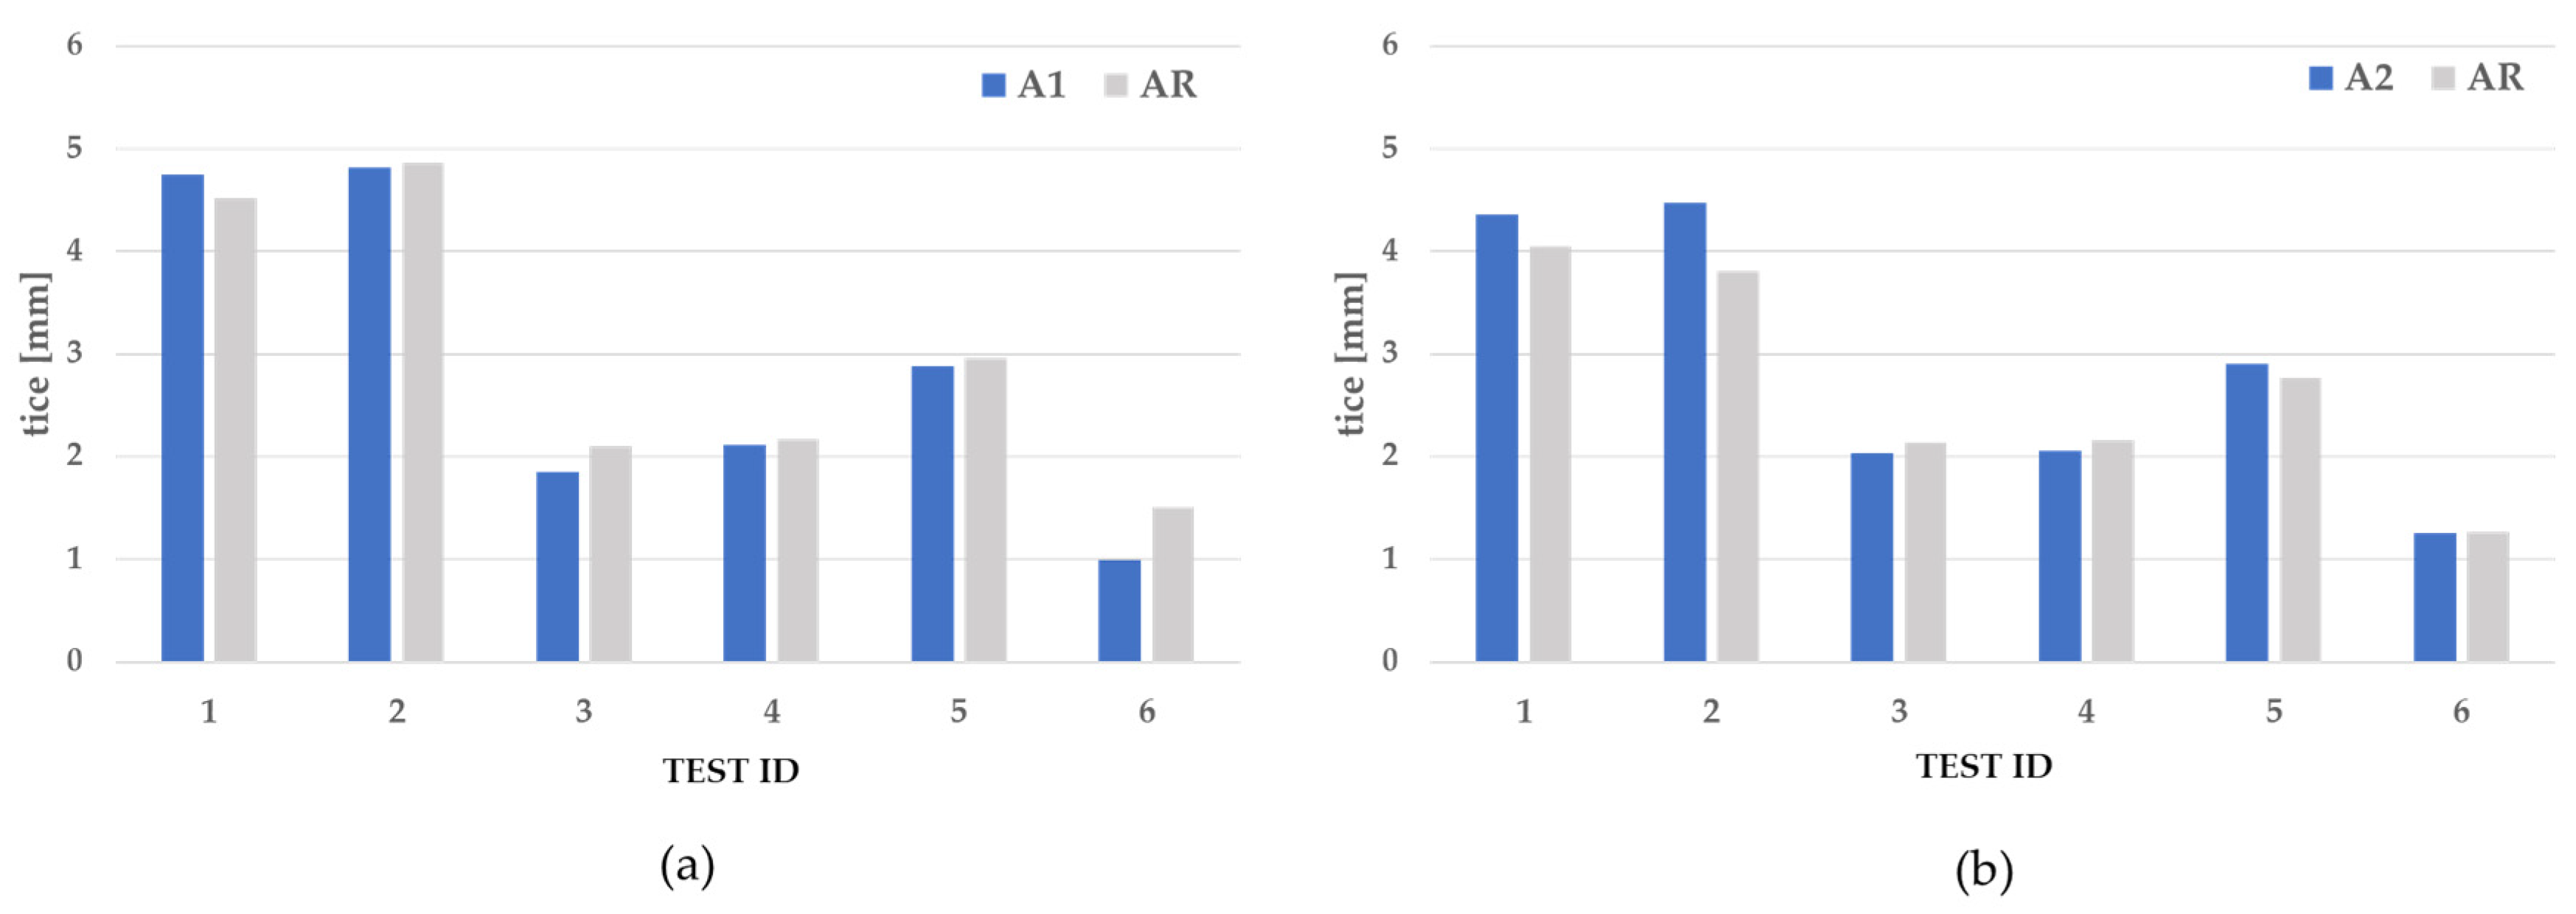
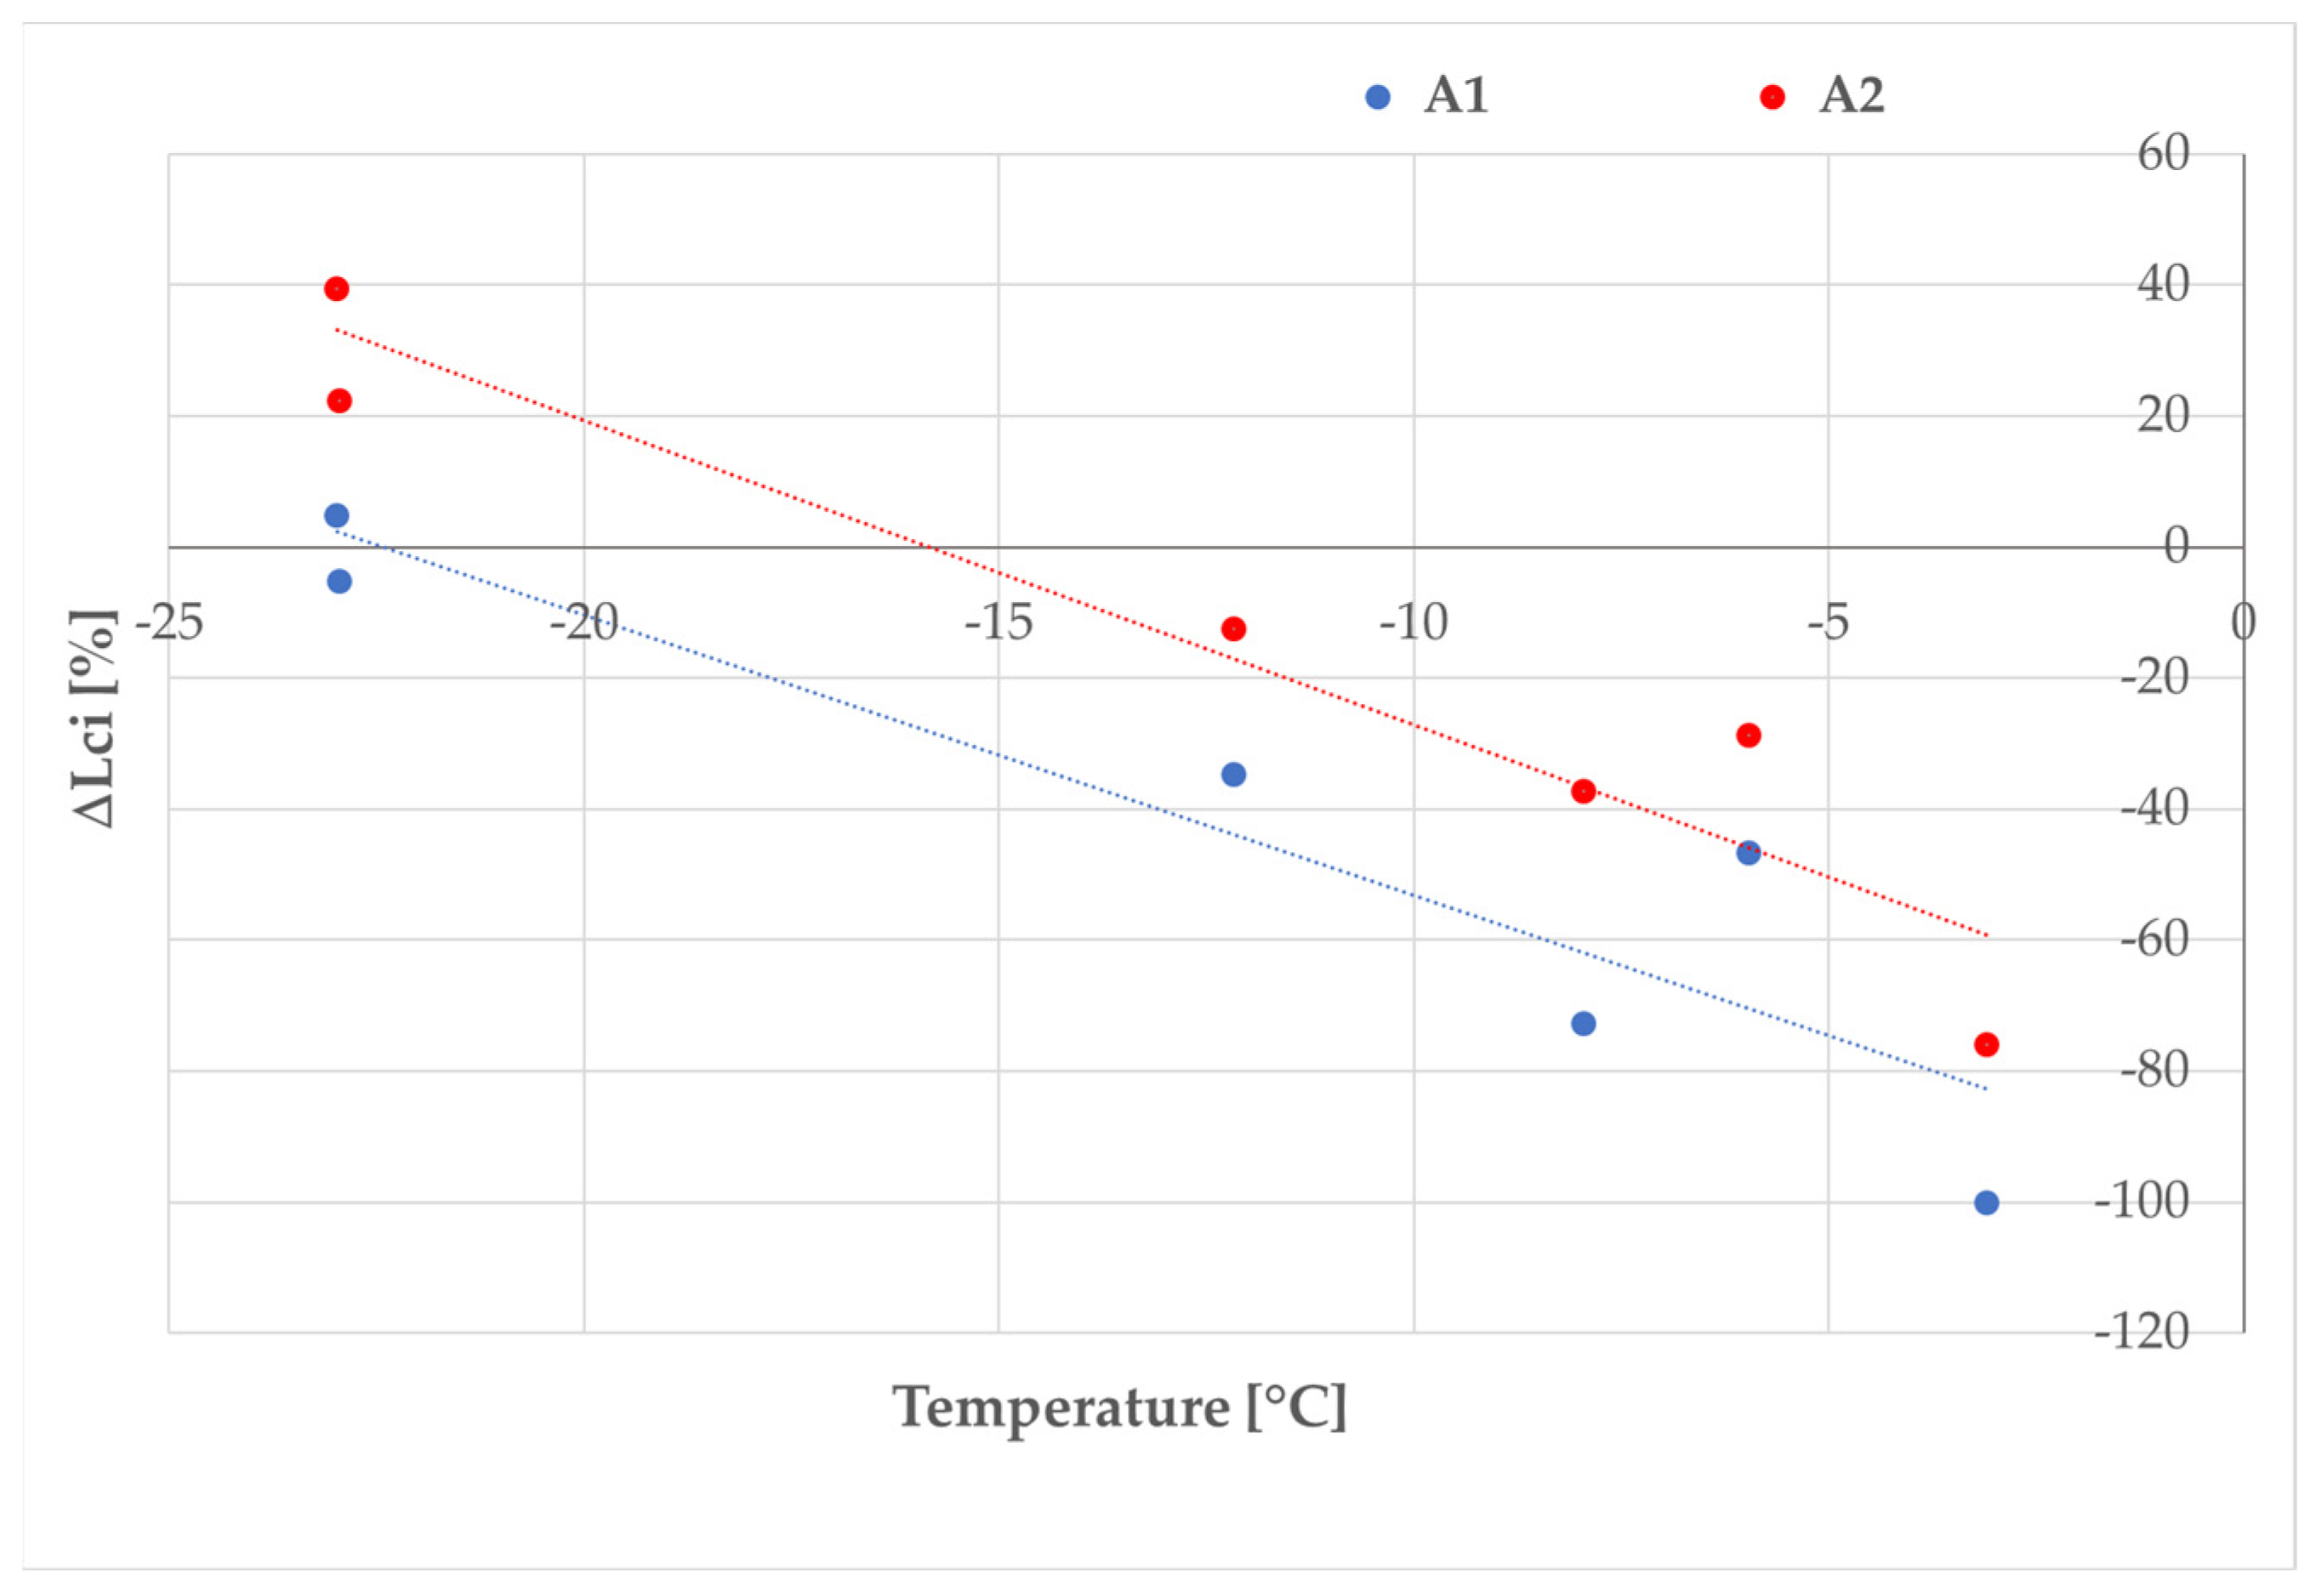
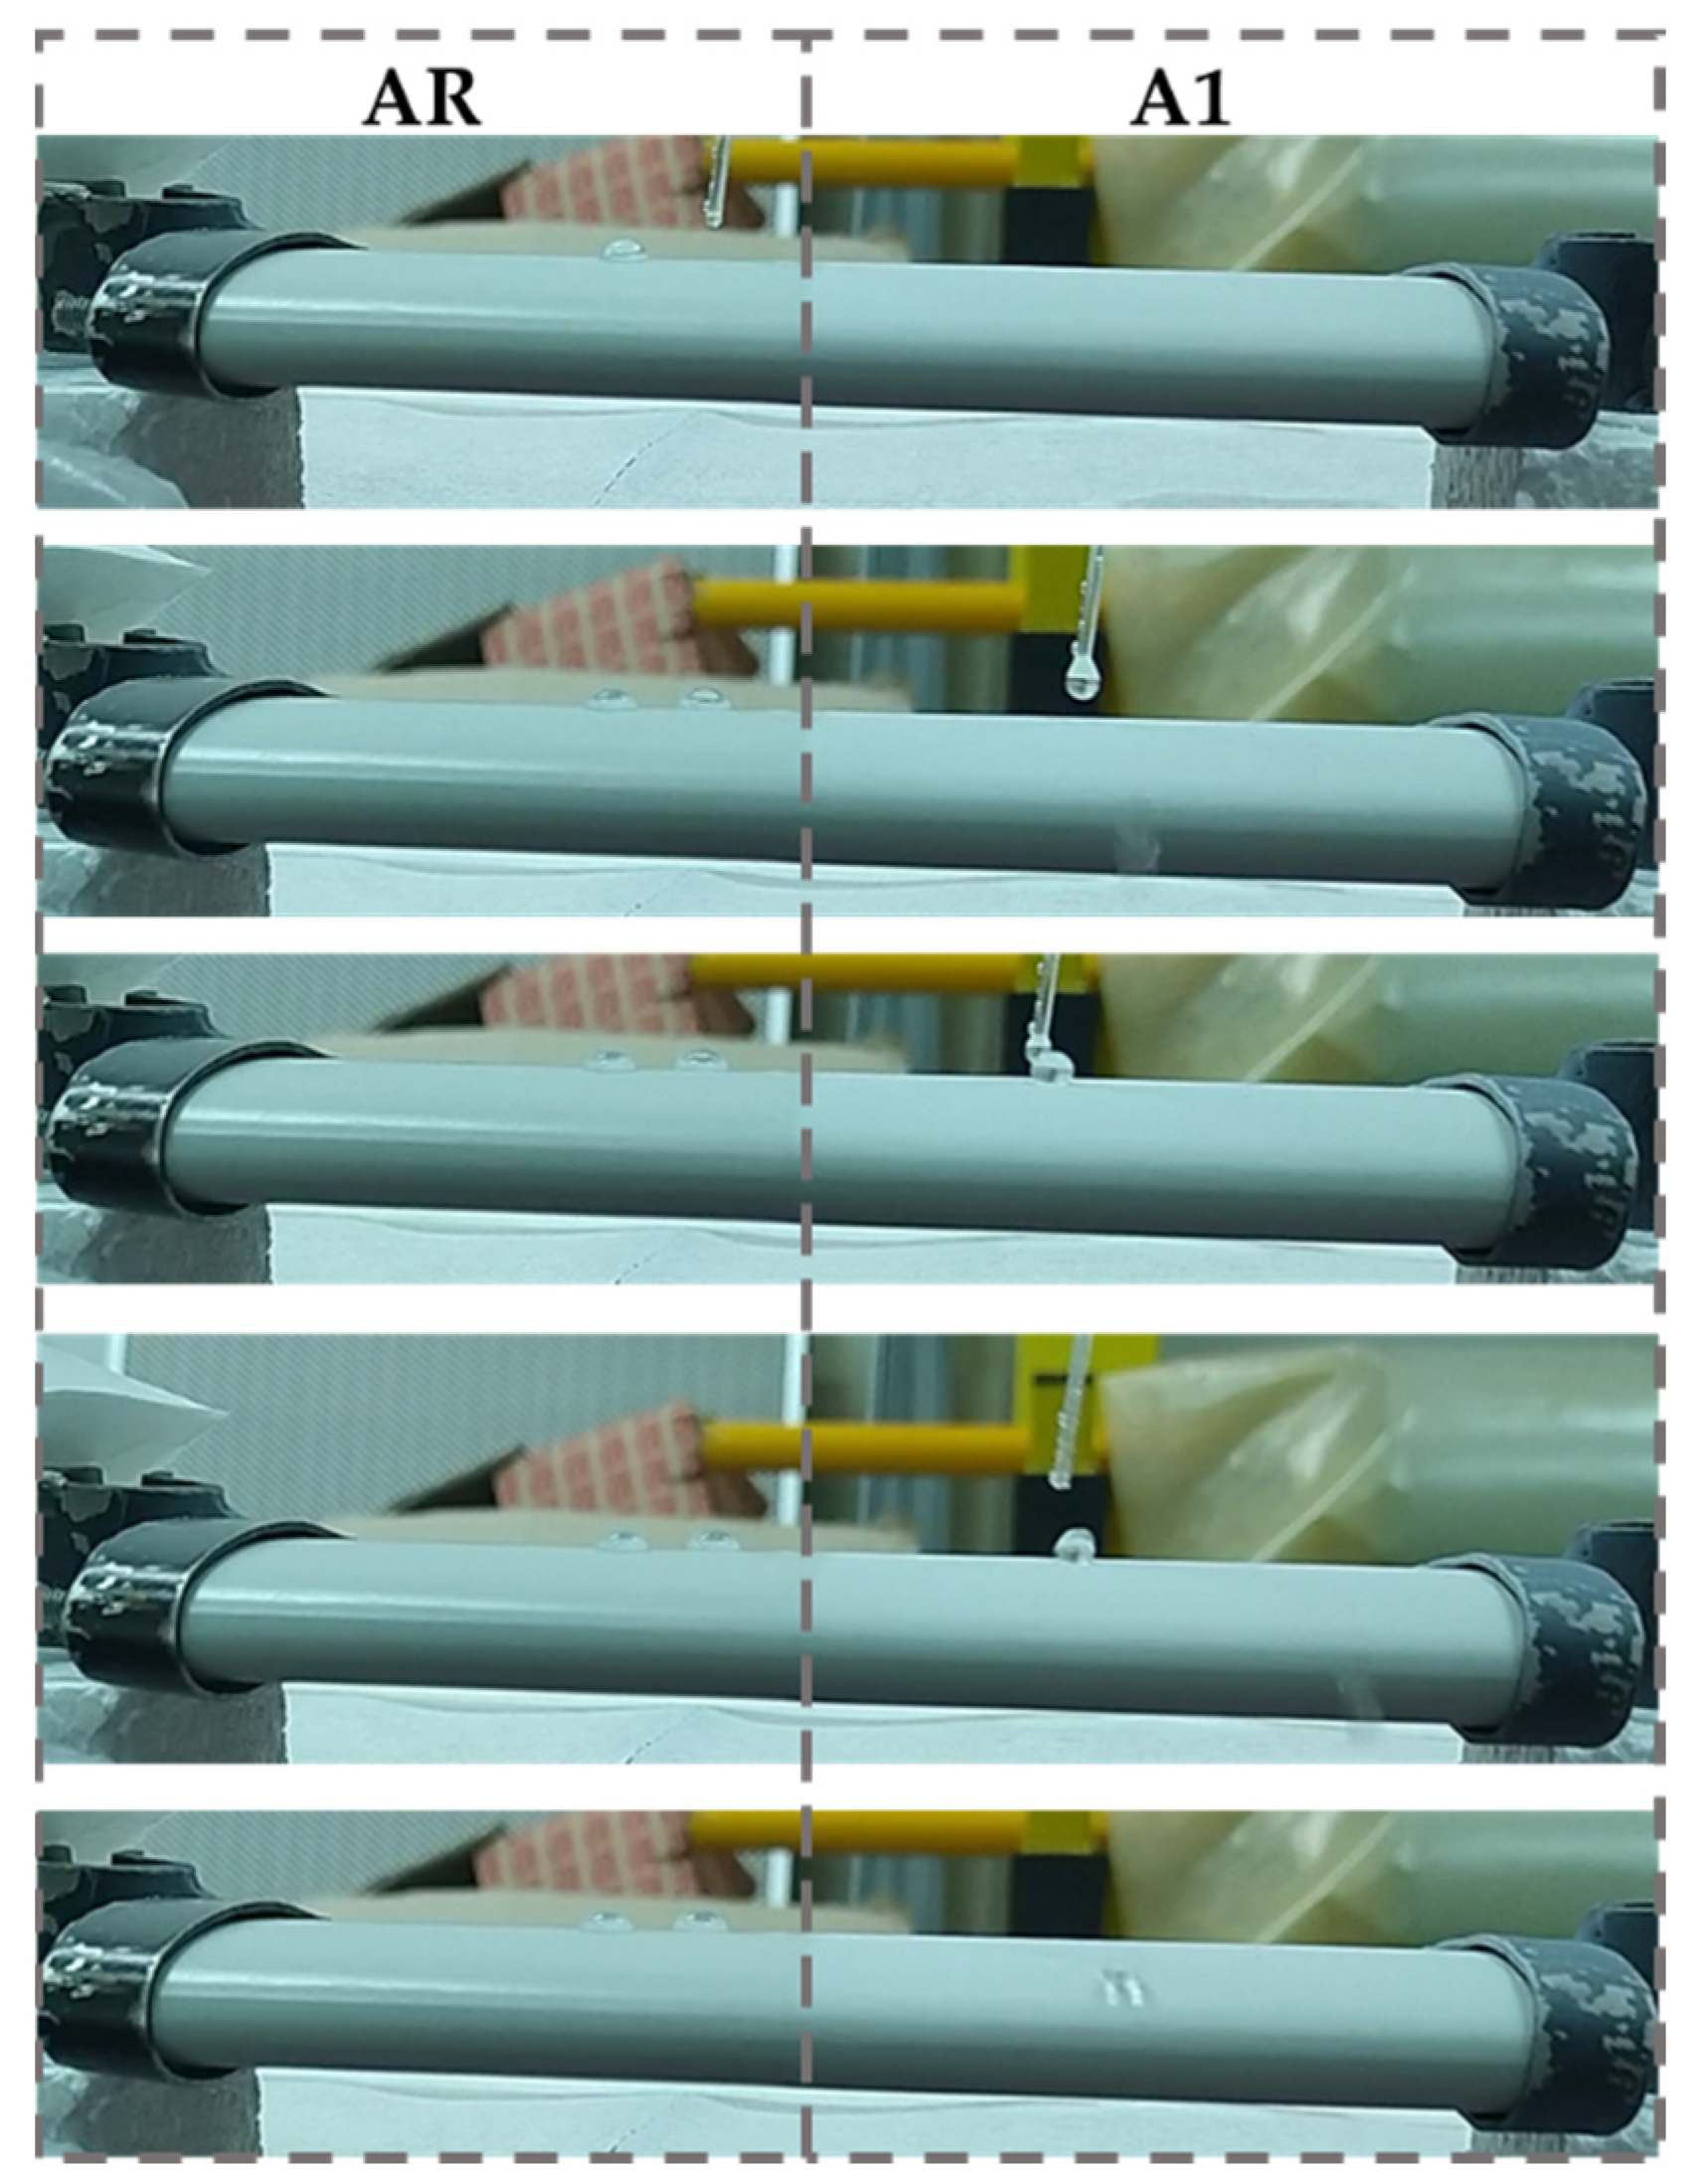
3.3. IWT Tests
4. Discussion and Conclusions
5. Patents
Funding
Institutional Review Board Statement
Informed Consent Statement
Data Availability Statement
Acknowledgments
Conflicts of Interest
References
- Ma, L.; Zhang, Z.; Gao, L.; Liu, Y.; Hui, H. Bio-Inspired Icephobic Coatings for Aircraft Icing Mitigation: A Critical Review. Rev. Adhes. Adhes. 2020, 8, 168–198. [Google Scholar] [CrossRef]
- Schulz, M.; Sinapius, M. Evaluation of Different Ice Adhesion Tests for Mechanical Deicing Systems; SAE Technical Paper; SAE: Warrendale, PA, USA, 2015. [Google Scholar]
- Zhao, Z.; Chen, H.; Liu, X.; Liu, H.; Zhang, D. Development of high-efficient synthetic electric heating coating for anti-icing/de-icing. Surf. Coat. Technol. 2018, 349, 340–346. [Google Scholar] [CrossRef]
- Yao, X.; Chen, B.; Morelle, X.P.; Suo, Z. Anti-icing propylene-glycol materials. Extrem. Mech. Lett. 2021, 44, 101225. [Google Scholar] [CrossRef]
- Huang, X.; Tepylo, N.; Pommier-Budinger, V.; Budinger, M.; Bonaccurso, E.; Villedieu, P.; Bennani, L. A survey of icephobic coatings and their potential use in a hybrid coating/active ice protection system for aerospace applications. Prog. Aerosp. Sci. 2019, 105, 74–97. [Google Scholar] [CrossRef] [Green Version]
- Antonini, C.; Innocenti, M.; Horn, T.; Marengo, M.; Amirfazli, A. Understanding the effect of superhydrophobic coatings on energy reduction in anti-icing systems. Cold Reg. Sci. Technol. 2011, 67, 58–67. [Google Scholar] [CrossRef]
- Kreder, M.J.; Alvarenga, J.; Kim, P.; Aizenberg, J. Design of anti-icing surfaces: Smooth, textured or slippery? Nat. Rev. Mater. 2016, 1, 15003. [Google Scholar] [CrossRef]
- Lv, J.; Song, Y.; Jiang, L.; Wang, J. Bio-Inspired Strategies for Anti-Icing. ACS Nano 2014, 8, 3152–3169. [Google Scholar] [CrossRef]
- Tarquini, S.; Antonini, C.; Amirfazli, A.; Marengo, M.; Palacios, J. Investigation of ice shedding properties of superhydrophobic coatings on helicopter blades. Cold Reg. Sci. Technol. 2014, 100, 50–58. [Google Scholar] [CrossRef]
- Hejazi, V.; Sobolev, K.; Nosonovsky, M. From superhydrophobicity to icephobicity: Forces and interaction analysis. Sci. Rep. 2013, 3, 2194. [Google Scholar] [CrossRef] [Green Version]
- Cao, L.; Jones, A.K.; Sikka, V.K.; Wu, J.; Gao, D. Anti-Icing Superhydrophobic Coatings. Langmuir 2009, 25, 12444–12448. [Google Scholar] [CrossRef]
- Varanasi, K.K.; Deng, T.; Smith, J.D.; Hsu, M.; Bhate, N. Frost formation and ice adhesion on superhydrophobic surfaces. Appl. Phys. Lett. 2010, 97, 234102. [Google Scholar] [CrossRef]
- Chen, J.; Liu, J.; He, M.; Li, K.; Cui, D.; Zhang, Q.; Zeng, X.; Zhang, Y.; Wang, J.; Song, Y. Superhydrophobic surfaces cannot reduce ice adhesion. Appl. Phys. Lett. 2012, 101, 111603. [Google Scholar] [CrossRef]
- Kulinich, S.; Farzaneh, M. On ice-releasing properties of rough hydrophobic coatings. Cold Reg. Sci. Technol. 2011, 65, 60–64. [Google Scholar] [CrossRef]
- Kulinich, S.A.; Farhadi, S.; Nose, K.; Du, X.W. Superhydrophobic Surfaces: Are They Really Ice-Repellent? Langmuir 2011, 27, 25–29. [Google Scholar] [CrossRef] [PubMed]
- Susoff, M.; Siegmann, K.; Pfaffenroth, C.; Hirayama, M. Evaluation of icephobic coatings—Screening of different coatings and influence of roughness. Appl. Surf. Sci. 2013, 282, 870–879. [Google Scholar] [CrossRef] [Green Version]
- Yeong, Y.H.; Sokhey, J.; Loth, E. Ice Adhesion on Superhydrophobic Coatings in an Icing Wind Tunnel. In Contamination Mitigating Polymeric Coatings for Extreme Environments; Springer: Cham, Switzerland, 2018. [Google Scholar]
- Mora, J.; García, P.; Muelas, R.; Agüero, A. Hard Quasicrystalline Coatings Deposited by HVOF Thermal Spray to Reduce Ice Accretion in Aero-Structures Components. Coatings 2020, 10, 290. [Google Scholar] [CrossRef] [Green Version]
- Rivero, P.J.; Rodriguez, R.J.; Larumbe, S.; Monteserín, M.; Martín, F.; García, A.; Acosta, C.; Clemente, M.J.; García, P.; Mora, J.; et al. Evaluation of Functionalized Coatings for the Prevention of Ice Accretion by Using Icing Wind Tunnel Tests. Coatings 2020, 10, 636. [Google Scholar] [CrossRef]
- Morita, K.; Kimura, S.; Sakaue, H. Hybrid System Combining Ice-Phobic Coating and Electrothermal Heating for Wing Ice Protection. Aerospace 2020, 7, 102. [Google Scholar] [CrossRef]
- Villeneuve, E.; Blackburn, C.; Volat, C. Design and Development of an Experimental Setup of Electrically Powered Spinning Rotor Blades in Icing Wind Tunnel and Preliminary Testing with Surface Coatings as Hybrid Protection Solution. Aerospace 2021, 8, 98. [Google Scholar] [CrossRef]
- Fortin, G.; Adomou, M.; Perron, J. Experimental Study of Hybrid Anti-Icing Systems Combining Thermoelectric and Hydro-Phobic Coatings; SAE International: Montreal, QC, Canada, 2011. [Google Scholar]
- EASA. Available online: https://www.easa.europa.eu/document-library/certification-specifications/cs-25-amendment-26-0 (accessed on 22 December 2020).
- Piscitelli, F. Rivestimento Superidrofobico e Ghiacciofobico di un Substrato, Metodo per il Suo Ottenimento e Substrato Così Rivestito. Italian Patent Application N. IT102021000032444, 23 December 2021. [Google Scholar]
- ISO 4288:1996; Geometrical Product Specifications (GPS)–Surface Texture: Profile Method–Rules and Procedures for the As-sessment of Surface Texture. International Organization for Standardization: Geneva, Switzerland, 1996.
- D7490-13; Standard Test Method for Measurement of the Surface Tension of Solid Coatings, Substrates and Pigments using Contact Angle Measurements. American Society for Testing and Materials: West Conshohocken, PA, USA, 2013.
- Owens, D.K.; Wendt, R.C. Estimation of the surface free energy of polymers. J. Appl. Polym. Sci. 1969, 13, 1741–1747. [Google Scholar] [CrossRef]
- Żenkiewicz, M. Methods for the calculation of surface free energy of solids. J. Achiev. Mater. Manuf. Eng. 2007, 24, 137–145. [Google Scholar]
- Piscitelli, F.; Chiariello, A.; Dabkowski, D.; Corraro, G.; Marra, F.; Di Palma, L. Superhydrophobic Coatings as Anti-Icing Systems for Small Aircraft. Aerospace 2020, 7, 2. [Google Scholar] [CrossRef] [Green Version]
- Piscitelli, F.; Tescione, F.; Mazzola, L.; Bruno, G.; Lavorgna, M. On a simplified method to produce hydrophobic coatings for aeronautical applications. Appl. Surf. Sci. 2019, 472, 71–81. [Google Scholar] [CrossRef]
- ASTM D3359–09; Standard Test Methods for Measuring Adhesion by Tape Test. ASTM: West Conshohocken, PA, USA, 2009.
- ASTM C633-13; Standard Test Method for Adhesion or Cohesion Strength of Thermal Spray Coatings. ASTM: West Conshohocken, PA, USA, 2017.
- Yilgor, I.; Bilgin, S.; Isik, M.; Yilgor, E. Facile preparation of superhydrophobic polymer surfaces. Polymer 2012, 53, 1180–1188. [Google Scholar] [CrossRef]
- Shang, H.M.; Wang, Y.; Takahashi, K.; Cao, G.Z.; Li, D.; Xia, Y.N. Nanostructured superhydrophobic surfaces. J. Mater. Sci. 2005, 40, 3587–3591. [Google Scholar] [CrossRef]
- Adams, R.D.; Mallick, V. The Effect of Temperature on the Strength of Adhesively-Bonded Composite-Aluminium Joints. J. Adhes. 1993, 43, 17–33. [Google Scholar] [CrossRef]
- Fortin, G.; Ilinca, A.; Perron, J. A study of Icing Events at Murdochville: Conclusions for the Wind Power Industry. In Proceedings of the Quebec Premier Wind Energy Event, International Conference, Wind Energy Remote Regions, Magdalene Islands, QC, Canada, October 2005. [Google Scholar]


| Surface Properties | IWT Test Conditions | |||||||
|---|---|---|---|---|---|---|---|---|
| Reference | Contact Angle [deg] | Ra [µm] | v [m/S] | T [°C] | Liquid Water Content [g/m3] | Median Volumetric Diameter [µm] | Active IPS | Results |
| [19] | 88–119 | 0.2–2.8 | 50 | −8 | 0.36 | 20 | NO | −29–33% ice reduction with respect to Al6061-T6; the lower the contact angle, the lower the accreted ice. |
| [18] | 158 | 8 | 50 | −10; −20 | 0.5 | 20 | NO | −25% ice reduction with respect to Al6061-T6. |
| [21] | 110–153 | 2–5 | 30 Blade rotation | −7.5; −15 | 0.8 | 20–30 | YES | At −15 °C the coating with a contact angle of 110° reduces the power consumption in anti-icing up to 44%; no relevant improvement for the other coatings. |
| [20] | 150 | 75 | −5; −8; −10 | 0.5; 0.6; 1.3 | 15; 16; 21 | YES | Reduced power consumption by 30 to 70%. | |
| [9] | Advancing angle 159; 169 | 1.1; 2.4 | 400 rpm | −8–−16 | 0.5; 2 | 30 | YES | About −60% in adhesion load of a sample with angle 159° at −8 °C and 2 g/m3 and −70% in adhesion load of a sample with angle 169° at −16 °C and 0.5 g/m3, with respect to Inconel 625. |
| [6] | Advancing angle 161 | 2.7 | 28 | −17 | 1.5; 12.3 | 50; 750 | YES | Up to 80% heating power saving. |
| [22] | 101–152 | 21 | −5; −20 | 0.3 | 20 | YES | Energy savings of 33% for glaze ice and about 13% for rime for superhydrophobic surface; of 5–10% for both hydrophobic surfaces, in both rime and glaze. | |
| Contact Angle [DEG] | H2O | CH2I2 | HCONH2 | |||
|---|---|---|---|---|---|---|
| Measured | Optimized | Measured | Optimized | Measured | Optimized | |
| CR | 70 ± 4 | 74 | 48 ± 6 | 46 | 62 ± 3 | 62 |
| SR | 82 ± 3 | 85 | 55 ± 5 | 52 | 69 ± 6 | 75 |
| C1 | 161 ± 7 | 155 | 146 ± 8 | 148 | 152 ± 8 | 153 |
| S1 | 157 ± 9 | 148 | 140 ± 10 | 130 | 136 ± 6 | 142 |
| C2 | 164 ± 6 | 157.5 | 141 ± 8 | 148.5 | 137 ± 10 | 141.5 |
| S2 | 161 ± 5 | 156 | 136 ± 7 | 139 | 139 ± 11 | 150 |
| TEST ID | Static T [°C] | V [m/s] | Total T [°C] | Altitude [m] | LWC [g/m3] | MVD [µm] | Mach | Test Duration [s] | Flight Path [km] |
|---|---|---|---|---|---|---|---|---|---|
| 1 | −22.98 | 94.9 | −18.55 | 3001 | 0.602 | 22.08 | 0.299 | 79 | 7.50 |
| 2 | −22.95 | 94.5 | −18.57 | 83 | 0.553 | 19.92 | 0.298 | 77 | 7.27 |
| 3 | −5.97 | 95.0 | −1.53 | 3002 | 0.307 | 22.27 | 0.290 | 137 | 13.01 |
| 4 | −3.10 | 50.0 | −1.91 | 3001 | 0.297 | 20.04 | 0.152 | 227 | 11.35 |
| 5 | −12.18 | 50.0 | −10.98 | 3000 | 0.298 | 20.05 | 0.154 | 228 | 11.39 |
| 6 | −7.96 | 95.0 | −3.52 | 3007 | 0.293 | 21.90 | 0.291 | 72 | 6.84 |
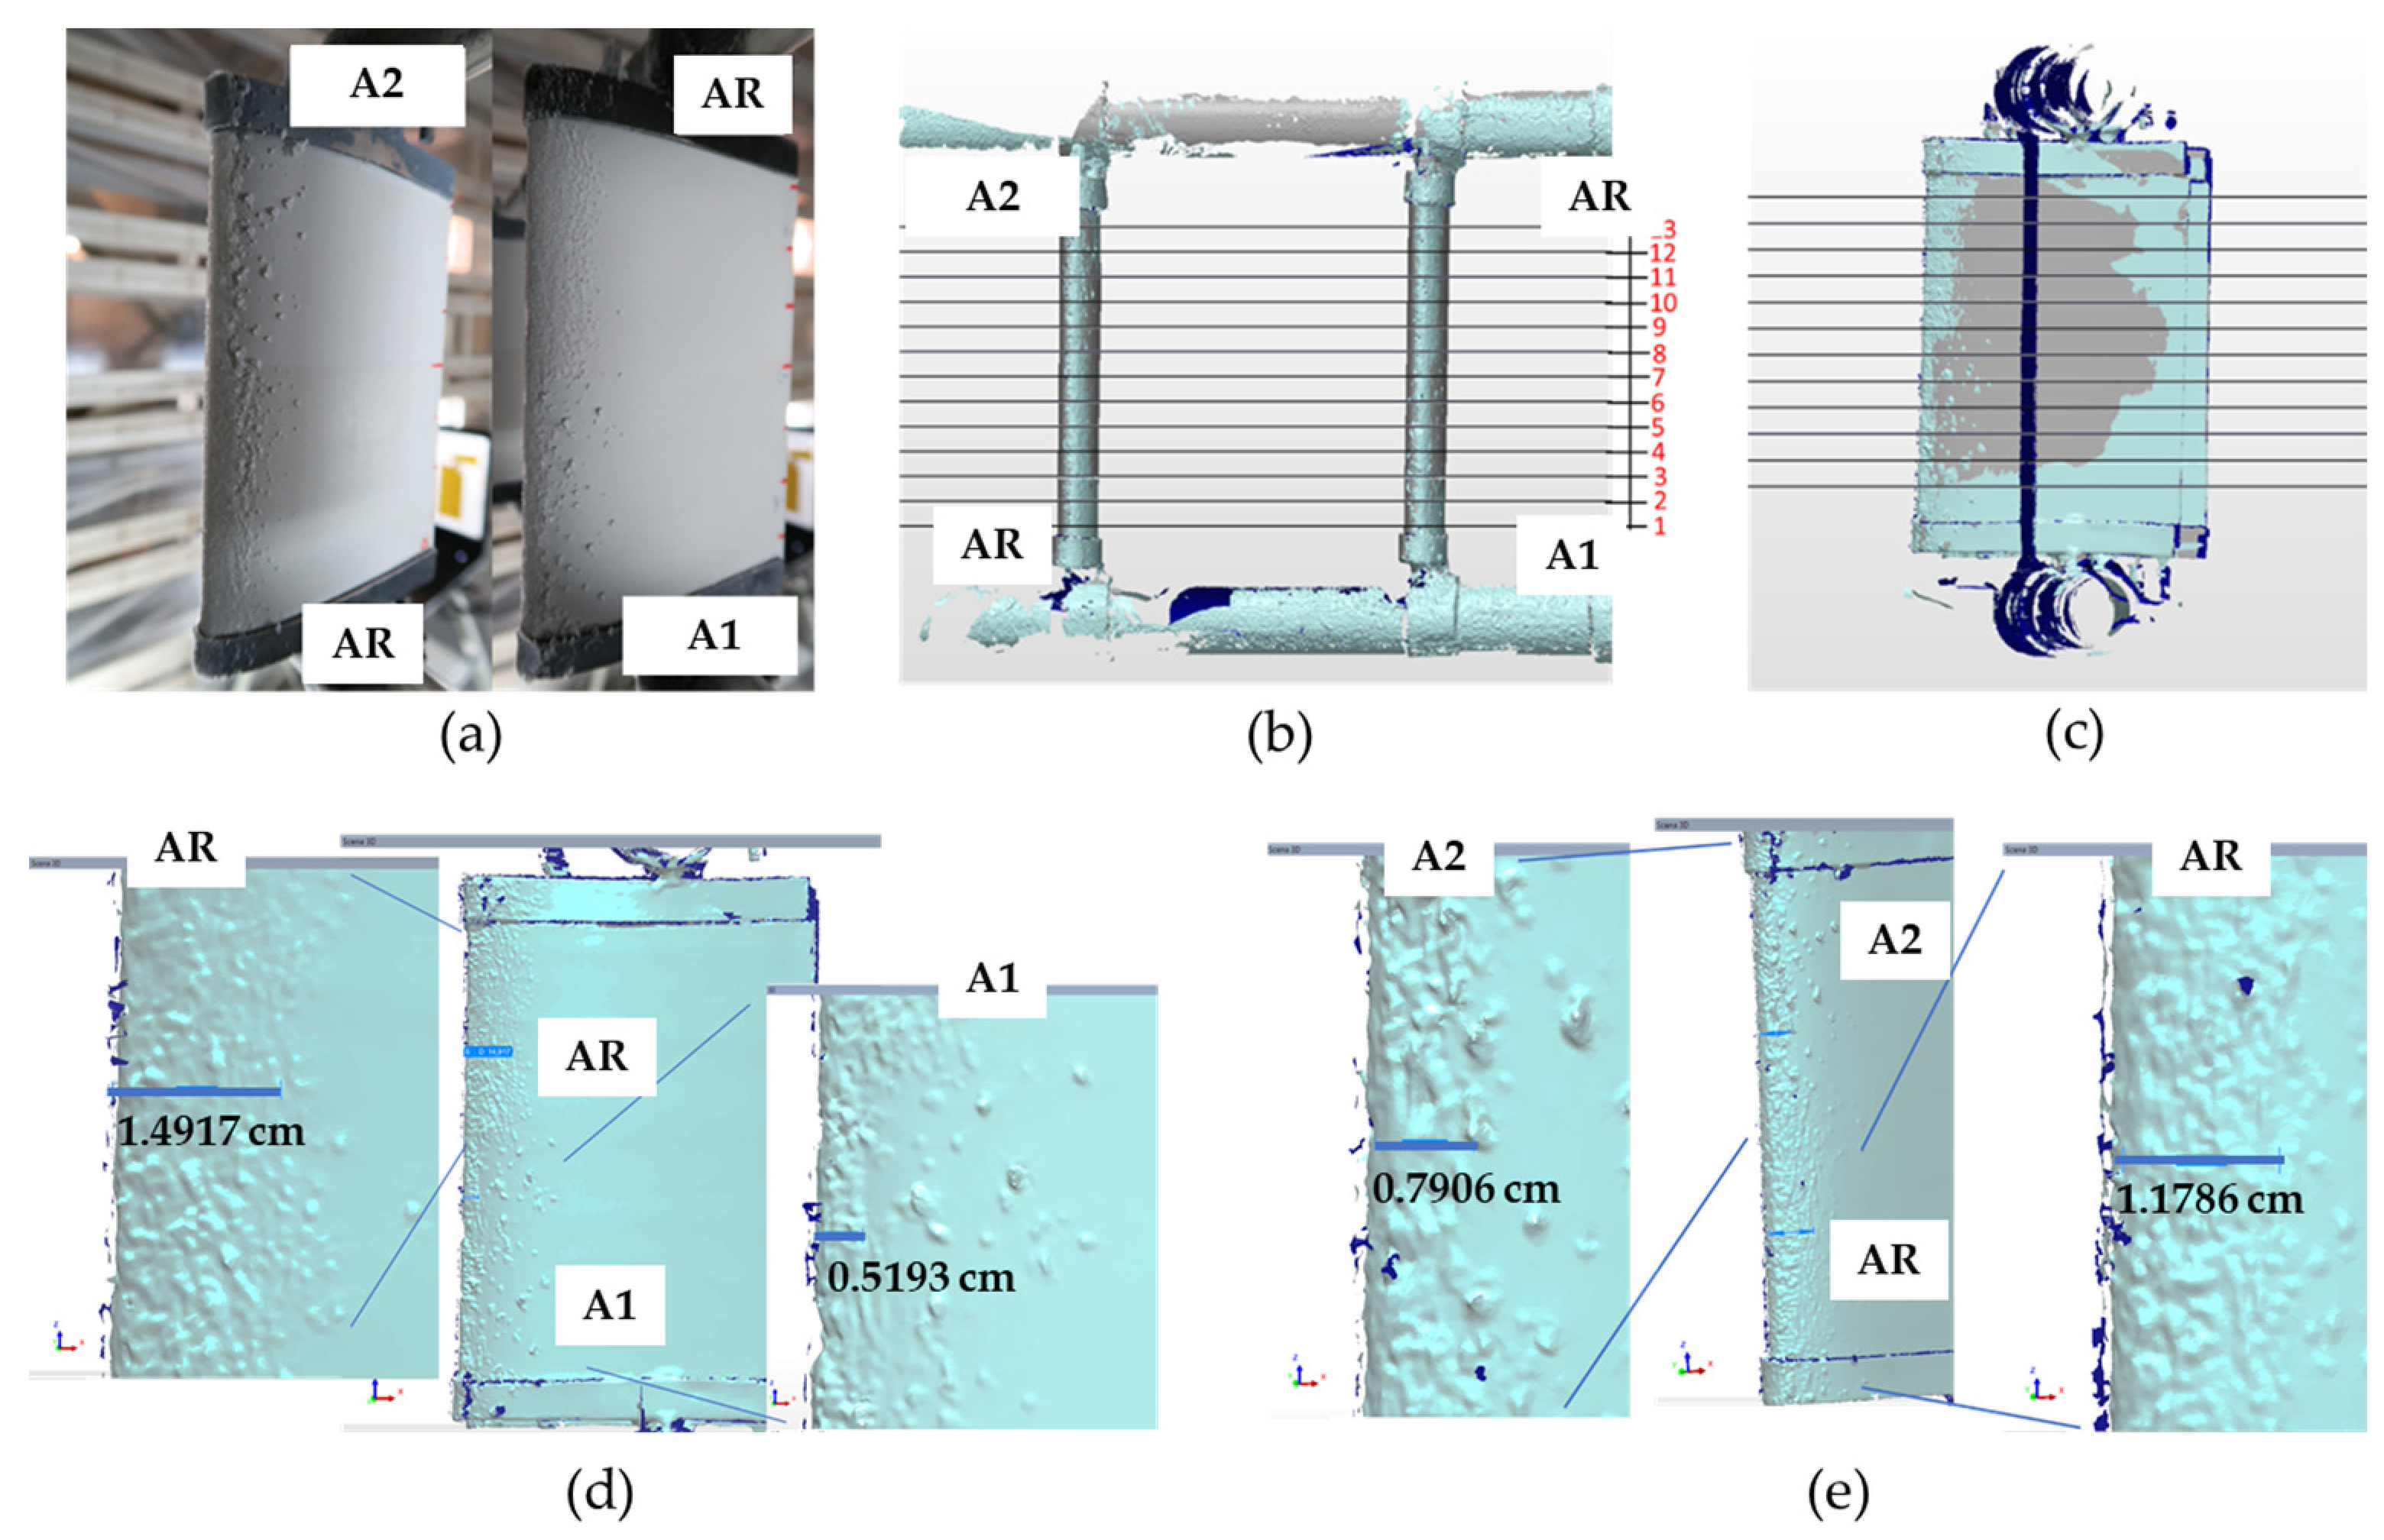
| Experimental [cm] | 3D Scan [cm] | ||
|---|---|---|---|
| SAMPLE 1 | A1 | 0.5 | 0.52 |
| AR | 1.5 | 1.49 | |
| SAMPLE 2 | A2 | 0.8 | 0.79 |
| AR | 1.2 | 1.18 | |
Publisher’s Note: MDPI stays neutral with regard to jurisdictional claims in published maps and institutional affiliations. |
© 2022 by the author. Licensee MDPI, Basel, Switzerland. This article is an open access article distributed under the terms and conditions of the Creative Commons Attribution (CC BY) license (https://creativecommons.org/licenses/by/4.0/).
Share and Cite
Piscitelli, F. Characterization in Relevant Icing Conditions of Two Superhydrophobic Coatings. Appl. Sci. 2022, 12, 3705. https://doi.org/10.3390/app12083705
Piscitelli F. Characterization in Relevant Icing Conditions of Two Superhydrophobic Coatings. Applied Sciences. 2022; 12(8):3705. https://doi.org/10.3390/app12083705
Chicago/Turabian StylePiscitelli, Filomena. 2022. "Characterization in Relevant Icing Conditions of Two Superhydrophobic Coatings" Applied Sciences 12, no. 8: 3705. https://doi.org/10.3390/app12083705
APA StylePiscitelli, F. (2022). Characterization in Relevant Icing Conditions of Two Superhydrophobic Coatings. Applied Sciences, 12(8), 3705. https://doi.org/10.3390/app12083705