
Preliminary Evaluation of Derived Concentration Guideline Level for Surface Soil at Wolsong NPP Site Using RESRAD-ONSITE Code


Abstract
:1. Introduction
2. Materials and Methods
2.1. RESRAD-ONSITE Computational Code
2.2. Target Radionuclides
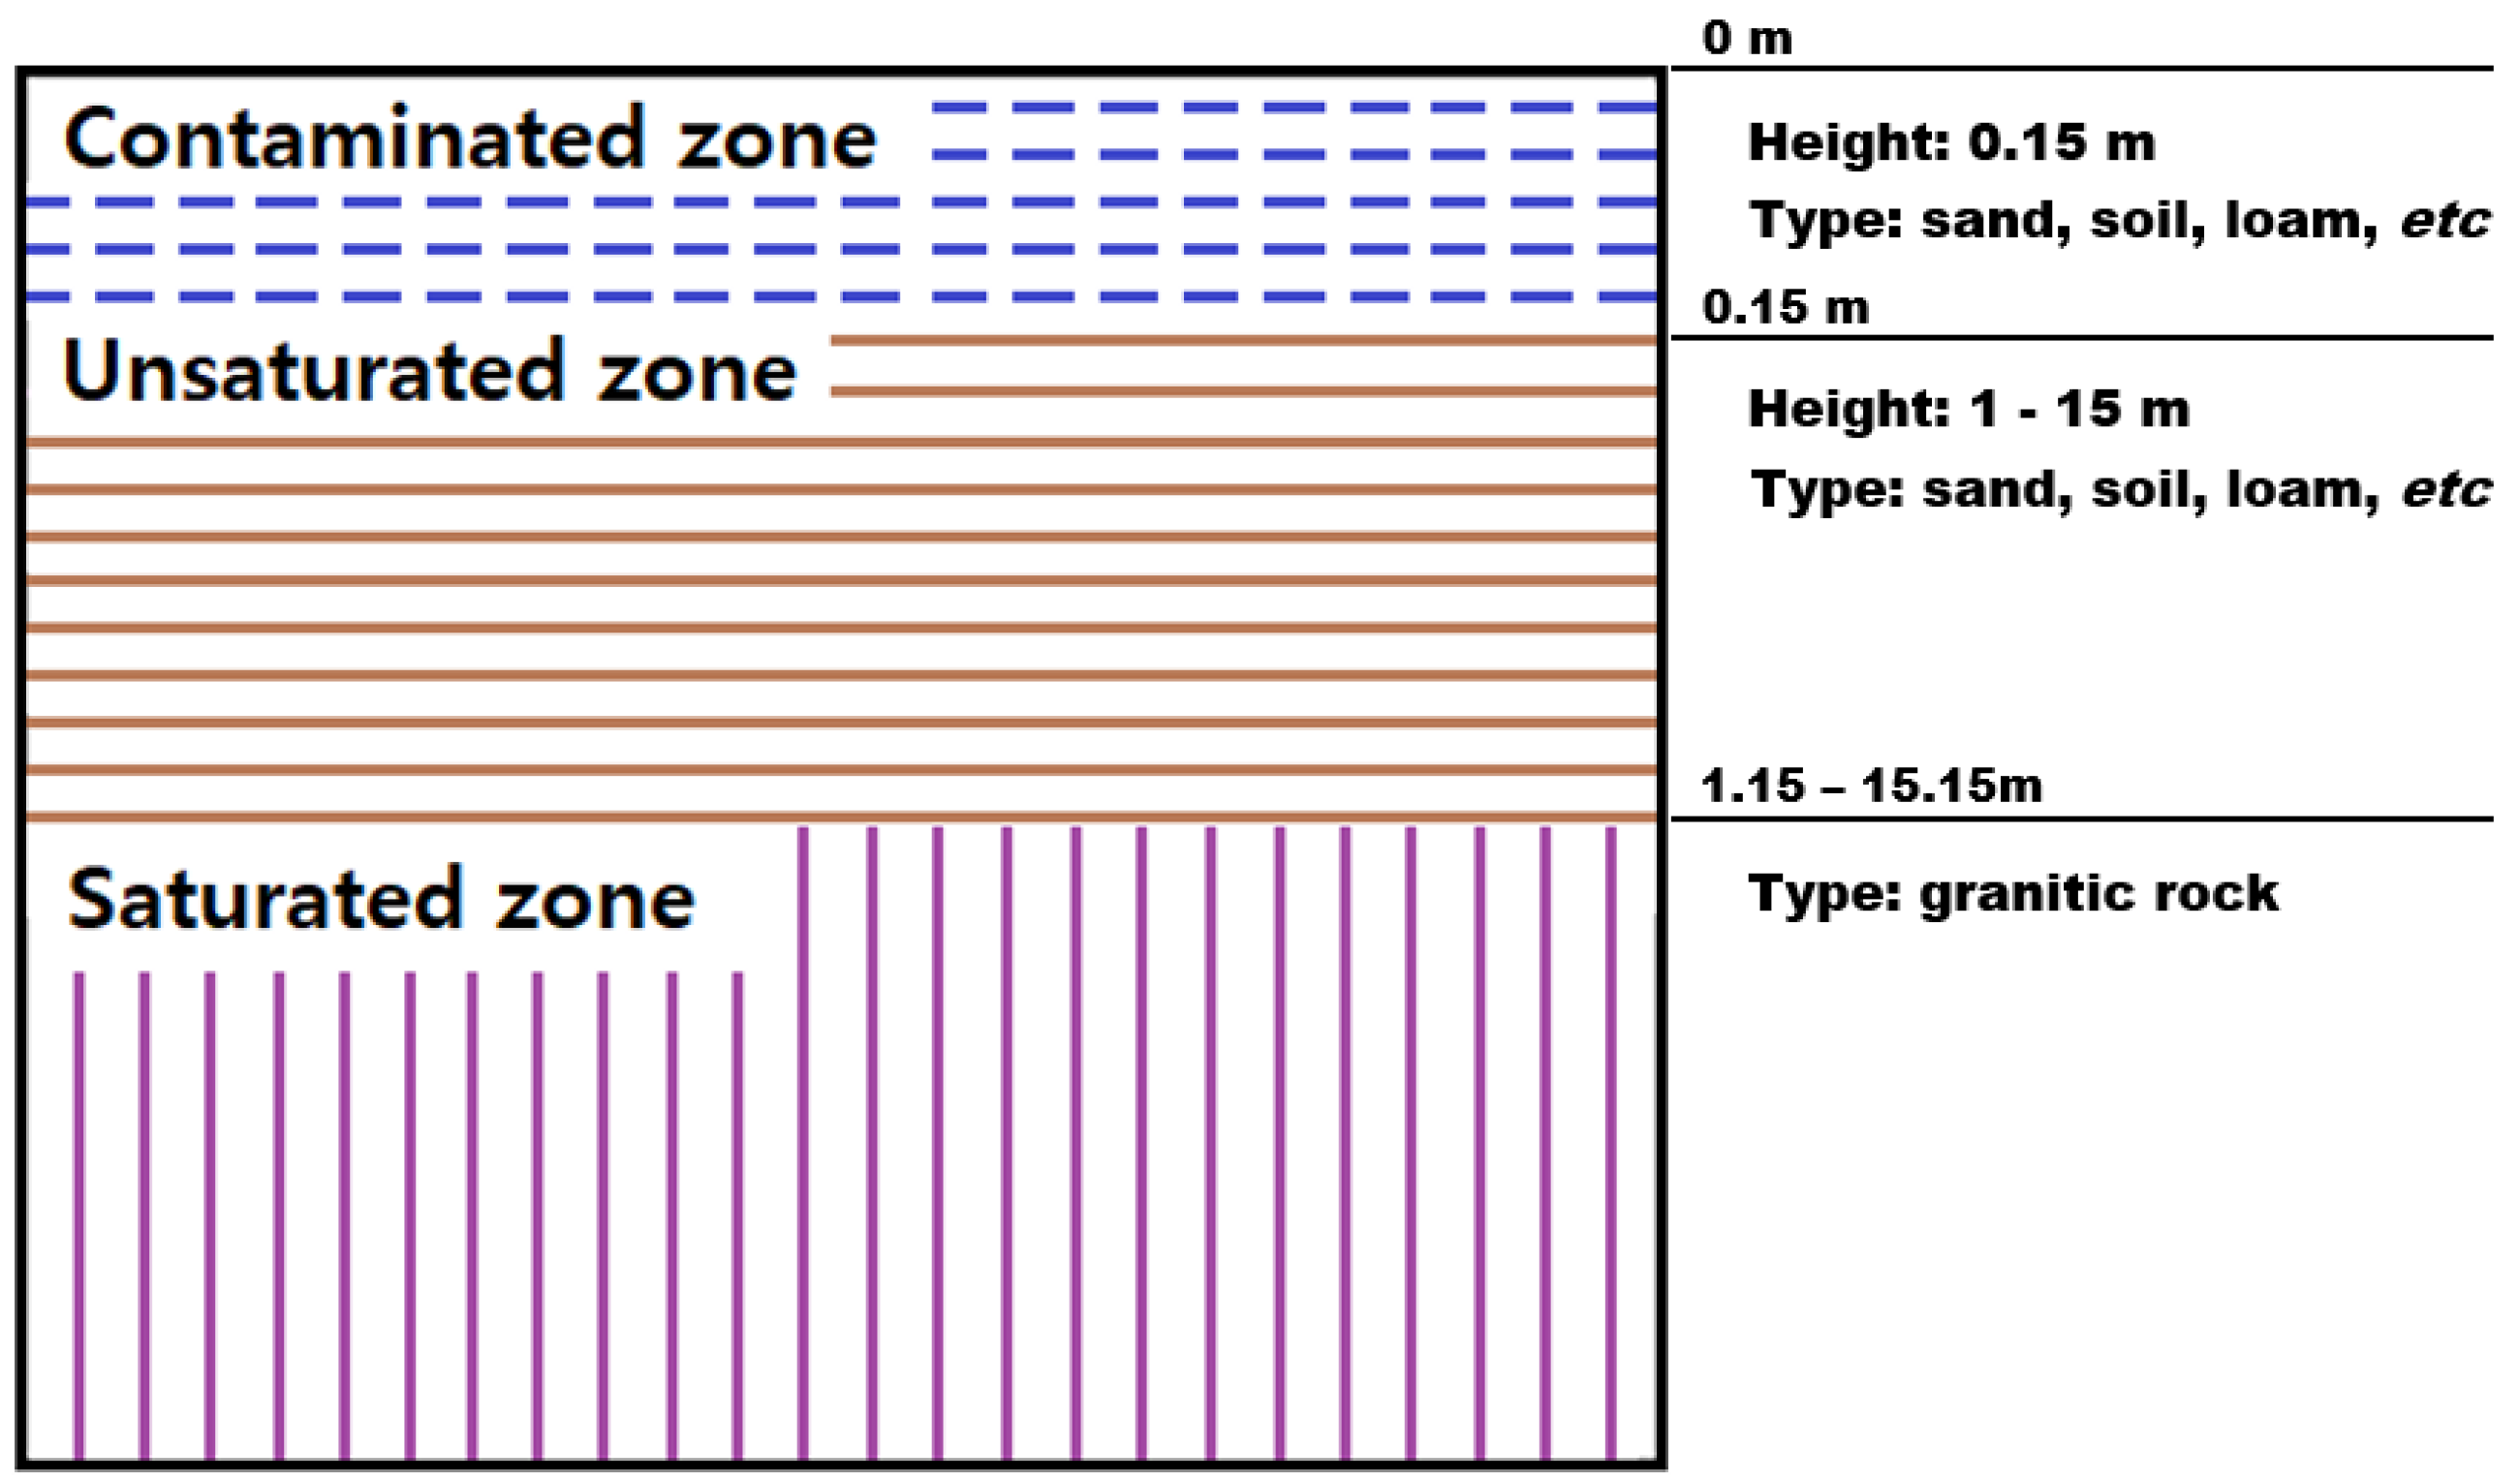
2.3. Geological Structure Model
2.4. Distribution Coefficient
2.5. Input Parameters
2.6. Probabilistic Analysis
3. Results
4. Discussion
5. Conclusions
Author Contributions
Funding
Institutional Review Board Statement
Informed Consent Statement
Data Availability Statement
Acknowledgments
Conflicts of Interest
Appendix A

| No | Parameter | Value | Unit | Reference |
|---|---|---|---|---|
| Source | ||||
| 1 | Radionuclide concentration | 0.037 | Bq·g−1 | Initial concentration (=1 pCi·g−1) |
| Transport factors | ||||
| 2 | Number of unsaturated zones | 1 | - | NUREG/CR-7267 [19] |
| 3 | Time since placement of material | 0 | year | NUREG/CR-7267 [19] |
| 4 | Groundwater concentration | 0 | pCi·L−1 | NUREG/CR-7267 [19] |
| 5 | Leach rate | (Nuclide specific) | year−1 | NUREG/CR-7267 [19] |
| 6 | Solubility limit | (Nuclide specific) | mol·L−1 | NUREG/CR-7267 [19] |
| 7 | Use plant/soil ratio | Unchecked | - | NUREG/CR-7267 [19] |
| Calculation parameters | ||||
| 8 | Times for calculations | 1, 3, 10, 30, 100, 300, 1000 | year | NUREG/CR-7267 [19] |
| Contaminated zone parameters | ||||
| 9 | Area of contaminated zone | 49,518 | m2 | Area of Wolsong NPP unit 1 [14] |
| 10 | Thickness of contaminated zone | 0.15 | m | Case of Rancho Seco NPP [3] |
| 11 | Length parallel to aquifer flow | 100 | m | NUREG/CR-7267 [19] |
| 12 | Does the initial contamination penetrate the water table | Unchecked | - | NUREG/CR-7267 [19] |
| 13 | Contaminated fraction below the water table | 0 | - | NUREG/CR-7267 [19] |
| Cover and contaminated zone hydrological data | ||||
| 14 | Cover depth | 0 | m | NUREG/CR-7267 [19] |
| 15 | Cover erosion rate | 0.001 | m·year−1 | NUREG/CR-7267 [19] |
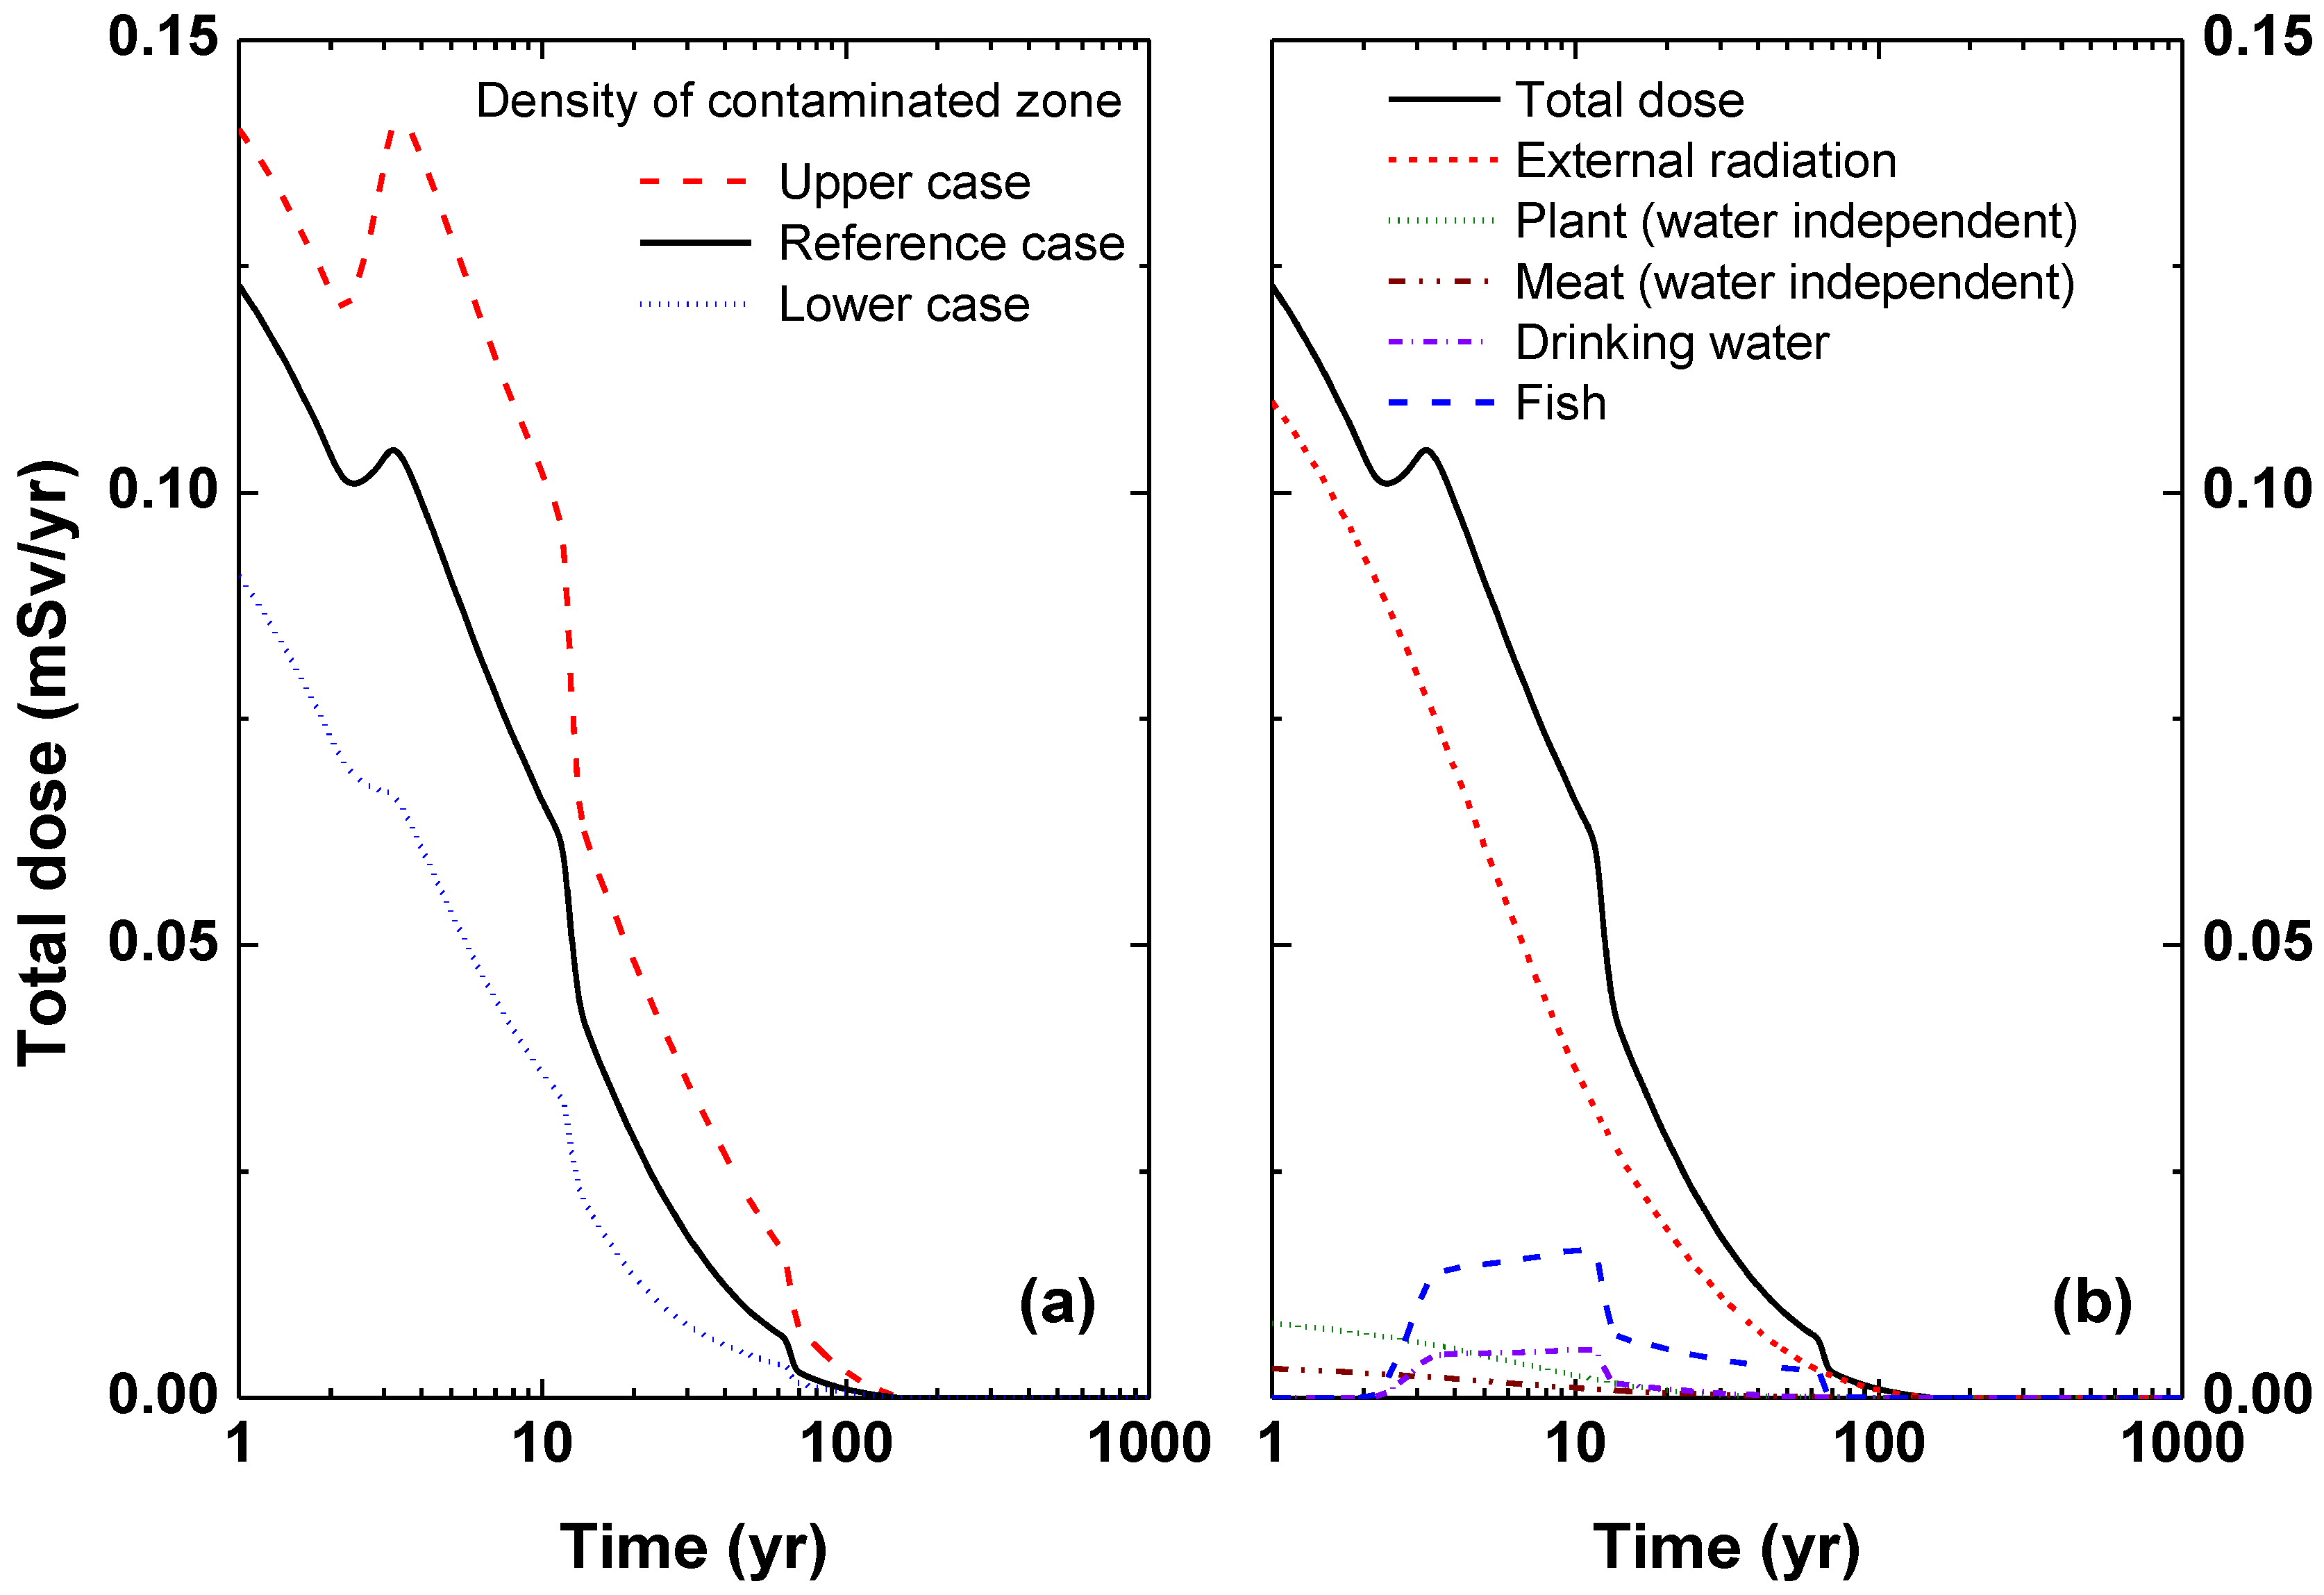
| 16 | Density of contaminated zone | Normal distribution 1: 1.5635, 2: 0.2385 | g·cm−3 | NUREG/CR-6697 [17] |
| 17 | Contaminated zone total porosity | Normal distribution 1: 0.41, 2: 0.0899 | - | NUREG/CR-6697 [17] |
| 18 | Contaminated zone field capacity | 0.18 | - | C. Yu [18] |
| 19 | Contaminated zone erosion rate | 0.001 | m·year−1 | NUREG/CR-7267 [19] |
| 20 | Contaminated zone hydraulic conductivity | Bounded lognormal-n 1: 5.022, 2: 1.33, 3: 2.49, 4: 9250 | m·year−1 | NUREG/CR-6697 [17] |
| 21 | Contaminated zone b parameter | Bounded lognormal-n 1: 0.632, 2: 0.282, 3: 0.786, 4: 4.5 | - | NUREG/CR-6697 [17] |
| 22 | Evapotranspiration coefficient | Uniform distribution min: 0.5, max: 0.75 | - | NUREG/CR-6697 [17] |
| 23 | Wind speed | 2.5 | m·s−1 | Average annual wind speed in Gyeongju city, 2011–2020 [26] |
| 24 | Precipitation | 1.12 | m·year−1 | Average annual precipitation in Gyeongju city, 2011–2020 [26] |
| 25 | Irrigation | 0.2 | m·year−1 | NUREG/CR-7267 [19] |
| 26 | Irrigation mode | Overhead | - | NUREG/CR-7267 [19] |
| 27 | Runoff coefficient | Uniform distribution min: 0.1, max: 0.8 | - | NUREG/CR-6697 [17] |
| 28 | Watershed area for nearby stream or pond | 1,000,000 | m2 | NUREG/CR-7267 [19] |
| 29 | Accuracy for water soil computation | 0.001 | - | NUREG/CR-7267 [19] |
| Saturated zone hydrological data | ||||
| 30 | Density of saturated zone | 2.56 | g·cm−3 | Case of Wolsong NPP unit 2 [14] |
| 31 | Saturated zone total porosity | 0.45 | - | C. Yu [18] |
| 32 | Saturated zone effective porosity | 0.185 | - | Average value of the effective porosity of volcanic tuff [18] |
| 33 | Saturated zone field capacity | 0.2 | - | NUREG/CR-7267 [19] |
| 34 | Saturated zone hydraulic conductivity | 15.768 | m·year−1 | W. Sohn [20] |
| 35 | Saturated zone hydraulic gradient | Bounded lognormal-n 1: −5.11, 2: 1.77,3: 0.00007, 4: 0.5 | - | NUREG/CR-6697 [17] |
| 36 | Saturated zone b parameter | 5.3 | - | NUREG/CR-7267 [19] |
| 37 | Water table drop rate | 0.001 | m·year−1 | NUREG/CR-7267 [19] |
| 38 | Well pump intake depth (below the water table) | 10 | m | NUREG/CR-7267 [19] |
| 39 | Model for water transport parameters: non-dispersion or mass-balance | Non-dispersion | - | C. Yu [10] |
| 40 | Well pumping rate | 250 | m3·year−1 | NUREG/CR-7267 [19] |
| Unsaturated zone parameters | ||||
| 41 | Unsaturated zone thickness | Uniform distribution min: 1, max: 15 | m | Case of Wolsong NPP [14] |
| 42 | Unsaturated zone density | Normal distribution 1: 1.5105, 2: 0.159 | g·cm−3 | NUREG/CR-6697 [17] |
| 43 | Unsaturated zone total porosity | Normal distribution 1: 0.43, 2: 0.06 | - | NUREG/CR-6697 [17] |
| 44 | Unsaturated zone effective porosity | Normal distribution 1: 0.383, 2: 0.061 | - | NUREG/CR-6697 [17] |
| 45 | Unsaturated zone field capacity | 0.2 | - | NUREG/CR-7267 [19] |
| 46 | Unsaturated zone, soil-specific b parameter | Bounded lognormal-n 1: −0.0253, 2: 0.216, 3: 0.501, 4: 1.9 | - | NUREG/CR-6697 [17] |
| 47 | Unsaturated zone hydraulic conductivity | Bounded lognormal-n 1: 1.398, 2: 1.842, 3: 110, 4: 5870 | m·year−1 | NUREG/CR-6697 [17] |
| Occupancy, inhalation, and external gamma data | ||||
| 48 | Inhalation rate | Triangular distribution 1: 4380, 2: 8400, 3: 13100 | m3·year−1 | NUREG/CR-6697 [17] |
| 49 | Mass loading for inhalation | Continuous linear distribution | g·m−3 | NUREG/CR-6697 [17] |
| 50 | Exposure duration | 30 | year | NUREG/CR-7267 [19] |
| 51 | Inhalation shielding Factor | Uniform distribution min: 0.1, max: 0.95 | - | NUREG/CR-6697 [17] |
| 52 | External gamma shielding factor | Bounded lognormal-n 1: −1.3, 2: 0.59, 3: 0.044, 4: 1 | - | NUREG/CR-6697 [17] |
| 53 | Indoor time fraction | 0.5 | - | NUREG/CR-7267 [19] |
| 54 | Outdoor time fraction | 0.25 | - | NUREG/CR-7267 [19] |
| 55 | Shape of the contaminated zone (shape factor flag) | Circular | - | NUREG/CR-7267 [19] |
| Ingestion pathway, dietary data | ||||
| 56 | Fruit, vegetable, and grain consumption | 286.4 | kg·year−1 | The sum of fruit, vegetable, and grain consumption in South Korea in 2019 [21] |
| 57 | Leafy vegetable consumption | 38.4 | kg·year−1 | Annual leafy vegetable consumption in South Korea in 2014 [34] |
| 58 | Milk consumption | 83.9 | L·year−1 | Annual dairy product consumption in South Korea in 2020 [22] |
| 59 | Meat and poultry consumption | 54.6 | kg·year−1 | Annual meat consumption in South Korea in 2019 [23] |
| 60 | Fish consumption | 24.1 | kg·year−1 | Annual fish consumption in South Korea in 2019 [24] |
| 61 | Other seafood consumption | 43.2 | kg·year−1 | Annual consumption of seaweed and shellfish in South Korea in 2019 [24] |
| 62 | Soil ingestion | Triangular distribution 1: 0, 2: 18.3, 3: 36.5 | g·year−1 | NUREG/CR-6697 [17] |
| 63 | Drinking water intake | 312.87 | L·year−1 | Average annual water intake per male and female by average age group from 2013 to 2017 [25] |
| 64 | Drinking water contaminated fraction | 1 | - | NUREG/CR-7267 [19] |
| 65 | Household water contaminated fraction | 1 | - | NUREG/CR-7267 [19] |
| 66 | Livestock water contaminated fraction | 1 | - | NUREG/CR-7267 [19] |
| 67 | Irrigation water contaminated fraction | 1 | - | NUREG/CR-7267 [19] |
| 68 | Aquatic food contaminated fraction | 0.5 | - | NUREG/CR-7267 [19] |
| 69 | Plant food contaminated fraction | −1 | - | NUREG/CR-7267 [19] |
| 70 | Meat contaminated fraction | −1 | - | NUREG/CR-7267 [19] |
| 71 | Milk contaminated fraction | −1 | - | NUREG/CR-7267 [19] |
| Ingestion pathway, non-dietary data | ||||
| 72 | Livestock fodder intake for meat | 68 | kg·d−1 | NUREG/CR-7267 [19] |
| 73 | Livestock fodder intake for milk | 55 | kg·d−1 | NUREG/CR-7267 [19] |
| 74 | Livestock water intake for meat | 50 | L·d−1 | NUREG/CR-7267 [19] |
| 75 | Livestock water intake for milk | 160 | L·d−1 | NUREG/CR-7267 [19] |
| 76 | Livestock intake of soil | 0.5 | kg·d−1 | NUREG/CR-7267 [19] |
| 77 | Mass loading for foliar deposition | 0.0001 | g·m−3 | NUREG/CR-7267 [19] |
| 78 | Depth of soil mixing layer | Triangular distribution 1: 0, 2: 0.15, 3: 0.6 | m | NUREG/CR-6697 [17] |
| 79 | Depth of roots | 0.9 | m | NUREG/CR-7267 [19] |
| 80 | Groundwater fractional usage for drinking water | 1 | - | NUREG/CR-7267 [19] |
| 81 | Groundwater fractional usage for household water | 1 | - | NUREG/CR-7267 [19] |
| 82 | Groundwater fractional usage for livestock water | 1 | - | NUREG/CR-7267 [19] |
| 83 | Groundwater fractional usage for irrigation water | 1 | - | NUREG/CR-7267 [19] |
| Plant factors | ||||
| 84 | Wet-weight crop yields—non-leafy | 0.7 | kg·m−2 | NUREG/CR-7267 [19] |
| 85 | Wet-weight crop yields—leafy | 1.5 | kg·m−2 | NUREG/CR-7267 [19] |
| 86 | Wet-weight crop yields—fodder | 1.1 | kg·m−2 | NUREG/CR-7267 [19] |
| 87 | Length of growing season—non-leafy | 0.17 | year | NUREG/CR-7267 [19] |
| 88 | Length of growing season—leafy | 0.25 | year | NUREG/CR-7267 [19] |
| 89 | Length of growing season—fodder | 0.08 | year | NUREG/CR-7267 [19] |
| 90 | Translocation factor—non-leafy | 0.1 | - | NUREG/CR-7267 [19] |
| 91 | Translocation factor—leafy and fodder | 1 | - | NUREG/CR-7267 [19] |
| 92 | Weathering removal constant | 20 | year−1 | NUREG/CR-7267 [19] |
| 93 | Wet foliar interception fraction for non-leafy vegetable | 0.25 | - | NUREG/CR-7267 [19] |
| 94 | Wet foliar interception fraction for leafy vegetable | 0.25 | - | NUREG/CR-7267 [19] |
| 95 | Wet foliar interception fraction for fodder | 0.25 | - | NUREG/CR-7267 [19] |
| 96 | Dry foliar interception fraction for non-leafy vegetable | 0.25 | - | NUREG/CR-7267 [19] |
| 97 | Dry foliar interception fraction for leafy vegetable | 0.25 | - | NUREG/CR-7267 [19] |
| 98 | Dry foliar interception fraction for fodder | 0.25 | - | NUREG/CR-7267 [19] |
| Storage times before data use | ||||
| 99 | Storage times for fruits, non-leafy vegetables, and grain | 14 | day | NUREG/CR-7267 [19] |
| 100 | Storage times for leafy vegetables | 1 | day | NUREG/CR-7267 [19] |
| 101 | Storage times for milk | 1 | day | NUREG/CR-7267 [19] |
| 102 | Storage times for meat | 20 | day | NUREG/CR-7267 [19] |
| 103 | Storage times for fish | 7 | day | NUREG/CR-7267 [19] |
| 104 | Storage times for crustacea and mollusks | 7 | day | NUREG/CR-7267 [19] |
| 105 | Storage times for well water | 1 | day | NUREG/CR-7267 [19] |
| 106 | Storage times for surface water | 1 | day | NUREG/CR-7267 [19] |
| 107 | Storage times for livestock fodder | 45 | day | NUREG/CR-7267 [19] |
| Carbon-14 data | ||||
| 108 | C-12 concentration in local water | 2.0 × 10⁻⁵ | g·cm−3 | NUREG/CR-7267 [19] |
| 109 | C-12 concentration in contaminated soil | 0.03 | g·g−1 | NUREG/CR-7267 [19] |
| 110 | Fraction of vegetation carbon absorbed from soil | 0.02 | - | NUREG/CR-7267 [19] |
| 111 | Fraction of vegetation carbon absorbed from air | 0.98 | - | NUREG/CR-7267 [19] |
| 112 | Thickness of evasion layer of C-14 in soil | 0.3 | m | NUREG/CR-7267 [19] |
| 113 | C-14 evasion flux rate from soil | 7.0 × 10⁻⁷ | s−1 | NUREG/CR-7267 [19] |
| 115 | C-12 evasion flux rate from soil | 1.0 × 10⁻¹⁰ | s−1 | NUREG/CR-7267 [19] |
| 116 | Grain fraction in livestock feed-beef cattle | 0.8 | - | NUREG/CR-7267 [19] |
| 117 | Grain fraction in livestock feed-cow | 0.2 | - | NUREG/CR-7267 [19] |
| Radionuclides | Parameters | PRCC | Assigned Value |
|---|---|---|---|
| 108mAg | External gamma shielding factor | 0.97 | 3.98 × 10⁻¹ |
| Kd of 108mAg in contaminated zone | 0.74 | 1.23 × 101 | |
| Density of contaminated zone | 0.71 | 1.72 × 100 | |
| Runoff coefficient | 0.44 | 6.24 × 10⁻¹ | |
| Evapotranspiration coefficient | 0.36 | 6.87 × 10⁻¹ | |
| 14C | Density of contaminated zone | 1 | 1.72 × 100 |
| Kd of 14C in contaminated zone | 0.81 | 2.54 × 100 | |
| Runoff coefficient | 0.59 | 6.24 × 10⁻¹ | |
| Evapotranspiration coefficient | 0.55 | 6.87 × 10⁻¹ | |
| 60Co | External gamma shielding factor | 0.96 | 3.98 × 10⁻¹ |
| Kd of 60Co in contaminated zone | 0.79 | 1.04 × 101 | |
| Density of contaminated zone | 0.77 | 1.72 × 100 | |
| Runoff coefficient | 0.44 | 6.24 × 10⁻¹ | |
| Evapotranspiration coefficient | 0.31 | 6.87 × 10⁻¹ | |
| 134Cs | External gamma shielding factor | 0.96 | 3.98 × 10⁻¹ |
| Kd of 134Cs in contaminated zone | 0.73 | 2.42 × 101 | |
| Density of contaminated zone | 0.62 | 1.72 × 100 | |
| Runoff coefficient | 0.26 | 6.24 × 10⁻¹ | |
| 137Cs | External gamma shielding factor | 0.95 | 3.98 × 10⁻¹ |
| Kd of 137Cs in contaminated zone | 0.73 | 2.42 × 101 | |
| Density of contaminated zone | 0.59 | 1.72 × 100 | |
| Runoff coefficient | 0.27 | 6.24 × 10⁻¹ | |
| 55Fe | Depth of soil mixing layer | −0.94 | 1.50 × 10⁻¹ |
| Kd of 55Fe in contaminated zone | 0.58 | 8.03 × 100 | |
| 3H | Density of contaminated zone | 0.65 | 1.72 × 100 |
| Saturated zone hydraulic gradient | 0.56 | 1.95 × 10⁻² | |
| Evapotranspiration coefficient | −0.38 | 5.62 × 10⁻¹ | |
| Thickness of unsaturated zone 1 | −0.32 | 4.49 × 100 | |
| Runoff coefficient | 0.26 | 6.24 × 10⁻¹ | |
| 93mNb | External gamma shielding factor | 0.93 | 3.98 × 10⁻¹ |
| Kd of 93mNb in contaminated zone | 0.74 | 2.58 × 101 | |
| Soil ingestion | 0.62 | 2.36 × 101 | |
| Depth of soil mixing layer | −0.62 | 1.50 × 10⁻¹ | |
| Runoff coefficient | 0.6 | 6.25 × 10⁻¹ | |
| Evapotranspiration coefficient | 0.45 | 6.87 × 10⁻¹ | |
| Density of contaminated zone | 0.39 | 1.72 × 100 | |
| 94Nb | External gamma shielding factor | 0.99 | 3.98 × 10⁻¹ |
| Density of contaminated zone | 0.87 | 1.72 × 100 | |
| Kd of 94Nb in contaminated zone | 0.54 | 2.58 × 101 | |
| Runoff coefficient | 0.35 | 6.25 × 10⁻¹ | |
| 63Ni | Depth of soil mixing layer | −0.94 | 1.50 × 10⁻¹ |
| Kd of 63Ni in contaminated zone | 0.63 | 2.58 × 101 | |
| Runoff coefficient | 0.26 | 6.24 × 10⁻¹ | |
| Density of contaminated zone | 0.25 | 1.72 × 100 | |
| 125Sb | External gamma shielding factor | 0.94 | 3.98 × 10⁻¹ |
| Kd of 125Sb in contaminated zone | 0.84 | 3.46 × 100 | |
| Density of contaminated zone | 0.64 | 1.72 × 100 | |
| Runoff coefficient | 0.63 | 6.24 × 10⁻¹ | |
| Evapotranspiration coefficient | 0.54 | 6.87 × 10⁻¹ | |
| 121mSn | Depth of soil mixing layer | −0.89 | 1.50 × 10⁻¹ |
| External gamma shielding factor | 0.8 | 3.98 × 10⁻¹ | |
| 90Sr | Kd of 90Sr in contaminated zone | 0.97 | 6.45 × 100 |
| Runoff coefficient | 0.73 | 6.24 × 10⁻¹ | |
| Evapotranspiration coefficient | 0.57 | 6.87 × 10⁻¹ | |
| Density of contaminated zone | 0.51 | 1.72 × 100 | |
| 93Zr | Kd of 93Zr in saturated zone | −0.65 | 5.98 × 100 |
| Saturated zone hydraulic gradient | 0.64 | 1.95 × 10⁻² | |
| Density of contaminated zone | 0.5 | 1.72 × 100 | |
| Runoff coefficient | 0.41 | 6.24 × 10⁻¹ | |
| Thickness of unsaturated zone 1 | −0.39 | 4.49 × 100 | |
| Kd of 93Zr in unsaturated zone 1 | −0.33 | 1.15 × 101 | |
| Evapotranspiration coefficient | 0.33 | 6.87 × 10⁻¹ |
References
- Doehnert, M.; Wolbarst, A.; Hull, H.B.; Keith, S.; Richards, J.; Peterson, H.; Duvall, K.; Wallo, A.; Meck, R.A.; Huffert, A.; et al. Multi-Agency Radiation Survey and Site Investigation Manual (MARSSIM) Revision 1; Department of Defense: Washington, DC, USA; Department of Energy: Washington, DC, USA; Environmental Protection Agency: Washington, DC, USA; Nuclear Regulatory Commission: Washington, DC, USA, 2000. [Google Scholar]
- Schmidt, D.W.; Banovac, K.L.; Buckley, J.T.; Esh, D.W.; Johnson, R.L.; Kottan, J.J.; Mckenney, C.A.; Mclaughlin, T.; Schneider, S. Consolidated Decommissioning Guidance; Revision 2; Nuclear Regulatory Commission: Washington, DC, USA, 2006; Volume 2. [Google Scholar]
- Redeker, S. Rancho Seco License Termination Plan Chapter 6, Compliance With the Radiological Criteria for License Termination; Sacramento Municipal Utility District: Herald, CA, USA, 2008. [Google Scholar]
- Schult, D.; Decker, R.; Horvath, S.; Roche, R.C.; Baker, S.C. Technical Support Document for Potential Radionuclides of Concern during the Decommissioning of the Zion Station; Zion Solution Inc.: Zion, IL, USA, 2012. [Google Scholar]
- Smith, R.I.; Konzek, G.J.; Kennedy, W.E. Technology, Safety and Cost of Decommissioning a Reference Pressurized Water Reactor Power Station; Nuclear Regulatory Commission: Washington, DC, USA, 1978; Volume 1. [Google Scholar]
- Evans, J.C.; Lepel, E.L.; Sanders, R.W.; Wikerson, C.L.; Silker, W.; Thomas, C.W.; Abel, K.H.; Robertson, D.R. Long-Lived Activation Products in Reactor Materials, Pacific Northwest Laboratory; Nuclear Regulatory Commission: Washington, DC, USA, 1984. [Google Scholar]
- Abel, K.H.; Robertson, D.E.; Thomas, C.W.; Lepel, E.A.; Evans, J.C.; Thomas, W.V.; Carrick, L.C.; Leale, M.W. Residual Radionuclide Contamination within and around Commercial Nuclear Power Plants: Assessment of Origin, Distribution, Inventory and Decommissioning; Nuclear Regulatory Commission: Washington, DC, USA, 1986. [Google Scholar]
- Dyer, N.C. Radionuclides in United States Commercial Nuclear Power Reactors; Westinghouse Idaho Nuclear Company: Idaho Falls, ID, USA, 1994. [Google Scholar]
- Sugiura, Y.; Suyama, T.; Tachi, Y. Development of JAEA Sorption Database (JAEA-SDB): Update of Sorption/QA Data in FY 2019; Japan Atomic Energy Agency: Ibaraki, Japan, 2020. [Google Scholar]
- Yu, C.; Zielen, A.K.; Cheng, J.-J.; LePoire, D.J.; Gnanapragasam, E.; Kamboj, S.; Arnish, J.; Wallo III, A.; Williams, W.A.; Peterson, H. User’s Manual for RESRAD Version 6; Argonne National Laboratory: Lemony, IL, USA, 2001. [Google Scholar]
- Cho, D.K.; Hwang, T.W. Development and Verification of Source Term Evaluation Technology for Decommissioning of CANDU Reactor; Korea Hydro & Nuclear Power Co.: Gyeongju, Korea, 2010. [Google Scholar]
- Eckerman, K.; Endo, A. Nuclear Decay Data for Dosimetric Calculations ICRP Publication 107; International Commission on Radiological Protection: Ottawa, ON, Canada, 2008; Volume 38. [Google Scholar]
- Byon, J.H.; Park, S.J.; Ahn, S.Y. Derivation of preliminary derived concentration guideline levels for surface soil at Kori Unit 1 by RESRAD probabilistic analysis. J. Nucl. Eng. Technol. 2018, 50, 1289–1297. [Google Scholar] [CrossRef]
- Wolsong Unit 3, 4 Final Safety Analysis Report (FSAR); Korea Hydro & Nuclear Power Co.: Gyeongju, Korea, 2019; Volume 2.
- Lee, B.J. The granite in Korea peninsula and its geotechnical characteristics. In Proceedings of the Korean Geotechnical Society Conference, Seoul, Korea, 28 March 2008. [Google Scholar]
- Carblo, P.; Engkvist, I. Compilation of Radionuclide Sorption Coefficients for Performance Assessment; Swedish Nuclear Fuel and Waste Management Co.: Stockholm, Sweden, 1997. [Google Scholar]
- Yu, C.; LePoire, D.; Gnanapragasam, E.; Arnish, J.; Kamboj, S.; Biwer, B.M.; Cheng, J.-J.; Zielen, A.; Chen, S.Y. Development of Probabilistic RESRAD 6.0 and RESRAD-BUILD 3.0 Computer Codes; Argonne National Laboratory: Lemony, IL, USA, 2000. [Google Scholar]
- Yu, C.; Kamboj, S.; Wang, C.; Cheng., J.-J. Data Collection Handbook to Support Modeling Impacts of Radioactive Material in Soil and Building Structures; Argonne National Laboratory: Lemony, IL, USA, 2015. [Google Scholar]
- Kamboj, S.; Gnanapragasam, E.; Cheng, J.-J.; LePoire, D.; Wang, C.; Biwer, B.; Yu, C. Default Parameter Values and Distribution in RESRAD-ONSITE V7.2, RESRAD-BUILD V3.5, and RESRAD-OFFSITE V4.0 Computer Codes; Argonne National Laboratory: Lemony, IL, USA, 2020. [Google Scholar]
- Sohn, W.; Sohn, S.H.; Chon, C.M.; Kim, K.Y. The behavior modeling of groundwater and pollutants in the Wolsong 1st nuclear power plant. In Proceedings of the Korean Radioactive Waste Society Autumn 2010, Busan, Korea, 7 October 2010. [Google Scholar]
- Kim, H.S. Agriculture Outlook 2021; Korea Rural Economic Institute: Naju, Korea, 2021. [Google Scholar]
- Choi, H.J. 2021 Dairy Statistics Yearbook; Korea Dairy Committee: Sejong, Korea, 2021. [Google Scholar]
- Jeong, M.K.; Kim, H.J.; Lee, H.W. Consumer Behavior for Meat Consumption and Tasks to Respond to Its Changes; Korea Rural Economic Institute: Naju, Korea, 2020. [Google Scholar]
- Jang, Y.T.; Lee, N.S. 2020 Survey on the Production and Distribution Industry of Fisheries; Ministry of Oceans and Fisheries: Busan, Korea, 2021. [Google Scholar]
- Kwon, O. 2020 Dietary Reference Intakes for Koreans: Energy and Macronutrients; Ministry of Health and Welfare: Seoul, Korea, 2020. [Google Scholar]
- Park, G.S. Climatological Normals of Korea (1991―2020); Korea Meteorological Administration: Seoul, Korea, 2021. [Google Scholar]
- Park, S.J. Safety Assessment Using the RESRAD Code from the PERSPECTIVES fo Kore Unit 1 Decommissioning and Gyeongju Radioactive Disposal Facility. Ph.D. Thesis, Pusan National University, Busan, Korea, 2021. [Google Scholar]
- Bushart, S. Connecticut Yankee Decommissioning Experience Report: Detailed Experiences 1996―2006; EPRI: Palo Alto, MA, USA, 2006. [Google Scholar]
- Kay, J.A. Yankee Nuclear Plant Station License Termination Plan; Yankee Atomic Electric Company: Rowe, MA, USA, 2004. [Google Scholar]
- Fauver, D.; Farr, H.; Yetter, R. RESRAD Dose Modeling for Basement Fill Model, Soil DCGL and Calculation of Basement Fill Model Dose Factors; Zion solution Inc.: Zion, IL, USA, 2015. [Google Scholar]
- Application of the Concepts of Exclusion, Exemption and Clearance Safety Guide; International Atomic Energy Agency (IAEA): Vienna, Austria, 2004.
- Lim, Y.K.; Kim, H.S.; Son, J.K.; Park, K.R.; Kang, K.D.; Kim, K.D.; Jeong, C.W. Key Parameters Analysis of Important Radionuclides in Dose Evaluation Model of Decommissioning Site. In Proceedings of the Korean Radioactive Waste Society, Seoul, Korea, 24 June 2004. [Google Scholar]
- Lee, J.-Y.; Park, S.J.; Ahn, S. Impact of Updated OECD/NEA Thermodynamic Database on the Safety Assessment of Radioactive Waste Repository Studied Using RESRAD-OFFSITE Code. Appl. Sci. 2021, 11, 7269–7280. [Google Scholar] [CrossRef]
- Lee, Y.C. National Food & Nutrition Statistics I: Based on 2014 Korea National Health and Nutrition Examination Survey; Korea Health Industry Development Institute: Cheongju, Korea, 2016. [Google Scholar]
| Radionuclide | Relative Fraction of Radioactivity (%) | Decay Constant (s−1) |
|---|---|---|
| 108mAg | 5.1 | 5.26 × 10⁻¹¹ |
| 14C | 2.5 | 3.86 × 10⁻¹² |
| 60Co | 7.6 | 4.17 × 10⁻⁹ |
| 134Cs | 7.9 × 10⁻⁵ | 1.06 × 10⁻⁸ |
| 137Cs | 4.9 × 10⁻⁵ | 7.29 × 10⁻¹⁰ |
| 55Fe | 8.1 | 8.03 × 10⁻⁹ |
| 3H | 6.2 × 10⁻² | 1.78 × 10⁻⁹ |
| 93mNb | 1.5 | 1.36 × 10⁻⁹ |
| 94Nb | 70.6 | 1.08 × 10⁻¹² |
| 63Ni | 1.2 | 2.20 × 10⁻¹⁰ |
| 125Sb | 0.3 | 7.97 × 10⁻⁹ |
| 121mSn | 1.2 × 10⁻² | 5.01 × 10⁻¹⁰ |
| 90Sr | 2.0 × 10⁻² | 7.63 × 10⁻¹⁰ |
| 93Zr | 2.5 | 1.44 × 10⁻¹⁴ |
| Radionuclides | Zones | Log of Kd (cm3·g−1) | Reference |
|---|---|---|---|
| Ag | Contaminated zone Unsaturated zone | 2.07 ± 0.65 | [9] |
| Saturated zone | 2.03 ± 1.09 a | [9,16] | |
| C | Contaminated zone Unsaturated zone | 0.54 ± 0.59 | [9] |
| Saturated zone | 0.0 b | [16] | |
| Co | Contaminated zone Unsaturated zone | 1.87 ± 0.71 | [9] |
| Saturated zone | 2.65 ± 0.24 | [9] | |
| Cs | Contaminated zone Unsaturated zone | 2.52 ± 0.99 | [9] |
| Saturated zone | 2.03 ± 1.09 | [9] | |
| Fe | Contaminated zone Unsaturated zone | 1.55 ± 0.80 | [9] |
| Saturated zone | 1.55 ± 0.80 | [9] | |
| H | Contaminated zone Unsaturated zone | non-absorbable | [9] |
| Saturated zone | non-absorbable | [9] | |
| Nb | Contaminated zone Unsaturated zone | 2.93 ± 0.48 | [9] |
| Saturated zone | 2.41 ± 0.57 | [9] | |
| Ni | Contaminated zone Unsaturated zone | 2.82 ± 0.65 | [9] |
| Saturated zone | 1.80 ± 0.72 | [9] | |
| Sb | Contaminated zone Unsaturated zone | 0.87 ± 0.55 | [9] |
| Saturated zone | 3.05 ± 0.37 | [9] | |
| Sn | Contaminated zone Unsaturated zone | 3.52 ± 0.70 | [9] |
| Saturated zone | 3.20 ± 0.94 | [9] | |
| Sr | Contaminated zone Unsaturated zone | 1.18 ± 1.03 | [9] |
| Saturated zone | 0.58 ± 0.94 | [9] | |
| Zr | Contaminated zone Unsaturated zone | 2.78 ± 0.50 | [9] |
| Saturated zone | 2.62 ± 1.22 | [9] |
| Parameter | Unit | Value |
|---|---|---|
| Area of contaminated zone | m2 | 49,518 [14] |
| Density of saturated zone | g·cm−3 | 2.6 [14] |
| Model for water transport parameters | - | non-dispersion [10] |
| Precipitation | m·year−1 | 1.1 [26] |
| Wind speed | m·s−1 | 2.5 [26] |
| Hydraulic conductivity in the saturated zone | m·year−1 | 15.8 [20] |
| Fruit, vegetable, and grain consumption | kg·year−1 | 286.4 [21] |
| Milk consumption | L·year−1 | 83.9 [22] |
| Meat and poultry consumption | kg·year−1 | 54.6 [23] |
| Fish consumption | kg·year−1 | 24.1 [24] |
| Other seafood consumption | kg·year−1 | 43.2 [24] |
| Drinking water intake | L·year−1 | 312.9 [25] |
| Regulatory Dose Limit | DCGL (Bq·g−1) | ||
|---|---|---|---|
| Radionuclides | 0.25 mSv·year−1 | 0.1 mSv·year−1 | |
| 108mAg | 2.56 × 10⁻¹ | 1.02 × 10⁻¹ | |
| 14C | 2.07 × 100 | 8.27 × 10⁻¹ | |
| 60Co | 1.73 × 10⁻¹ | 6.90 × 10⁻² | |
| 134Cs | 2.93 × 10⁻¹ | 1.17 × 10⁻¹ | |
| 137Cs | 6.65 × 10⁻¹ | 2.66 × 10⁻¹ | |
| 55Fe | 1.47 × 10³ | 5.87 × 10² | |
| 3H | 1.88 × 10² | 7.51 × 101 | |
| 93mNb | 5.63× 10³ | 2.25 × 10³ | |
| 94Nb | 2.62 × 10⁻¹ | 1.05 × 10⁻¹ | |
| 63Ni | 5.03 × 10² | 2.01 × 10² | |
| 125Sb | 1.21 × 100 | 4.86 × 10⁻¹ | |
| 121mSn | 6.01 × 10² | 2.41 × 10² | |
| 90Sr | 8.42 × 10⁻¹ | 3.37 × 10⁻¹ | |
| 93Zr | 6.75 × 101 | 2.70 × 101 | |
| Cases | CY a [28] | Yankee Rowe [29] | Zion [30] | Kori-1 [13] | IAEA [31] | Wolsong (p.w.) |
|---|---|---|---|---|---|---|
| Methods | RESRAD v6.2 | RESRAD v6.2 | RESRAD v7.0 | RESRAD v7.2 | IAEA Standard | RESRAD v7.2 |
| 108mAg | 2.60 × 10⁻¹ | 2.70 × 10⁻¹ | - | - | - | 2.56 × 10⁻¹ |
| 14C | 2.10 × 10⁻¹ | 2.04 × 10⁻¹ | - | 8.24 × 100 | 2.50 × 101 | 2.07 × 100 |
| 60Co | 1.40 × 10⁻¹ | 1.48 × 10⁻¹ | 1.74 × 10⁻¹ | 2.10 × 10⁻¹ | 2.50 × 100 | 1.73 × 10⁻¹ |
| 134Cs | 1.70 × 10⁻¹ | 1.85 × 10⁻¹ | 2.78 × 10⁻¹ | 3.60 × 10⁻¹ | 2.50 × 100 | 2.93 × 10⁻¹ |
| 137Cs | 2.90 × 10⁻¹ | 3.18 × 10⁻¹ | 5.81 × 10⁻¹ | 8.20 × 10⁻¹ | 2.50 × 100 | 6.65 × 10⁻¹ |
| 55Fe | 1.01 × 10³ | 1.07 × 10³ | - | - | 2.50 × 10⁴ | 1.47 × 10³ |
| 3H | 1.52 × 101 | 1.37 × 101 | - | - | 2.50 × 10³ | 1.88 × 10² |
| 93mNb | - | - | - | - | 2.50 × 10² | 5.63 × 10³ |
| 94Nb | 2.60 × 10⁻¹ | 2.74 × 10⁻¹ | - | - | 2.50 × 100 | 2.62 × 10⁻¹ |
| 63Ni | 2.68 × 101 | 3.00 × 101 | 1.48 × 10² | 5.47 × 10² | 2.50 × 10³ | 5.03 × 10² |
| 125Sb | - | 1.18 × 100 | - | - | 2.50 × 100 | 1.21 × 100 |
| 121mSn | - | - | - | - | - | 6.01 × 10² |
| 90Sr | 6.00 × 10⁻² | 6.29 × 10⁻² | 5.29 × 10⁻¹ | 1.75 × 100 | 2.50 × 101 | 8.42 × 10⁻¹ |
| 93Zr | - | - | - | - | 2.50 × 10² | 6.75 × 101 |
| Parameters | PRCC | Quartile | Assigned Value |
|---|---|---|---|
| External gamma shielding factor | 0.98 | 75% | 3.98 × 10⁻¹ |
| Density of contaminated zone (g·cm−1) | 0.86 | 75% | 1.72 × 100 |
| Runoff coefficient | 0.63 | 75% | 6.24 × 10⁻¹ |
| Kd of 60Co in contaminated zone (cm3·g−1) | 0.51 | 75% | 1.04 × 101 |
| Evapotranspiration coefficient | 0.46 | 75% | 6.87 × 10⁻¹ |
| Kd of 108mAg in contaminated zone (cm3·g−1) | 0.39 | 75% | 1.23 × 101 |
| Kd of 134Cs in contaminated zone (cm3·g−1) | 0.38 | 75% | 2.41 × 101 |
| Kd of 90Sr in contaminated zone (cm3·g−1) | 0.27 | 75% | 6.52 × 100 |
| Parameters | Multiplication Factor | Year for Site Release (Years) | |
|---|---|---|---|
| External gamma shielding factor | upper | ×2 | 7.14 |
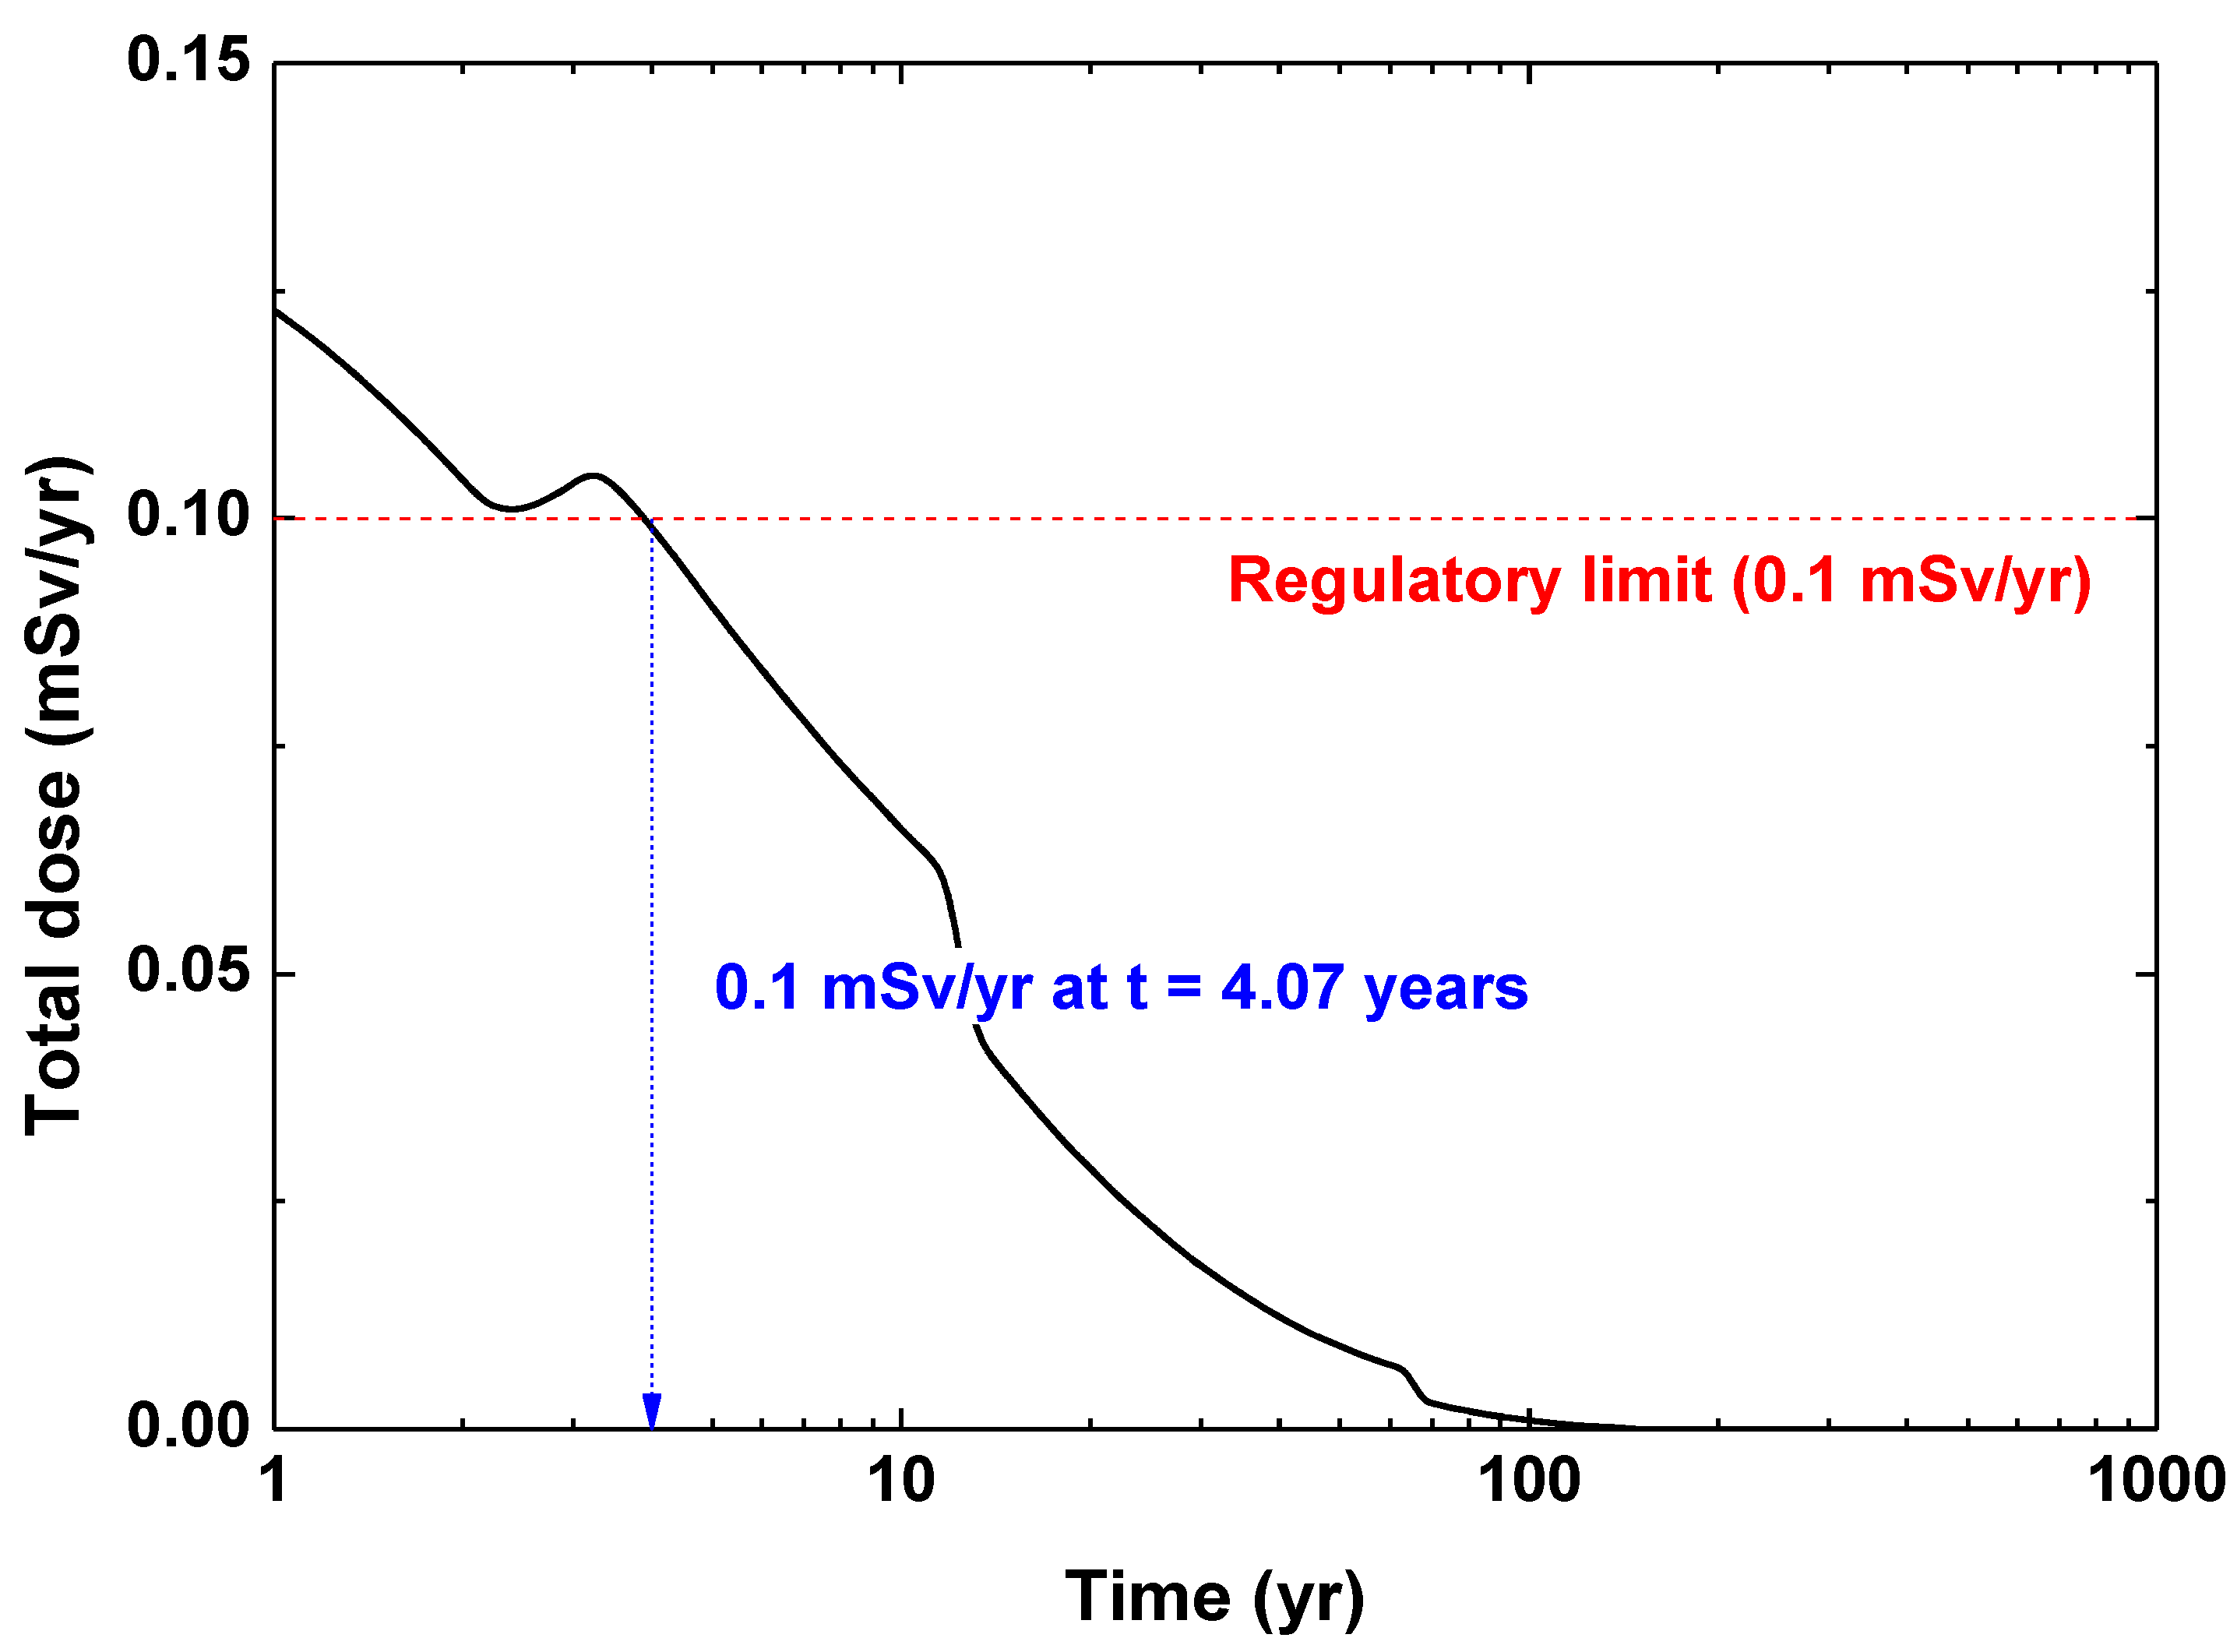
| mid | ×1 | 4.07 | |
| lower | ×0.5 | - a | |
| Density of contaminated zone | upper | ×2 | 11.19 |
| mid | ×1 | 4.07 | |
| lower | ×0.5 | - a | |
| Runoff coefficient | upper | ×1.6 | 3.44 |
| mid | ×1 | 4.07 | |
| lower | ×0.63 | 3.64 | |
| Kd of 60Co in contaminated zone | upper | ×2 | 4.56 |
| mid | ×1 | 4.07 | |
| lower | ×0.5 | 1.96 | |
| Evapotranspiration coefficient | upper | ×1.45 | 7.99 |
| mid | ×1 | 4.07 | |
| lower | ×0.69 | 3.44 | |
| Kd of 108mAg in contaminated zone | upper | ×2 | 4.56 |
| mid | ×1 | 4.07 | |
| lower | ×0.5 | 3.44 | |
| Kd of 134Cs in contaminated zone | upper | ×2 | 4.07 |
| mid | ×1 | 4.07 | |
| lower | ×0.5 | 4.07 | |
| Kd of 90Sr in contaminated zone | upper | ×2 | 4.31 |
| mid | ×1 | 4.07 | |
| lower | ×0.5 | 3.85 | |
Publisher’s Note: MDPI stays neutral with regard to jurisdictional claims in published maps and institutional affiliations. |
© 2022 by the authors. Licensee MDPI, Basel, Switzerland. This article is an open access article distributed under the terms and conditions of the Creative Commons Attribution (CC BY) license (https://creativecommons.org/licenses/by/4.0/).
Share and Cite
Kwon, C.-G.; Ahn, S.; Lee, J.-Y. Preliminary Evaluation of Derived Concentration Guideline Level for Surface Soil at Wolsong NPP Site Using RESRAD-ONSITE Code. Appl. Sci. 2022, 12, 3659. https://doi.org/10.3390/app12073659
Kwon C-G, Ahn S, Lee J-Y. Preliminary Evaluation of Derived Concentration Guideline Level for Surface Soil at Wolsong NPP Site Using RESRAD-ONSITE Code. Applied Sciences. 2022; 12(7):3659. https://doi.org/10.3390/app12073659
Chicago/Turabian StyleKwon, Chung-Gi, Seokyoung Ahn, and Jun-Yeop Lee. 2022. "Preliminary Evaluation of Derived Concentration Guideline Level for Surface Soil at Wolsong NPP Site Using RESRAD-ONSITE Code" Applied Sciences 12, no. 7: 3659. https://doi.org/10.3390/app12073659
APA StyleKwon, C.-G., Ahn, S., & Lee, J.-Y. (2022). Preliminary Evaluation of Derived Concentration Guideline Level for Surface Soil at Wolsong NPP Site Using RESRAD-ONSITE Code. Applied Sciences, 12(7), 3659. https://doi.org/10.3390/app12073659