
Modeling of Swab and Surge Pressures: A Survey


Abstract
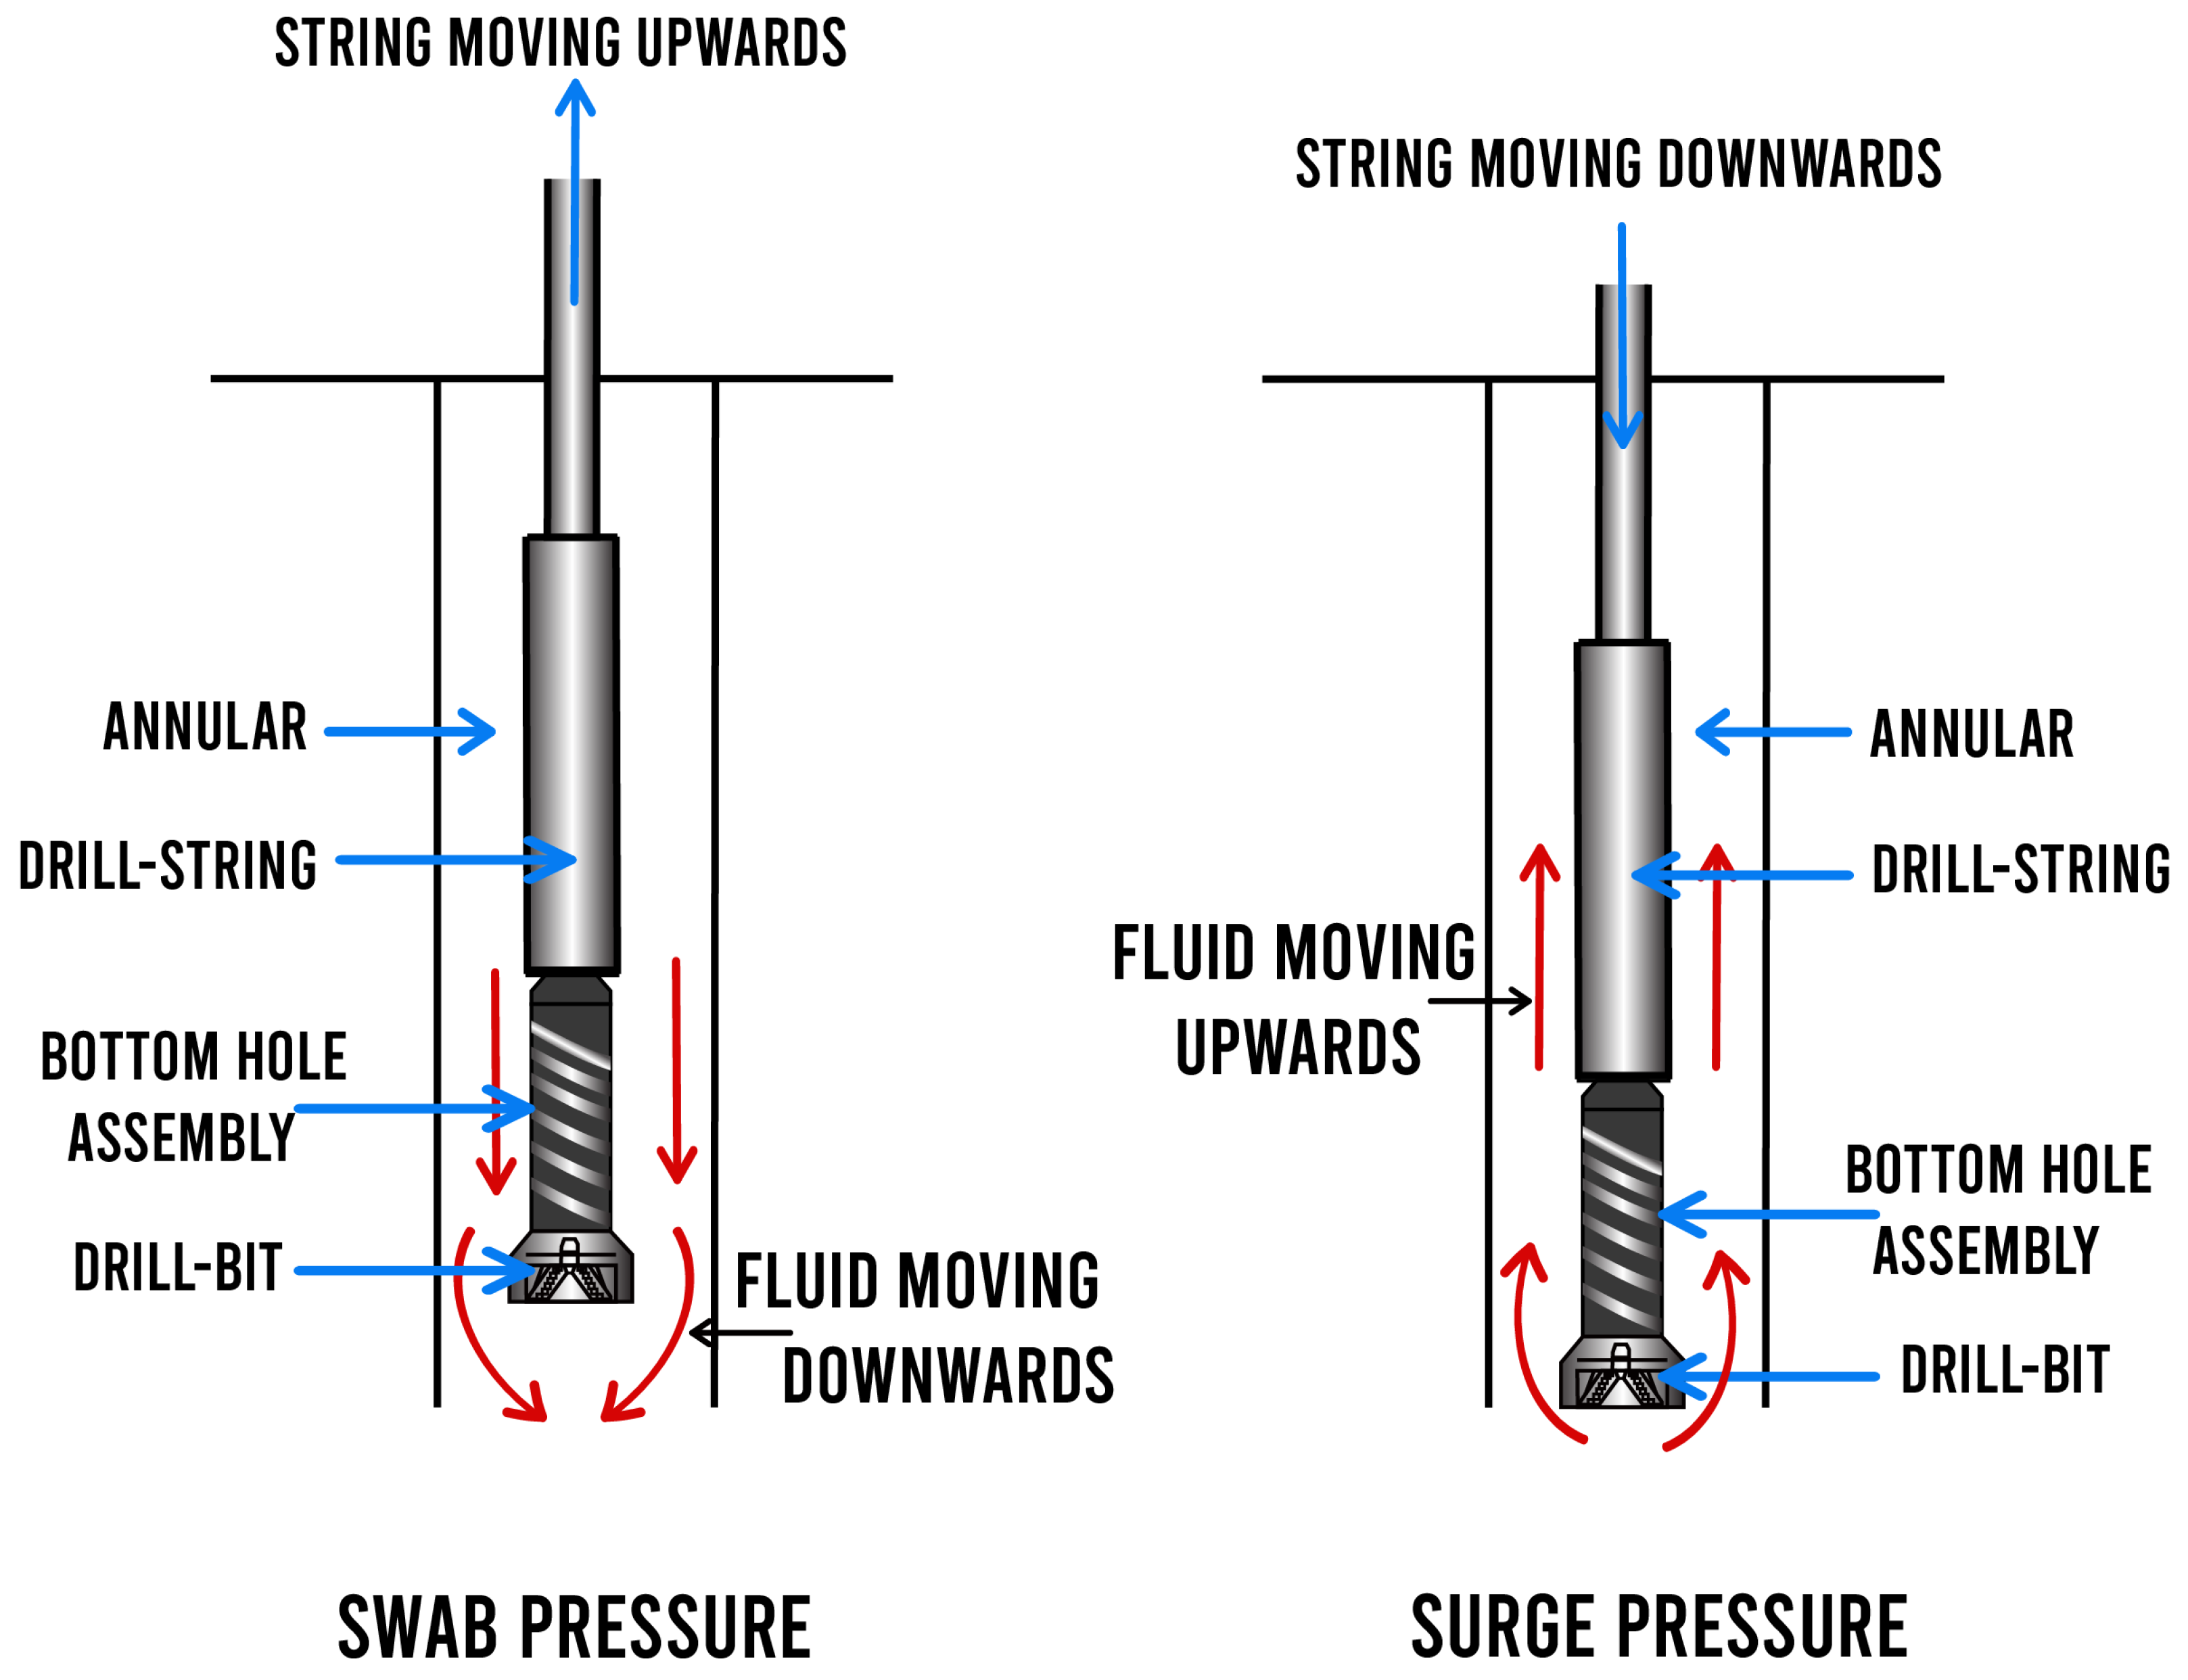
:1. Introduction
2. Literature Review of Five Prominent Works on Swab and Surge Models
2.1. Surge and Swab Modeling for Dynamic Pressures and Safe Trip Velocities
2.1.1. Lal’s Model
2.1.2. Analysis of the Work by Lal
- It predicts the maximum surge or swab pressure or their variation with time at the bottomhole and casing-shoe when running a casing joint, liner, or a drill pipe stand;
- It warns about the danger of lost circulation for the surge (or kick for the swab) when the computed maximum pressure (or minimum pressure for swab) exceeds (or falls below) the specified pressure margin or the maximum (or minimum for swab) equivalent mud weight. For each case, it computes the maximum safe trip speed in order to avoid the lost circulation or the kick problem. These answers can be obtained while running in or pulling out the pipe at various distances from the bottom of the hole.
- The computations of swab and surge pressures based on steady-state flow are generally incorrect given the unsteady nature of the flow;
- As far as the effect of various parameters on the swab and surge pressures is concerned, these parameters can be listed, in order of their importance, as follows.
2.2. Bottomhole Pressure Surges While Running Pipe
2.2.1. Clark’s Model
2.2.2. Analysis of the Work by Clark
- Increase running or pulling times sufficiently to keep pressures safely above zonal hydrostatic pressure, but below the formation strength at all times;
- Decrease the rate of acceleration or deceleration of the pipe through smoother brake handling and earlier use of a hydromatic brake;
- Use bottom fill devices to relieve annulus volumes by internal filling;
- Increase clearances wherever possible;
- Care should be used with projections above pipe size such as oversized drill collars and drill pipe protectors, or improperly designed centering and scratching equipment run on the casing;
- The practice of spudding back through previously drilled formations, using high rates of pumping as well as high rates of pipe acceleration and deceleration, should definitely be controlled.
2.3. Automatic Prediction of Downhole Pressure Surges in Tripping Operations
Analysis of the Work by Gjerstad et al.
2.4. Wellbore Pressure Surges by Pipe Movement
- A valid theory useful in all field situations was developed. This theory must be based upon realistic assumptions, must be formulated rigorously, and should lead to clear concepts whereby the nature of pressure surges can be easily understood;
- The theory, however complex and involved, must ultimately be presented in a simplified form for convenient field use. This may involve extensive machine computations and the use of figures and empirical equations;
- The accuracy of the simplified equations must be established by comparing measured pressure surges with those predicted by the theory. These must agree both in their characteristic nature and in magnitude. This means that careful measurements of surges occurring in actual field operations must be made.
Analysis of the Work by Burkhardt
- A quantitative, theoretical description of surge pressures generated by pipe movement in a mud-filled wellbore has been developed and verified by experimentation;
- The theory correctly predicts the existence and magnitude of various positive and negative peaks due to gel breaking, inertia, and viscous drag of the mud;
- When running a drill pipe, or a casing without fill-up devices, the surge due to viscous drag is usually the largest and, therefore, the most important;
- Simple, approximate equations were developed to predict the viscous-drag surge, and the predictions were found to be within experimental accuracy.
2.5. Experimental Study of Swab and Surge Pressures in Horizontal and Inclined Wells
- The fluid is incompressible (constant density);
- Steady state and isothermal Couette flow conditions;
- Laminar flow;
- Drill pipe moving at a constant speed, Vp;
- Negligible wall slippage effects.
Analysis of the Work by Srivastav et al.
- The present model predicts swab and surge pressures of a yield power-law fluid in the eccentric annulus (i.e., eccentricity ranging from 0 to 90%) with reasonable accuracy (maximum discrepancy of 14%);
- Eccentricity has considerable effects on swab and surge pressures. Both experimental and theoretical results show surge pressure reduction of up to 40% as a result of eccentricity;
- Results show that for highly shear-thinning fluids, a small decrease in surge pressure can considerably increase the safe tripping speed limit;
- Surge pressure predictions for the concentric and eccentric model can be considered for the boundary limits for the expected surge pressures. In real field conditions, due to lateral pipe movement, the pipe does not maintain the concentric or fully eccentric geometry throughout, resulting in surge pressure variations between these limits;
- In general, fluid rheological parameters, tripping speeds, and diameter ratios considerably affect the generated pressure surges.
2.6. Recent Works
2.7. Summary of the Literature Study
3. Data-Driven Modeling in Drilling in Well Operations
3.1. Applications of Data-Driven Techniques in Oil and Gas
3.2. Subsurface Characterization and Petrophysics
3.3. Drilling
4. Proposal for New Research on Surge and Swab Pressure Modeling
4.1. The Role of Sensors and Data Acquisition (Logging Data)
- Depth tracking sensor;
- Flow in and out tracking sensors;
- Measurement while drilling (MWD) and Logging-While-Drilling (LWD) tool;
- Electromagnetic-Wave Resistivity (EWR) tool;
- Electronic Drilling Recorder (EDR) system.
4.2. The Steps Involved in New Research
- Preparing the data;
- Validating the existing models with the data and improving the model;
- Testing the new model.
5. Conclusions
Author Contributions
Funding
Institutional Review Board Statement
Informed Consent Statement
Data Availability Statement
Conflicts of Interest
References
- Burkhardt, J. Wellbore pressure surges produced by pipe movement. J. Pet. Technol. 1961, 13, 595–605. [Google Scholar] [CrossRef]
- Schuh, F. Computer makes surge-pressure calculations useful. Oil Gas J. 1964, 31, 96. [Google Scholar]
- Mitchell, R. Dynamic surge/swab pressure predictions. SPE Drill. Eng. 1988, 3, 325–333. [Google Scholar] [CrossRef]
- Lal, M. Surge and Swab modeling for dynamic Pressures and safe trip velocities. In Proceedings of the IADC/SPE Drilling Conference, New Orleans, LA, USA, 20–23 February 1983. [Google Scholar]
- Clark, E. Bottom-Hole Pressure Surges While Running Pipe. Pet. Eng. Int. 1955, 27, B68. [Google Scholar]
- Ormsby, G.S. Calculation and Control of Mud Presures in Drilling and Completion Operations. In Drilling and Production Practice; OnePetro: New York, NY, USA, 1954. [Google Scholar]
- Beck, R.; Nuss, W.; Dunn, T. The Flow Properties of Drilling Muds. In Drilling and Production Practice; OnePetro: New York, NY, USA, 1947. [Google Scholar]
- Gjerstad, K.; Sui, D.; Bjørkevoll, K.S.; Time, R.W. Automatic prediction of downhole pressure surges in tripping operations. In Proceedings of the International Petroleum Technology Conference, European Association of Geoscientists & Engineers (IPTC 2013), Beijing, China, 26–28 March 2013. [Google Scholar]
- Melrose, J.; Savins, J.; Foster, W.; Parish, E. A practical utilization of the theory of Bingham plastic flow in stationary pipes and annuli. Trans. AIME 1958, 213, 316–324. [Google Scholar] [CrossRef]
- Srivastav, R.; Enfis, M.; Crespo, F.; Ahmed, R.; Saasen, A.; Laget, M. Surge and swab pressures in horizontal and inclined wells. In Proceedings of the SPE Latin America and Caribbean Petroleum Engineering Conference, Mexico City, Mexico, 16–18 April 2012. [Google Scholar]
- Haciislamoglu, M.; Langlinais, J. Effect of pipe eccentricity on surge pressures. J. Energy Resour. Technol. 1991, 113, 157–160. [Google Scholar] [CrossRef]
- Iyoho, A.W.; Azar, J.J. An accurate slot-flow model for non-Newtonian fluid flow through eccentric annuli. Soc. Pet. Eng. J. 1981, 21, 565–572. [Google Scholar] [CrossRef]
- Crespo, F.; Aven, N.K.; Cortez, J.; Soliman, M.; Bokane, A.; Jain, S.; Deshpande, Y. Proppant distribution in multistage hydraulic fractured wells: A large-scale inside-casing investigation. In Proceedings of the SPE Hydraulic Fracturing Technology Conference, The Woodlands, TX, USA, 4–6 February 2013. [Google Scholar]
- Luo, Y.; Peden, J. Flow of non-Newtonian fluids through eccentric annuli. SPE Prod. Eng. 1990, 5, 91–96. [Google Scholar] [CrossRef]
- Duan, M.; Miska, S.Z.; Yu, M.; Takach, N.E.; Ahmed, R.M.; Zettner, C.M. Critical conditions for effective sand-sized solids transport in horizontal and high-angle wells. SPE Drill. Complet. 2009, 24, 229–238. [Google Scholar] [CrossRef]
- Crespo, F.; Ahmed, R.; Enfis, M.; Saasen, A.; Amani, M. Surge-and-swab pressure predictions for yield-power-law drilling fluids. SPE Drill. Complet. 2012, 27, 574–585. [Google Scholar] [CrossRef]
- Krishna, S.; Ridha, S.; Campbell, S.; Ilyas, S.U.; Dzulkarnain, I.; Abdurrahman, M. Experimental evaluation of surge/swab pressure in varying annular eccentricities using non-Newtonian fluid under Couette-Poiseuille flow for drilling applications. J. Pet. Sci. Eng. 2021, 206, 108982. [Google Scholar] [CrossRef]
- Gjerstad, K.; Time, R.W. Simplified Explicit Flow Equations for Herschel-Bulkley Fluids in Couette-Poiseuille Flow—For Real-Time Surge and Swab Modeling in Drilling. SPE J. 2015, 20, 610–627. [Google Scholar] [CrossRef]
- Balaji, K.; Rabiei, M.; Suicmez, V.; Canbaz, C.H.; Agharzeyva, Z.; Tek, S.; Bulut, U.; Temizel, C. Status of data-driven methods and their applications in oil and gas industry. In Proceedings of the SPE Europec featured at 80th EAGE Conference and Exhibition, Copenhagen, Denmark, 11–14 June 2018. [Google Scholar]
- Taner, M.T.; Koehler, F.; Sheriff, R. Complex seismic trace analysis. Geophysics 1979, 44, 1041–1063. [Google Scholar] [CrossRef]
- Holdaway, K.R. Harness Oil and Gas Big Data with Analytics: Optimize Exploration and Production with Data-Driven Models; John Wiley & Sons: Hoboken, NJ, USA, 2014. [Google Scholar]
- Ouenes, A. Practical application of fuzzy logic and neural networks to fractured reservoir characterization. Comput. Geosci. 2000, 26, 953–962. [Google Scholar] [CrossRef]
- Zhang, L.; Wu, S.; Zheng, W.; Fan, J. A dynamic and quantitative risk assessment method with uncertainties for offshore managed pressure drilling phases. Saf. Sci. 2018, 104, 39–54. [Google Scholar] [CrossRef]
- Al-Anazi, A.F.; Gates, I.D. Support vector regression to predict porosity and permeability: Effect of sample size. Comput. Geosci. 2012, 39, 64–76. [Google Scholar] [CrossRef]
- Behnoudfar, P.; Hosseini, P.; Azizi, A. Permeability determination of cores based on their apparent attributes in the Persian Gulf region using Navie Bayesian and Random forest algorithms. J. Nat. Gas Sci. Eng. 2017, 37, 52–68. [Google Scholar] [CrossRef]
- Ozkaya, S.I. Using probabilistic decision trees to detect fracture corridors from dynamic data in mature oil fields. SPE Reserv. Eval. Eng. 2008, 11, 1061–1070. [Google Scholar] [CrossRef]
- Chamkalani, A.; Zendehboudi, S.; Chamkalani, R.; Lohi, A.; Elkamel, A.; Chatzis, I. Utilization of support vector machine to calculate gas compressibility factor. Fluid Phase Equilibria 2013, 358, 189–202. [Google Scholar] [CrossRef]
- El-Sebakhy, E.A. Forecasting PVT properties of crude oil systems based on support vector machines modeling scheme. J. Pet. Sci. Eng. 2009, 64, 25–34. [Google Scholar] [CrossRef]
- Tohidi-Hosseini, S.M.; Hajirezaie, S.; Hashemi-Doulatabadi, M.; Hemmati-Sarapardeh, A.; Mohammadi, A.H. Toward prediction of petroleum reservoir fluids properties: A rigorous model for estimation of solution gas-oil ratio. J. Nat. Gas Sci. Eng. 2016, 29, 506–516. [Google Scholar] [CrossRef]
- Ahmadi, M.A.; Mahmoudi, B. Development of robust model to estimate gas-oil interfacial tension using least square support vector machine: Experimental and modeling study. J. Supercrit. Fluids 2016, 107, 122–128. [Google Scholar] [CrossRef]
- Cranganu, C.; Breaban, M. Using support vector regression to estimate sonic log distributions: A case study from the Anadarko Basin, Oklahoma. J. Pet. Sci. Eng. 2013, 103, 1–13. [Google Scholar] [CrossRef]
- Akande, K.O.; Owolabi, T.O.; Olatunji, S.O.; AbdulRaheem, A. A hybrid particle swarm optimization and support vector regression model for modelling permeability prediction of hydrocarbon reservoir. J. Pet. Sci. Eng. 2017, 150, 43–53. [Google Scholar] [CrossRef]
- Tan, M.; Song, X.; Yang, X.; Wu, Q. Support-vector-regression machine technology for total organic carbon content prediction from wireline logs in organic shale: A comparative study. J. Nat. Gas Sci. Eng. 2015, 26, 792–802. [Google Scholar] [CrossRef]
- Masoudi, P.; Tokhmechi, B.; Jafari, M.A.; Zamanzadeh, S.M.; Sherkati, S. Application of Bayesian in determining productive zones by well log data in oil wells. J. Pet. Sci. Eng. 2012, 94, 47–54. [Google Scholar] [CrossRef] [Green Version]
- Anifowose, F.; Labadin, J.; Abdulraheem, A. Improving the prediction of petroleum reservoir characterization with a stacked generalization ensemble model of support vector machines. Appl. Soft Comput. 2015, 26, 483–496. [Google Scholar] [CrossRef]
- Fatehi, M.; Asadi, H.H. Data integration modeling applied to drill hole planning through semi-supervised learning: A case study from the Dalli Cu-Au porphyry deposit in the central Iran. J. Afr. Earth Sci. 2017, 128, 147–160. [Google Scholar] [CrossRef]
- Al-Yami, A.S.; Al-Shaarawi, A.; Al-Bahrani, H.; Wagle, V.B.; Al-Gharbi, S.; Al-Khudiri, M.B. Using Bayesian network to develop drilling expert systems. In Proceedings of the SPE Heavy Oil Conference and Exhibition, Kuwait City, Kuwait, 6–8 December 2016. [Google Scholar]
- Bhandari, J.; Abbassi, R.; Garaniya, V.; Khan, F. Risk analysis of deepwater drilling operations using Bayesian network. J. Loss Prev. Process Ind. 2015, 38, 11–23. [Google Scholar] [CrossRef]
- Sule, I.; Khan, F.; Butt, S.; Yang, M. Kick control reliability analysis of managed pressure drilling operation. J. Loss Prev. Process Ind. 2018, 52, 7–20. [Google Scholar] [CrossRef]
- Chang, Y.; Chen, G.; Wu, X.; Ye, J.; Chen, B.; Xu, L. Failure probability analysis for emergency disconnect of deepwater drilling riser using Bayesian network. J. Loss Prev. Process Ind. 2018, 51, 42–53. [Google Scholar] [CrossRef]
- Cai, B.; Liu, Y.; Liu, Z.; Tian, X.; Dong, X.; Yu, S. Using Bayesian networks in reliability evaluation for subsea blowout preventer control system. Reliab. Eng. Syst. Saf. 2012, 108, 32–41. [Google Scholar] [CrossRef]
- Kormaksson, M.; Vieira, M.R.; Zadrozny, B. A data driven method for sweet spot identification in shale plays using well log data. In Proceedings of the SPE Digital Energy Conference and Exhibition, The Woodlands, TX, USA, 3–5 March 2015. [Google Scholar]
- Bakshi, A.; Uniacke, E.; Korjani, M.; Ershaghi, I. A novel adaptive non-linear regression method to predict shale oil well performance based on well completions and fracturing data. In Proceedings of the SPE Western Regional Meeting, Bakersfield, CA, USA, 23–27 April 2017. [Google Scholar]
- Temizel, C.; Aktas, S.; Kirmaci, H.; Susuz, O.; Zhu, Y.; Balaji, K.; Ranjith, R.; Tahir, S.; Aminzadeh, F.; Yegin, C. Turning Data into Knowledge: Data-Driven Surveillance and Optimization in Mature Fields. In Proceedings of the SPE Annual Technical Conference and Exhibition, Dubai, United Arab Emirates, 26–28 September 2016. [Google Scholar]
- Jeffery, C.; Pink, S.; Taylor, J.; Hewlett, R. Data While Tripping DWT: Keeping the Light on Downhole. In Proceedings of the SPE Asia Pacific Oil & Gas Conference and Exhibition, Online, 17–19 November 2020. [Google Scholar]
- Vandvik, E.; Gomez, C.; Nygård, B.; Andreassen, E.; Ulfsnes, G.Å. Annular Pressure Management-Benefits From Using Along-String Measurements in Real time While Tripping. In Proceedings of the SPE/IADC International Drilling Conference and Exhibition, Online, 8–12 March 2021. [Google Scholar]
- Dewitte, K.; Fierens, C.; Stockl, D.; Thienpont, L.M. Application of the Bland–Altman plot for interpretation of method-comparison studies: A critical investigation of its practice. Clin. Chem. 2002, 48, 799–801. [Google Scholar] [CrossRef]

| Notation | Variable | Equations |
|---|---|---|
| P | Pressure drop in psi over the length being computed. | (7), (8), (14), (18), (20), (21) |
| l | Total length in feet of the diameter being considered. | (7), (8), (14), (18), (21) |
| Mud yield point in lbs./100 sq.ft. | (7), (10) | |
| n | Plastic viscosity of the mud in Centipoise. | (7), (18), (19) |
| V | Mean fluid mud velocity in ft.per sec. | (7), (9), (11)–(13) |
| D | Pipe ID in inches for internal flow, or, bit size minus pipe OD in inches for annular flow. | (7)–(10), (18)–(20) |
| f | Pigott friction factor. | (8), (20) |
| Mud weight in lbs./cu.ft. | (8), (9), (10), (14), (19)–(21) | |
| V | Mean fluid mud velocity in ft.per sec. | (8) |
| R | appropriate Reynolds number in turbulent flow. | (8), (19) |
| Lower critical fluid velocity in ft.per.sec. | (10) | |
| Observed mean annulus displacement rate in cu.ft/sec. | (11)–(13), (15), (16) | |
| Observed mean internal displacement rate in cu.ft/sec. | (11)–(13) | |
| Annulus area in sq.ft alongside the considered diameter. | (11)–(13), (18)–(21) | |
| Area of internal section being considered in sq.ft. | (11)–(14) | |
| Pipe speed in ft./sec. | (11)–(13), (15), (16), (18), (19) | |
| A | Square feet area of the section being considered. | (14) |
| Rate of change of flow rate in cu-ft/sec./sec. | (14) | |
| Total volume displaced in cu. up in the annulus for the joint under consideration. | (15)–(21) | |
| Joint total length in ft. under consideration. | (15)–(21) | |
| Average rate of displacement in cu.ft/sec. at any given point in the annulus. | (16) | |
| Local annulus displacement rate in cu.ft/sec. | (16) | |
| Sq.ft. area that projects outside the basic pipe size on the under consideration. | (16), (17)–(21) | |
| Acceleration of annulus flow rate at any point in the annulus in cu.ft/sec./sec. | (17) | |
| Acceleration of pipe in ft/sec./sec. | (17), (21) | |
| Yield point of the mud in Ibs. sq. ft. | (18) | |
| Constant from clinging effect in laminar flow (0.39 For drill pipe AND 0.46 for casing). | (18) | |
| Constant from clinging effect in turbulent flow (0.166 for drill pipe and 0.181 for casing). | (19), (20) |
| Notation | Variable | Equations |
|---|---|---|
| Flow through the bit nozzle. | (22)–(24) | |
| String inside volume. | (22)–(24) | |
| String internal cross-section. | (22)–(24) | |
| Mud density. | (26) | |
| Total cross-section of all nozzles. | (26) | |
| Discharge coefficient to account for unmodeled effects. | (26) | |
| , | The boundary surface areas. | (31), (34) |
| , | Wall share stress that were calculated from respective radius, or . | (31), (34) |
| Length of secondary part. | (32) | |
| Annular gap of secondary part. | (32) | |
| Mass of main part. | (33), (36) | |
| Mass of secondary part. | (33), (36) |
| Notation | Variable | Equations |
|---|---|---|
| P | Pressure, psi. | (38), (39) |
| L | Length of pipe section, ft. | (38), (39) |
| Mud gel strength, lb/100 . | (38), (39) | |
| Internal diameter, in. | (38), (39) | |
| Pipe outside diameter, in. | (38), (39), (42)–(46), (48) | |
| Hole inside diameter, in. | (38), (39), (42)–(46), (48) | |
| Pipe acceleration. | (40), (41) | |
| Mud density. | (40), (41), (45), (46) | |
| L | Length of pipe section, ft. | (40), (41) |
| g | Acceleration of gravity. | (40), (41) |
| Annulus competent of velocity due to displacement, ft/min. | (42) | |
| Velocity of pipe, ft/min, in. | (42), (43), (48) | |
| Effective annular mud velocity, ft/min. | (43), (45), (48) | |
| K | Proportionality constant. | (43), (48) |
| Mud yield point, lb/100 . | (44) | |
| Plastic viscosity, cp. | (44) | |
| Reynolds number. | (45) | |
| Pressure gradient, psi/ft. | (46) | |
| f | Friction factor. | (46) |
| Mud flow in annulus measured with respect to the fixed borehole wall, /min. | (48) | |
| Effective pipe bore mud velocity, ft/min. | (49) | |
| Mud flow in pipe bore measured with respect to pipe walls, /min. | (49) | |
| Inside diameter of pipe, in. | (49) |
| Notation | Variable | Equations |
|---|---|---|
| Pipe diameter. | (53), (54) | |
| Hole/casing diameter. | (53), (54) | |
| n | Fluid behavior index. | (53), (54), (56) |
| R | Reduction factor. | (53), (54) |
| Element slot thickness. | (55)–(58) | |
| Inner radius of outer pipe. | (55) | |
| Outer radius of inner pipe. | (55) | |
| E | Fractional eccentricity. | (55) |
| C | Radius clearance . | (55) |
| Pipe velocity. | (56) | |
| k | Consistency Index. | (56) |
| Dimensionless plug thickness. | (57)–(59), (62) | |
| Lower limit of region II. | (57) | |
| Upper limit of region II. | (57) | |
| Dimensionless lower boundary limit of region II. | (57), (59), (62) | |
| Dimensionless upper boundary limit of region II. | (57) | |
| Yield stress. | (58) | |
| Slot length/hole depth. | (58) | |
| Pressure drop. | (58) | |
| Dimensionless pressure. | (59), (62) | |
| b | Constant. | (59), (62) |
| dimensionless total flow rate. | (60)–(62) | |
| q | Actual flow rate. | (61), (63) |
| W | Slot width. | (61), (64) |
| Pipe velocity. | (61), (63) | |
| H | Slot thickness. | (61), (64) |
| Pipe diameter. | (63), (64) | |
| Wellbore diameter. | (64) | |
| K | Diameter ratio | (67) |
| Fractional eccentricity. | (67) |
| Model Name | Impact | Assumptions | Strengths | Weaknesses | Focus | Fluid Model |
|---|---|---|---|---|---|---|
| Srivastav et al. [10] | Horizontal and extended reach well. | Constant tripping speed. Flow approximation in eccentric annulus. |
|
|
| Herschel Buckley. |
| Clark [5] | Simple formulation. | Incompressible fluid and bore hole wall. |
|
| Pressure surges caused by moving pipe in wellbore. | Bingham Plastic. |
| Gjerstad et al. [8] | Automatic prediction of swab and surge pressures during tripping operations. | Non-Newtonian fluid. |
| To tune the model, circulation of the well prior to tripping. | Developing an automatic prediction of down hole pressure for real-time application. | Herschel Bulkley. |
| Burkhardt et al. [1] | Theoretical prediction of surge and swab pressures. | Closed and open-end pipe string. |
|
| Approximations of theory of viscus drag by a simplified graph for field application | Bingham Plastic. |
| Lal [4] | Interactive and user-friendly swab and surge pressures predictions. | Friction as a “lumped parameter”. | Non-Newtonian fluid Dynamic model. | Friction as a “lumped parameter”. | Dynamic modeling. | Power Law. |
Publisher’s Note: MDPI stays neutral with regard to jurisdictional claims in published maps and institutional affiliations. |
© 2022 by the authors. Licensee MDPI, Basel, Switzerland. This article is an open access article distributed under the terms and conditions of the Creative Commons Attribution (CC BY) license (https://creativecommons.org/licenses/by/4.0/).
Share and Cite
Mohammad, A.; Davidrajuh, R. Modeling of Swab and Surge Pressures: A Survey. Appl. Sci. 2022, 12, 3526. https://doi.org/10.3390/app12073526
Mohammad A, Davidrajuh R. Modeling of Swab and Surge Pressures: A Survey. Applied Sciences. 2022; 12(7):3526. https://doi.org/10.3390/app12073526
Chicago/Turabian StyleMohammad, Amir, and Reggie Davidrajuh. 2022. "Modeling of Swab and Surge Pressures: A Survey" Applied Sciences 12, no. 7: 3526. https://doi.org/10.3390/app12073526
APA StyleMohammad, A., & Davidrajuh, R. (2022). Modeling of Swab and Surge Pressures: A Survey. Applied Sciences, 12(7), 3526. https://doi.org/10.3390/app12073526