Article

An Oversampling Method for Class Imbalance Problems on Large Datasets

by
Fredy Rodríguez-Torres
*,
José F. Martínez-Trinidad
and
Jesús A. Carrasco-Ochoa
Instituto Nacional de Astrofísica, Óptica y Electrónica, Tonantzintla, Puebla, Mexico City C.P. 72840, Mexico
*
Author to whom correspondence should be addressed.
Appl. Sci. 2022, 12(7), 3424; https://doi.org/10.3390/app12073424
Submission received: 14 February 2022 / Revised: 4 March 2022 / Accepted: 21 March 2022 / Published: 28 March 2022
(This article belongs to the Topic Applied Computer Vision and Pattern Recognition)

Abstract

:
Several oversampling methods have been proposed for solving the class imbalance problem. However, most of them require searching the k-nearest neighbors to generate synthetic objects. This requirement makes them time-consuming and therefore unsuitable for large datasets. In this paper, an oversampling method for large class imbalance problems that do not require the k-nearest neighbors’ search is proposed. According to our experiments on large datasets with different sizes of imbalance, the proposed method is at least twice as fast as 8 the fastest method reported in the literature while obtaining similar oversampling quality.

1. Introduction

One of the current research topics of interest in supervised classification is the class imbalance problem that frequently appears in several real-world datasets [1,2,3,4,5]. The class imbalance problem occurs when, in a dataset, one of the classes has fewer objects, usually called the minority class, than the other class, usually called the majority class. This problem produces a poor classification rate for the minority class, which is usually the most important. Consequently, it becomes difficult for a classifier to effectively discriminate between the minority and majority classes, especially if the class imbalance is extreme. For example, among several patients with a suspicious disease, very few are likely to have cancer, i.e., minority class, while most are likely not to have cancer, i.e., majority class. Here, a false negative means a patient with cancer is misclassified as not having the disease, which is a severe error. Another example of the class imbalance problem is distinguishing between 100 spam emails from 100,000, given that most emails are non-spam. Like these examples, the class imbalance problem is widespread and appears in many areas such as industrial, medical, and social, among others.
In the literature, we can find different types of solutions like class decomposition [6,7] or oversampling methods that are the most frequently used solutions reported in the literature for solving the class imbalance problem. SMOTE (Synthetic Minority Oversampling Technique) [8] is the most widely used and referenced method among the oversampling methods. SMOTE addresses the class imbalance problem by increasing the number of objects of the minority class by generating synthetic objects for this class.
Due to its success, many other oversampling methods based on SMOTE have been proposed in the literature [9,10,11,12,13,14,15,16,17,18,19,20,21,22,23,24,25,26,27,28,29,30]; these methods are characterized by modifications of some of the SMOTE steps and/or addition of new steps. Other oversampling methods that do not follow the SMOTE’s approach have also been proposed [22,23,26,31,32,33]. However, most of the oversampling methods reported in the literature require computing the k-nearest neighbors of objects from the minority class or other slow steps, making them unsuitable for balancing large datasets. This paper will use the term large datasets to refer to those bigger than the conventional datasets used in the literature of oversampling, which have less than 10K objects.
Among those oversampling methods not based on the k-nearest neighbors’ search, we can highlight LMCMO [34], ROS (Random OverSampling), and NDO [35]. However, LMCMO needs to find the minimum distance between the minority class and the majority class objects, becoming very slow for large datasets. On the other hand, although ROS is fast, it produces low oversampling quality because ROS only generates exact copies of the objects of the minority class [36,37,38,39]. Meanwhile, NDO is an oversampling method that is not based on the search for the k-nearest neighbors, but in a fast generation of synthetic objects; showing good oversampling results. Therefore, NDO can be applied to large datasets with imbalanced classes. The above shows that the development of fast oversampling methods not based on the k-nearest neighbors’ search or other slow steps has been little studied in the literature. For his reason, this paper introduces a method that follows this approach, making it applicable to large datasets with imbalanced classes. Our experiments with large datasets show that the proposed method is at least twice as fast as the fastest method reported in the literature while obtaining similar oversampling quality.
The rest of the paper is organized as follows: In Section 2, we present the related work. In Section 3, our oversampling method for class imbalance problems on large datasets is introduced. Section 4 shows our experimental results and compares our proposed method against the most successful oversampling state-of-the-art methods. We also include experiments on real large datasets, as well as scalability experiments that confirm the good performance of the proposed method in terms of time and quality of oversampling. Finally, in Section 5, we present our conclusions and future work.

2. Related Work

The most successful and referenced oversampling method for class imbalance problems is SMOTE [8]. The main idea of SMOTE is to oversample the minority class by randomly generating synthetic objects between objects from the minority class and some of their k-nearest neighbors selected in random manner.
In SMOTE, to generate a synthetic object, the feature difference between an object of the minority class and one of its k-nearest neighbors, selected in random manner, is computed. Then, for each feature, this difference is multiplied by a random number between 0 and 1. Finally, the multiplied differences is added to the object of the minority class in order to obtain a synthetic object that is then added to the training set. In Algorithm 1, a pseudocode of SMOTE is shown.
Algorithm 1 SMOTE
Input: A minority class, N - Percent of oversampling (integer multiple of 100), k - number of nearest neighbors.
Output: An oversampled minority class.
   n N / 100 Number of objects to be generated for each object of the minority class
  for each object O in the minority class do
      Compute the k-nearest neighbors of O in the minority class
      for  j = 1 , . . . , n  do
           O n n Randomly select one of the k-nearest neighbors of O
           S y n Initialize an empty object
          for each feature f do
               Compute the feature difference between O f and O n n f
                r R a n d o m ( 0 , 1 )
                d i f f feature difference r
                S y n f O f + d i f f
          end for
          Add S y n to the minority class
      end for
  end for
Due to the high success of SMOTE, several oversampling methods based on SMOTE (SMOTE-based methods) have been proposed in the literature [9,10,11,12,13,14,15,16,17,18,19,20,21,22,23,24,25,26,27,28,29,40,41,42,43,44]. These methods modify SMOTE in different ways in order to improve the oversampling quality. In the next paragraphs, we will describe only some of the most widely cited and recent SMOTE-based methods.
Borderline-SMOTE [9] first labels each object of the minority class as a border. An object is labeled as a border if the number of its k-nearest neighbors computed from the whole training set that belong to the majority class is greater than or equal to k / 2 and smaller than k. Then, Borderline-SMOTE generates synthetic objects between the border objects and their k-nearest neighbors in the minority class.
Safe Level SMOTE [11] computes, for each object of the minority class, a safe level ( s l ) value. This value depends on the number of nearest neighbors that the object has into the minority class among its k-nearest neighbors computed in the whole training set. Safe Level SMOTE generates synthetic objects between objects of the minority class with s l > 0 and their k-nearest neighbors in the minority class. If the safe level of the selected neighbor is 0, the object of the minority class is duplicated. Otherwise, Safe Level SMOTE computes a safe level ratio ( s l r ) by dividing the s l value of the object in the minority class by the s l value of the selected neighbor. Then, to generate a synthetic object, as SMOTE does, the random number used for multiplying the feature difference between the object of the minority class and its selected neighbor is generated in a different interval, according to the s l r value, as follows: if s l r = 1 the random number is generated between 0 and 1; if s l r > 1 the random number is generated between 0 and 1 / s l r ; and if s l r < 1 the random number is generated between ( 1 s l r ) and 1.
LNE [12] is based on Safe Level SMOTE (SLS) [11], but in the generation of the sinthetic objects rather than computing the k-nearest neighbors in the minority class, LNE computes the k-nearest neighbors in the whole training set. Then, when a neighbor of the majority class is selected to generate a synthetic object, the random number (r) is computed as in SLS and adjusted as r = r ( s l n / k ) where s l n is the safe level of the selected neighbor.
NDO [35] generates synthetic objects around each object of the minority class by adding a fraction of the standard deviation of the values of each feature. This portion of the standard deviation is computed by dividing the standard deviation by the square root of the number of objects in the minority class, and multiplying the result by a random number. The random number is generated by a normal distribution with the mean of 0 and standard deviation of 1.
SMOTE-RSB* (S-RSB*) [13] first applies SMOTE, and then only keeps as synthetic objects the objects that belong to the lower approximation of the minority class, according to the Rough Set Theory.
K-means-SMOTE (K-means-S) [24] applies K-means for clustering the training set and then selects the clusters with an Imbalance Ratio (IR) lower than a given threshold. Finally, K-means-SMOTE applies SMOTE on those selected clusters. The amount of oversampling for each cluster is computed based on the sparsity and density values of the minority class objects. Following this idea, A-SUWO [25] first group the training set but apply Complete-Linkage Hierarchical Clustering and then apply SMOTE over each cluster.
Farthest SMOTE (Farthest-S) [27] uses a similar approach to that of SMOTE, but rather than using the k-nearest neighbors, it uses the k-farthest neighbors.
To generate a synthetic object, Geometric-SMOTE (G-SMOTE) [28] first randomly selects an object of the minority class as the center of a hyper-spherical region and, also randomly selects one of its nearest neighbors computed in the whole training set to define the size of the hyper-spherical region based on the distance between the two selected objects. Then, the synthetic object is randomly generated as a point inside of the hyper-spherical region; the generation of synthetic objects is repeated as many times as synthetic objects to be generated.
SMOTE-SF (S-SF) [29] selects a subset of features to handle with high-dimensional datasets (a high number of features). The selection of the subset of features is performed by applying a feature ranking method (many methods are studied in their work). Then, SMOTE-SF generates synthetic objects similar to SMOTE but only until it reaches the number specified by an input parameter.
In the literature, other methods that are not based on computing the k-nearest neighbors for generating synthetic objects have been also proposed. However, these methods use computationally expensive techniques such as particle swarm optimization [22], self-organizing maps [23], multi-objective swarm fusion [26], genetic algorithms [31], differential evolution [32], deep generative models and variational autoencoders [33], and feature correlation computing [29]; among others for generating synthetic objects. Therefore, these methods are time-consuming and are unsuitable for large datasets with imbalanced classes.
From the above review of oversampling methods, we can see that with the exception of NDO, most oversampling methods are based on the search for the k-nearest neighbors or other slow techniques. This makes them time-consuming when applied on large datasets with imbalanced classes. Therefore, in the next section, we propose a fast oversampling method for class imbalance problems on large datasets.

3. Proposed Method

SMOTE is the most widely cited method for addressing the class imbalance problems and has inspired and continues to inspire the development of many oversampling methods [45,46,47,48,49,50,51]. However, SMOTE as well as SMOTE-based methods have poor time performance for large class imbalance problems because all of these methods either require searching for the k-nearest neighbors or use other time-consuming methods for balancing the minority class.
If SMOTE avoided searching the k-nearest neighbors to generate synthetic objects, this would improve its performance. An alternative to searching for the k-nearest neighbors in the generation of synthetic objects is that instead of using an object of the minority class each time and selecting one of its k-nearest neighbors as is done in SMOTE, one object of the minority class is used and the nearest neighbor’s selection is performed with a faster method for determining where in the minority class it is necessary to generate the new synthetic object.
To generate a new synthetic object, SMOTE uses an object of the minority class and one of its nearest neighbors. In some sense, this is done in order to guarantee that the synthetic object is generated in an object’s neighborhood belonging to the minority class. Using the nearest neighbors also aims to guarantee that the synthetic object is located in a region in the minority class because it is computed by generating a value between the values of an object in the minority class and one of its nearest neighbors for each of the features of the synthetic object. Thus, in our proposed method for generating synthetic objects in the minority class, instead of using objects of the minority class, as is done in SMOTE, we will use the mode jointly with the minimum and maximum values in each feature. We tested other central tendencies such as the mean or the median and other statistical dispersion metrics such as the standard deviation or the variance in the proposed method. However, the mode jointly with the minimum and maximum values obtained the best oversampling quality results.
To compute the mode for numerical features, we followed [52] (allowing us to compute the mode rapidly) to obtain the minimum and maximum values from a feature and divide the feature’s values in the sample in 10 equal-size bins. Then, the mode is computed as described by Equation (1):
m o d e = l + f f 1 ( f f 1 ) + ( f f + 1 ) w
where l is the lower limit of the bin with the highest frequency (f), w is the bin size, f 1 is the frequency of the bin preceding the bin with the highest frequency, and f + 1 is the frequency of the bin following to the bin with the highest frequency.
It is important to highlight that the mode, the minimum, and the maximum can be computed quickly since they can be computed in two scans of the minority class, i.e., computing them for a feature is O ( n ) , where n is the number of objects in the minority class. Thus, the complexity of computing them for all features is O ( m n ) , where m is the number of features.
In our method, we propose computing the absolute differences between the mode value and the minimum and maximum values for each feature in the minority class. Then, by subtracting or adding these differences multiplied by a certain random factor to each feature’s mode value, it is possible to generate a new synthetic object into the minority class. Similar to SMOTE, our method generates a synthetic object located between the mode (a central tendency measure) of the class and the neighbor objects that are not farther from the mode than the minimum or maximum values. We want to point out that using the minimum and maximum values allows our method to keep the synthetic generated values in the observed value range of the features.
Following the idea mentioned above, it is possible to avoid searching for the k-nearest neighbors, which is the most time-consuming step of SMOTE. Consequently, we obtain an oversampling method that is faster than SMOTE and the SMOTE-based methods.
The first step of our method computes, for each feature the minimum, maximum and mode values in the minority class. Then, the absolute differences between the mode and the minimum and maximum values are computed. Then, a random number is generated for each feature. This random number is multiplied by one of the differences and subtracted or added to the corresponding feature mode. To decide if a difference is subtracted or added, we generate a random number between 0.0 and 1.0 ; then, if the generated random number is lower than 0.5, the difference is subtracted. Otherwise, the difference is added. Thus, the generated synthetic object’s feature values will be clustered around the mode and in the region defined by each feature’s difference values. In the proposed method, we use a random number between 0 and 1; this allows the generation of objects as far as the differences allow, but not too far so as to avoid the generation of feature value outside the observed feature value range.
We want to point out that if the random number that is multiplied by the difference is closer to 0, the synthetic objects are generated closer to the mode of the class on the corresponding feature, or, in the opposite case, if the random number is close to 1, the feature values of the synthetic object is generated farther from the mode of the class and closer to the minimum or maximum values.
Finally, the above-described procedure is repeated as many times as the number of synthetic objects to be generated N (an input parameter of our method). A pseudo-code of the proposed method is shown in Algorithm 2.
To determine the computational complexity of Fast SMOTE, we ill analyze each one of its steps (see Algorithm 2). Steps 1–3 of Fast-SMOTE are O ( n f ) (where n is the number of objects in the minority class and f is the number of features of the dataset), because as it is well-known, computing the minimum and maximum and the mode from grouped data of n values is O ( n ) , and this must be done for each feature. Steps 4 and 5 are O ( f ) , because they involves just a difference for each one of the f features. The FOR loop of step 6 is repeated n times, and inside of this loop, we have a nested FOR loop that is repeated f times. In the inner loop, the steps 9–15 are O ( 1 ) . Therefore the complexity of the FOR loop of step 6 is O ( n f ) , and hence the complexity of Fast-SMOTE is O ( n f ) . This complexity is smaller than the complexity of SMOTE and SMOTE-based methods, which is at least O ( n 2 f ) [22,53] due to the k-nearest neighbors search. Moreover, this complexity is similar to the complexity of NDO, which is the only oversampling method reported in the literature that is not based on computing the k-nearest neighbors and therefore that can be applied to large datasets.
Algorithm 2 Fast-SMOTE
Input: A minority class, N - number of synthetic objects to be generated.
Output: An oversampled minority class.
M I N Minimum value for each feature into the minority class.
M A X Maximum value for each feature into the minority class.
M O D E Mode value for each feature into the minority class.
M i n D i f M O D E M I N Absolute difference between the mode and the minimum value for each feature into the minority class.
M a x D i f M A X M O D E Absolute difference between the mode and the maximum value for each feature into the minority class.
for  j = 1 , . . . , N  do
      S y n Initialize an empty object
     for each feature f do
          r R a n d o m ( 0 , 1 )
          r 2 R a n d o m ( 0 , 1 )
         if  r 2 < 0.5  then
             g a p M i n D i f f r
         else
             g a p M a x D i f f r
         end if
          S y n f M O D E f + g a p
     end for
     Add S y n to the minority class.
end for

4. Experimental Results

In this section, we first present an experiment to show the synthetic objects generated by SMOTE, NDO and our proposed method Fast-SMOTE. Then, in the second experiment, we evaluate the proposed method by comparing it to the methods described in the related work section using standard unbalanced public databases. Since these databases are relatively small, in the third experiment, we compared the proposed method to the fastest methods in the previous experiment but for larger datasets. Finally, in the last experiment, we demonstrate the scalability of the proposed method.

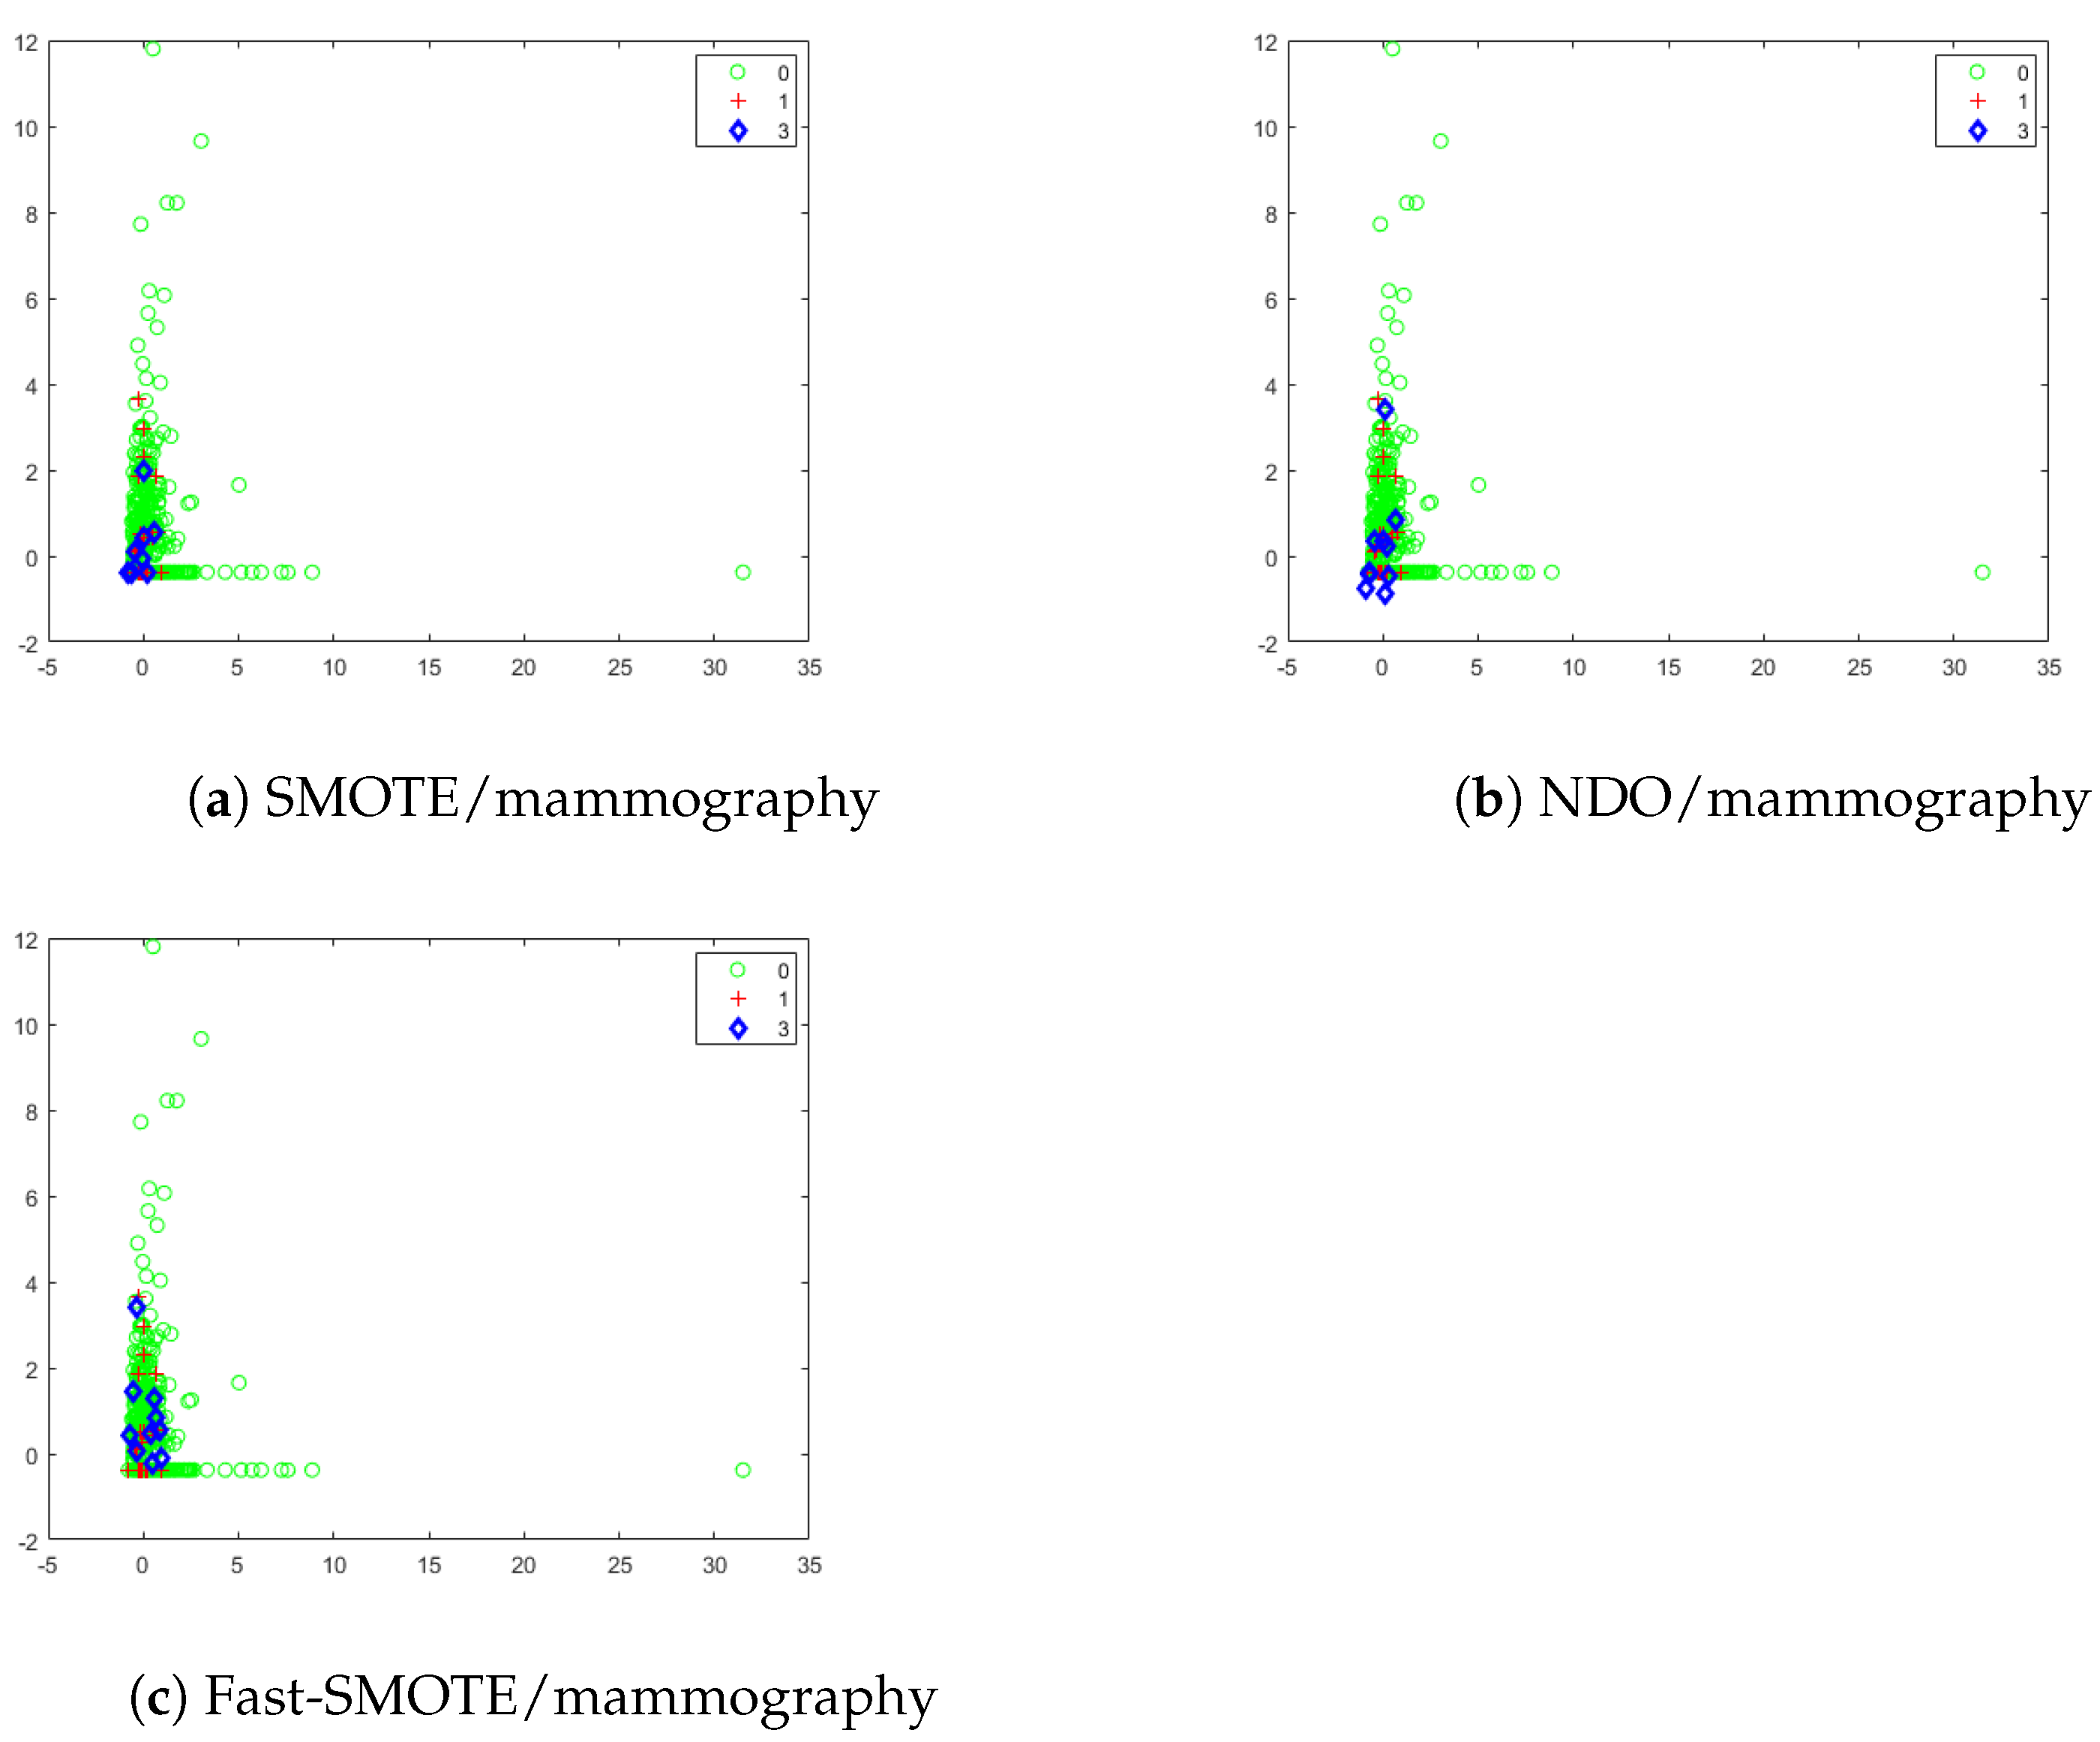
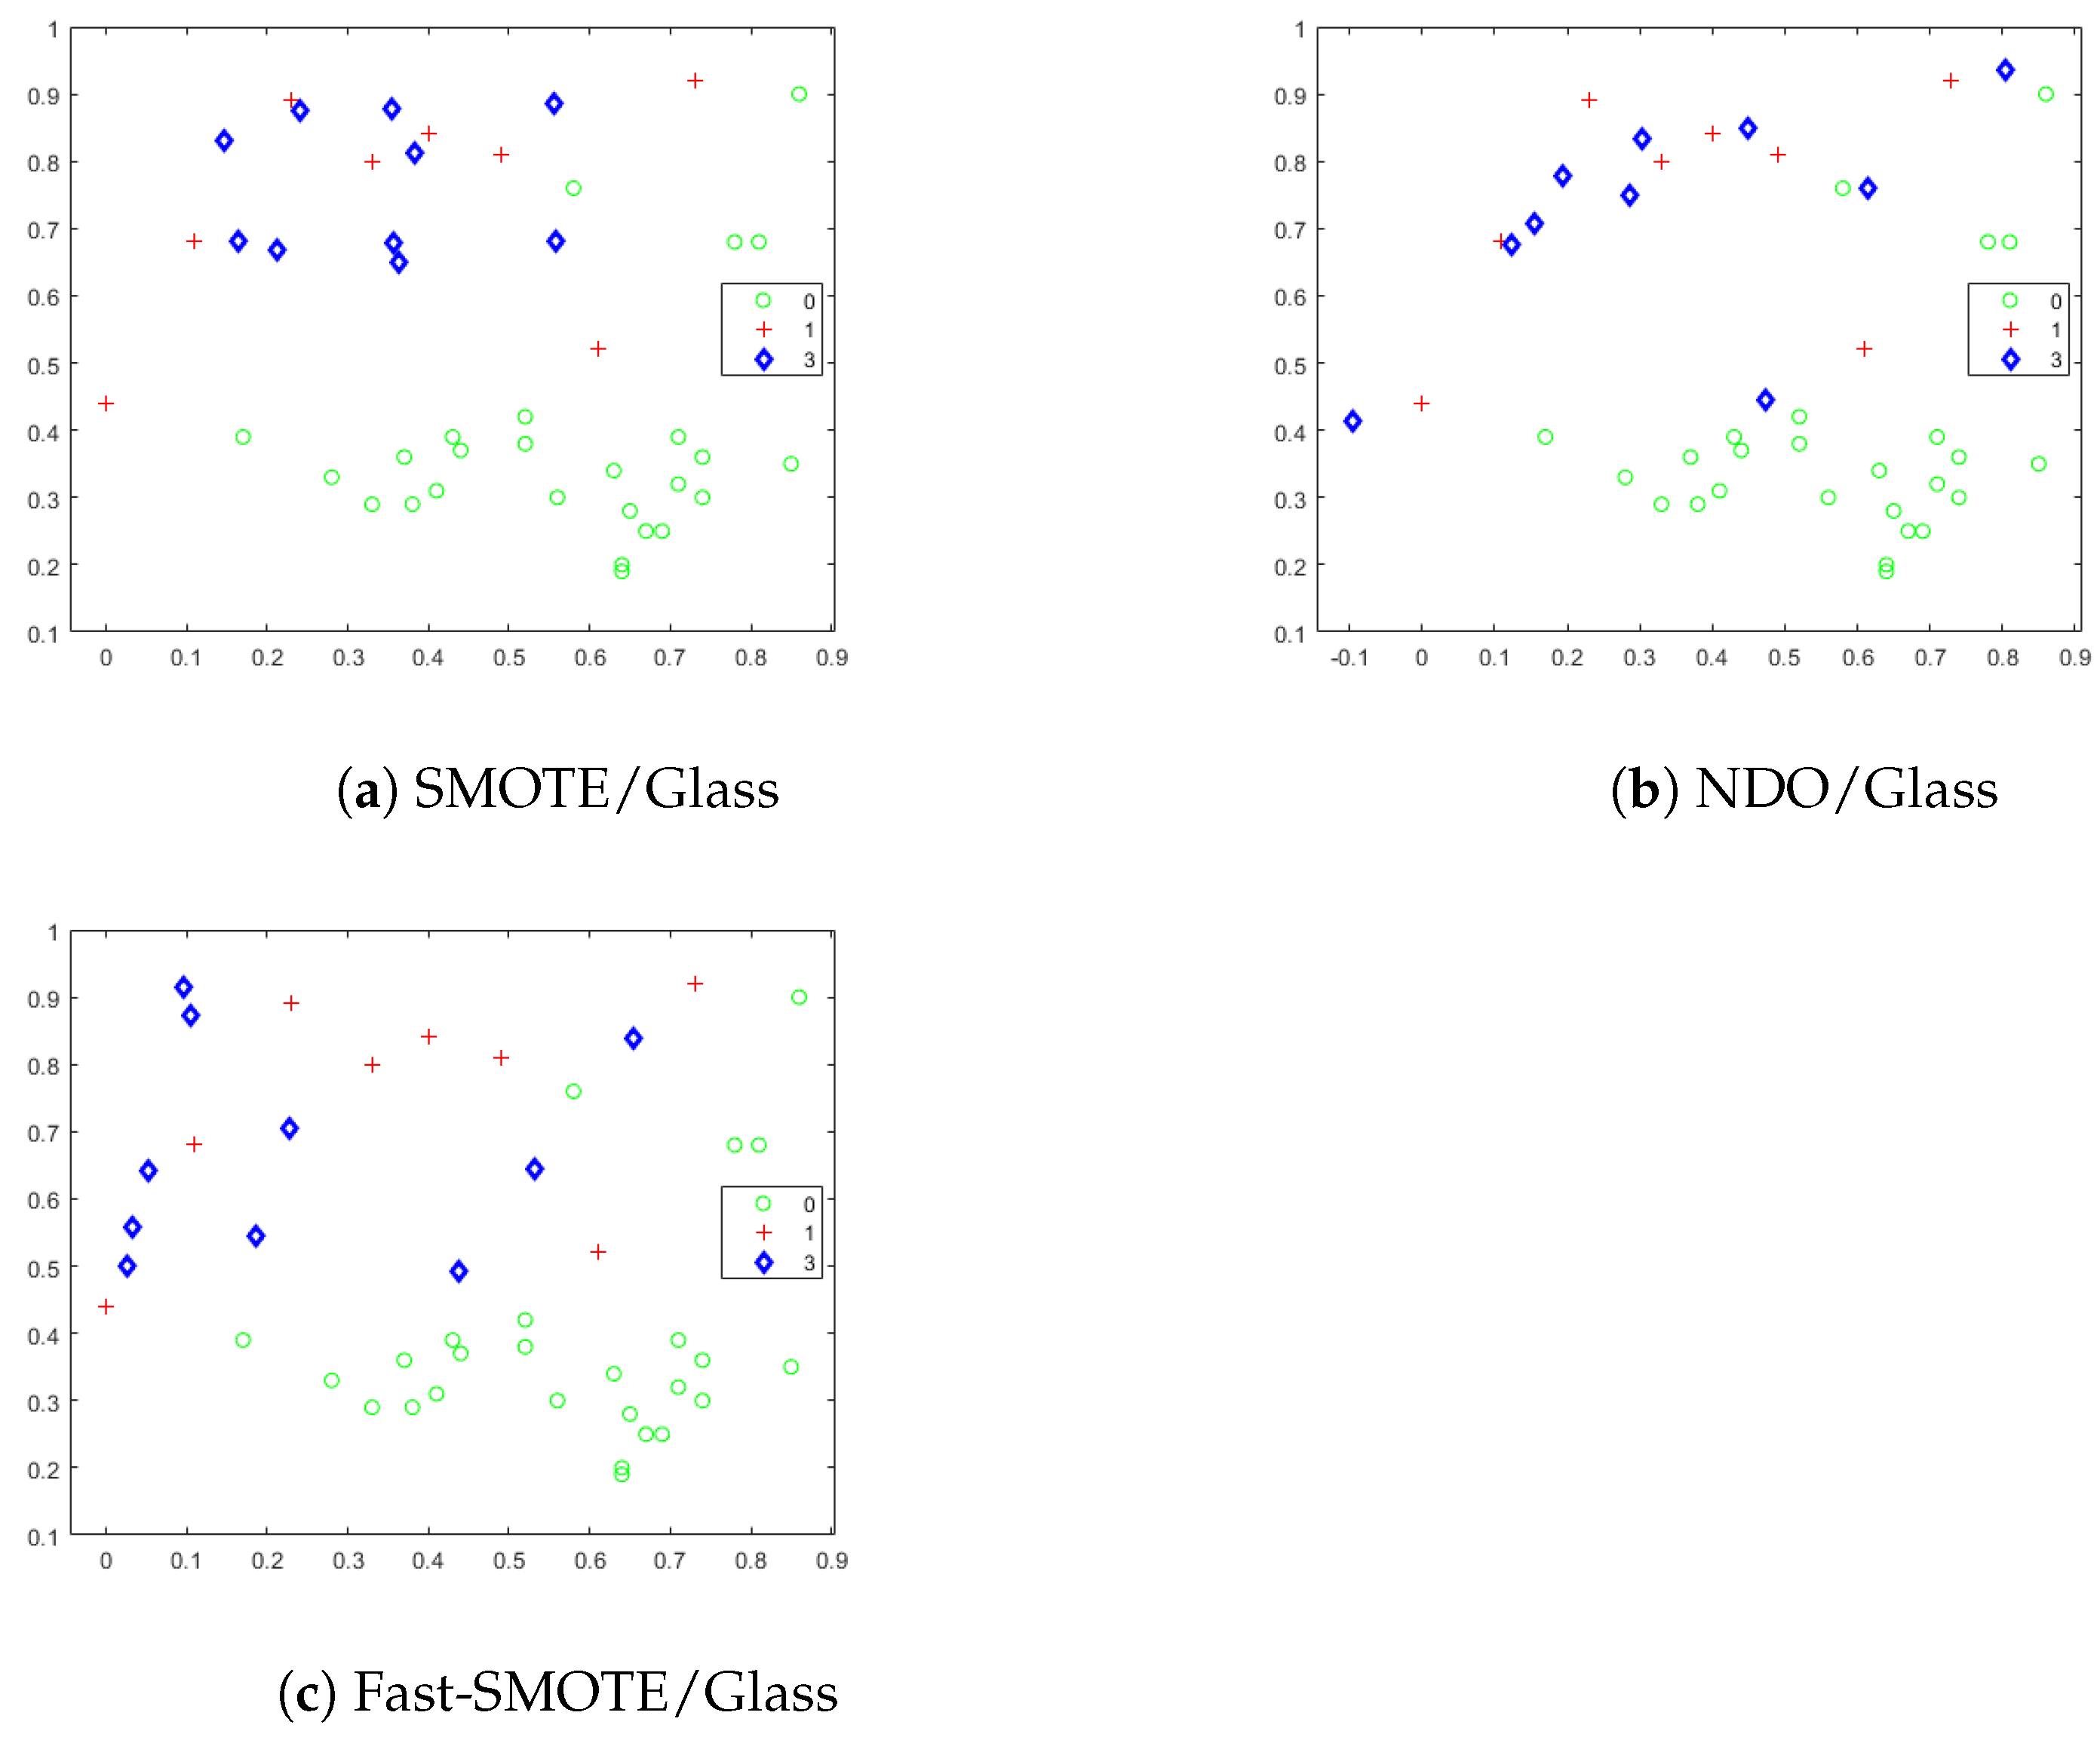
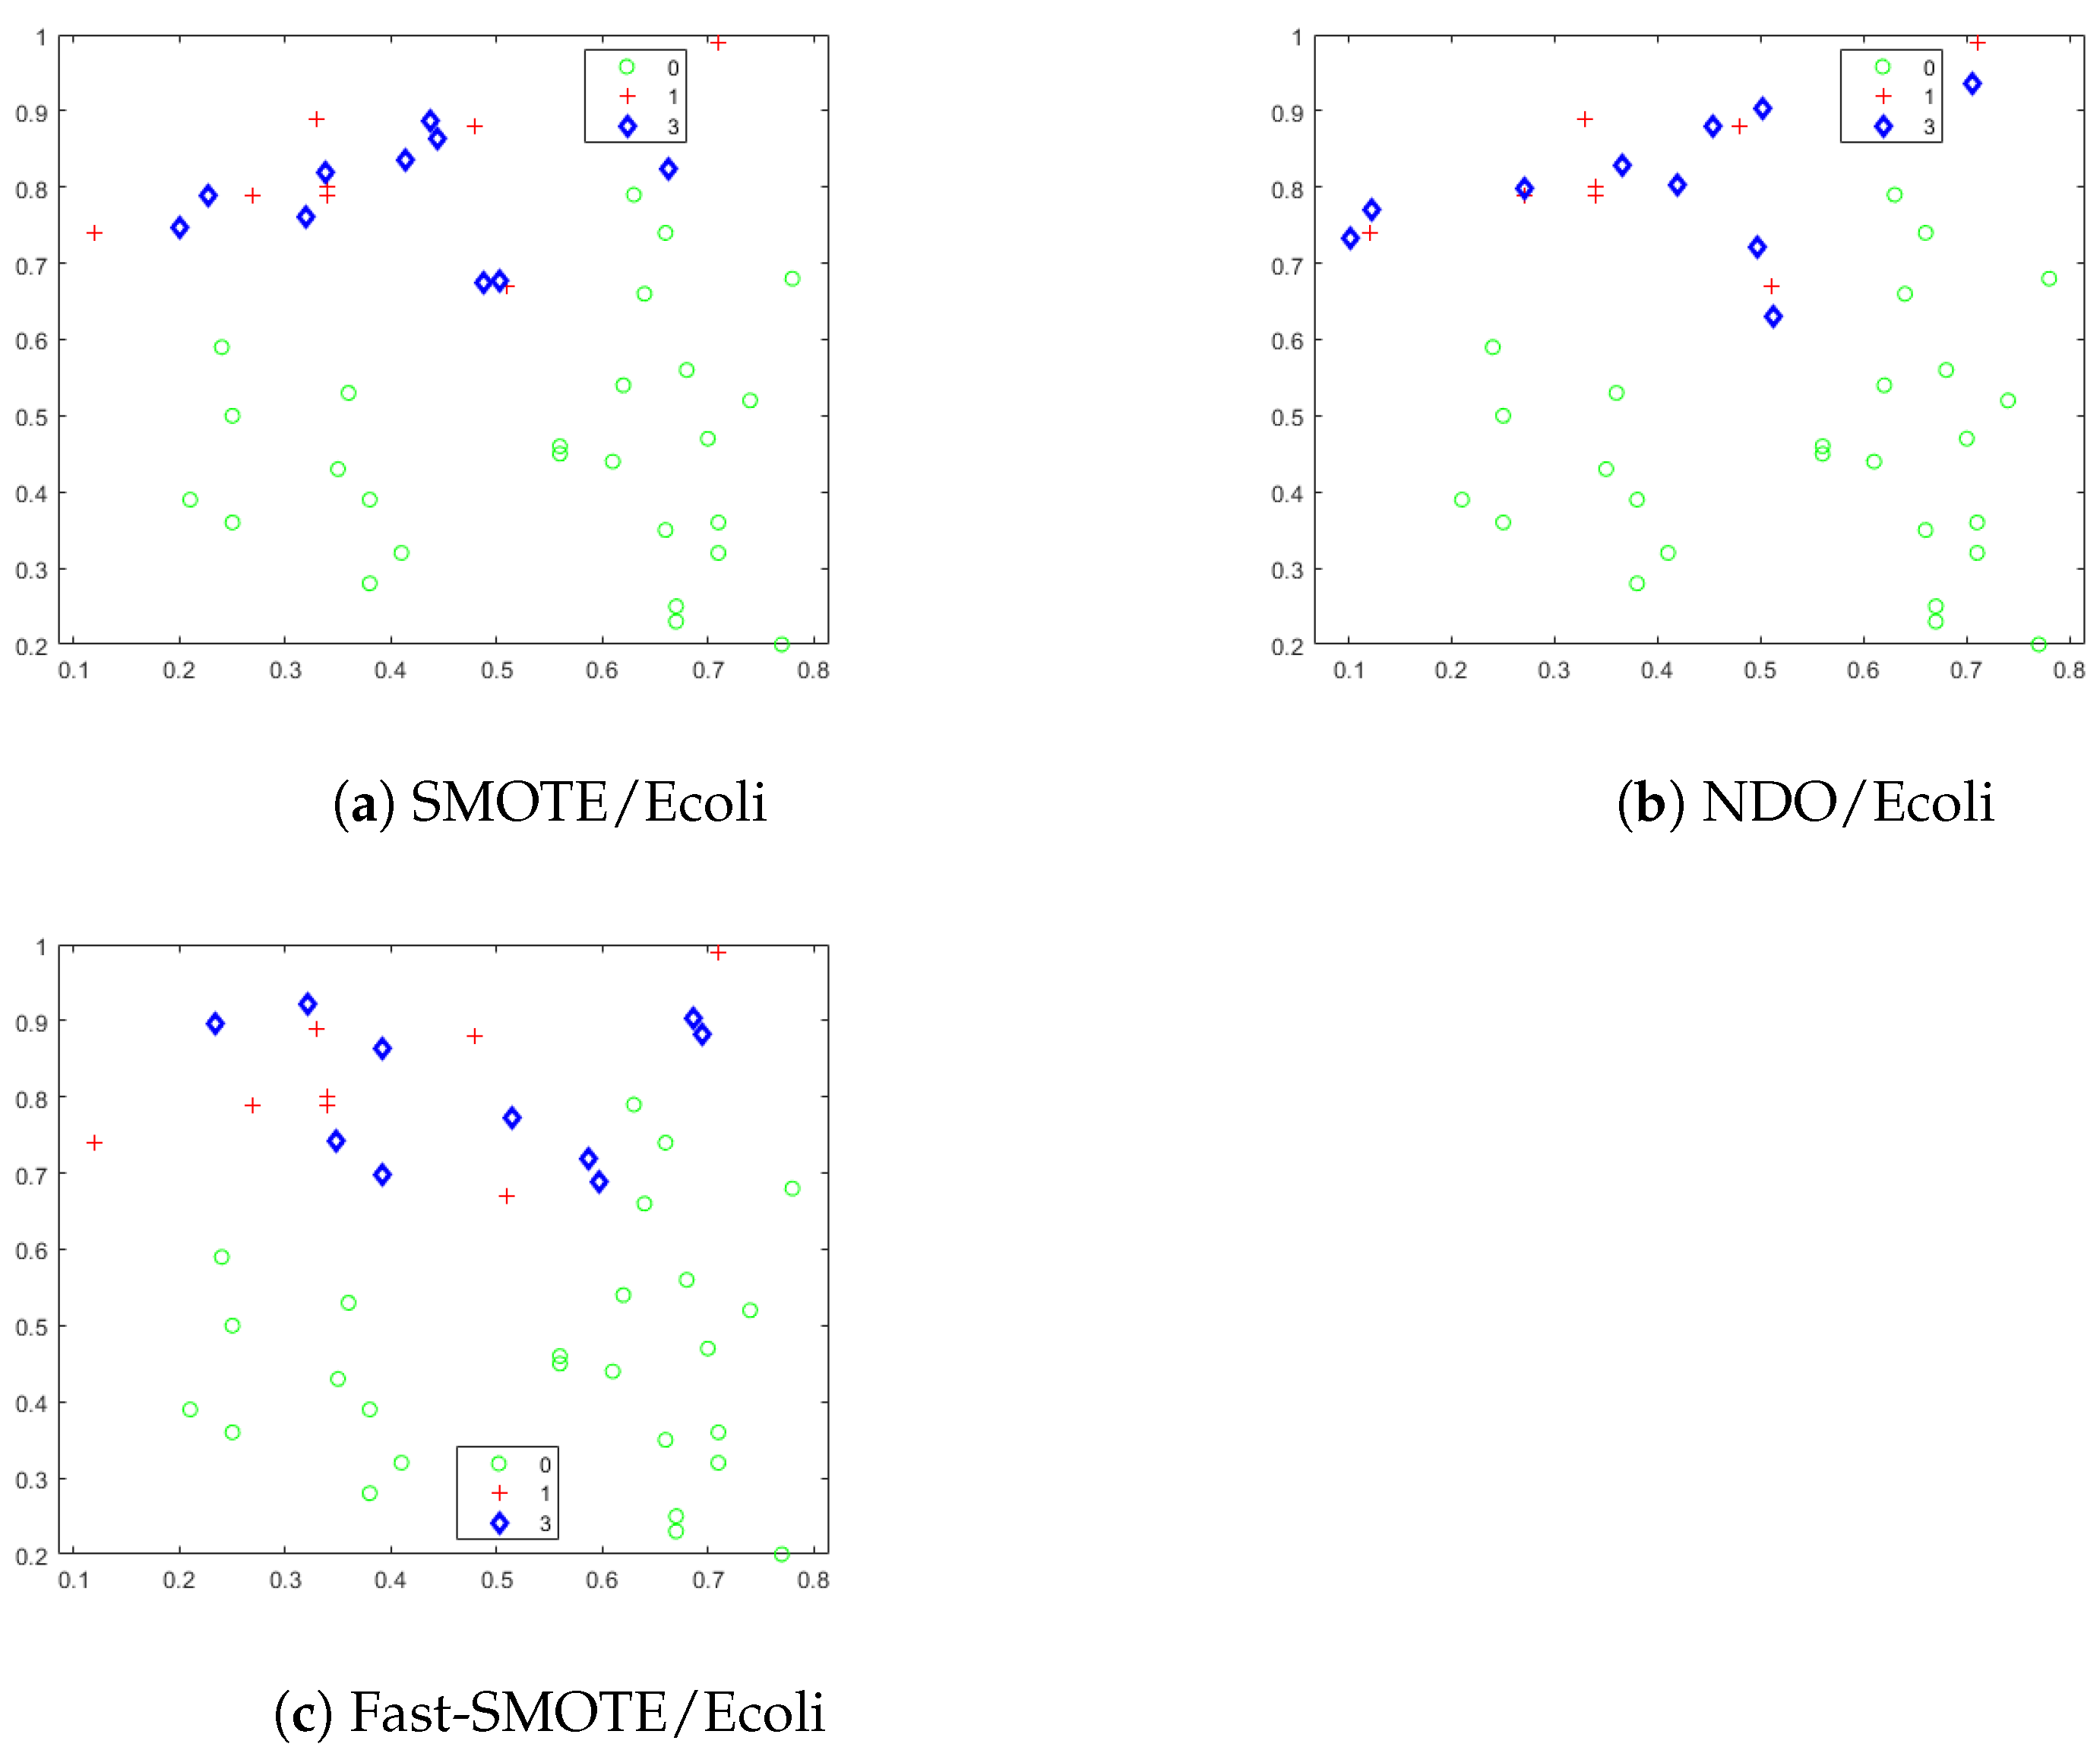
4.1. Synthetic Objects Generated by SMOTE, NDO and Fast-SMOTE

This experiment applies SMOTE, NDO, and Fast-SMOTE over three real datasets to show the synthetic objects generated by each method.
For this experiment, we used the mammography dataset that was also used in [54] for this purpose, and we included the glass6 and ecoli1 datasets from the KEEL repository [55]. For a better appreciation of the plotted objects, for this experiment, we selected only 10% of majority class objects and 10% of minority class objects. In this way, the IR of each dataset is preserved.
To show the synthetic objects generated by each method, in Figure 1, Figure 2 and Figure 3 we plotted, in a 2-D projections, the mammography, glass, and ecoli datasets respectively, together with 10 synthetic objects generated by each method. The mammography dataset was projected on the fourth and fifth features, the glass6 dataset on the a l u m i n u m and s i l i c o n features, and the ecoli1 dataset on the M c g and A l m 2 features. In all three figures, green circles represent the objects of the majority class, and red crosses represent the objects of the minority class. Also, we show in Table 1 the mode values computed by the proposed method on each dataset (see rows) for axis x and y (see columns) for the Figure 1, Figure 2 and Figure 3.
In Figure 1, Figure 2 and Figure 3, we can see that Fast-SMOTE, as well as SMOTE and NDO generate synthetic objects close to the objects of the minority class.

4.2. Comparison against State of the Art Oversampling Methods

In this experiment, we compare the proposed method Fast-SMOTE to the state-of-the-art oversampling methods in terms of oversampling quality and runtime. In this experiment, we used small-medium size datasets to allow applying SMOTE and other state of the art methods. We used all 66 imbalanced datasets from the KEEL repository [55] (shown in Table 2), and assessed the oversampling quality of the oversampling methods. This was done by oversampling a repository training dataset until reaching a full balance between classes and training a classifier with the oversampled dataset produced by an oversampling method. The testing set that is also available in the repository was used to evaluate the trained classifier. The quality of the classification result is interpreted as the oversampling quality of the employed oversampling method.
Since all oversampling methods generate random numbers when a synthetic object is built, the oversampling methods were applied 30 times for each one of the 66 imbalanced datasets using the 5-fold cross-validation partition available in the repository. We used the supervised classifiers CART (Classification and Regresion Tree), KNN (K-Nearest Neighbor Classifier) (K = 5), and Naïve Bayes. Additionally, as suggested in [56], we used AUC (Area Under Curve) to assess the classification results, the most used measure for evaluating classification quality on imbalance class problems.
Table 3 shows the average AUC of the 150 results (30 repetitions for each one of the 5 folds) obtained with each classifier (CART, KNN, and Naïve Bayes; see rows) over the 66 datasets for each oversampling method (see columns). As mentioned above, most of the compared oversampling methods are based on finding the k-nearest neighbors; it is observed from the results shown in Table 3 that these methods obtain the best AUC results. In particular, we can observe that SMOTE and S-RSB* obtained the best average oversampling quality. On the other hand, the methods that are not based on finding the nearest neighbors (NDO and Fast-SMOTE) do not obtain the lowest oversampling quality. The methods that obtain the worst AUC results were K-Means-S and G-SMOTE. The proposed method and NDO, obtain lower average AUC results than SMOTE and S-RSB* although unlike these methods, Fast-SMOTE and NDO can be applied on large datasets.
Additionally, in this experiment we assessed the runtime employed by the oversampling methods. This experiment was run in MATLAB 2020b, using a computer with a Ryzen 5300X 3.60 GHz processor with 32 GB DDR4 RAM, running 64-bit Windows 10.
Table 4 shows the runtime in seconds to fully balance each KEEL data set with all oversampling methods. An examination of the data presented in the table shows that S-RSB* was the most time-consiming oversampling method. By contrast, the proposed Fast-SMOTE method is clearly the fastest of all the oversampling methods under comparison. The closest method in runtime to our proposed method is NDO, but it was more than twice as time-consuming as the proposed method.
Based on this experiment, we conclude that the methods that obtain the best oversampling quality in the previous experiment are among the slowest. By contrast, the fastest methods obtain lower oversampling quality, although it is similar to that of the methods that obtain the best oversampling results. However, the KEEL repository databases are relatively small and therefore do not provide a good assessment of the runtime advantage of the proposed method. Hence, in the following experiment, the proposed method is compared to NDO that is the second fastest method in the previous experiment but for larger datasets.

4.3. Assessing the Proposed Method in Large Datasets
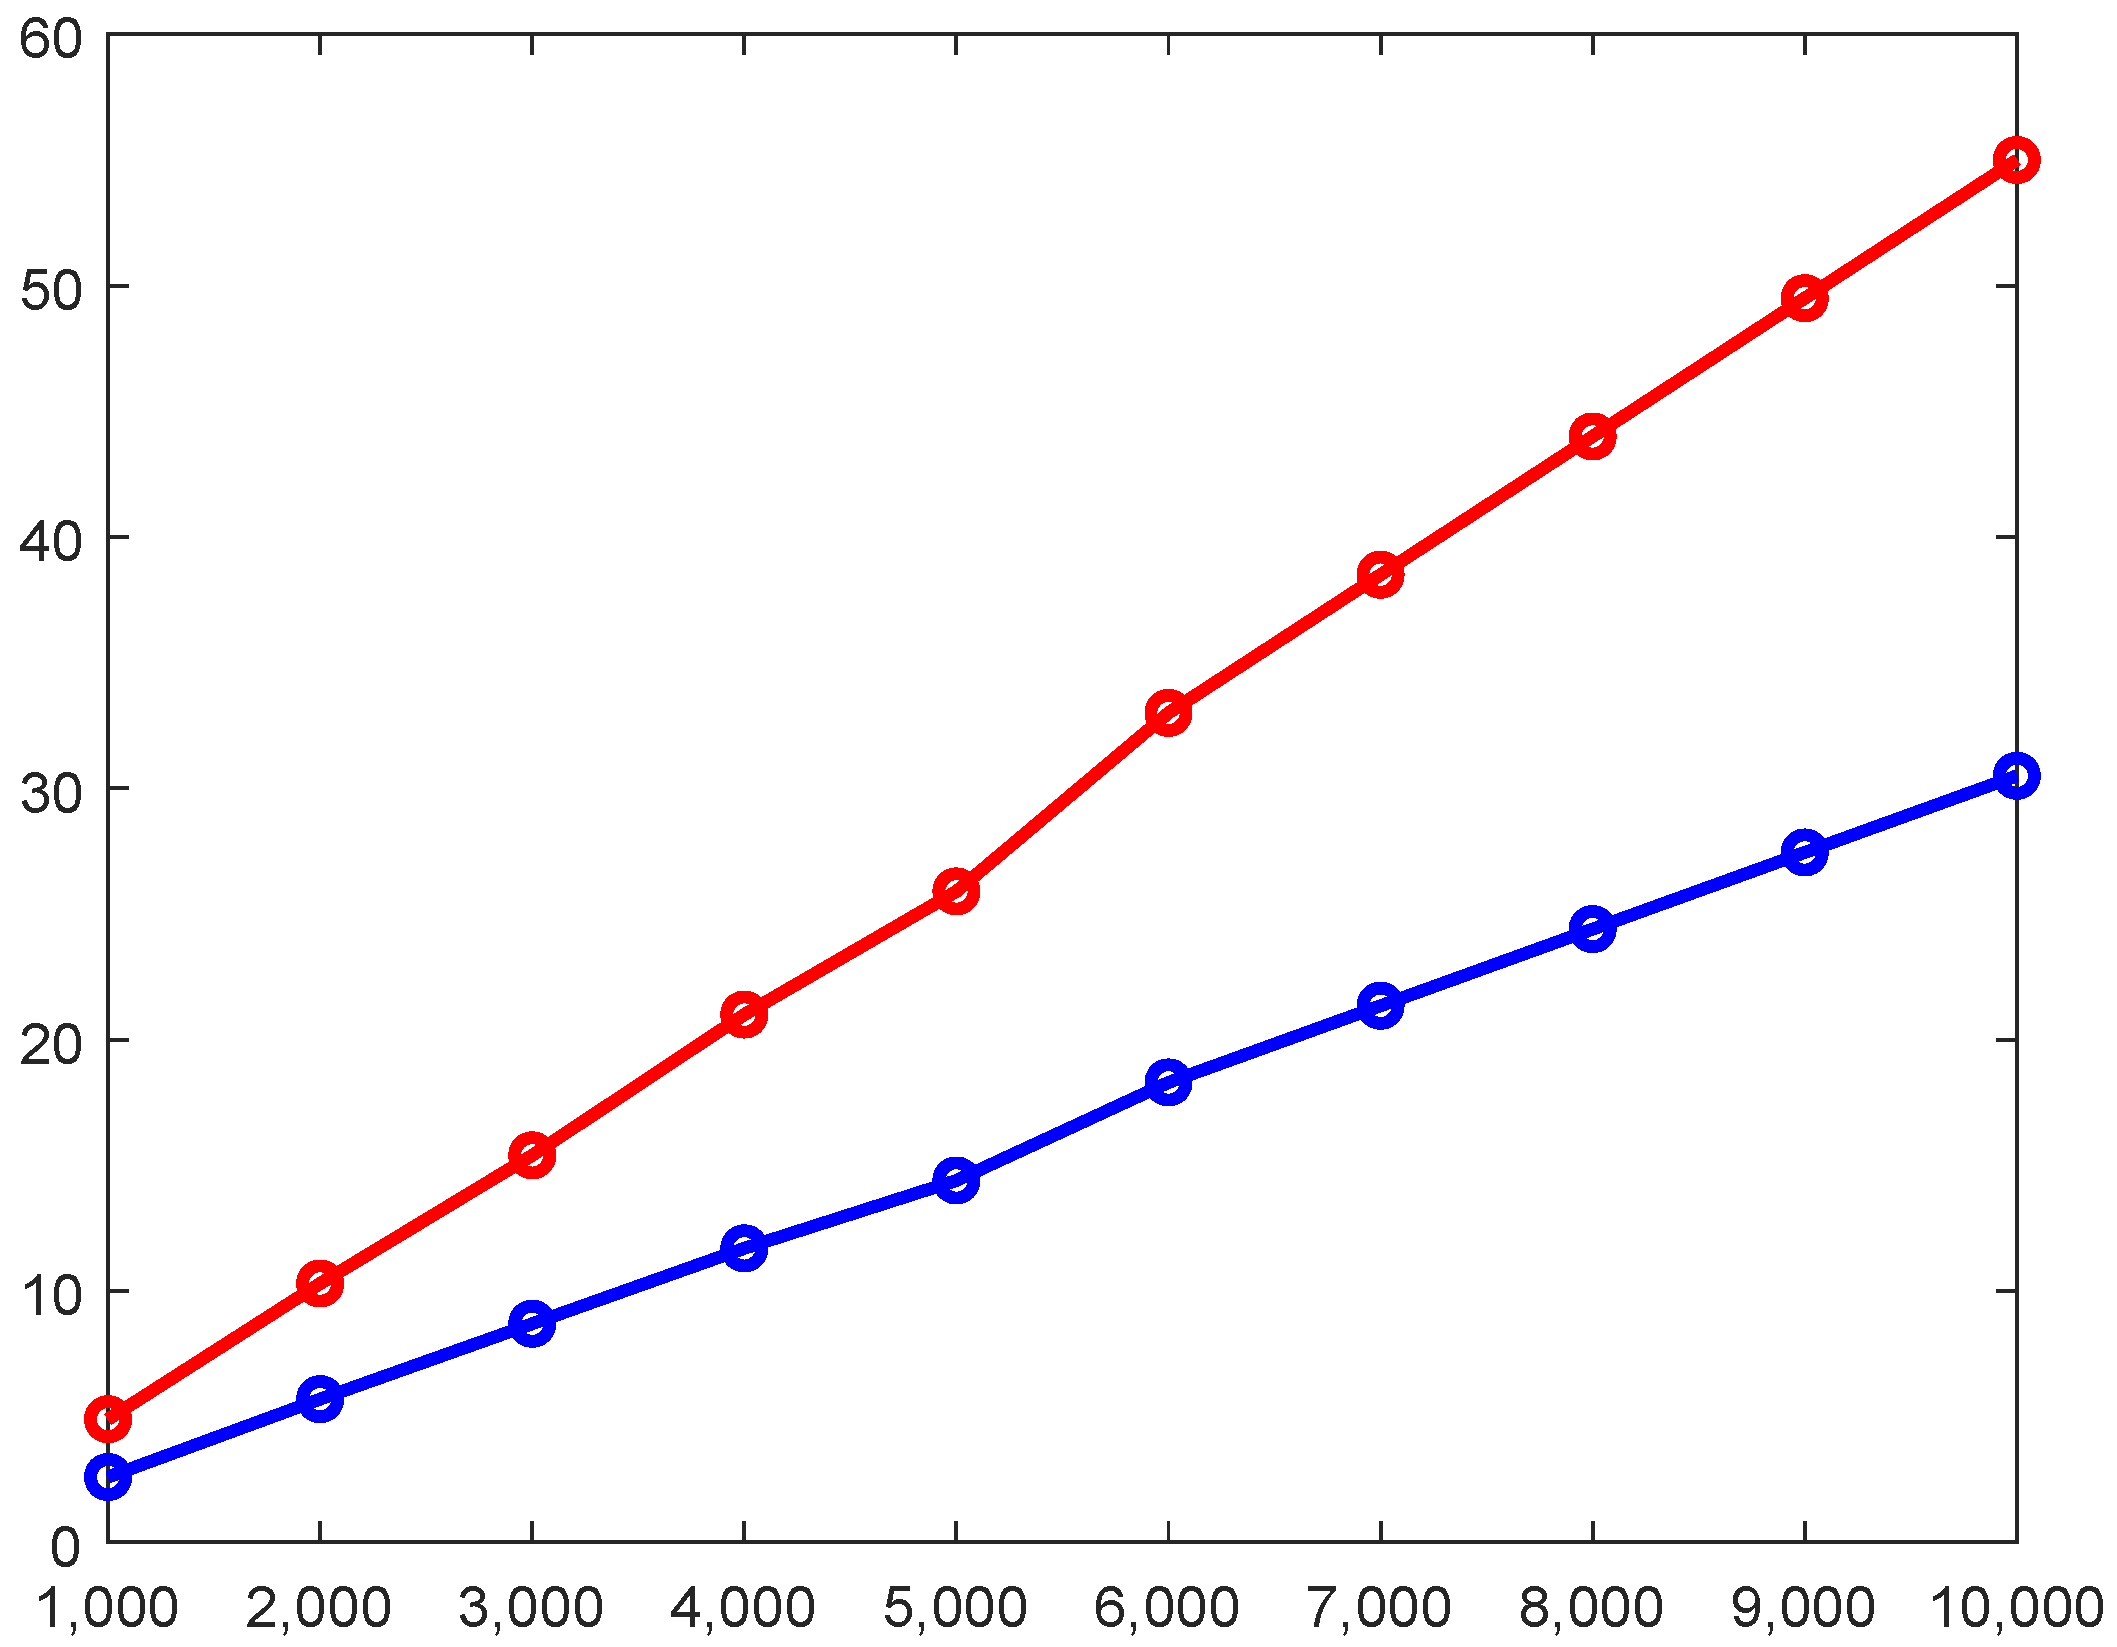
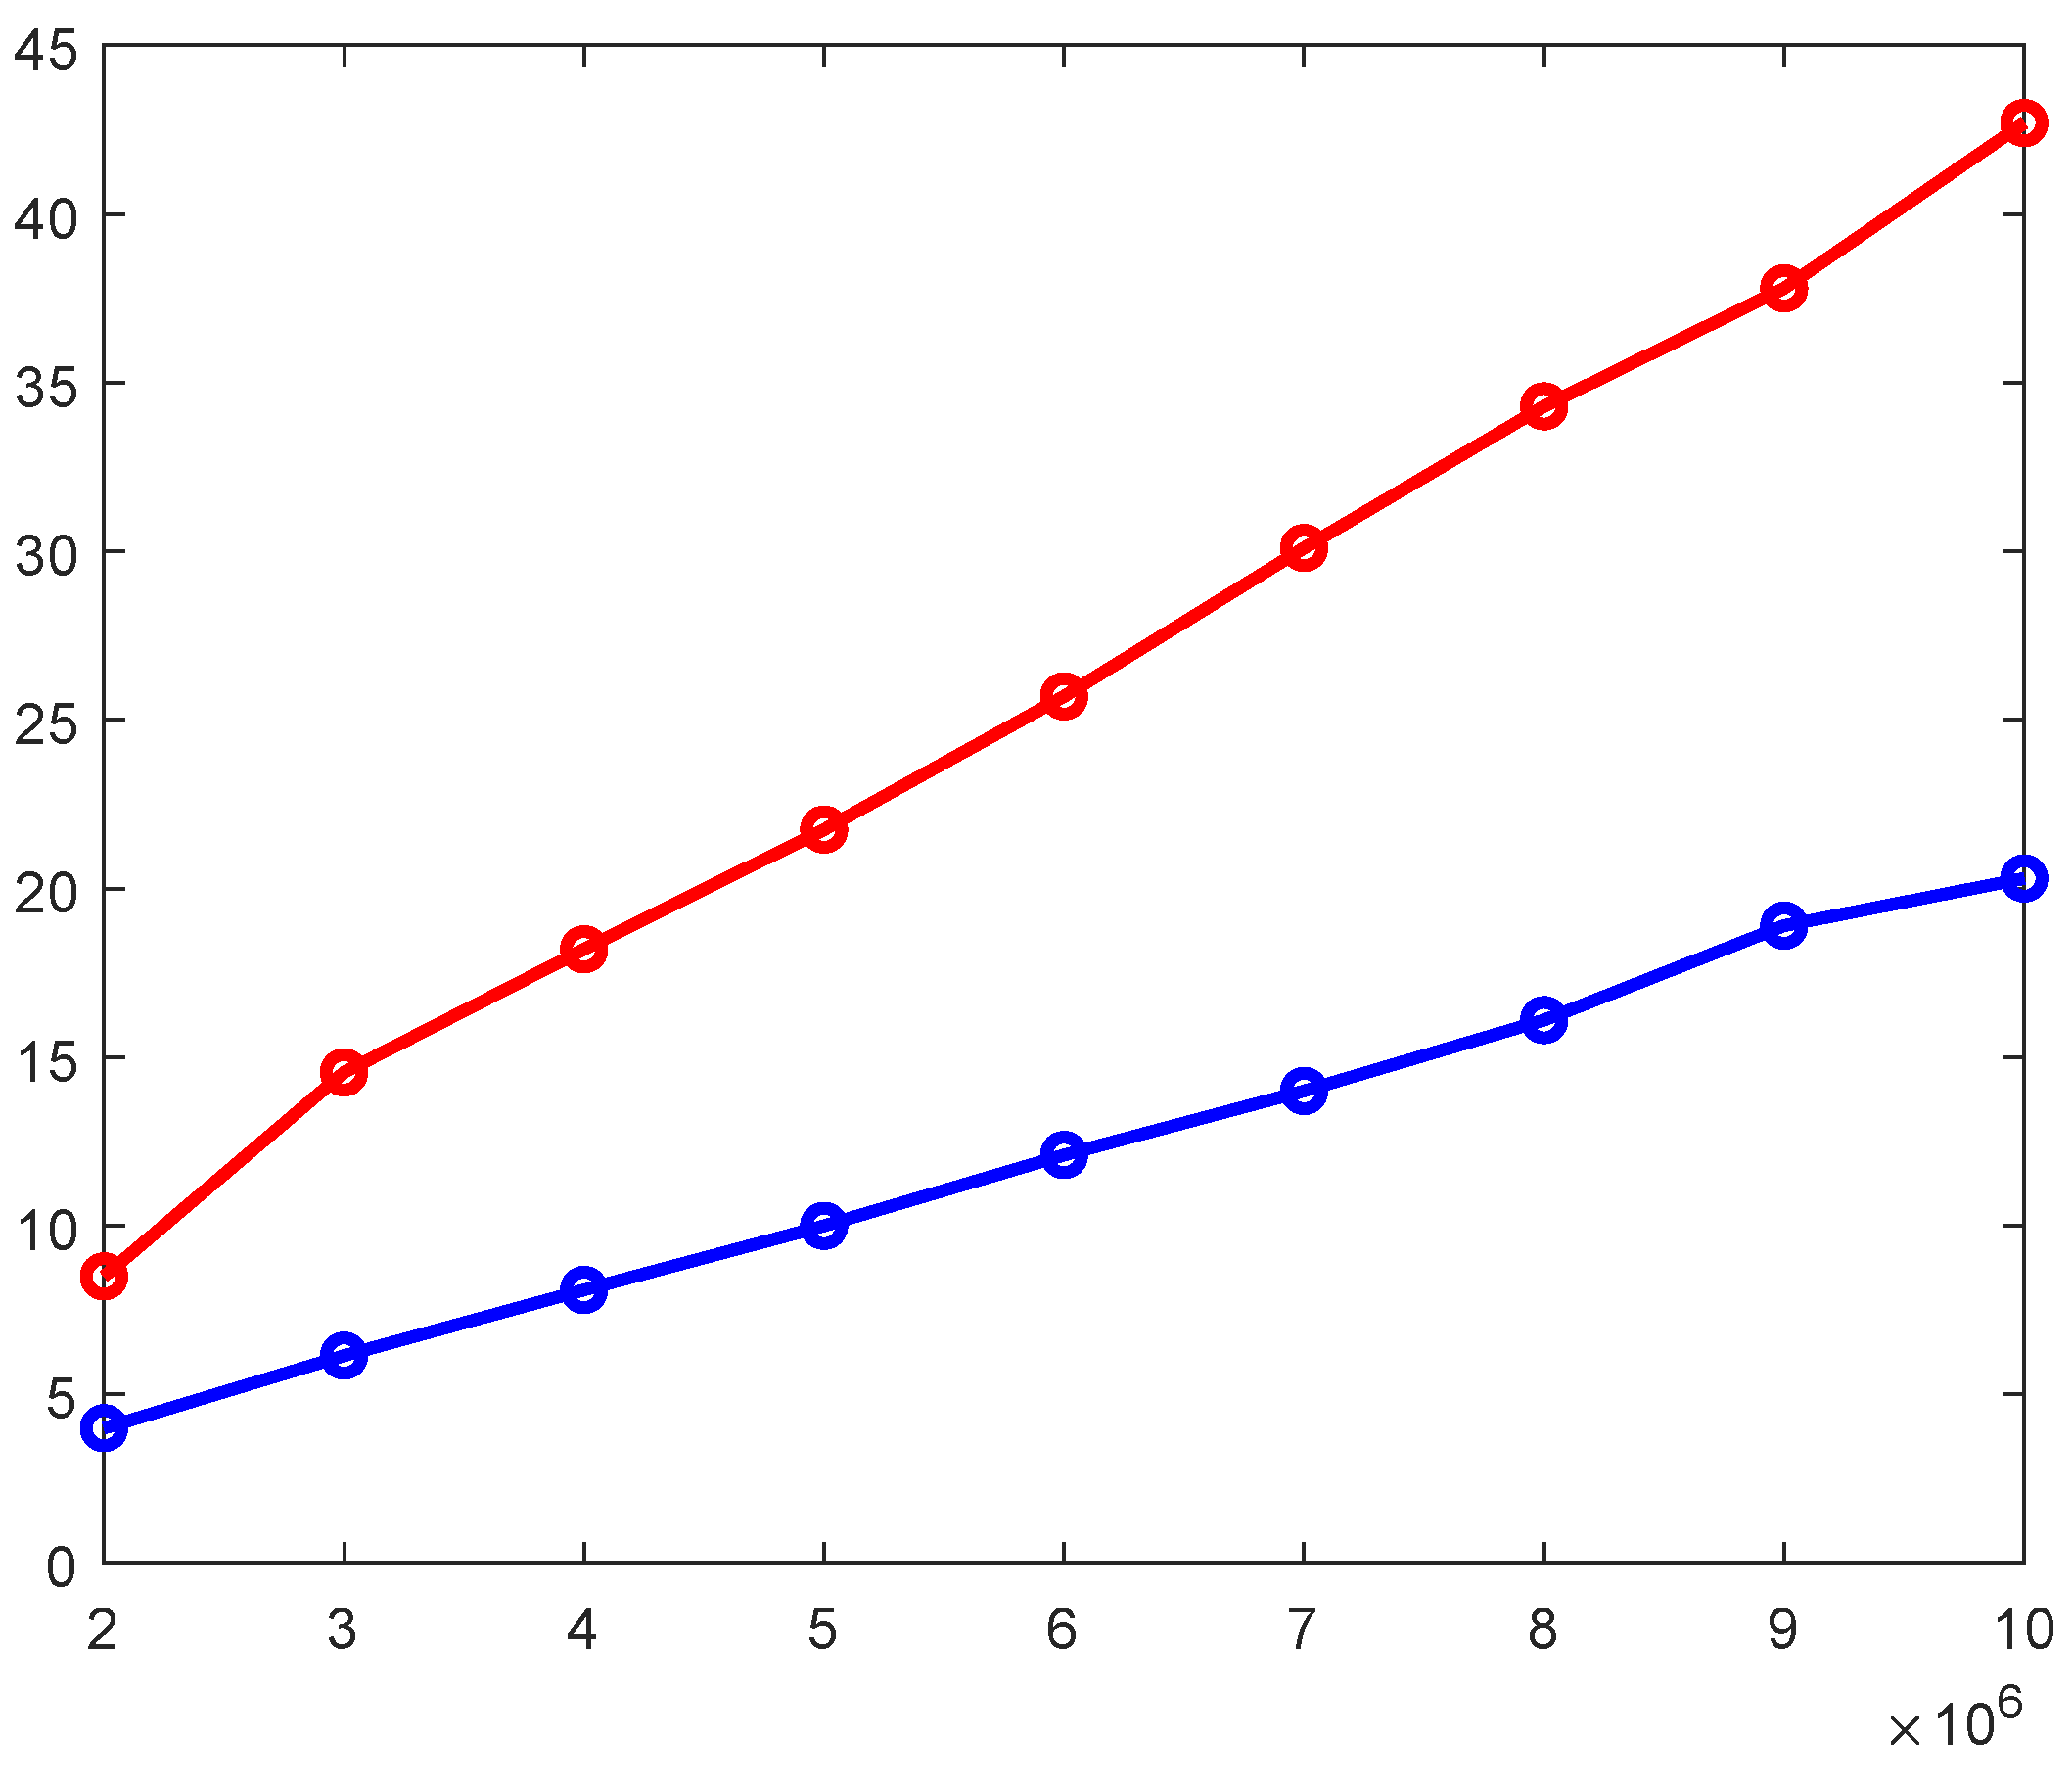
In this experiment, we compared the proposed method to the fastest method in the previous experiment, namely NDO, but on larger datasets taken from the UCI repository [57] (see Table 5); these datasets are 5, 7, 10, 44, and 100 times larger than the largest dataset used in the previous experiments (page-blocks0).
We followed the same evaluation scheme to measure the oversampling quality of the methods as in the previous experiment. However, given the datasets’ size, the oversampling methods were applied only 10 times on each imbalanced dataset of Table 5 with a 5-fold cross-validation partition. Additionally, we only used the CART classifier because it can produce good results in a reasonable time for this size of the datasets compared with the other two supervised classifiers.
Table 6 shows the average AUC of the 50 results (10 repetitions for each one of the 5 folds) obtained from each dataset in Table 5 for NDO and Fast-SMOTE. As observed from the data presented in this table, the proposed method and NDO obtain quite similar oversampling quality results for all of the datasets. To validate these results, we applied the Wilcoxon test, which showed that Fast-SMOTE and NDO were statistically similar on the first three datasets (Default of credit card clients, Online News Popularity, and Statlog (Shuttle)). Meanwhile, for the Skin segmentation dataset, Fast-SMOTE was statistically better than NDO, and for the Buzz in social media (Twitter) dataset, NDO was statistically better than Fast-SMOTE. On the other hand, in Table 7, we show the runtime spent by NDO and Fast-SMOTE for fully balancing every dataset in Table 5. Table 7 shows that the proposed method’s runtime is approximately 50% lower than NDO’s runtime. Moreover, the difference grows with increasing the size of the dataset. For example, for the largest dataset, the dataset with 583,250 objects (153,487 objects in the minority class, a large dataset, although not so large) and 78 features, Fast-SMOTE only require 2860.4 s, while NDO require 8771.89 s, in this case, NDO spent more than three times longer time than our method.
Although we could include larger datasets, the datasets of Table 5 are sufficient for showing that the proposed method is clearly faster than NDO on large datasets.

4.4. Scalability

In this experiment, we evaluate the scalability of the proposed method Fast-SMOTE. Here, we randomly generated two artificial datasets with numeric features in [0,1], one with 10,000,000 objects and 10 features, and another with 10,000 features and 10,000 objects. Then, to evaluate the scalability of the proposed method regarding the number of objects, we measure the runtime required for oversampling minority classes from one million to 10 million of objects with increments of 2 million of objects, taken from the artificial dataset with 10 features. Additionally, to evaluate the scalability of Fast-SMOTE regarding the number of features, we measure the runtime required for oversampling minority classes with 1000 to 10,000 features with increments of 1000 features from the artificial dataset with 10,000 objects. Due to the size of the minority classes that makes it unmanageable in MATLAB, for this experiment, Fast-SMOTE and NDO were implemented in C++. The experiment was run on a computer with an Intel Core i7-3820 3.60 GHz processor with 64 GB DDR4 RAM, running 64-bit Ubuntu. Although we could use larger datasets, we selected these datasets because they are sufficient for demonstrating the scalability of Fast-SMOTE.
Figure 4 shows a graph of the scalability of the proposed method Fast-SMOTE with respect to the number of objects. For comparison purposes, we include NDO in the graph. In this graph, the x-axis shows the number of objects of the minority classes used in this experiment, while the y-axis shows the runtime in seconds for FAST-SMOTE (blue line) and NDO (red line) for oversampling the respective minority class. From this figure, we can observe that Fast-SMOTE scales better than NDO with increasing number of objects, allowing oversampling larger datasets in a much shorter runtime.
Figure 5 shows a graph of the scalability of Fast-SMOTE with respect to the number of features. We also included NDO results in the graph. In this graph, the x-axis shows the number of features that describe the objects of the minority classes used in this experiment, while the y-axis shows the runtime in seconds required by FAST-SMOTE (blue line) and NDO (red line) for oversampling the respective minority class. It is observed from this figure that Fast-SMOTE scales better than NDO with increasing number of features.
This experiment shows that when the number of objects and variables grows, Fast SMOTE has better scalability than NDO, making it more suitable than NDO for practical use.

5. Conclusions

In this paper, we introduced Fast-SMOTE, a fast oversampling method non based on the k-nearest neighbors search that is the most time-expensive step of SMOTE-based methods. For each feature, the proposed method uses the value that appears most often in the minority class (the mode) jointly with the minimum and maximum values (all three can be quickly computed), in an appropriate manner, for the generation of synthetic objects around the mode in the region of the minority class defined by the minimum and maximum values. This allowed us to obtain a linear complexity oversampling method that is much faster than SMOTE-based methods, which complexity is at least quadratic. Moreover, the proposed method has a complexity similar to the complexity of NDO, which is the only oversampling method reported in the literature that is not based on the k-nearest neighbors, however according to our experiments, the proposed method scales better when the number of objects and features increases.
Comparing the synthetic objects generated by the proposed method against those generated by SMOTE and NDO, we have shown that similar to SMOTE and NDO, Fast-SMOTE generate synthetic objects close to the objects of the minority class and near the decision region between the classes.
In small unbalanced datasets where state-of-the-art oversampling methods can oversample the minority class in a short time, the proposed method obtains an oversampling quality similar to these method but it is found to be the fastest method.
Our comparison between Fast-SMOTE and NDO for large datasets with regard to runtime and A U C shows that Fast-SMOTE produces oversampled datasets that allow training supervised classifiers to obtain classification results that are statistically similar to those classification results obtained by training the classifiers with datasets oversampled by NDO, but in much less runtime. From all of these experiments, we can conclude that Fast-SMOTE is the best method for oversampling large datasets with imbalanced classes.
As mentioned above, the development of oversampling methods not based on the search for nearest neighbors is a poorly explored research direction. Hence, in future work, we propose to continue developing oversampling methods following this approach. In particular, we are interested in developing oversampling methods that can work on large mixed datasets with imbalanced classes. Additionally, the implementation and development of oversampling methods on GPU, parallel CPU or distributed computing [58,59,60,61,62] is an active research area. Thus, in future work, we will develop an implementation of our oversampling method on these platforms to improve its runtime further. Also, we will face the imbalance problem with other problems in supervised classification as noise, missing data, or multiple minority class groups.

Author Contributions

Writing—original draft preparation, F.R.-T.; writing—review and editing, F.R.-T., J.F.M.-T. and J.A.C.-O.; supervision, J.F.M.-T. and J.A.C.-O. All authors have read and agreed to the published version of the manuscript.

Funding

This research was partly funded by the National Council of Science and Technology of Mexico.

Institutional Review Board Statement

Not applicable.

Informed Consent Statement

Not applicable.

Data Availability Statement

Not applicable.

Acknowledgments

The first author gratefully acknowledges the National Council of Science and Technology of Mexico (CONACyT) for his Ph.D. fellowship through a scholarship.

Conflicts of Interest

The authors declare no conflict of interest.

References

  1. Moscato, V.; Picariello, A.; Sperlí, G. A benchmark of machine learning approaches for credit score prediction. Expert Syst. Appl. 2021, 165, 113986. [Google Scholar] [CrossRef]
  2. Du, G.; Zhang, J.; Li, S.; Li, C. Learning from class-imbalance and heterogeneous data for 30-day hospital readmission. Neurocomputing 2021, 420, 27–35. [Google Scholar] [CrossRef]
  3. Eivazpour, Z.; Keyvanpour, M.R. CSSG: A cost-sensitive stacked generalization approach for software defect prediction. Softw. Test. Verif. Reliab. 2021, 31, e1761. [Google Scholar] [CrossRef]
  4. Srinivasan, R.; Subalalitha, C. Sentimental analysis from imbalanced code-mixed data using machine learning approaches. Distrib. Parallel Databases 2021, Volume 39, 1–16. [Google Scholar] [CrossRef]
  5. Hussin, S.K.; Abdelmageid, S.M.; Alkhalil, A.; Omar, Y.M.; Marie, M.I.; Ramadan, R.A. Handling Imbalance Classification Virtual Screening Big Data Using Machine Learning Algorithms. Complexity 2021, 2021, 6675279. [Google Scholar] [CrossRef]
  6. Vilalta, R.; Rish, I. A decomposition of classes via clustering to explain and improve naive bayes. In European Conference on Machine Learning; Springer: Berlin/Heidelberg, Germany, 2003; pp. 444–455. [Google Scholar]
  7. Elyan, E.; Gaber, M.M. A fine-grained random forests using class decomposition: An application to medical diagnosis. Neural Comput. Appl. 2016, 27, 2279–2288. [Google Scholar] [CrossRef] [Green Version]
  8. Chawla, N.V.; Bowyer, K.W.; Hall, L.O.; Kegelmeyer, W.P. SMOTE: Synthetic minority over-sampling technique. J. Artif. Intell. Res. 2002, 16, 321–357. [Google Scholar] [CrossRef]
  9. Han, H.; Wang, W.Y.; Mao, B.H. Borderline-SMOTE: A new over-sampling method in imbalanced data sets learning. In International Conference on Intelligent Computing; Springer: Berlin/Heidelberg, Germany, 2005; pp. 878–887. [Google Scholar]
  10. Hu, S.; Liang, Y.; Ma, L.; He, Y. MSMOTE: Improving classification performance when training data is imbalanced. In Proceedings of the 2009 Second International Workshop on Computer Science and Engineering, Qingdao, China, 28–30 October 2009; Volume 2, pp. 13–17. [Google Scholar]
  11. Bunkhumpornpat, C.; Sinapiromsaran, K.; Lursinsap, C. Safe-level-smote: Safe-level-synthetic minority over-sampling technique for handling the class imbalanced problem. In Pacific-Asia Conference on Knowledge Discovery and data Mining; Springer: Berlin/Heidelberg, Germany, 2009; pp. 475–482. [Google Scholar]
  12. Maciejewski, T.; Stefanowski, J. Local neighbourhood extension of SMOTE for mining imbalanced data. In Proceedings of the 2011 IEEE Symposium on Computational Intelligence and Data Mining (CIDM), Paris, France, 11–15 April 2011; pp. 104–111. [Google Scholar]
  13. Ramentol, E.; Caballero, Y.; Bello, R.; Herrera, F. SMOTE-RSB*: A hybrid preprocessing approach based on oversampling and undersampling for high imbalanced data-sets using SMOTE and rough sets theory. Knowl. Inf. Syst. 2012, 33, 245–265. [Google Scholar] [CrossRef]
  14. Abdi, L.; Hashemi, S. To Combat Multi-Class Imbalanced Problems by Means of Over-Sampling Techniques. IEEE Trans. Knowl. Data Eng. 2016, 28, 238–251. [Google Scholar] [CrossRef]
  15. Torres, F.R.; Carrasco-Ochoa, J.A.; Martínez-Trinidad, J.F. SMOTE-D a deterministic version of SMOTE. In Mexican Conference on Pattern Recognition; Springer: Cham, Switzerland, 2016; pp. 177–188. [Google Scholar]
  16. Borowska, K.; Stepaniuk, J. Imbalanced data classification: A novel re-sampling approach combining versatile improved SMOTE and rough sets. In IFIP International Conference on Computer Information Systems and Industrial Management; Springer: Cham, Switzerland, 2016; pp. 31–42. [Google Scholar]
  17. Gong, C.; Gu, L. A Novel SMOTE-Based Classification Approach to Online Data Imbalance Problem. Math. Probl. Eng. 2016, 2016, 5685970. [Google Scholar] [CrossRef]
  18. Jiang, K.; Lu, J.; Xia, K. A novel algorithm for imbalance data classification based on genetic algorithm improved SMOTE. Arab. J. Sci. Eng. 2016, 41, 3255–3266. [Google Scholar] [CrossRef]
  19. Yun, J.; Ha, J.; Lee, J.S. Automatic determination of neighborhood size in SMOTE. In Proceedings of the 10th International Conference on Ubiquitous Information Management and Communication, Danang, Vietnam, 4–6 January 2016; p. 100. [Google Scholar]
  20. Pérez-Ortiz, M.; Gutiérrez, P.A.; Tino, P.; Hervás-Martínez, C. Oversampling the minority class in the feature space. IEEE Trans. Neural Netw. Learn. Syst. 2016, 27, 1947–1961. [Google Scholar] [CrossRef] [PubMed]
  21. Rivera, W.A.; Xanthopoulos, P. A priori synthetic over-sampling methods for increasing classification sensitivity in imbalanced data sets. Expert Syst. Appl. 2016, 66, 124–135. [Google Scholar] [CrossRef]
  22. Cervantes, J.; Garcia-Lamont, F.; Rodriguez, L.; López, A.; Castilla, J.R.; Trueba, A. PSO-based method for SVM classification on skewed data sets. Neurocomputing 2017, 228, 187–197. [Google Scholar] [CrossRef] [Green Version]
  23. Douzas, G.; Bacao, F. Self-Organizing Map Oversampling (SOMO) for imbalanced data set learning. Expert Syst. Appl. 2017, 82, 40–52. [Google Scholar] [CrossRef]
  24. Douzas, G.; Bacao, F.; Last, F. Improving imbalanced learning through a heuristic oversampling method based on k-means and SMOTE. Inf. Sci. 2018, 465, 1–20. [Google Scholar] [CrossRef] [Green Version]
  25. Nekooeimehr, I.; Lai-Yuen, S.K. Adaptive semi-unsupervised weighted oversampling (A-SUWO) for imbalanced datasets. Expert Syst. Appl. 2016, 46, 405–416. [Google Scholar] [CrossRef]
  26. Li, J.; Fong, S.; Wong, R.K.; Chu, V.W. Adaptive multi-objective swarm fusion for imbalanced data classification. Inf. Fusion 2018, 39, 1–24. [Google Scholar] [CrossRef]
  27. Gosain, A.; Sardana, S. Farthest SMOTE: A Modified SMOTE Approach. In Computational Intelligence in Data Mining; Springer: Singapore, 2019; pp. 309–320. [Google Scholar]
  28. Douzas, G.; Bacao, F. Geometric SMOTE: Effective oversampling for imbalanced learning through a geometric extension of SMOTE. arXiv 2017, arXiv:1709.07377. [Google Scholar]
  29. Maldonado, S.; López, J.; Vairetti, C. An alternative SMOTE oversampling strategy for high-dimensional datasets. Appl. Soft Comput. 2019, 76, 380–389. [Google Scholar] [CrossRef]
  30. Elyan, E.; Moreno-Garcia, C.F.; Jayne, C. CDSMOTE: Class decomposition and synthetic minority class oversampling technique for imbalanced-data classification. Neural Comput. Appl. 2021, 33, 2839–2851. [Google Scholar] [CrossRef]
  31. Zhang, Y.; Zuo, T.; Fang, L.; Li, J.; Xing, Z. An Improved MAHAKIL Oversampling Method for Imbalanced Dataset Classification. IEEE Access 2020, 9, 16030–16040. [Google Scholar] [CrossRef]
  32. Kaya, E.; Korkmaz, S.; Sahman, M.A.; Cinar, A.C. DEBOHID: A differential evolution based oversampling approach for highly imbalanced datasets. Expert Syst. Appl. 2021, 169, 114482. [Google Scholar] [CrossRef]
  33. Fajardo, V.A.; Findlay, D.; Jaiswal, C.; Yin, X.; Houmanfar, R.; Xie, H.; Liang, J.; She, X.; Emerson, D. On oversampling imbalanced data with deep conditional generative models. Expert Syst. Appl. 2021, 169, 114463. [Google Scholar] [CrossRef]
  34. Sadhukhan, P. Learning minority class prior to minority oversampling. In Proceedings of the 2019 International Joint Conference on Neural Networks (IJCNN), Budapest, Hungary, 14–19 July 2019; pp. 1–8. [Google Scholar]
  35. Zhang, H.; Wang, Z. A normal distribution-based over-sampling approach to imbalanced data classification. In International Conference on Advanced Data Mining and Applications; Springer: Berlin/Heidelberg, Germany, 2011; pp. 83–96. [Google Scholar]
  36. Rashu, R.I.; Haq, N.; Rahman, R.M. Data mining approaches to predict final grade by overcoming class imbalance problem. In Proceedings of the 2014 17th International Conference on Computer and Information Technology (ICCIT), Dhaka, Bangladesh, 22–23 December 2014; pp. 14–19. [Google Scholar]
  37. Bennin, K.E.; Keung, J.; Phannachitta, P.; Monden, A.; Mensah, S. Mahakil: Diversity based oversampling approach to alleviate the class imbalance issue in software defect prediction. IEEE Trans. Softw. Eng. 2017, 44, 534–550. [Google Scholar] [CrossRef]
  38. Gong, L.; Jiang, S.; Jiang, L. Tackling class imbalance problem in software defect prediction through cluster-based over-sampling with filtering. IEEE Access 2019, 7, 145725–145737. [Google Scholar] [CrossRef]
  39. Huda, S.; Liu, K.; Abdelrazek, M.; Ibrahim, A.; Alyahya, S.; Al-Dossari, H.; Ahmad, S. An ensemble oversampling model for class imbalance problem in software defect prediction. IEEE Access 2018, 6, 24184–24195. [Google Scholar] [CrossRef]
  40. García, V.; Sánchez, J.S.; Martín-Félez, R.; Mollineda, R.A. Surrounding neighborhood-based SMOTE for learning from imbalanced data sets. Prog. Artif. Intell. 2012, 1, 347–362. [Google Scholar] [CrossRef] [Green Version]
  41. Ma, L.; Fan, S. CURE-SMOTE algorithm and hybrid algorithm for feature selection and parameter optimization based on random forests. BMC Bioinform. 2017, 18, 169. [Google Scholar] [CrossRef] [Green Version]
  42. Guo, S.; Liu, Y.; Chen, R.; Sun, X.; Wang, X. Improved SMOTE algorithm to deal with imbalanced activity classes in smart homes. Neural Process. Lett. 2019, 50, 1503–1526. [Google Scholar] [CrossRef]
  43. Liang, X.; Jiang, A.; Li, T.; Xue, Y.; Wang, G. LR-SMOTE—An improved unbalanced data set oversampling based on K-means and SVM. Knowl.-Based Syst. 2020, 196, 105845. [Google Scholar] [CrossRef]
  44. Chen, B.; Xia, S.; Chen, Z.; Wang, B.; Wang, G. RSMOTE: A self-adaptive robust SMOTE for imbalanced problems with label noise. Inf. Sci. 2021, 553, 397–428. [Google Scholar] [CrossRef]
  45. de Carvalho, A.M.; Prati, R.C. DTO-SMOTE: Delaunay Tessellation Oversampling for Imbalanced Data Sets. Information 2020, 11, 557. [Google Scholar] [CrossRef]
  46. Wei, J.; Huang, H.; Yao, L.; Hu, Y.; Fan, Q.; Huang, D. NI-MWMOTE: An improving noise-immunity majority weighted minority oversampling technique for imbalanced classification problems. Expert Syst. Appl. 2020, 158, 113504. [Google Scholar] [CrossRef]
  47. Wang, X.; Yang, Y.; Chen, M.; Wang, Q.; Qin, Q.; Jiang, H.; Wang, H. AGNES-SMOTE: An Oversampling Algorithm Based on Hierarchical Clustering and Improved SMOTE. Sci. Program. 2020, 2020, 8837357. [Google Scholar] [CrossRef]
  48. Hemalatha, P.; Amalanathan, G.M. FG-SMOTE: Fuzzy-based Gaussian synthetic minority oversampling with deep belief networks classifier for skewed class distribution. Int. J. Intell. Comput. Cybern. 2021, 14, 270–287. [Google Scholar] [CrossRef]
  49. Mukherjee, M.; Khushi, M. SMOTE-ENC: A novel SMOTE-based method to generate synthetic data for nominal and continuous features. Appl. Syst. Innov. 2021, 4, 18. [Google Scholar] [CrossRef]
  50. Bej, S.; Davtyan, N.; Wolfien, M.; Nassar, M.; Wolkenhauer, O. Loras: An oversampling approach for imbalanced datasets. Mach. Learn. 2021, 110, 279–301. [Google Scholar] [CrossRef]
  51. Guan, H.; Zhang, Y.; Xian, M.; Cheng, H.; Tang, X. SMOTE-WENN: Solving class imbalance and small sample problems by oversampling and distance scaling. Appl. Intell. 2021, 51, 1394–1409. [Google Scholar] [CrossRef]
  52. Zheng, S.; Mogusu, E.; Veeranki, S.P.; Quinn, M.; Cao, Y. The relationship between the mean, median, and mode with grouped data. Commun. Stat.-Theory Methods 2017, 46, 4285–4295. [Google Scholar] [CrossRef]
  53. Hu, F.; Li, H.; Lou, H.; Dai, J. A parallel oversampling algorithm based on NRSBoundary-SMOTE. J. Inf. Comput. Sci. 2014, 11, 4655–4665. [Google Scholar] [CrossRef]
  54. Woods, K.S.; Doss, C.C.; Bowyer, K.W.; Solka, J.L.; Priebe, C.E.; Kegelmeyer, W.P., Jr. Comparative evaluation of pattern recognition techniques for detection of microcalcifications in mammography. Int. J. Pattern Recognit. Artif. Intell. 1993, 7, 1417–1436. [Google Scholar] [CrossRef]
  55. Alcalá-Fdez, J.; Fernández, A.; Luengo, J.; Derrac, J.; García, S.; Sánchez, L.; Herrera, F. Keel data-mining software tool: Data set repository, integration of algorithms and experimental analysis framework. J. Mult.-Valued Log. Soft Comput. 2011, 17, 255–287. [Google Scholar]
  56. Luengo, J.; Fernández, A.; García, S.; Herrera, F. Addressing data complexity for imbalanced data sets: Analysis of SMOTE-based oversampling and evolutionary undersampling. Soft Comput. 2011, 15, 1909–1936. [Google Scholar] [CrossRef]
  57. Dua, D.; Graff, C. UCI Machine Learning Repository. University of California, Irvine, School of Information and Computer Sciences. Available online: http://archive.ics.uci.edu/ml (accessed on 20 March 2022).
  58. Bhagat, R.C.; Patil, S.S. Enhanced SMOTE algorithm for classification of imbalanced big-data using random forest. In Proceedings of the 2015 IEEE International Advance Computing Conference (IACC), Banglore, India, 12–13 June 2015; pp. 403–408. [Google Scholar]
  59. Gutiérrez, P.D.; Lastra, M.; Benítez, J.M.; Herrera, F. SMOTE-GPU: Big data preprocessing on commodity hardware for imbalanced classification. Prog. Artif. Intell. 2017, 6, 347–354. [Google Scholar] [CrossRef]
  60. Fernández, A.; del Río, S.; Chawla, N.V.; Herrera, F. An insight into imbalanced big data classification: Outcomes and challenges. Complex Intell. Syst. 2017, 3, 105–120. [Google Scholar] [CrossRef] [Green Version]
  61. Leevy, J.L.; Khoshgoftaar, T.M.; Bauder, R.A.; Seliya, N. A survey on addressing high-class imbalance in big data. J. Big Data 2018, 5, 1–30. [Google Scholar] [CrossRef]
  62. Basgall, M.J.; Hasperué, W.; Naiouf, M.; Fernández, A.; Herrera, F. SMOTE-BD: An Exact and Scalable Oversampling Method for Imbalanced Classification in Big Data. In VI Jornadas de Cloud Computing & Big Data (JCC & BD) (La Plata, Argentina, 2018); Universidad Nacional de La Plata: La Plata, Argentina, 2018. [Google Scholar]
Figure 1. Synthetic objects (blue diamonds) generated by SMOTE (a), NDO (b), and Fast-SMOTE (c) over a 2-D projection of the dataset Mammography. Green circles represent objects of the majority class, and red crosses represent objects of the minority class.
Applsci 12 03424 g001
Figure 2. Synthetic objects (blue diamonds) generated by SMOTE (a), NDO (b), and Fast-SMOTE (c) over a 2-D projection of the dataset Glass. Green circles represent objects of the majority class, and red crosses represent objects of the minority class.
Applsci 12 03424 g002
Figure 3. Synthetic objects (blue diamonds) generated by SMOTE (a), NDO (b), and Fast-SMOTE (c) over a 2-D projection of the dataset Ecoli. Green circles represent objects of the majority class, and red crosses represent objects of the minority class.
Applsci 12 03424 g003
Figure 4. Runtime in seconds (y-axis) for oversampling different numbers of objects in the minority class (x-axis) by Fast-SMOTE (blue line) and NDO (red line).
Applsci 12 03424 g004
Figure 5. Runtime in seconds (y-axis) for oversampling a minority class with different number of features (x-axis) by Fast-SMOTE (blue line) and NDO (red line).
Applsci 12 03424 g005
Table 1. Mode values of x and y axis for for Figure 1, Figure 2 and Figure 3.
Features Mode
x y
mamography−0.550.06
glass0.420.73
ecoli0.320.79
Table 2. Datasets from the KEEL repository used in our experiments.
Dataset# Features# ObjectsIRDataset# Features# ObjectsIR
glass192141.82glass-0-4_vs_59929.22
ecoli-0_vs_172201.86ecoli-0-3-4-6_vs_572059.25
wisconsin96831.86ecoli-0-3-4-7_vs_5-672579.28
pima87681.87yeast-0-5-6-7-9_vs_485289.35
iris041502.00vowel0139889.98
glass092142.06ecoli-0-6-7_vs_5622010.00
yeast1814842.46glass-0-1-6_vs_2919210.29
haberman33062.78ecoli-0-1-4-7_vs_2-3-5-6733610.59
vehicle2188462.88led7digit-0-2-4-5-6-7-8-9_vs_1744310.97
vehicle1188462.90glass-0-6_vs_5910811.00
vehicle3188462.99ecoli-0-1_vs_5624011.00
glass-0-1-2-3_vs_4-5-692143.20glass-0-1-4-6_vs_2920511.06
vehicle0188463.25glass2921411.59
ecoli173363.36ecoli-0-1-4-7_vs_5-6633212.28
new-thyroid152155.14cleveland-0_vs_41317712.62
new-thyroid252155.14ecoli-0-1-4-6_vs_5628013.00
ecoli273365.46shuttle-c0-vs-c49182913.87
segment01923086.02yeast-1_vs_7745914.30
glass692146.38glass4921415.47
yeast3814848.10ecoli4733615.80
ecoli373368.60page-blocks-1-3_vs_41047215.86
page-blocks01054728.79abalone9-18873116.40
ecoli-0-3-4_vs_572009.00glass-0-1-6_vs_5918419.44
yeast-2_vs_485149.08shuttle-c2-vs-c4912920.50
ecoli-0-6-7_vs_3-572229.09yeast-1-4-5-8_vs_7869322.10
ecoli-0-2-3-4_vs_572029.10glass5921422.78
glass-0-1-5_vs_291729.12yeast-2_vs_8848223.10
yeast-0-3-5-9_vs_7-885069.12yeast48148428.10
yeast-0-2-5-7-9_vs_3-6-8810049.14yeast-1-2-8-9_vs_7894730.57
yeast-0-2-5-6_vs_3-7-8-9810049.14yeast58148432.73
ecoli-0-4-6_vs_562039.15ecoli-0-1-3-7_vs_2-6728139.14
ecoli-0-1_vs_2-3-572449.17yeast68148441.40
ecoli-0-2-6-7_vs_3-572249.18abalone1984174129.44
Table 3. Average AUC results of CART, KNN and Naive Bayes classifiers for the 66 datasets from the KEEL repository.
ClassifierOversampling Method
SMOTEBorderlineSafeLevelLNENDOS-RSB*K-Means-SFarthest-SG-SMOTES-SFFast-SMOTE
CART0.8250.8070.8080.8140.8170.8240.8020.8190.7980.8210.801
KNN0.8570.8420.8220.8360.8530.8570.7890.8400.8000.8540.822
Naïve Bayes0.8080.7750.7760.8020.7860.8070.7550.8010.7310.8080.772
Table 4. Runtime in seconds spent by the oversampling methods revised in Section 2 for oversampling all datasets from Table 2.
DatasetOversampling Method
SMOTEBorderlineSafeLevelLNENDOS-RSB*K-Means-SFarthest-SG-SMOTES-SFFast-SMOTE
glass-0-4_vs_50.00270.00060.00560.00400.00020.00450.00350.00250.00370.00030.0001
glass-0-6_vs_50.00330.00070.00690.00480.00030.00540.00400.00310.00440.00020.0001
shuttle-c2-vs-c40.00410.00040.00940.00580.00040.00670.00520.00400.00620.00030.0002
iris00.00170.00160.00390.00380.00020.00300.00280.00170.00240.00110.0001
glass-0-1-5_vs_20.00520.00110.01130.00760.00040.00830.00680.00490.00700.00040.0002
cleveland-0_vs_40.00540.00090.01240.00810.00050.00960.00780.00510.00720.00040.0002
glass-0-1-6_vs_50.00590.00070.01360.00830.00050.01010.00690.00570.00800.00040.0002
glass-0-1-6_vs_20.00560.00100.01320.00840.00050.01020.00700.00570.00760.00050.0002
ecoli-0-3-4_vs_50.00620.00090.01320.00830.00050.00910.00860.00550.00760.00050.0002
ecoli-0-2-3-4_vs_50.00620.00090.01360.00920.00050.00970.00880.00550.00820.00050.0002
ecoli-0-4-6_vs_50.00600.00090.01320.00910.00050.00910.00790.00550.00800.00050.0002
ecoli-0-3-4-6_vs_50.00610.00090.01360.00910.00050.00930.00810.00570.00820.00050.0002
glass-0-1-4-6_vs_20.00660.00120.01440.00920.00050.01070.00820.00620.00880.00040.0002
glass10.00230.00320.00520.00620.00020.00610.00350.00220.00310.00260.0001
glass20.00650.00100.01520.00990.00050.01130.00870.00650.00870.00050.0003
glass00.00260.00310.00590.00920.00020.00680.00380.00260.00360.00240.0001
glass40.00660.00080.01560.01010.00060.01170.00870.00650.00900.00050.0003
glass-0-1-2-3_vs_4-5-60.00410.00220.00930.00900.00030.00890.00510.00400.00560.00140.0002
glass50.00700.00060.01610.01000.00060.01250.00850.00670.00940.00040.0003
glass60.00550.00090.01250.00920.00050.00950.00670.00540.00760.00070.0002
new-thyroid10.00510.00170.01160.00910.00040.00740.00630.00500.00690.00080.0002
newthyroid20.00510.00160.01140.00910.00040.00730.00660.00500.00680.00080.0002
ecoli-0_vs_10.01090.00280.00690.01760.00020.00580.00470.00240.00490.00260.0001
ecoli-0-6-7_vs_50.00660.00100.01490.00900.00050.00980.00840.00610.00870.00050.0003
ecoli-0-6-7_vs_3-50.00660.00110.01500.00980.00050.01020.00850.00610.00880.00050.0003
ecoli-0-2-6-7_vs_3-50.00660.00120.01530.00990.00050.01050.00890.00630.00930.00060.0003
ecoli-0-1_vs_50.00770.00100.01700.01000.00060.01120.00930.00690.00940.00050.0003
ecoli-0-1_vs_2-3-50.00730.00120.01720.01110.00060.01130.01000.00680.00960.00060.0003
ecoli-0-3-4-7_vs_5-60.00820.00140.01770.01170.00060.01260.01040.00710.00990.00060.0003
ecoli-0-1-4-6_vs_50.00880.00100.02090.01180.00070.01370.01220.00820.01130.00060.0003
ecoli-0-1-3-7_vs_2-60.00960.00060.02240.01320.00080.01520.01110.00920.01270.00050.0004
haberman0.00520.00420.01240.00990.00040.01860.00590.00500.00690.00270.0002
ecoli-0-1-4-7_vs_5-60.01040.00130.02570.01510.00080.01660.01390.00960.01370.00070.0004
ecoli40.01050.00120.02690.01500.00090.01790.01210.01010.01410.00070.0004
ecoli10.00720.00350.01700.01480.00050.01180.00790.00740.00960.00280.0003
ecoli-0-1-4-7_vs_2-3-5-60.01050.00150.02550.01470.00080.01720.01390.00960.01360.00080.0004
ecoli20.00860.00180.02070.01430.00070.01600.00960.00830.01150.00170.0003
ecoli30.00920.00210.02350.01470.00080.01640.01070.00920.01270.00100.0004
led7digit-0-2-4-5-6-7-8-9_vs_10.01380.00190.03690.02150.001133.19450.01620.01290.01890.00120.0005
yeast-1_vs_70.01420.00210.04240.02250.00120.02940.01710.01400.01920.00110.0006
page-blocks-1-3_vs_40.01530.00200.04430.02440.00130.03860.01710.01480.02030.00120.0007
yeast-2_vs_80.01670.00160.04710.02440.00130.03690.01990.01550.02180.00110.0007
yeast-0-3-5-9_vs_7-80.01540.00320.04310.02530.00120.03390.01800.01420.01970.00180.0006
yeast-2_vs_40.01550.00300.04510.02540.00130.03580.01960.01460.02260.00180.0006
yeast-0-5-6-7-9_vs_40.01590.00350.04710.02550.00130.03520.01780.01510.02250.00190.0006
wisconsin0.00790.01190.03060.02710.000610.97960.00950.00770.01060.02410.0003
yeast-1-4-5-8_vs_70.02350.00320.09010.04280.00200.06300.03050.02270.03120.00170.0010
abalone9-180.02430.00370.09290.04360.00210.07000.02670.02330.03200.00210.0010
pima0.00910.01700.03460.03380.00070.03320.01070.00870.01180.02890.0003
vehicle20.01750.01670.07450.05070.00160.08770.02050.01750.02320.02360.0008
vehicle10.01780.01840.07500.05010.00160.08770.01850.01740.02340.02300.0008
vehicle30.01810.01900.07670.04830.00160.08980.02020.01790.02380.02210.0008
vehicle00.01920.01430.08230.06250.00170.09120.02210.01880.02540.01990.0008
yeast-1-2-8-9_vs_70.03520.00390.14940.06180.00300.12030.04130.03240.04440.00250.0015
vowel00.03200.00760.14540.06560.00320.14410.03440.03100.04300.00610.0016
yeast-0-2-5-7-9_vs_3-6-80.03160.00700.14070.06540.00270.11010.03630.03000.04210.00590.0013
yeast-0-2-5-6_vs_3-7-8-90.03180.00740.14270.06770.00270.10920.03650.03000.04110.00590.0013
yeast10.02650.03470.13420.08960.00200.12770.02920.02600.03420.07470.0010
yeast40.05670.00800.29140.10460.00540.30840.07420.05230.06990.00520.0027
yeast50.05620.00710.29210.10670.00540.31000.06980.05250.07060.00500.0027
yeast30.04560.01360.24710.10470.00430.23840.05080.04480.05960.01410.0021
yeast60.05660.00620.30810.10690.00560.31730.08030.05280.07110.00480.0028
shuttle-c0-vs-c40.06340.00830.40220.14280.00680.46150.00180.06220.08640.01190.0033
segment00.08210.04660.59920.31410.01051.16180.08940.08070.10450.05970.0052
abalone190.16950.02551.87560.48170.027019.31150.18160.16790.21920.02620.0134
page-blocks00.22060.10402.59870.76280.034428.25460.19100.21770.27920.15860.0171
Sum1.39550.45538.73563.38230.152296.28351.50211.33910.53660.56960.0754
Table 5. Large datasets from the UCI repository used in our experiments.
Dataset# Features# ObjectsIR
Default of credit card clients2430,0003.52
Online News Popularity6139,7973.90
Statlog (Shuttle)958,0003.67
Skin segmentation3245,0573.81
Buzz in social media (Twitter)78583,2503.80
Table 6. AUC results of Cart classifier for one of the 5 datasets from the UCI repository.
DatasetNDOFast-SMOTE
Default of credit card clients0.6200.623
Online News Popularity0.5510.551
Statlog (Shuttle)0.5490.551
Skin segmentation0.9900.999
Buzz in social media (Twitter)0.9220.921
Table 7. Runtime in seconds spent by NDO and Fast-SMOTE on artificial datasets from Table 5.
DatasetOversampling Method
NDOFast-SMOTE
Default of credit card clients0.810.40
Online News Popularity4.941.95
Statlog (Shuttle)1.610.62
Skin segmentation16.475.80
Buzz in social media (Twitter)8771.892860.40
Sum8795.172869.17
Publisher’s Note: MDPI stays neutral with regard to jurisdictional claims in published maps and institutional affiliations.

