1. Introduction
In recent years, aluminum alloy and composite materials, which have been widely used in fields of aviation and aerospace owing to their low density, high modulus, good performances in heat insulation, and thermal protection, have become an important industrial material in the national defense industry [
1,
2,
3,
4]. For example, the cephalic cones and skins of missiles, the nose cone, wings, and tails of space shuttles, and other key components are all made of new aluminum alloy and carbon fiber-reinforced composite materials [
5,
6]. In the fields of aviation and aerospace, the external environment of spacecraft is extremely complex, such as high-speed collision, X-ray irradiation, and other dynamic load environments [
7,
8]. Under the pulsed X-ray irradiation, a large amount of ray energy is rapidly deposited on the surface of the material, which decreases rapidly from the outside to the inside, thus leading to a large temperature and pressure gradient in the material. With the extensive applications of the materials in missiles or spacecraft, it is increasingly important to understand the propagation rules of thermal shock waves caused by X-ray pulse irradiation in these materials and correctly evaluate their protection ability against thermal shock waves [
9,
10]. When the target material is irradiated by a high-current pulsed electron beam, a large amount of energy will be deposited on its surface, which makes the material in a state of high temperature and high pressure and thus produces various thermodynamic effects [
11]. This is basically the same as the irradiation effect of X-ray on materials and structures, and also one of the equivalent methods to study pulsed X-ray.
As early as the 1860s, some scholars carried out theoretical research on the thermo-mechanical effects generated in the materials under X-ray irradiation. The first method they used was to calculate the vaporization of phase change material and consider it as an indirect external load applied on the remaining solid to study the thermal shock. The pulse width of the X-ray and the vaporization phase transition of the material usually occur at the order of 0.1 μs, while the recoil impulse compression loading of the vaporized material and the generation and propagation of corresponding thermal shock waves often last microseconds. The time of energy deposition phase transition is negligible relative to the time of dynamic loading and response, so it is very reasonable to use the above methods to decouple complex problems. After decades of research, related authorities have summed up a set of theoretical calculation formulas for X-ray thermo-mechanical effects and developed corresponding numerical simulation programs. Longley et al. [
12] theoretically solved the thermo-mechanical effects of X-ray and used the Whitener formula to calculate the energy deposition and impulse formed in the materials under X-ray irradiation. ZEBRA, RIP, PETROS [
13], and other numerical calculation programs [
14] were successively developed to simulate and calculate energy deposition, material response, and structural response formed in materials under beam irradiation, respectively. Wang Yi et al. [
15] used the Monte Carlo method to conduct the imaging simulation study on the measurement of the X-ray energy spectrum generated by the bombardment of a high-energy high-current electron beam on a high Z target. Huang Xia et al. [
16] numerically simulated the plane strain thermo-mechanical effect of the X-ray irradiation cylinder, strictly calculated the energy deposition in the quadrilateral grid through the integral method, and obtained relatively accurate energy deposition results. Sun J F [
17] pointed out that when a high-current pulsed electron beam was used to indirectly simulate thermo-mechanical effects generated in materials under X-ray irradiation of nuclear detonation, the relevant energy deposition profiles in materials were usually taken as a key indicator to judge their equivalence.
The second method was to calculate the pressure, momentum, and expansion velocity directly by using the PUFF state equation for the phase transition and recoil impulse produced by irradiation, and to use the conservation equation to calculate the shock wave propagation in solids and the surface vaporization. Tang W H et al. [
18] simulated the X-ray thermal shock problem in Ly-12 by the one-dimensional difference method. Zhou N [
19], Qiao D J [
20], and Zhao G M [
21] respectively adopted the finite difference method to simulate the thermal shock under the two-dimensional plane strain of the oval, spherical, and conical head and cylindrical shell. Huang X [
22] and Zhang K [
23] carried out the two-dimensional and three-dimensional numerical analysis of the material response by the finite element method. Niu J C [
24] used SPH to calculate the X-ray thermal shock in multilayer materials.
The pulsed electron beam generated by the electron accelerator has a multi-energy composite spectrum structure. This paper mainly focuses on improving the equivalence of the multi-energy composite spectrum electron beam in simulating the thermo-mechanical effect of X-ray. Therefore, this paper has certain guidance and reference significance for domestic laboratories to simulate thermo-mechanical effects of nuclear explosion X-ray by electron beam accelerator.
2. Experimental Procedure
2.1. Introduction of Flash 2 High-Current Pulsed Electron Beam Accelerator
The flash 2 accelerator (REB), which was put into operation in 1990, is the only facility in China that can simulate the thermodynamic effect of intense pulsed X-ray (as shown in
Figure 1). The generated electron energy is 0.9–1.47 MeV, the electron beam current is 720–1000 kA, the beam spot diameter can reach 100–180 mm, and the beam energy injection amount can reach 300–500 J/cm
2, as well, beam current uniformity is 85%. A large number of materials with different types and properties have been experimentally studied in terms of thermal shock wave effect and the deformation and strain of structural parts under the conditions of beam energy injection rate of 100–420 J/cm
2 and beam spot diameter of 100–180 mm, and the results have been applied in practice.
The injection amount of electron beam energy can be calculated by the following formula:
where
k is the electron beam transmission efficiency, which is 0.7 in this test.
Et is the total beam energy of each shot;
r is the radius of the beam spot. The PVDF method with one shot and one target is used in the experiment.
2.2. Means of Measurement
In 1969, Kawai discovered that PVDF (polyvinylidene fluoride), a kind of semi-crystalline polymer, had strong piezoelectric properties after being stretched and polarized.
The test principle of a PVDF piezoelectric film sensor can be expressed as when PVDF receives electron beam impact, its surface will generate charge
Q, and the function between
P and
Q in the pressure range of 0–20 GPa (or above) is represented by:
where
K =
K (
P) is the dynamic piezoelectric coefficient;
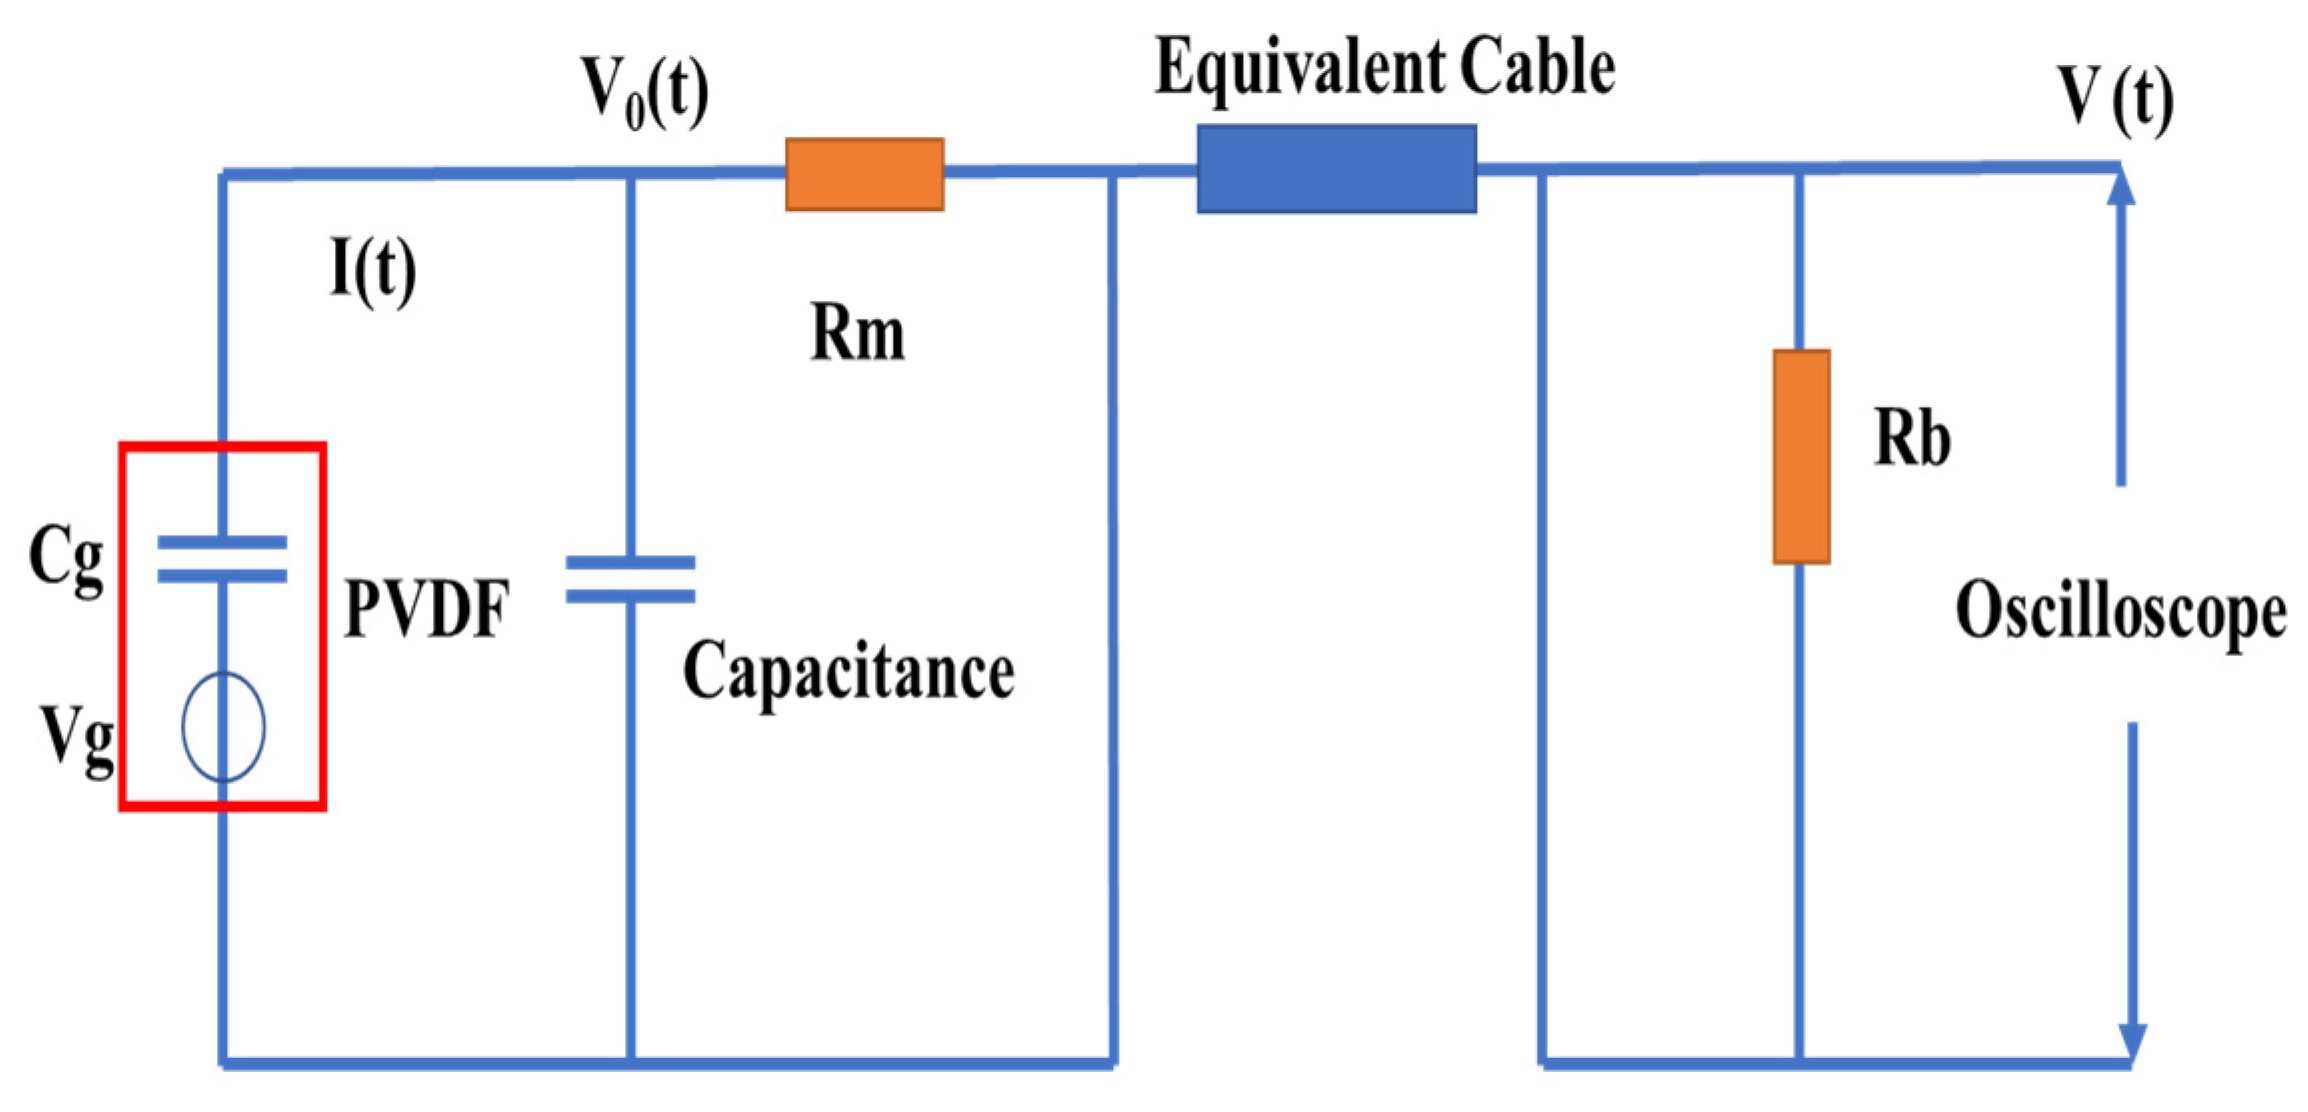
A is the area of the sensitive part of the piezoelectric film sensor. The test circuit of the PVDF piezoelectric film sensor adopts the charge mode (as shown in
Figure 1). The PVDF sensor is equivalent to the series connection of a voltage source
Vg and a capacitor
Cg. In the charge mode, the discharge is carried out by the capacitor
capacitance in series (for a short time).
Rm is the matching resistance (
Rm = 50 Ω or
Rm +
R = 50 Ω), which matches the cable with a characteristic impedance of 50 Ω to avoid waveform oscillation during long cable transmission. The oscilloscope input resistance is set as
Rb = 1 MΩ, then
Rb >
Rm,
Rb >
R,
C >
Cg, then:
Equations (2) and (3) give the theoretical measurement and calculation method of the PVDF sensor. By integration of
V(
t) (current mode) or direct calculation (charge mode), the corresponding pressure
P(
t) can be calculated.
Figure 2 shows the schematic diagram of the PVDF charge mode circuit design, and
Figure 3 shows the photos of the PVDF sensor and sample before and after experiment No. 21040. In
Figure 2, the red frame is the PVDF equivalent circuit, such as capacitance and voltage, and the orange squares are resistance, and the blue square is equivalent cable.
3. Energy Deposition of Electrons in Materials
When electrons are transported in a substance, they interact with the substance through a series of different paths [
12,
25] to deposit energy in the material. When a substance absorbs a large amount of sedimentary energy in a short period of time, it will produce extremely complex thermo-mechanical phenomena, such as high temperature and high pressure, solid-state, liquid-state, and gaseous-state phase changes, thermal shock wave propagation, and spallation damage [
26]. Calculating the energy deposition of electrons in materials is the basis and premise of studying the thermo-mechanical effects. Electrons lose energy and deposit in materials through interactions with electrons and nuclei in substances in the forms including (1) inelastic collisions with electrons in atoms; (2) inelastic collision with the nucleus; (3) elastic collision with electrons in atoms; (4) elastic collision with the nucleus. Inelastic collision is the main mechanism of the energy loss of electrons.
In this paper, the analytical method and the Monte Carlo method for calculating the energy deposition of electrons in materials are presented.
3.1. Introduction of Experimental Conditions
When the low-energy electron is vertically incident into the target material, its penetration
R0 in the target is expressed by the empirical Formula (1). It is assumed that the initial incident electron energy is
E0 and its energy attenuation is
E(r) at
r away from the target surface (the corresponding mass thickness is
ρr) [
27]. Then the distance that the electron with energy
E(r) continues to travel in the target is shown by:
So, the following formula can be obtained:
where the unit of
E is MeV, and
,
,
, and
are fitting constants, with values of
= 0.963,
= 0.315,
= 1.250, and
= 0.112, respectively.
In order to analytically calculate the energy deposition of electrons in the material, the transmission coefficient of electrons in the target material is also needed, which is denoted by
and given by Formula (3). On the basis of a large number of experimental data, Subba [
28] summed up a universal formula for the transmission coefficient of electrons’ vertical incidence on a flat plate target material under low energy relativity theory.
where
is the electron penetration depth;
is the distance from a point in the target to the incident surface.
ni represents the weight percentage of the component.
In a thin layer
ρd
r at a position with a mass thickness of
ρr from inside the target to the target surface, if dr is assumed to be small enough and the backscattering coefficients of the front and back surfaces to compensate each other, the energy deposition of electrons per unit mass thickness in d
r is
is the surface reflection correction coefficient.
3.2. The Monte Carlo Calculation Method of Energy Deposition
The Monte Carlo method can be used to simulate various interactions of electrons, the positions of the interactions, and the energy and direction after these interactions. In the calculation, considering that the electron has a small mass and a unit charge and collides with the material atom many times, it is impossible to simulate every collision because of a staggering number of calculations. Therefore, we adopt the method of condensing history proposed by Berger [
29], that is, combine many random collisions into one collision for calculation, which is called multi-scattering small collisions, and assume that the electron energy attenuation in each multi-scattering small collision is continuous and uniform (i.e., continuous slowing-down approximation). On this basis, the interaction process of electrons in matters is simulated by the single-energy large collision which generates secondary electrons. Single large collision and multi-scattering small collision are divided according to the scattering size of electron energy, and cutoff energy when tracking electrons. Thus, a single large collision is a collision whose energy loss is greater than the cutoff energy, and the secondary electrons produced by the collision will continue to be tracked. The small collisions include collisions whose energy-generating secondary electrons are less than those for the cutoff energy and collisions that can excite atoms. Under the continuous slowing-down approximation, the resultant energy losses are considered to be continuously and evenly distributed in the material covered by the trajectory of the electrons between two small collisions [
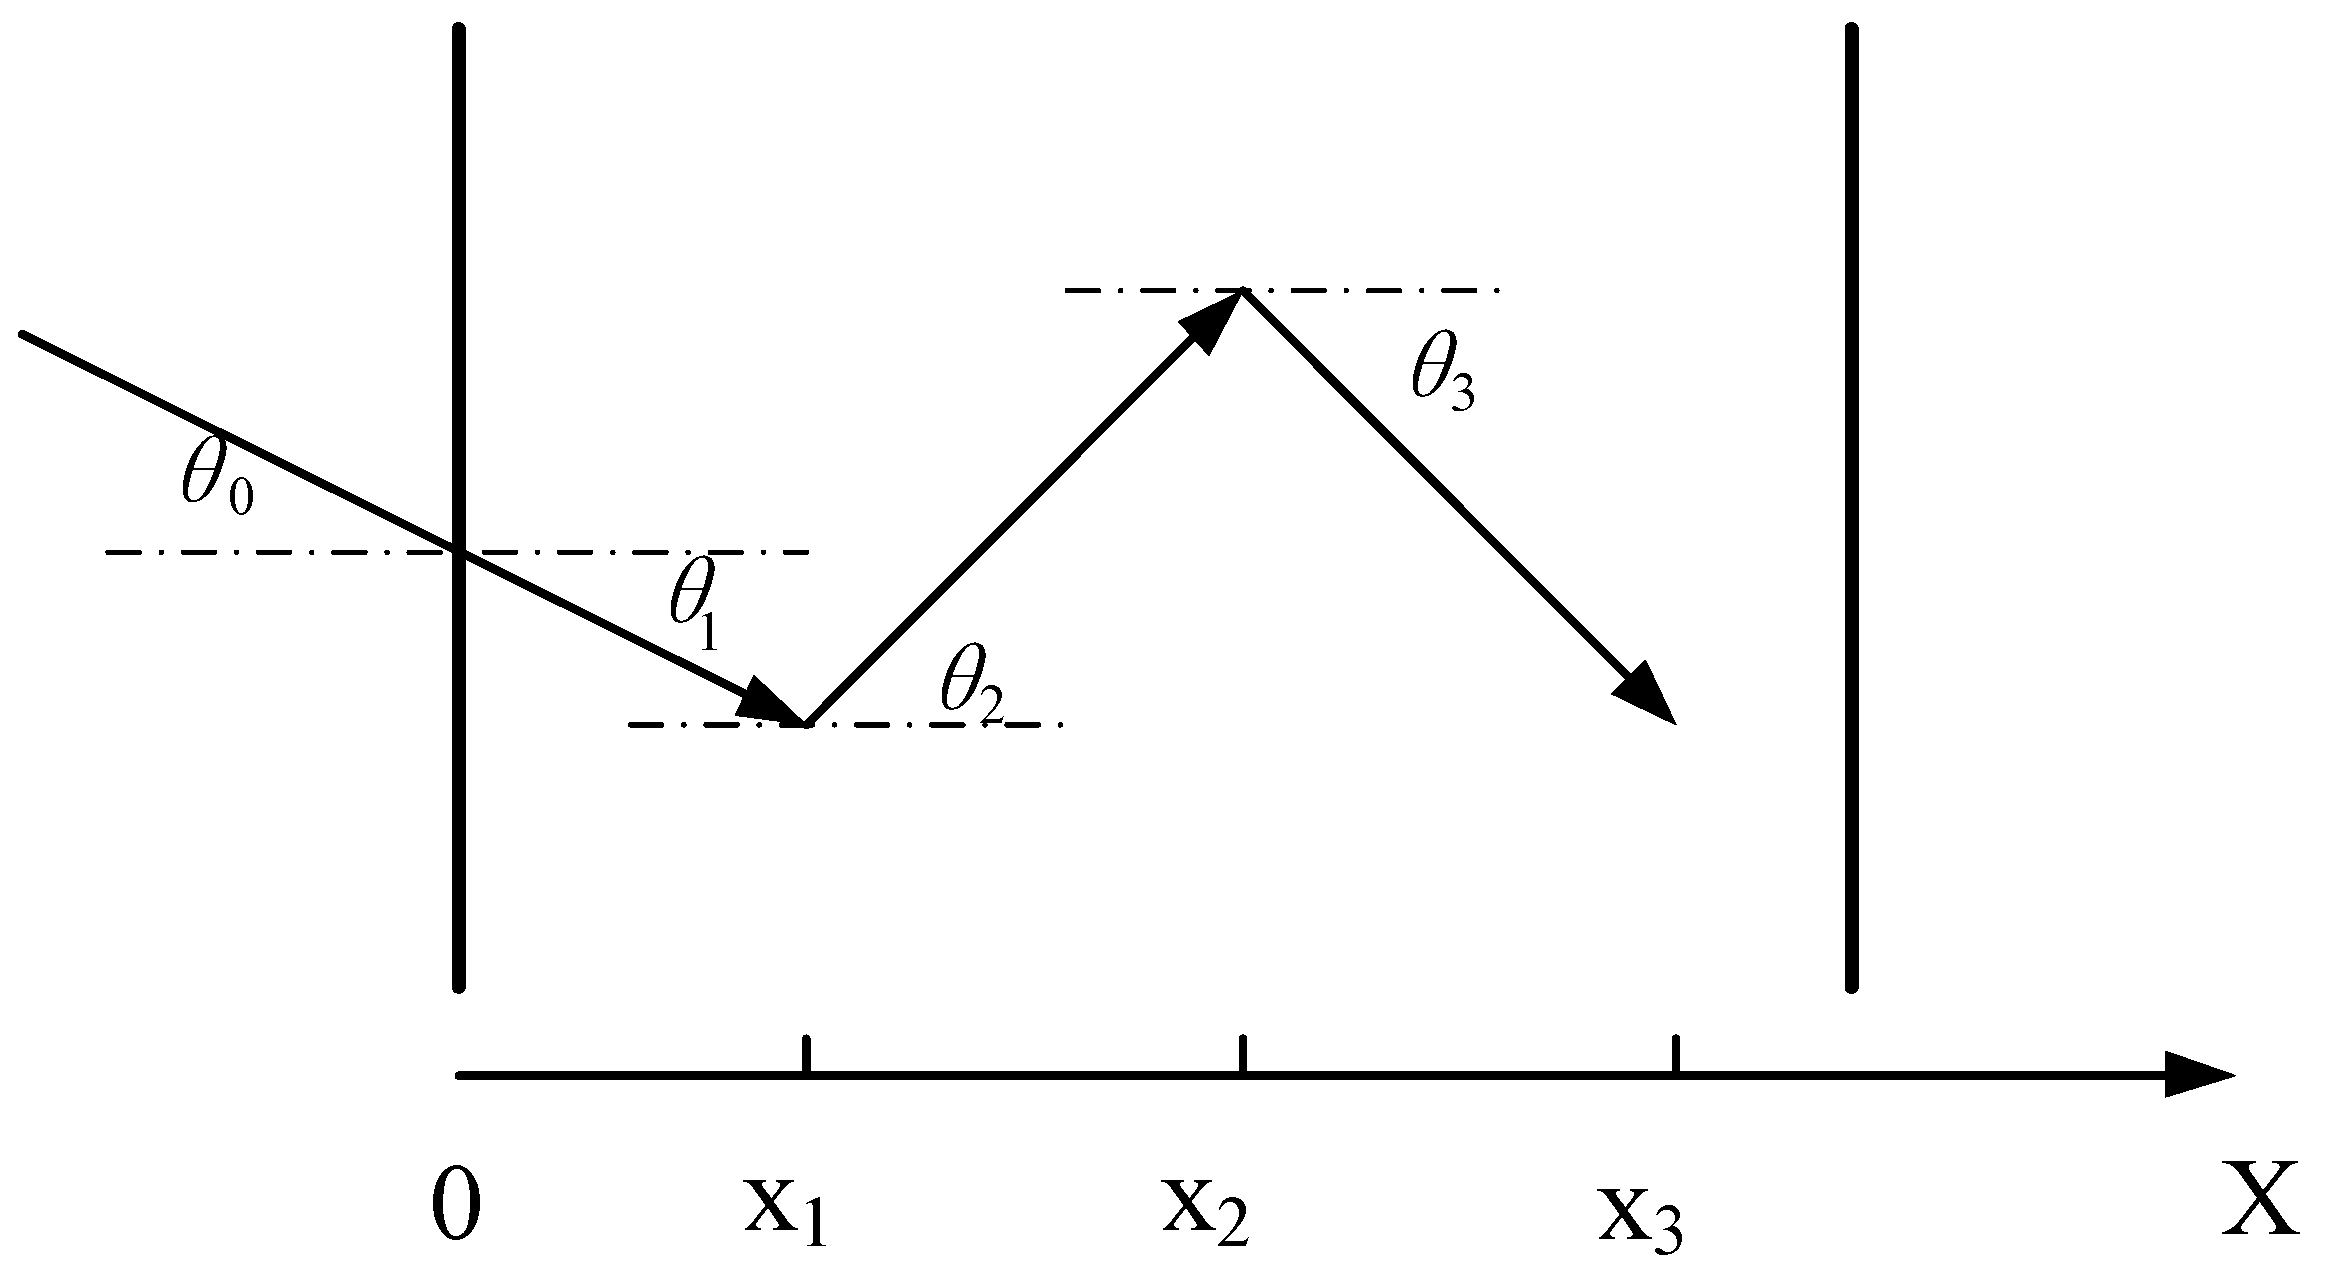
30]. Therefore, a flat target of finite thickness and infinite width is taken as the calculated target, without considering the impact of edge effects, as shown in
Figure 4, which shows the geometric model of electron incidence in the material.
1. Initial conditions
(1) Initial coordinates of electrons, ;
(2) Initial kinetic energy, ;
(3) Initial incident angle, .
2. Using the direct sampling theorem, the path s between two adjacent large collisions is determined by the following equation:
where
is the random number;
is the material density;
;
is the minimum truncation value of the selected
.
A single large collision ionizes the target material, producing secondary electrons. The energy lost by the electrons is transferred to the secondary electrons and there is no energy deposition in the material. Zhou Nan et al. fitted an analytical calculation formula for the energy share obtained by secondary electrons according to the literature [
19].
where
is the kinetic energy of electrons with
as the unit.
3. The process between the two adjacent large collisions is composed of a series of statistical collisions. The energy logarithmic partition method is adopted to divide the step size of electrons [
31], which can be expressed by the formula:
In the formula, the constant
m is selected as required and is generally set at 16. Only considering collision loss and radiation loss, the energy loss of incident electrons in unit mass thickness is:
is the collision loss and is the radiation loss.
From the nth collision to the (
n + 1)th collision, the coordinate change is determined by the following equation:
where
is the
n + 1 step range of electrons; ω is the determined scattering angle sampling of the
n + 1 step; the azimuth angle χ is evenly distributed between [0, 2π].
4. Assume that the energy deposited by each incident electron on the interval is ΔEi, and the energy deposited by N electrons on this interval is:
This method of calculating energy deposition causes an error, which, however, gets smaller and smaller as the incident electrons increase.
3.3. Calculation Results of Energy Deposition of Multi-Energy Electron Beam
Taking the parameters of the actual relativistic electron beam (REB) as the analog input source, the actual multi-energy-spectrum electron beam current, voltage, and energy spectrum waveforms are presented in
Figure 5,
Figure 6 and
Figure 7, and the corresponding analytical and Monte Carlo calculations are carried out.
Assume that the intense pulsed electron beam radiates to the target plate (aluminum or carbon phenolic), the radiation time is τ, and the initial pressure pulse peak value is after radiation.
Hugoniot parameters of aluminum: , , density ;
Hugoniot parameters of carbon phenolic: , , density .
Figure 8 shows the calculation results of electron energy deposition by using the analytical method and the Monte Carlo method. In the figure, the unit of abscissa × is cm, indicating the mass thickness, and the ordinate represents the deposited energy per unit mass thickness, which is different from the previous X-ray energy deposition method (expressed by a percentage), but the two can replace each other. For aluminum materials, the peak value of energy deposition calculated by the analytical method is lower than that calculated by the Monte Carlo method, with its position lagging behind. After the peak, the results of the two methods show the same downward trend. For carbon phenolic (C/PH) materials (as shown in
Figure 8), the results calculated by the two methods are quite different. Compared with the experimental results, the calculated results of the Monte Carlo method are more real and reliable.
The energy deposition of carbon phenolics is calculated by the Monte Carlo method under single-energy electron incidence.
Figure 9a shows the variation of energy deposition profile at 0.6 MeV,
Figure 9b shows the variation of energy deposition profile at 0°.
Through calculation and analysis, it can be concluded that energy deposition has the following characteristics:
(1) The electrons with the same incident energy in carbon phenolic obviously have a deeper energy deposition than those in aluminum. The electrons with an initial incident energy of 1.0 MeV were deposited at a depth of about 1.9 mm in aluminum and peaked at 0.5 mm, while the electron deposited at a depth of 3.4 mm in carbolic phenol and peaked at 1.5 mm. At present, experiments on the thermodynamic effect of the electron beam are mainly carried out in the REB accelerator, which has a maximum electron energy of about 1.0 MeV. If thermal shock generation and propagation experiments are carried out on this machine, the thickness of the target should be greater than 3.5 mm, to avoid the impact of incident electrons on the sensor.
(2) With the decrease of incident electron energy, the peak position and the depth of electron energy deposition gradually decrease, but the deposition peak becomes larger.
(3) With the increase of the incident angle, the peak position of energy deposition gradually moves to the radiation surface. When the incident angle is 75°, for the incident electron of 0.6 MeV, its energy deposition peak occurs on the incident surface, which is similar to the deposition profile of the X-ray.
3.4. Electron Beam Radiation Energy Deposition in Multilayer Structures
3.4.1. Calculation Model and Parameters
The calculation model and material parameters are shown in
Figure 10 and
Table 1: material 1+ material 2 + the stacked combination of 7-layer material 3 and material 4 + material 2.
3.4.2. Electron Beam Radiation Energy Deposition
The Monte Carlo method is used to calculate the energy deposition rate of a multi-energy-spectrum electron beam in a multilayer structure under different energies and incident modes (as shown in
Figure 11). η is the energy deposition rates, and x is the multilayer thickness, and
E0 is energy electrons. Incidence is divided into the normal incidence and oblique incidence, the latter of which has an incidence angle of 40°, with the total energy deposition rate shown in
Table 2, which shows the escape energy is the sum of the reflected energy of the front surface and the penetrating energy of the rear surface.
It can be seen that for the same incident energy, the total energy deposition rate of oblique incident electrons of no more than 0.5 MeV is lower than that of the normal incident electrons, while the total energy deposition rate of the electrons of larger than 0.5 MeV is higher than that of the normal incident electrons. The energy deposition rate of oblique incident electrons in each layer is higher than that of normal incident electrons near the light-facing surface. With the continuous penetration of electrons, the electron energy decreases, and the energy deposition rate of oblique incidence electrons is lower than that of normal incidence electrons.
For the same incident angle, the total energy deposition rate of electrons with different incident energies is different in the multilayer separation structure. The higher the electron energy, the lower the energy deposition rate in the multilayer structure. The energy deposition rate of the lower-energy electrons in the light-facing surface is higher than that of the higher-energy electrons, while the energy deposition rate in the layer far away from the illuminated surface is lower than that of the higher-energy electrons.
4. Numerical Simulation of Radiant Thermal Shock Wave of Electron Beam
4.1. Calculation Conditions
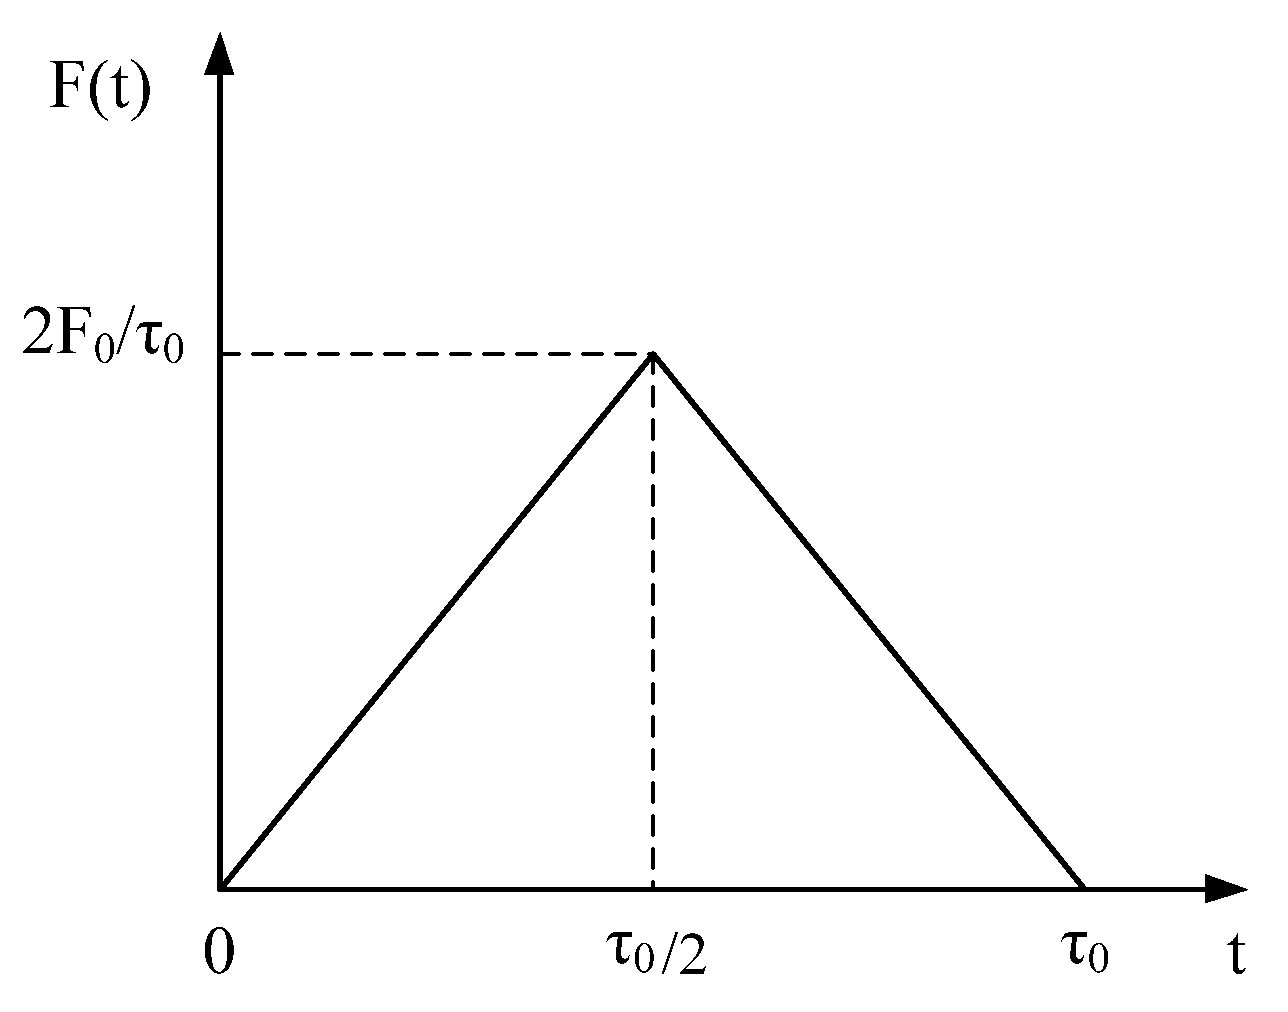
The target material is carbon phenolic. The intensity of the pulsed electron beam is triangularly distributed (see
Figure 12), the pulse width is around τ
0, and the average energy of the electron beam is 0.6 MeV. The incident intensity of the electron beam is:
where
is the energy density of incident electron beam, in unit J/cm
2. If the energy deposition of single-energy electrons in the target is denoted as
, and the dimension is cm
2/g, the specific energy deposition rate of the electron beam with an intensity of
is
F0.
Figure 12.
Energy deposition rates of different energy electrons in multilayer structures.
Figure 12.
Energy deposition rates of different energy electrons in multilayer structures.
The energy conservation equation is:
The thermal shock wave of a given material can be obtained by substituting into the energy conservation equation.
4.2. Discussion of Calculation Results
Table 3 shows the material parameters of carbon phenolic used in the calculation [
32]. The strength of the thermal shock wave surpasses the strength of the material (C/P), so the material is regarded as an ideal plastic body in the calculation. The energy deposition profile in carbon phenolic is shown in
Figure 13 and
Figure 14.
Figure 15 shows the spatial waveforms of thermal shock waves generated at different times under electron beam radiation in carbon phenolic with an average energy of 1.1 MeV and an incident energy density of
F0 = 420 J/cm
2.
Figure 11 shows the calculated results of stress peaks in carbon phenolic target plates under different energy radiation.
Figure 12 shows the calculation results of stress peaks in carbon phenolic under the same incident energy of 1.1 MeV and different energy densities.
Through calculation, it can be seen that the electron beam thermal shock wave in carbon phenolic has the following characteristics:
(1) The peak value of radiant thermal shock wave is not at the radiation surface, but near the peak value of energy deposition.
(2) The maximum thermal shock intensity occurs during the radiation process rather than at the end of the radiation.
(3) Under the condition of constant energy density, the higher the energy of the electron beam, the higher the intensity of the thermal shock wave; when the energy of the electron beam is constant, the higher the energy density is, the stronger the thermal shock wave is. The intensity of thermal shock waves in carbon phenolics is the GPa order of magnitude under electron beam radiation with an energy density of 210–840 J/cm2. The thermal shock intensity is 0.67–2.51 GPa at 5 mm behind the radiated surface.
5. Comparison and Discussion of Experimental and Numerical Simulation Results
Since the PVDF sensor is placed on the back of the target plate, the stress measured by PVDF actually represents the transmitted shock wave stress after transmission and reflection action from the target to the PVDF interface. To obtain the peak stress of the shock wave in the target, that is, the incident wave stress, calculations must be done according to the transmission and reflection relationship of the wave at different medium interfaces. Assume that the stress recorded by the PVDF stress sensor is σ
q and σ
a is the stress of the component to be tested, then:
where
T is the transmission coefficient, and
where
and
are the acoustic impedance of PVDF and target material, respectively,
is the velocity of the shock wave,
is the Hugoniot coefficient of target material, and
is the transmission coefficient of elastic waves.
When
, use
and the shockwave front jumping conditions are:
In this experiment, the thermal shock time is 0.25–0.32 μs, the half-width is 0.12–0.14 μs, the rise time is 0.1–0.2 μs, the electron beam energy injection range is 174~195 J/cm
2, the target material is Ly-12 aluminum and carbon phenolic, and the target thickness is 2–5 mm.
Table 4 and
Figure 16 respectively show the measurement and calculation results of the thermal shock wave (the energy deposition is calculated by the Monte Carlo method). In the table, D is the target thickness, τ
1/2 is the half-width of diode voltage,
Φ0 is the injected amount of electron beam energy at the target surface, and σ
q, σ
a, and σ
s are the values of stress in the PVDF piezoelectric crystal, the stress in the target, and the numerical simulation of stress in the target, respectively. It can be seen that because the target material is placed in front of the PVDF sensor, the stress in the target is slightly greater than that in the sensor. When the electron incident depth is less than 3 mm, the calculated results are small, and when it is greater than 3 mm, the calculated results are large. By comparing the numerical simulation results with the measurement results, the calculation error is less than 10%. The stress decreases with the increase of target depth. Within the above energy injection range, there is a little difference in stress between aluminum and carbon phenolic at the same depth.
Figure 16 shows the measured and calculated results of thermal shock waves for aluminum and carbon phenolic materials.
Figure 17 shows the thermal shock peak value and measured voltage signal waveform of the No. 21040 shot. At each position, two waveforms of opposite polarity appear successively. The first waveform is the incident wave at the front surface, and the second is caused by the reflection of the first one at the back surface of the crystal.
The experimental results show that:
(l) For Ly-12 aluminum targets with different thicknesses in the same experiment, the peak stress of thermal shock wave attenuates exponentially with the increase of target thickness, indicating that the short pulse thermal shock wave attenuates rapidly at the initial stage of propagation.
(2) For target materials with basically the same thickness in the same experiment, or with basically the same thickness and energy injection amount in different shots, the thermal shock stress peaks are basically the same, which indicates that the test results obtained in this paper are effective and reliable.
(3) For the Ly-12 aluminum target with an average energy injection of 174–196 J/cm2 and thickness of 2–5 mm, the measured average stress peak value of thermal shock wave is 1.65–0.97 GPa; for carbon phenolic targets with an average energy injection amount of 185 J/cm2 and thickness of 2–5 mm, the measured average stress peak value of thermal shock wave is 1.591–1.005 GPa. By comparison, with the depth of less than 3 mm, the stress of the aluminum target is larger than that of the carbon phenolic target, i.e., the stress of the former is attenuating more rapidly than that of the latter.
(4) It can be seen from the measured waveform that the electron beam thermal shock waves can be regarded as a triangle wave.
6. Conclusions
With REB’s actual current, voltage, and energy spectrum as input conditions, this paper used the analytical method and the Monte Carlo method to calculate the energy deposition of a multi-energy-spectrum electron beam in materials of hard aluminum and carbon phenolic, and obtained the results as follows by means of thermal shock wave numerical simulation and experimental research of electron beam irradiation material:
(1) Numerical calculation shows that the energy deposition depth of electrons with the same incident energy in carbon phenolic is obviously deeper than that in aluminum. With the decrease of incident electron energy, the peak position and the depth of electron energy deposition gradually decrease, but the deposition peak increases. With the increase of the incident angle, the peak position of energy deposition gradually moves to the radiation surface.
(2) The peak value of radiant thermal shock wave is not at the radiation surface, but near the peak value of energy deposition. The maximum thermal shock intensity occurs in the process of radiation, but not at the end of radiation. Under the condition of constant energy density, the higher the energy of the electron beam, the higher the intensity of the thermal shock wave. When the energy of the electron beam is constant, the higher the energy density is, the stronger the thermal shock wave is.
(3) By comparing the experimental and calculated results, the peak stress of thermal shock waves for Ly-12 aluminum targets with different thicknesses attenuates exponentially with the increase of target thickness, indicating that the short pulse thermal shock wave attenuates rapidly at the initial stage of propagation. When the material thickness is the same, the measurement results are similar, indicating the reliability of the results. For Ly-12 aluminum targets with an average energy injection amount of 187–196 J/cm2 and thickness of 2–5 mm, the measured average stress peak value of thermal shock wave is 1.65–0.97 GPa. The average energy injection amount is 185 J/cm2, and the measured average stress peak value of the thermal shock wave of carbon phenolic target is 1.591–1.005 GPa.
(4) When the same energy electron beam is irradiated to aluminum and carbon phenolic materials, the carbon phenolic energy deposition is deeper, but the peak value is smaller, which is more conducive to the energy absorption of the electron beam, which is verified by the results of the thermal shock wave.
These studies are of great significance for energy deposition and thermal shock effect of electron-beam irradiated materials.
Author Contributions
Conceptualization, D.W.; methodology, R.Y.; validation, D.W. and W.C.; formal analysis, D.W.; investigation, R.Y.; data curation, D.W.; writing—original draft preparation, D.W.; writing—review and editing, D.W., R.Y., and S.W.; supervision, W.C. and S.W.; funding acquisition, S.W. All authors have read and agreed to the published version of the manuscript.
Funding
This work was supported by the Guangdong Basic and Applied Basic Research Foundation under Grant No. 2020B1515120035.
Institutional Review Board Statement
Not applicable.
Informed Consent Statement
Not applicable.
Data Availability Statement
All data included in this study are available upon request by contact with the corresponding author.
Conflicts of Interest
The authors declare no conflict of interest.
References
- Office of the Deputy Assistant Secretary of Defense for Nuclear Matters (ODASD(NM)). Nuclear Matters Handbook 2020; ODASD(NM): CA, USA, 2020; Available online: https://man.fas.org/eprint/nmhb2020.pdf (accessed on 25 February 2022).
- Du, Z.; Zhu, M.; Wang, Z.; Yang, J. Design and application of composite platform with extreme low thermal deformation for satellite. Compos. Struct. 2016, 152, 693–703. [Google Scholar]
- Zhong, J.; Ren, J.; Ma, D. Thermo-elasticity coupling transient response of composite material direction pipe. Shock Vib. 2018, 69, 373–378. [Google Scholar]
- Wang, D.; Gao, Y.; Chen, W.; Zhang, J.; Wang, S. Equivalent Analysis of Thermo-Dynamic Blow-off Impulse under X-ray Irradiation. Appl. Sci. 2021, 11, 8853. [Google Scholar] [CrossRef]
- Min, S.; Chen, X.; Chai, Y.; Lowe, T. Effect of reinforcement continuity on the ballistic performance of composites reinforced with multiply plain weave fabric. Compos. Part B Eng. 2016, 90, 30–36. [Google Scholar] [CrossRef]
- Singh, A.; Tadmor, E.B. Thermal parameter identification for non-Fourier heat transfer form molecular dynamics. J. Comput. Phys. 2015, 299, 667–686. [Google Scholar] [CrossRef] [Green Version]
- Kusaka, T.; Hojo, M.; Mai, Y.; Kurokawa, T.; Nojima, T.; Ochiai, S. Rate dependence of mode I fracture behaviour in carbon-fibre/epoxy composite laminates. Compos. Sci. Technol. 1998, 58, 591–602. [Google Scholar] [CrossRef]
- Weeks, C.A.; Sun, C.T. Modeling non-linear rate-dependent behavior in fiber-reinforced composites. Compos. Sci. Technol. 1998, 58, 603–611. [Google Scholar] [CrossRef]
- Hu, J.; Ren, J.; Ma, W.; Wang, A. Dynamic mechanical properties and constitutive model of honeycomb materials with random defects under impact loading. Shock Vib. 2019, 108, 79–91. [Google Scholar]
- Bakulin, V.N.; Ostrik, A.V. The combined thermal and mechanical effect of radiation and shock waves on a multilayer orthotropic shell with a heterogeneous coating. J. Appl. Math. Mech. 2014, 78, 155–162. [Google Scholar] [CrossRef]
- Tang, W.; Zhang, R.; Zeng, X. DRAM-A new hydrocode of dynamic response analysis of materials. In New Models and Numerical Codes for Shock Wave Processes in Condensed Media Proceedings of the International Workshop; Cameron, I.G., Ed.; AWE Hunting Press: Oxford, UK, 1998; pp. 649–653. [Google Scholar]
- Longley, R.W. Analytical Relationships for Estimating the Effects of X-rays on Materials; AFRPL-TR-74-52; CA, USA. 1974. Available online: https://apps.dtic.mil/sti/citations/AD0786926% (accessed on 25 February 2022).
- Larence, R.J. The equivalence of simple models for radiation induced impulse. In Shock Compression of Condensed Matter; Elsevier Science Publishers B V: New York, NY, USA, 1992; pp. 785–798. [Google Scholar]
- Department of Defense. Report of the Defense Science Board Task Force on Nuclear Weapon Effects Test, Evaluation, and Simulation; DIANE Publishing: Washington, DC, USA, 2005. [Google Scholar]
- Wang, Y.; Li, Q.; Li, T.T. Monte Carto Imaging Simulation for X-ray Spectrum Estimation. High Power Laser Part. Beams 2013, 25, 3017–3020. [Google Scholar] [CrossRef]
- Huang, X.; Tang, W.H.; Jiang, B.H.; Guo, X. The Numerical Simulation of 2-D Thermal Shock Wave Induced by X-ray in Anisotropic Material. J. High-Press. Phys. 2011, 25, 41–47. [Google Scholar]
- Sun, J.F.; Hu, Y.; Sun, L. An average method for intense pulsed electron beam incident angles. High Power Laser Part. Beams 2015, 27, 140011–140014. [Google Scholar]
- Tang, W.H.; Chen, H. The dynamics effect and material parameters of polyester radiated by electron beam. Chin. J. High Press. Phys. 2010, 24, 373–376. [Google Scholar]
- Zhou, N.; Qiao, D. Materials Dynamics under Pulse Beam Radiation; National Defence Industry Press: Beijing, China, 2002; pp. 401–404. [Google Scholar]
- Qiao, D. Thermodynamic Effect and Reinforcing Technology under Pulse X-ray Radiation; National Defense Industry Press: Beijing, China, 2012; pp. 118–196. [Google Scholar]
- Zhao, G.M. Investigations of Simulation Techniques for Studying Structural Response of Cylindrical Shells under Powerful Pulsed X-ray Radiation; National University of Defense Technology: Changsha, China, 1997; pp. 1–45. [Google Scholar]
- Huang, X.; Tang, W.H. Influences of constitutive models on numerically simulated results of X-ray thermal shock waves in composite materials. Explos. Shock. Waves 2011, 31, 324–330. [Google Scholar]
- Zhang, K.; Tang, W.H.; Zan, X.W. Constitutive relationship of anisotropic CFRPmaterial and its application in planar plate impact simulation. J. Vib. Shock. 2019, 38, 101–106. [Google Scholar]
- Niu, J.C. SPH Simulation of Thermo-Mechanical Effets in Materials under Pulse X-rays radiation; National University of Defense Technology: Mianyang, China, 2006; pp. 23–65. [Google Scholar]
- Rudic, N.J. Principles and Techniques of Radiation Hardening; Western Periodical Company: Los Angeles, CA, USA, 1976. [Google Scholar]
- Milov, I.; Lipp, V.; Ilnitsky, D.; Medvedev, N.; Migdal, K.; Zhakhovsky, V.; Khokhlov, V.; Petrov, Y.; Inogamov, N.; Semin, S.; et al. Similarity in ruthenium damage induced by photons with different energies: From visible light to hard X-rays. Appl. Surf. Sci. 2020, 501, 143973. [Google Scholar] [CrossRef]
- Wang, D.; Gao, Y.; Chen, W.; Yang, S.; Zhang, J.; Wang, J.; Wang, S. The Blow-off Impulse Equivalence of Typical Missile Homogeneous Al-alloy under Multi-Energy Composite Spectrum Electron Beam and Powerful Pulsed X-ray. Materials 2021, 14, 5002. [Google Scholar] [CrossRef]
- Subbe, R.B. Nuclear Instructure. Mech 1976, 44, 155–187. [Google Scholar]
- Berger, H.A.M.; Setzer, S.M. Table of Energy Loses and Range of Electrons and Positions; NASA SP-12: Washington, DC, USA, 1964. [Google Scholar]
- Wu, D.F.; Xu, X.F.; Zhang, L. A hybrid Monte Carlo model for the energy response functions of X-ray photon counting detector. Nucl. Instrum. Methods Phys. Res. A 2016, 83, 397–406. [Google Scholar]
- Li, M.Y.; Sommerer, M.; Werner, E. Experimental and computational study of damage behavior of tungsten under high energy electron beam irradiation. Eng. Fract. Mech. 2015, 135, 64–80. [Google Scholar] [CrossRef] [Green Version]
- Wang, D.; Gao, Y.; Wang, S.; Wang, J.; Li, H. Study on X-ray Induced Two-Dimensional Thermal Shock Waves in Carbon/Phenolic. Materials 2021, 14, 3553. [Google Scholar] [CrossRef] [PubMed]
Figure 1.
Pictures of the REB device.
Figure 1.
Pictures of the REB device.
Figure 2.
Pictures of the REB device. Test circuit of PVDF charge mode.
Figure 2.
Pictures of the REB device. Test circuit of PVDF charge mode.
Figure 3.
Photos of PVDF sensor and sample before and after experiment No. 21040.
Figure 3.
Photos of PVDF sensor and sample before and after experiment No. 21040.
Figure 4.
Schematic diagram of the geometric model of electron incidence.
Figure 4.
Schematic diagram of the geometric model of electron incidence.
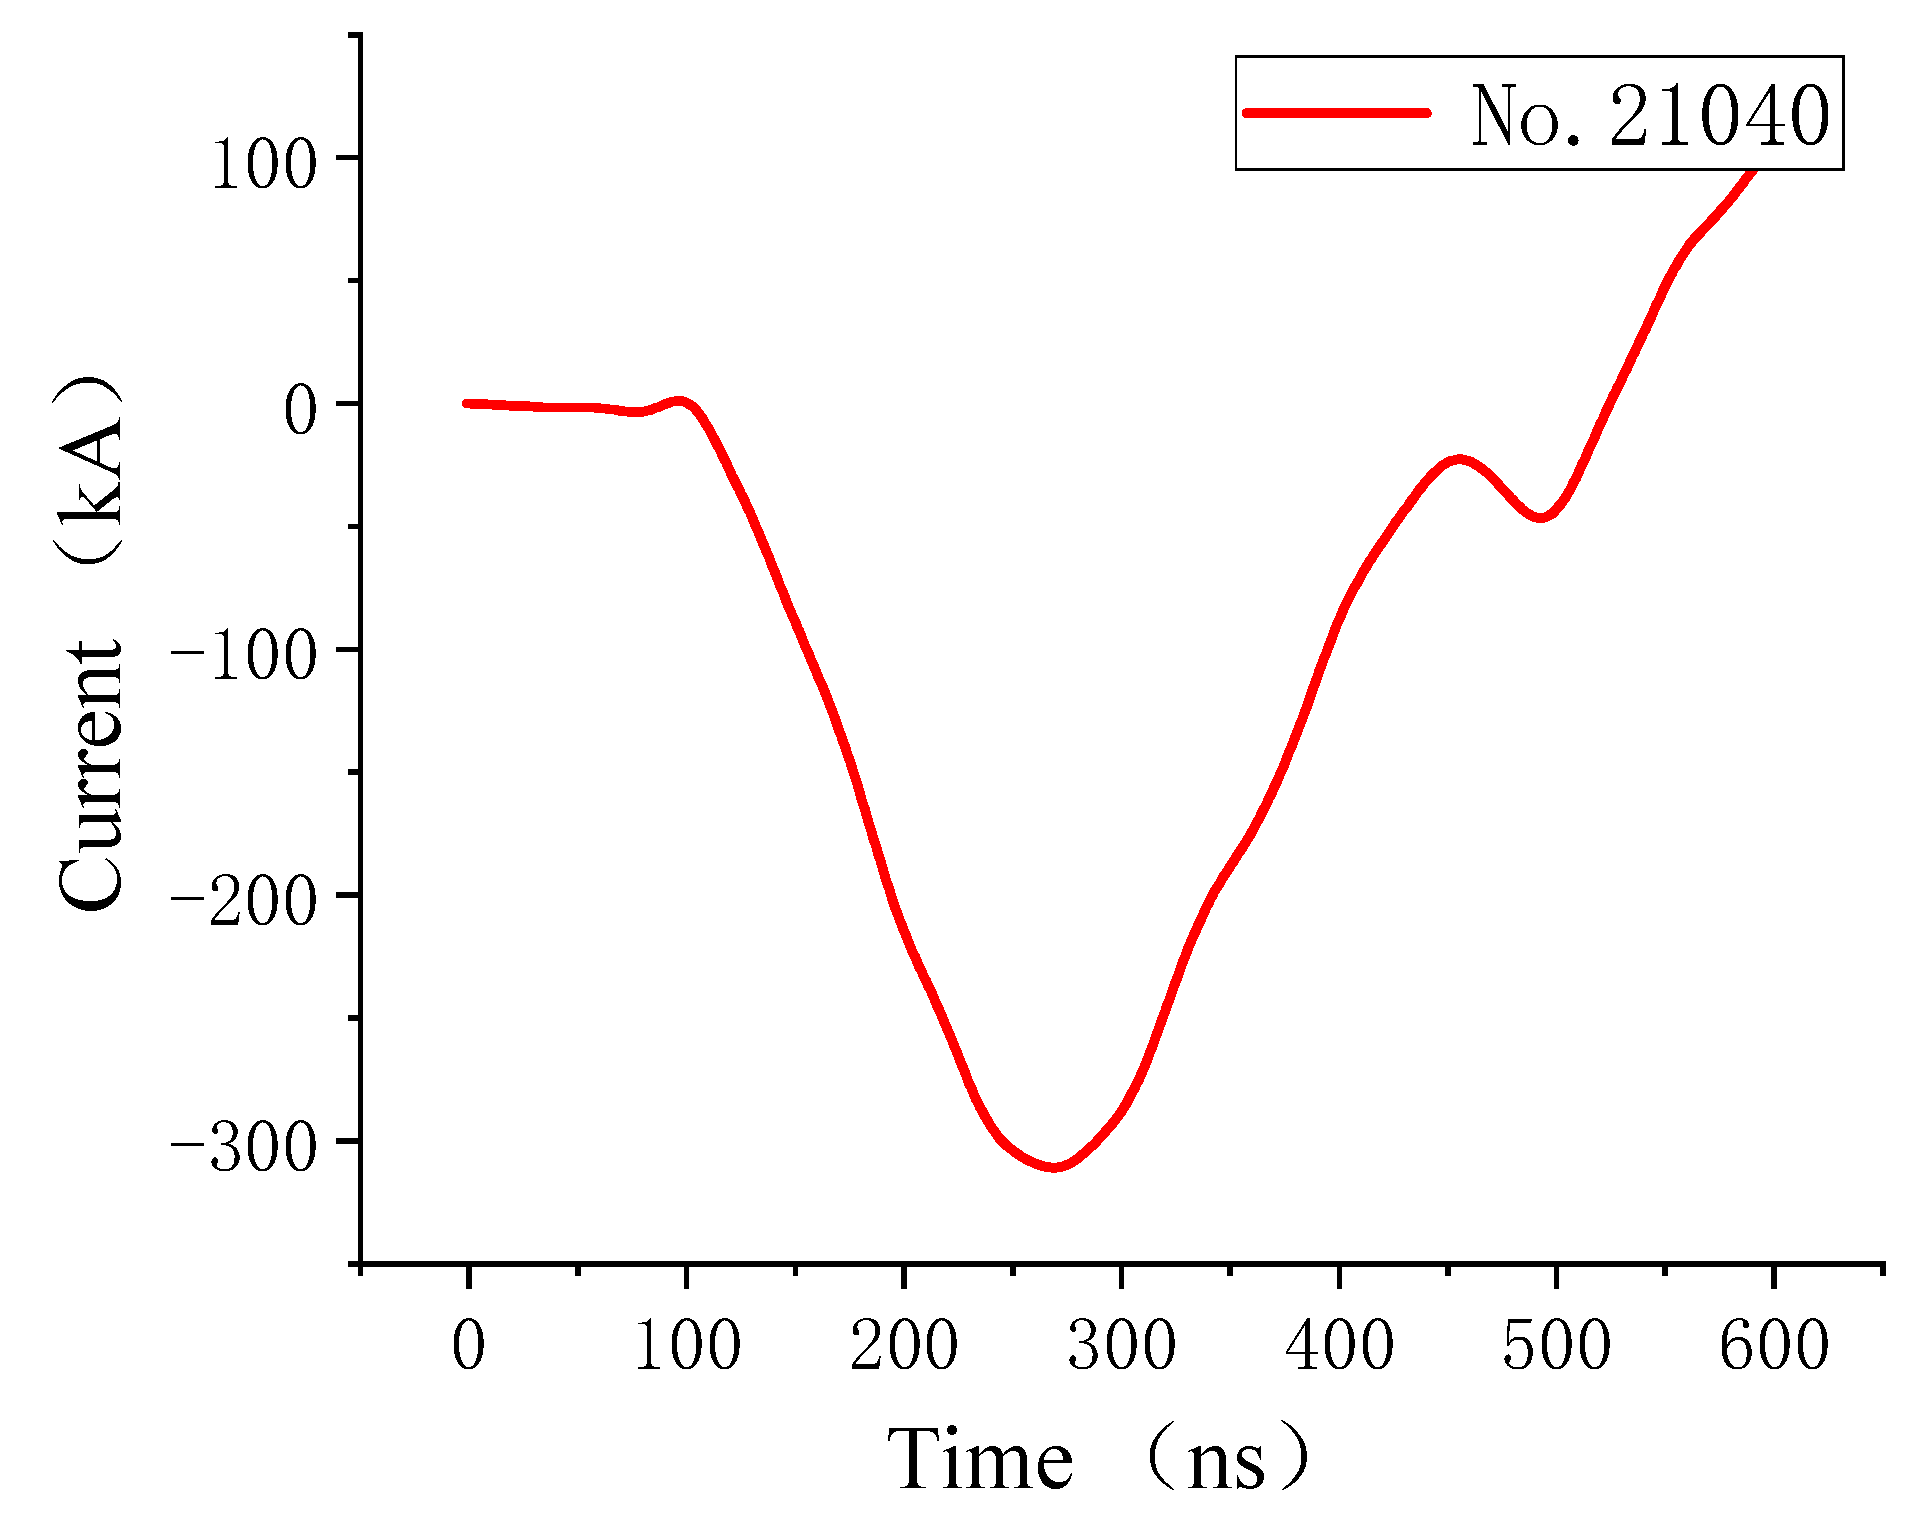
Figure 5.
Electron beam current waveform (No. 21040).
Figure 5.
Electron beam current waveform (No. 21040).
Figure 6.
Electron beam voltage waveform (No. 21040).
Figure 6.
Electron beam voltage waveform (No. 21040).
Figure 7.
Multi-spectrum electron beam spectrum waveform (No. 21040).
Figure 7.
Multi-spectrum electron beam spectrum waveform (No. 21040).
Figure 8.
Comparison of the two calculation methods. (a) 1 Mev, Al. (b) 0.8 Mev, Al. (c) 1 Mev, C/PH. (d) 0.8 Mev, C/PH.
Figure 8.
Comparison of the two calculation methods. (a) 1 Mev, Al. (b) 0.8 Mev, Al. (c) 1 Mev, C/PH. (d) 0.8 Mev, C/PH.
Figure 9.
Energy deposition profile in carbon phenolic. (a) Different incident angles. (b) Different incident energies.
Figure 9.
Energy deposition profile in carbon phenolic. (a) Different incident angles. (b) Different incident energies.
Figure 10.
Calculation model.
Figure 10.
Calculation model.
Figure 11.
Energy deposition rates of different energy electrons in multilayer structures. (a) 0.4 MeV. (b) 0.6 MeV. (c) 0.8 MeV. (d) 1 MeV.
Figure 11.
Energy deposition rates of different energy electrons in multilayer structures. (a) 0.4 MeV. (b) 0.6 MeV. (c) 0.8 MeV. (d) 1 MeV.
Figure 13.
The spatial waveform of the thermal shock wave in carbon phenolic.
Figure 13.
The spatial waveform of the thermal shock wave in carbon phenolic.
Figure 14.
Thermal shock wave attenuation in carbon phenolic.
Figure 14.
Thermal shock wave attenuation in carbon phenolic.
Figure 15.
Attenuation of thermal shock waves at different energy densities.
Figure 15.
Attenuation of thermal shock waves at different energy densities.
Figure 16.
Measured and calculated results of thermal shock waves for aluminum and carbon phenolic materials.
Figure 16.
Measured and calculated results of thermal shock waves for aluminum and carbon phenolic materials.
Figure 17.
Measured and calculated results of thermal shock waves for aluminum and carbon phenolic materials.
Figure 17.
Measured and calculated results of thermal shock waves for aluminum and carbon phenolic materials.
Table 1.
Material parameters.
Table 1.
Material parameters.
| No. | Material | Thickness (μm) | Density (g/cm3) | Element
Component | Gruneison Coefficient | co(m/s) |
| 1 | Chemical paint | 50 | 0.4 | C, O, Si, S, Cl, Ca, Fe, and Zn | 0.09 | 1675 |
| 2 | Macromolecule cloth | 200 | 1 | C, O, and H | 0.18 | 2109 |
| 3 | Wave absorbing layer | 30 | 4 | C, O, and Fe | 0.89 | 5643 |
| 4 | Macromolecule film | 20 | 1.38 | C, O, and H | 0.27 | 2867 |
| No. | Material | s | Es/kJ/g | G/GPa | Y0/GPa | |
| 1 | Chemical paint | 1.52 | 3.23 | 5.4 | 0.06 | |
| 2 | Macromolecule cloth | 1.60 | 4.97 | 6.0 | 0.07 | |
| 3 | Wave absorbing layer | 1.76 | 7.12 | 7.4 | 0.12 | |
| 4 | Macromolecule film | 1.66 | 5.16 | 6.3 | 0.07 | |
Table 2.
Total energy deposition rate in the multilayer structure.
Table 2.
Total energy deposition rate in the multilayer structure.
| Incident Energy (MeV) | Escape Energy (MeV) | Energy Deposition Rate (%) |
|---|
| 0° | 40° | 0° | 40° |
|---|
| 0.200 | 0.004 | 0.012 | 98 | 94 |
| 0.400 | 0.020 | 0.036 | 95 | 91 |
| 0.500 | 0.049 | 0.063 | 90.2 | 87.4 |
| 0.600 | 0.135 | 0.128 | 77.5 | 78.7 |
| 0.800 | 0.379 | 0.327 | 52.6 | 59.1 |
| 1.000 | 0.636 | 0.550 | 36.4 | 45 |
Table 3.
Material parameters of carbon phenolic.
Table 3.
Material parameters of carbon phenolic.
| Parameters | Value | Parameters | Value |
|---|
| ρ0 (g/cm3) | 1.43 | Y0 (GPa) | 0.05 |
| c0 (m/s) | 3069 | Es (kJ/g) | 5.14 |
| s | 1.578 | H | 0.5 |
| Γ0 | 0.24 | N | 7.59 |
| G (GPa) | 6.0 | | |
Table 4.
Measured and calculated data of thermal shock waves.
Table 4.
Measured and calculated data of thermal shock waves.
| Number | Target
Material | D
(mm) | τ1/2
(ns) | Ea
(MeV) | Φ0
(J/cm2) | σq
(GPa) | σa
(GPa) | σ
(GPa) |
|---|
| 21037 | Ly-12 | 3.52
5.03 | 80.7 | 0.75 | 174 | 1.184
0.987 | 1.196
0.995 | 1.311
1.156 |
| 21038 | Ly-12 | 4.99
4.98 | 89.6 | 0.64 | 195 | 0.905
0.991 | 0.912
0.999 | 1.078 |
| 21039 | Ly-12 | 2.02
3.02
4.00
5.00 | 81.6 | 0.64 | 180 | 1.652
1.404
1.100
0.954 | 1.676
1.422
1.110
0.962 | 1.516
1.313
1.190
1.093 |
| 21040 | c/ph | 1.99
3.02
4.04
5.02 | 82.4 | 0.75 | 187 | 1.591
1.350
1.172
1.005 | 1.619
1.369
1.186
1.014 | 1.60
1.394
1.267
1.181 |
| Publisher’s Note: MDPI stays neutral with regard to jurisdictional claims in published maps and institutional affiliations. |
© 2022 by the authors. Licensee MDPI, Basel, Switzerland. This article is an open access article distributed under the terms and conditions of the Creative Commons Attribution (CC BY) license (https://creativecommons.org/licenses/by/4.0/).


