Urban Sprawl and Carbon Emissions Effects in City Areas Based on System Dynamics: A Case Study of Changsha City
Abstract
:1. Introduction
2. Study Area and Methods
2.1. Overview of the Study Area
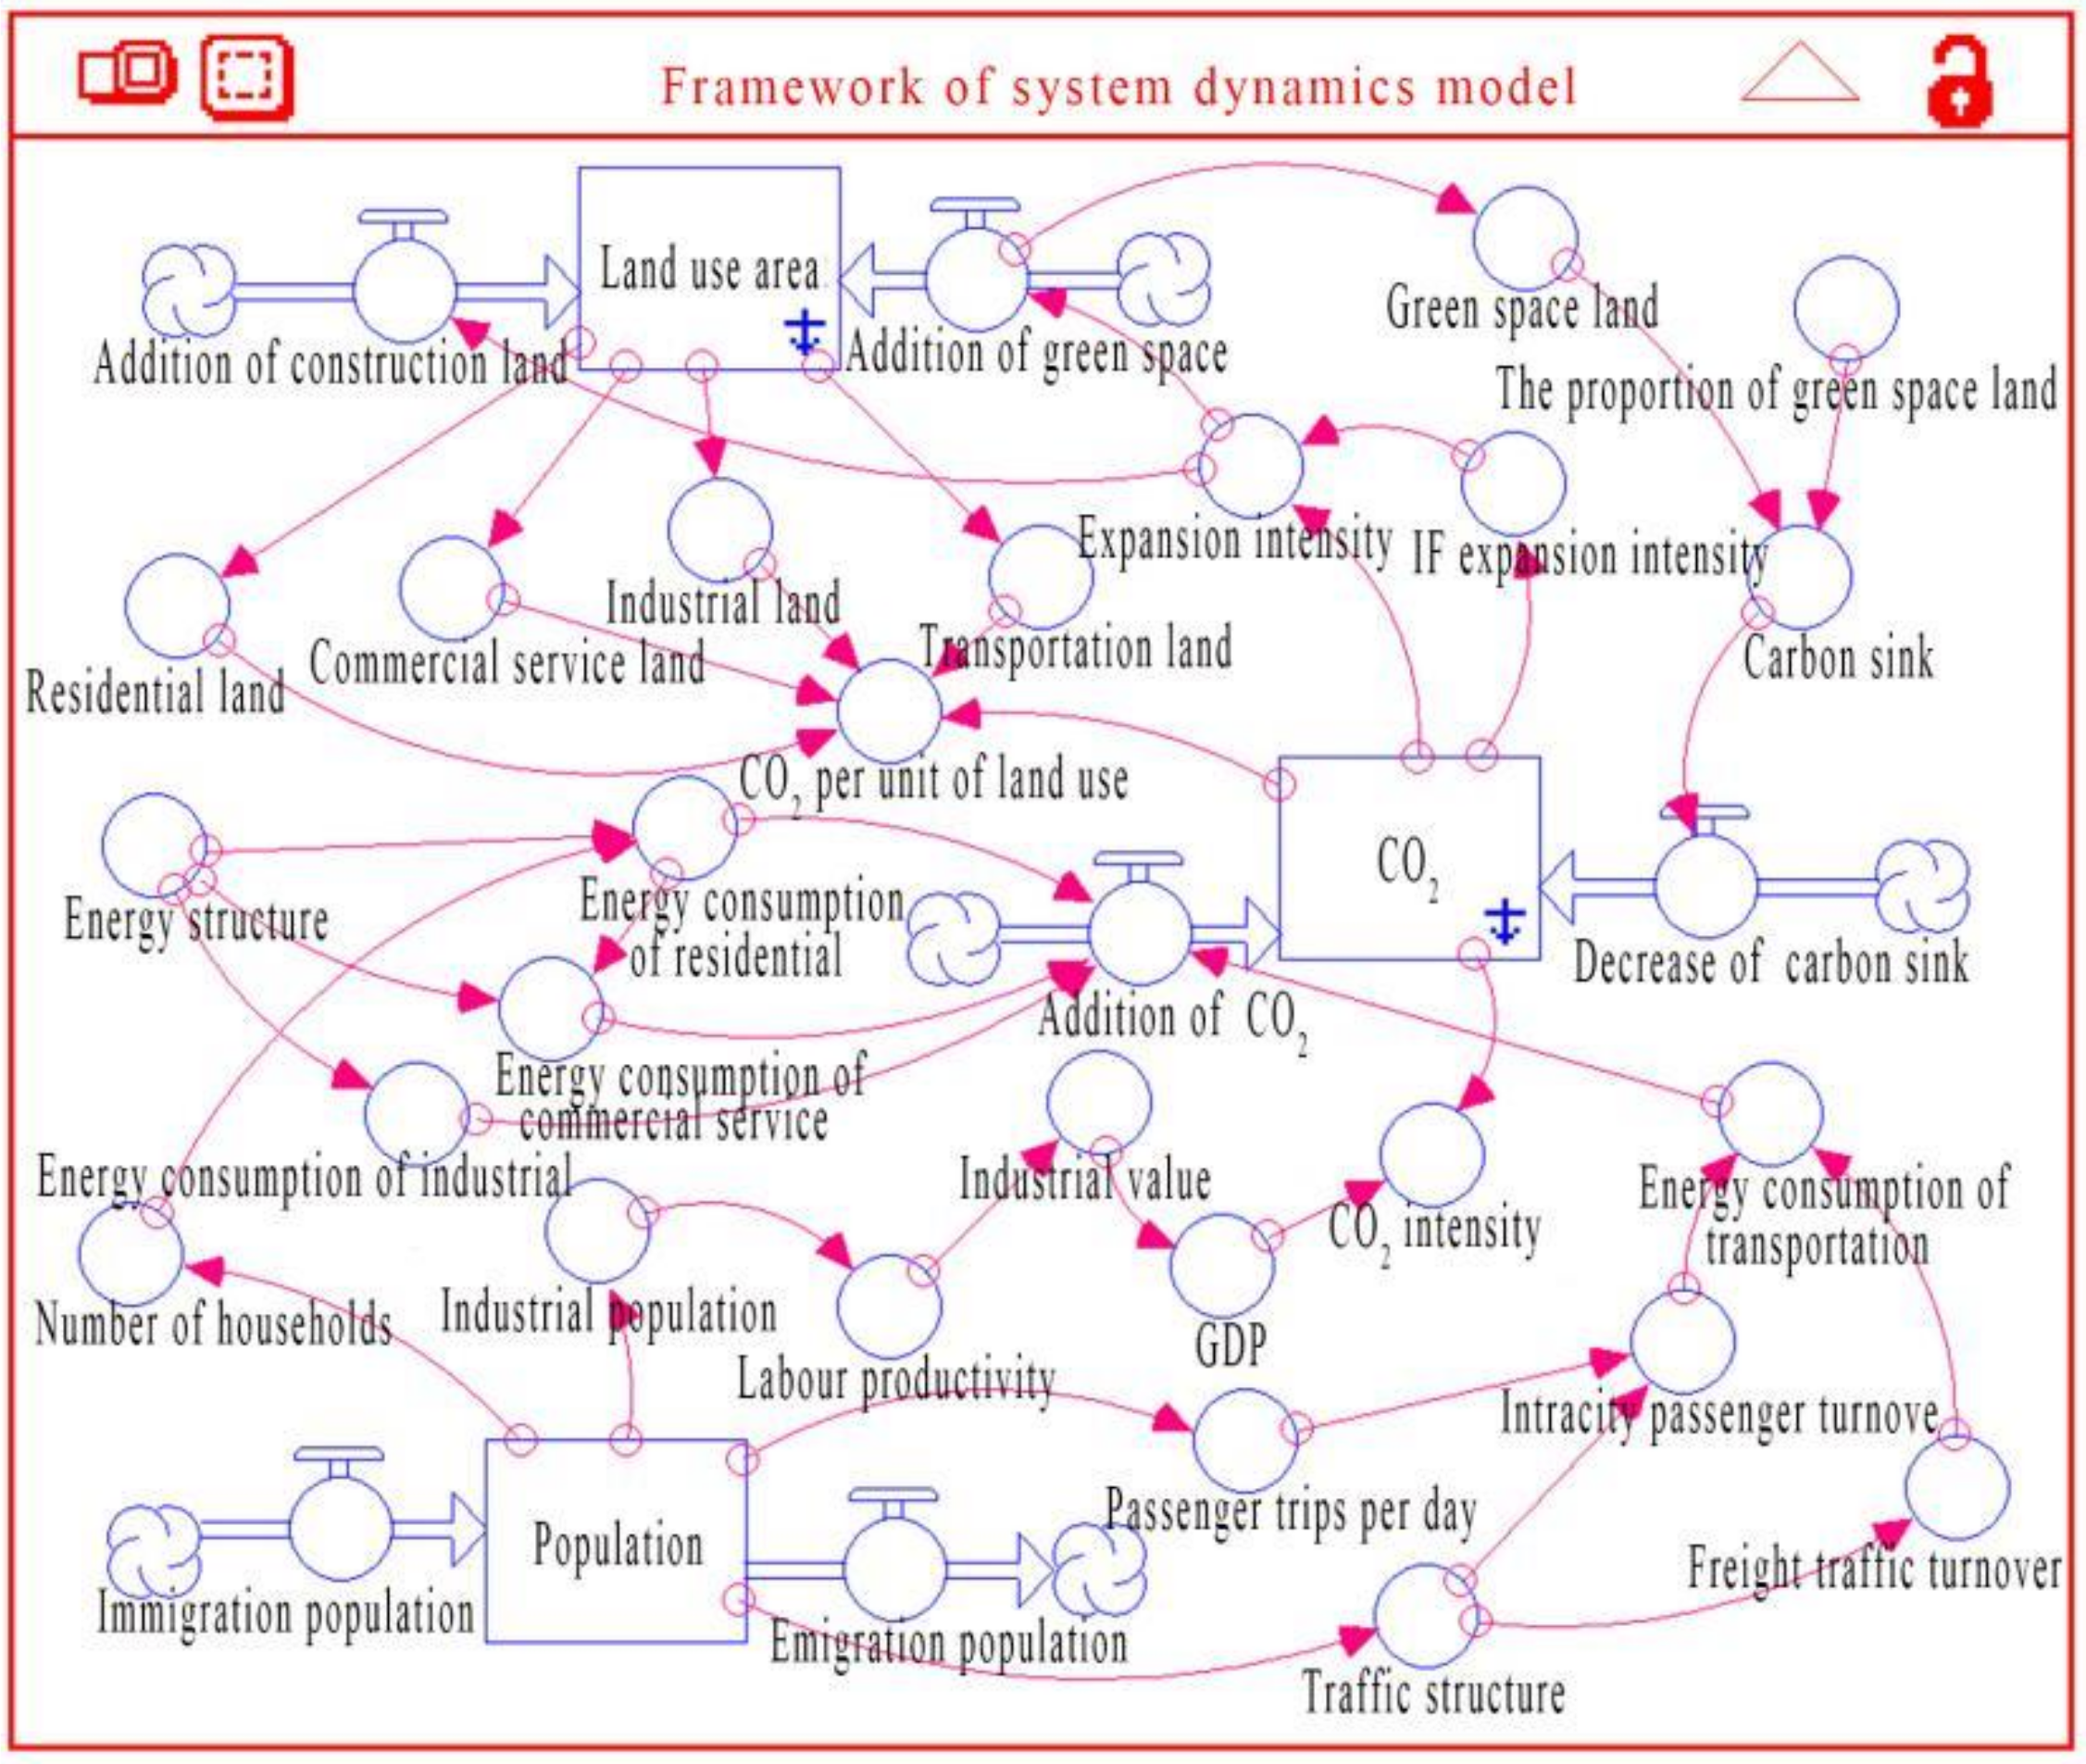
2.2. System Dynamics Modeling Theory
3. System Dynamic Model for Urban Energy Consumption and CO2 Emissions
3.1. Overall Framework of the Model
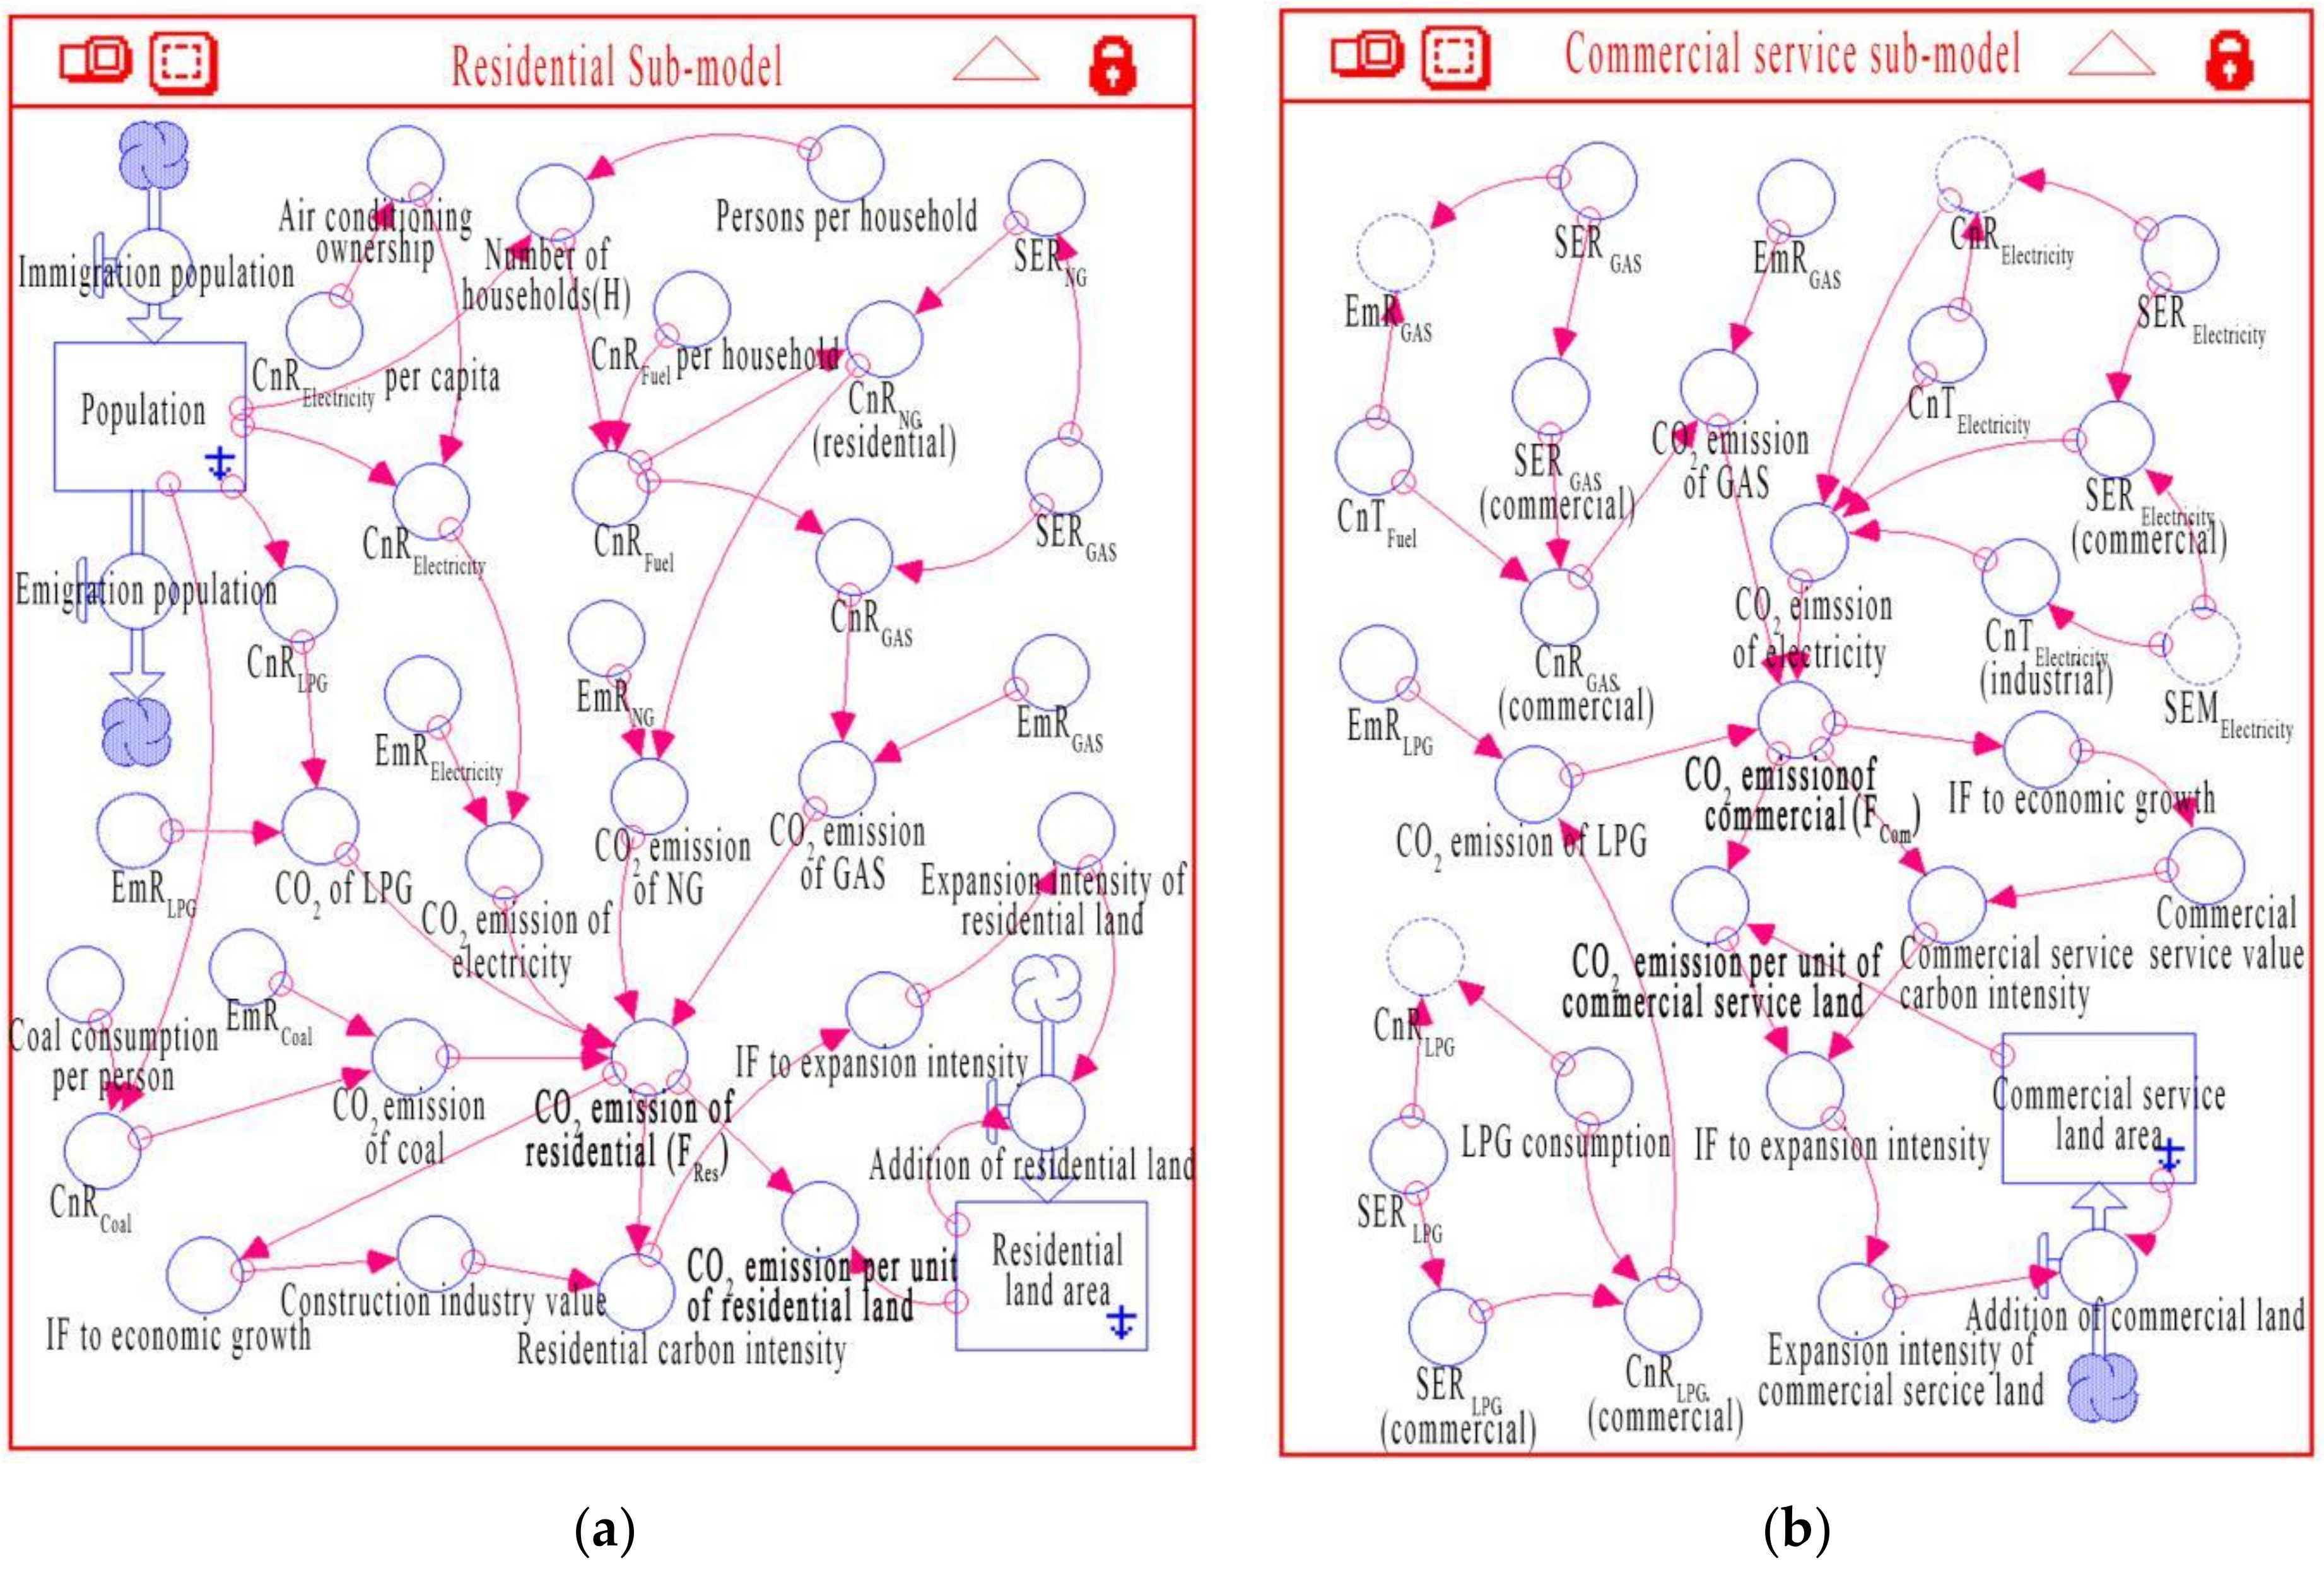
3.2. Residential Sub-Model
3.3. Commercial Service Sub-Model
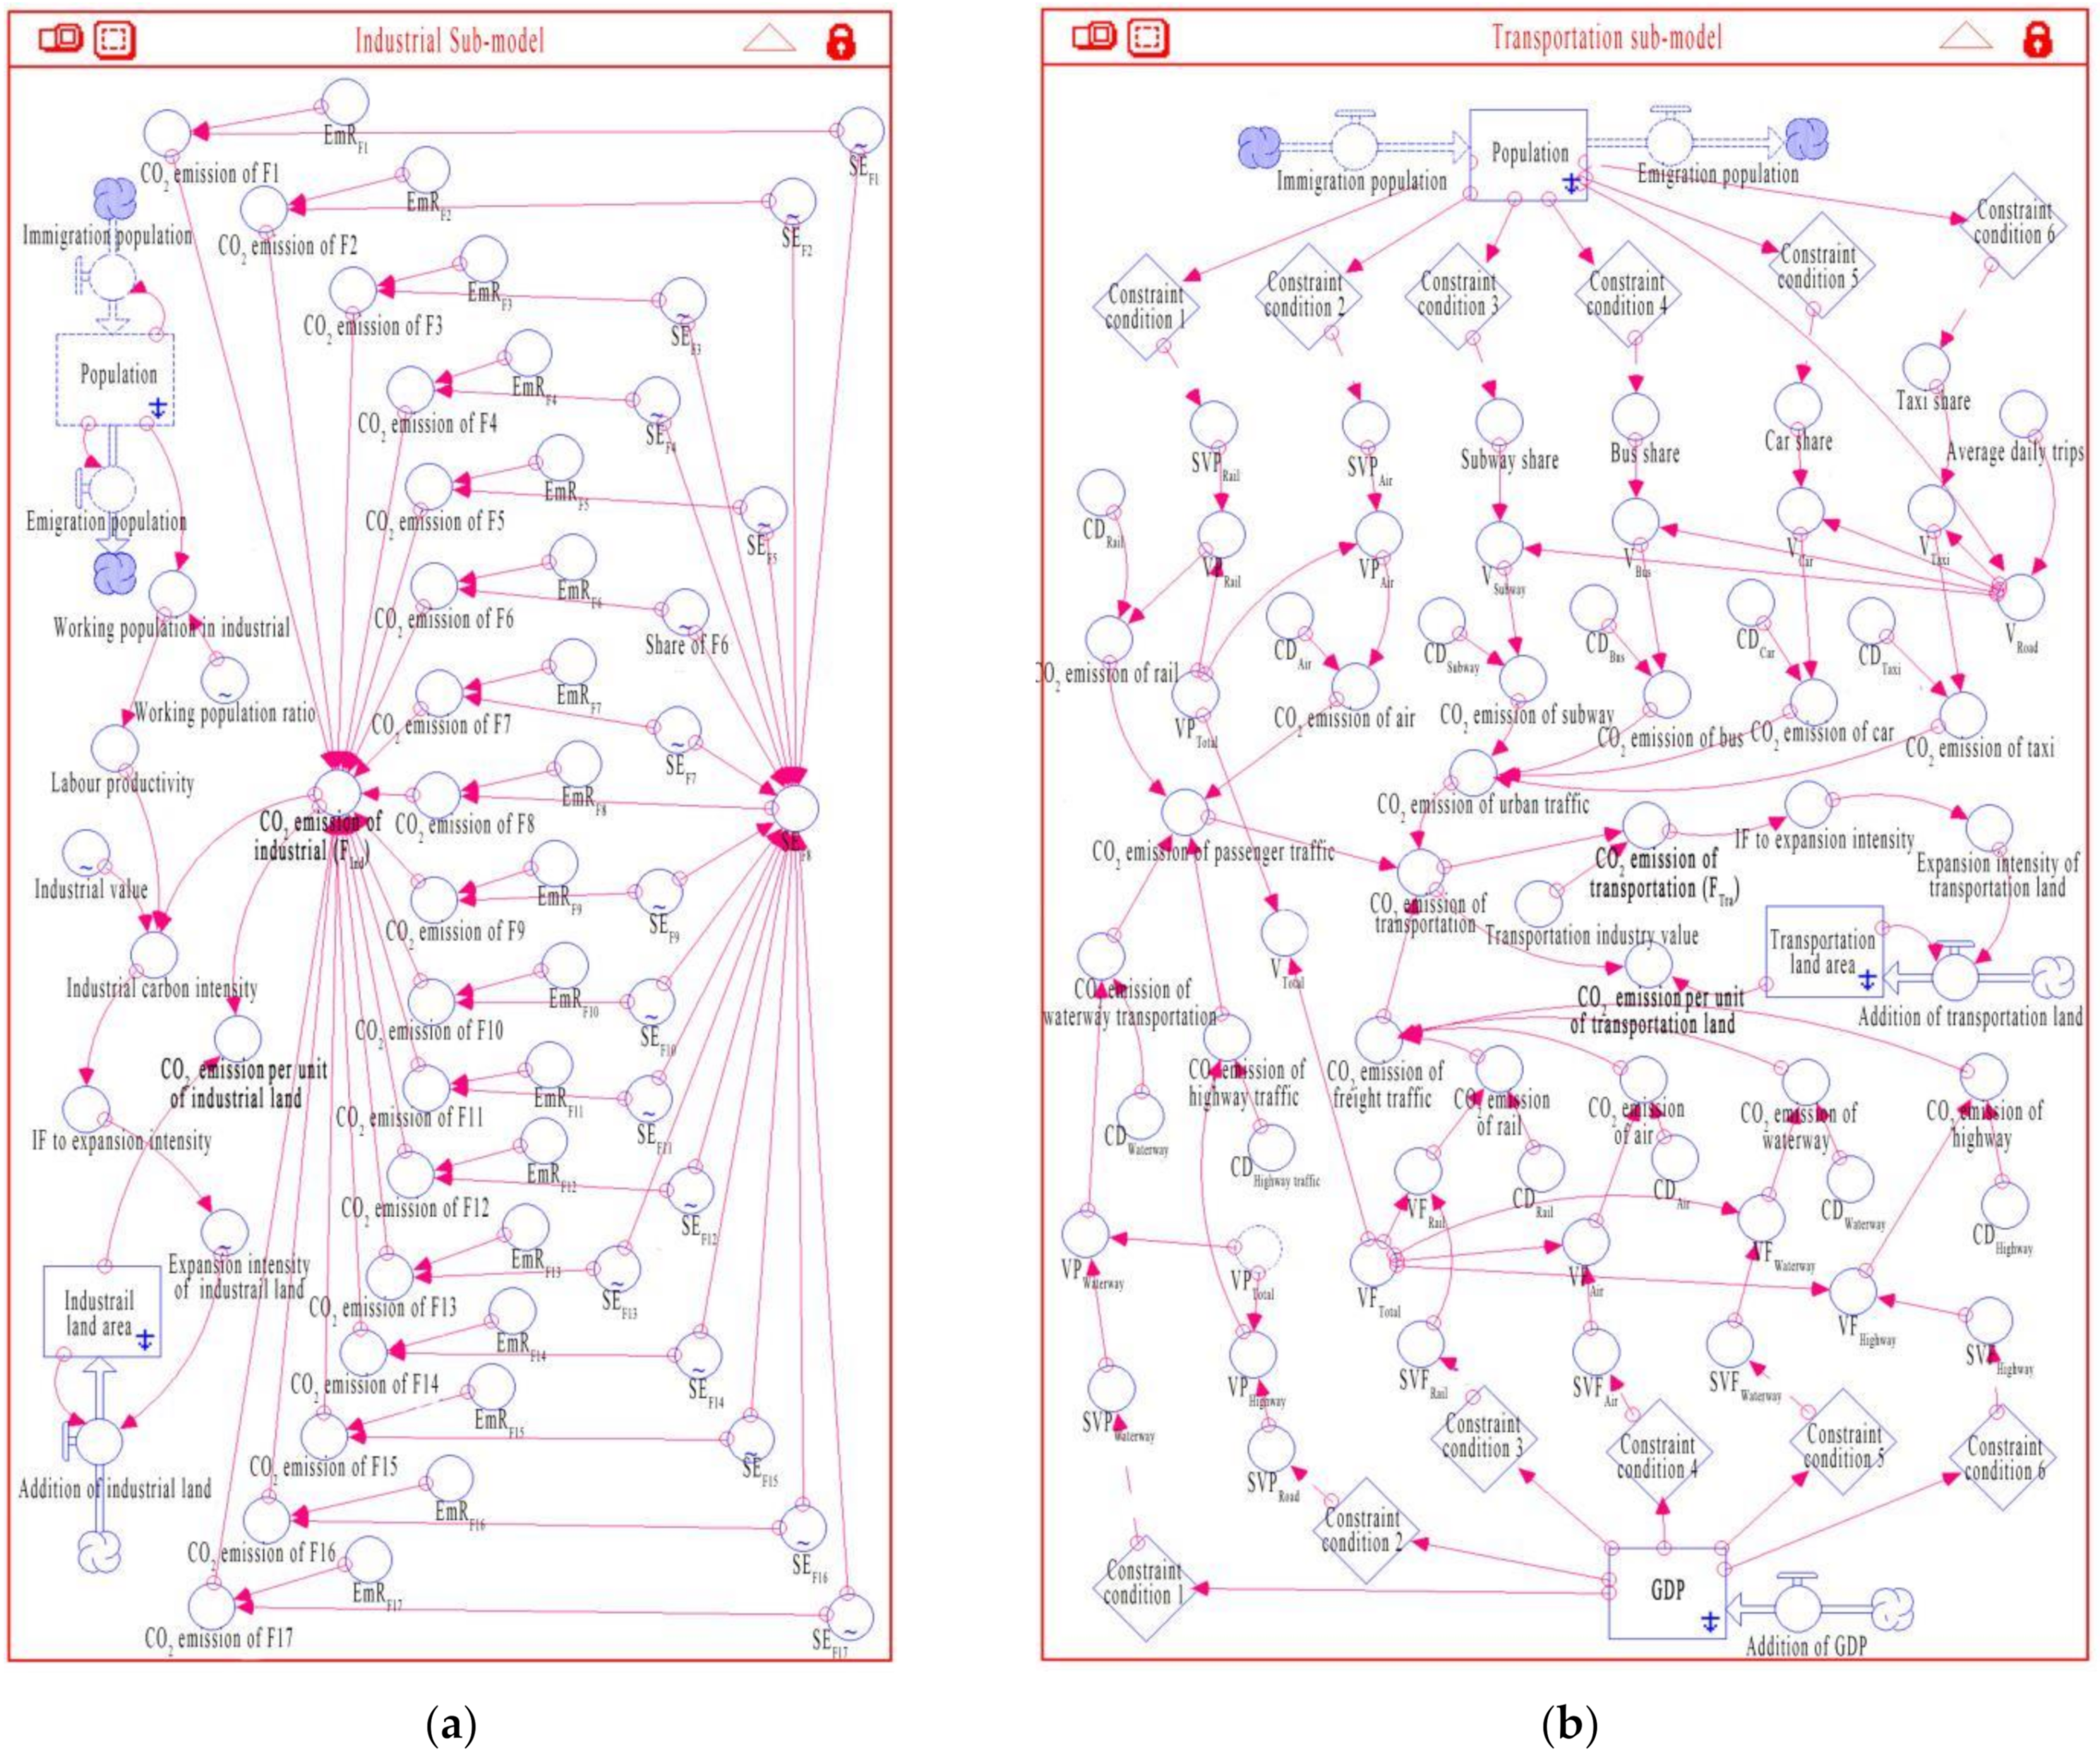
3.4. Industrial Sub-Model
3.5. Transportation Sub-Model
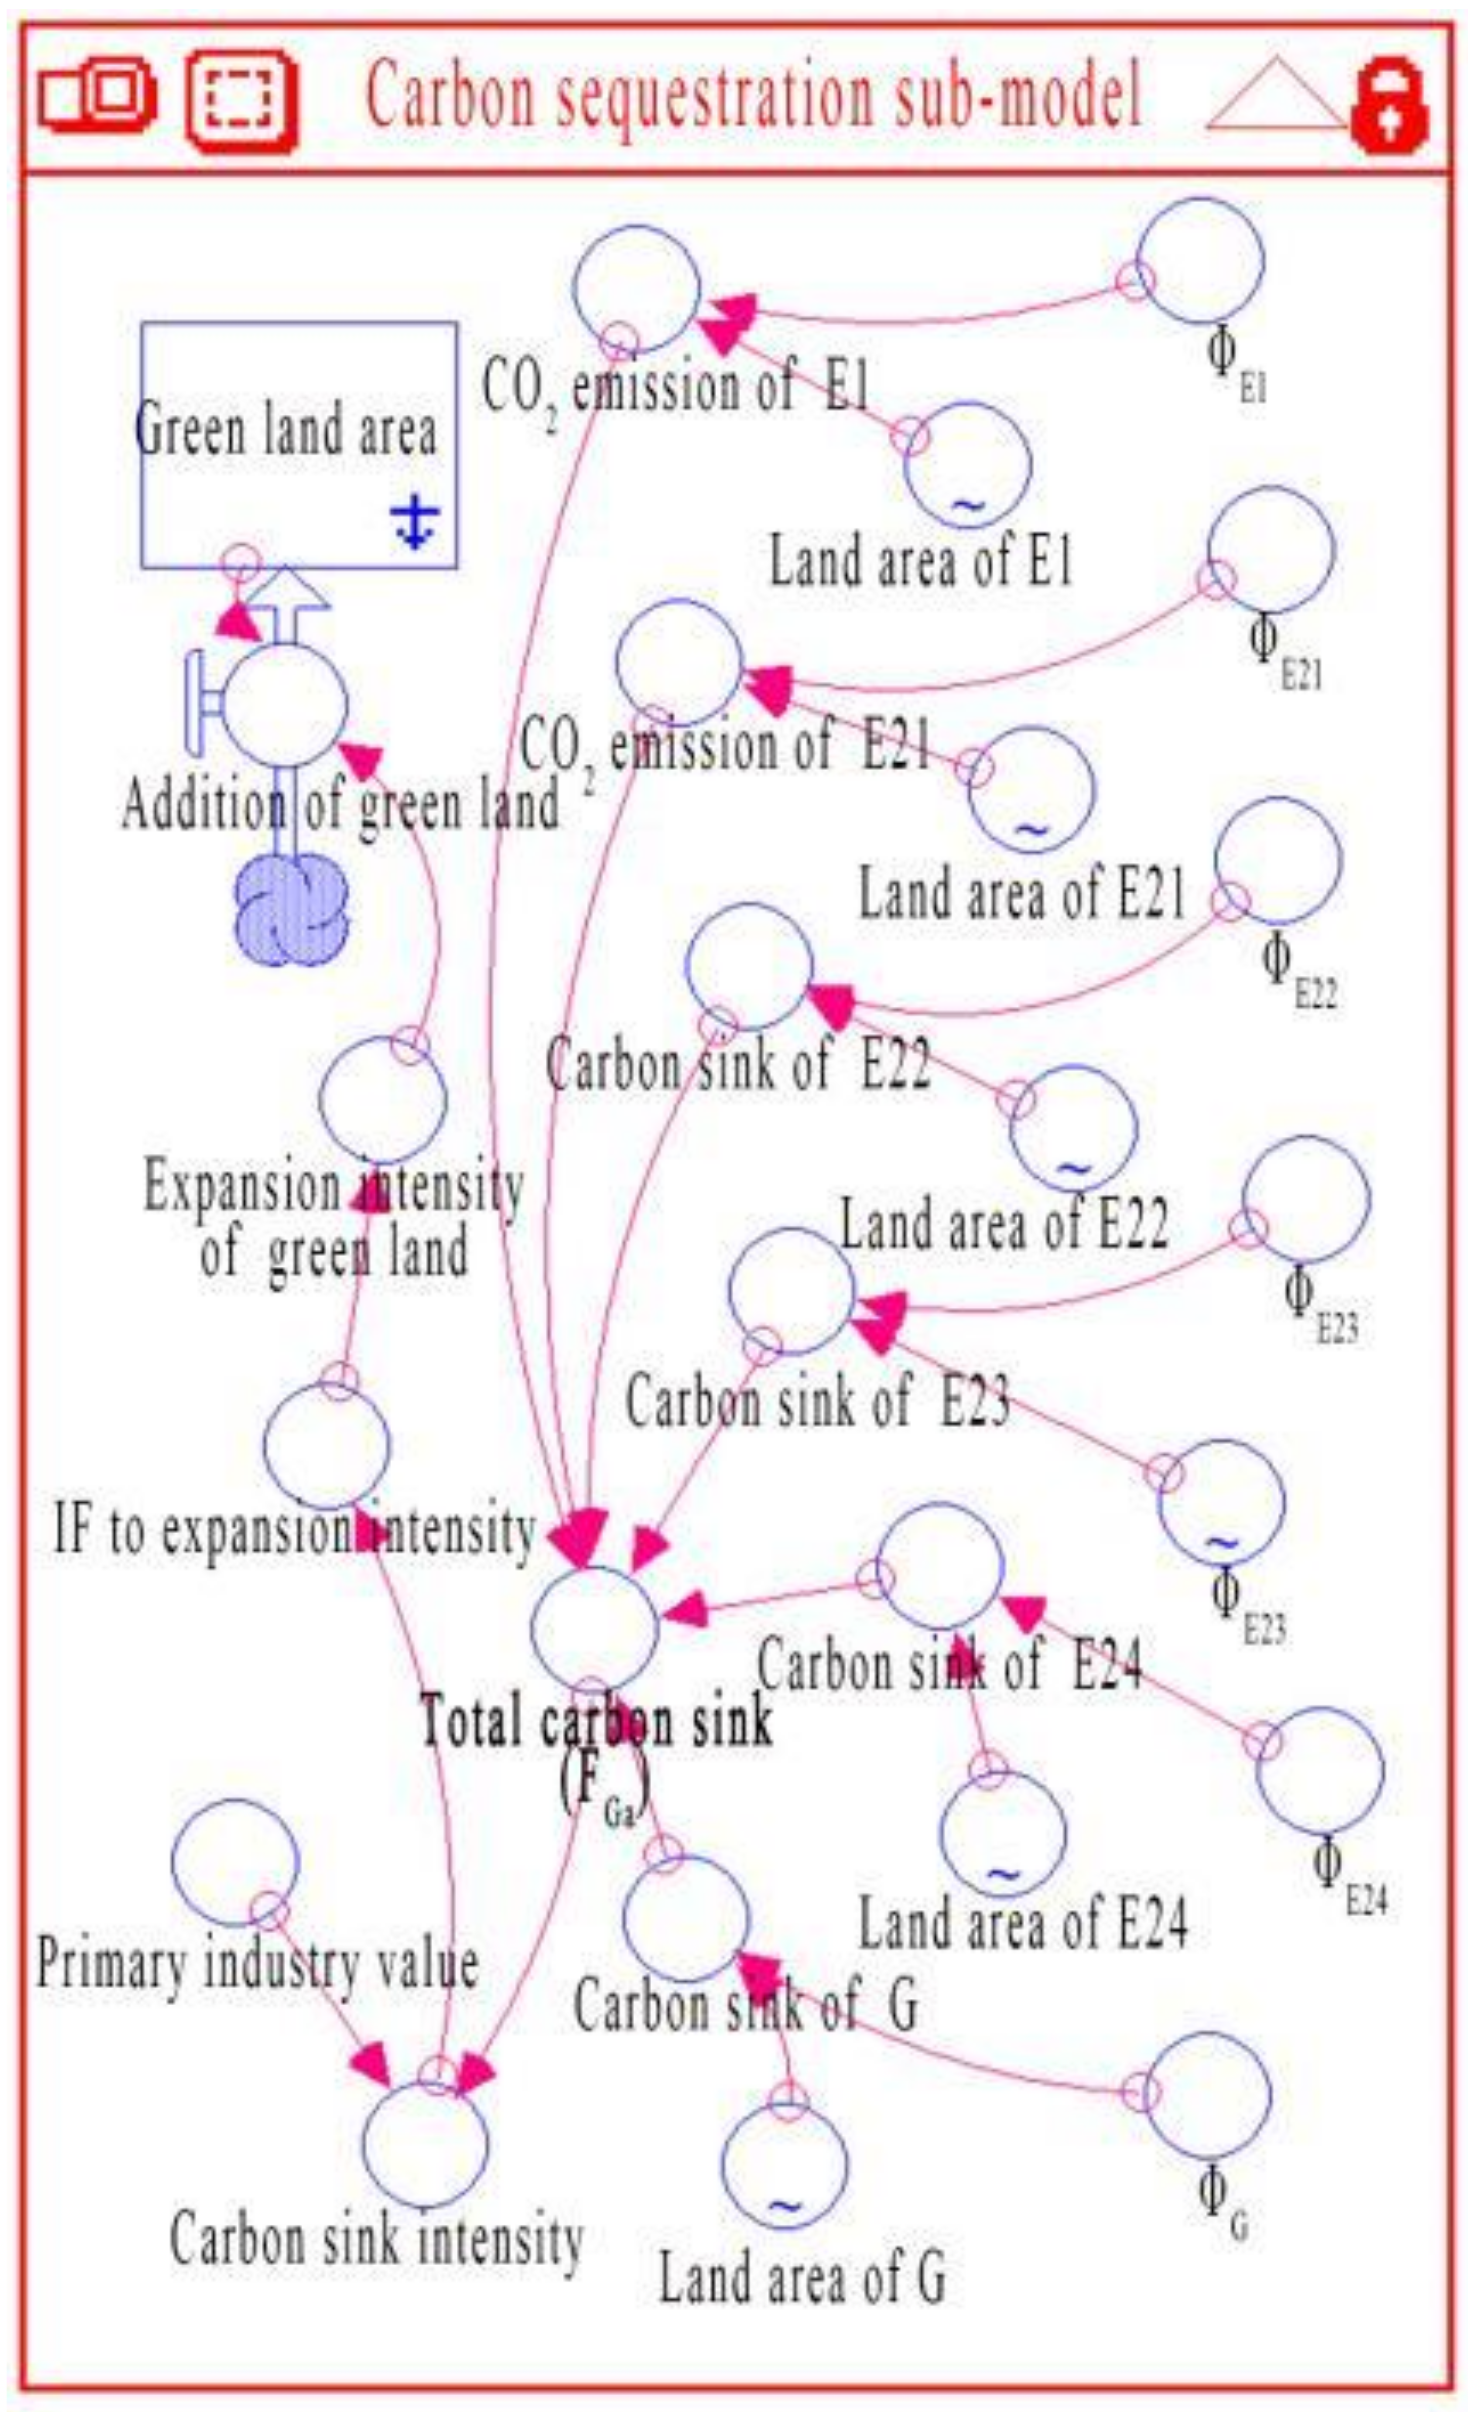
3.6. Carbon Sequestration Sub-Model
3.7. Data Source and Description
- Statistical yearbooks. Some data can be directly extracted from the statistical yearbooks, such as the number of households, the capita per household, the urban permanent population and the GDP of Changsha from 1949 to 2016; the GDP outputs of the construction industry, the commercial service industry and the transportation, storage, postal, etc. industries; the freight transport volume, the freight turnover, the passenger transport volume and the passenger turnover; the proportions of railway, highway, water transport and civil aviation in the total turnover; and the residential, industrial and total fossil energy consumption data. The energy consumption of the commercial sector is obtained by subtracting the energy consumption of the residential and industrial sectors. Some data are obtained through the secondary processing of the originally available data, for example, the carbon emissions intensity index from energy consumption in various industries can be calculated according to the total energy consumption and the industrial added value [41].
- Function fitting method. The time series method is used to perform regression and correlation analysis on the available data, and the fitting function determines parameter equations, such as the population growth rate, the GDP growth rate and other indicators.
- Table function method. For many nonlinear data relations, such as the carbon emissions intensities of various forms of energy consumption, the table function method is widely used in the model [42].
- Conditional function method. For known conditions that will change, and when the value of the function equation under different conditions is different, the expression of the conditional function is used in the model. For example, the traffic travel structure in the city will change with the change of the urban population, and the traffic travel ratio is expressed by the conditional function of the population size.
4. Results
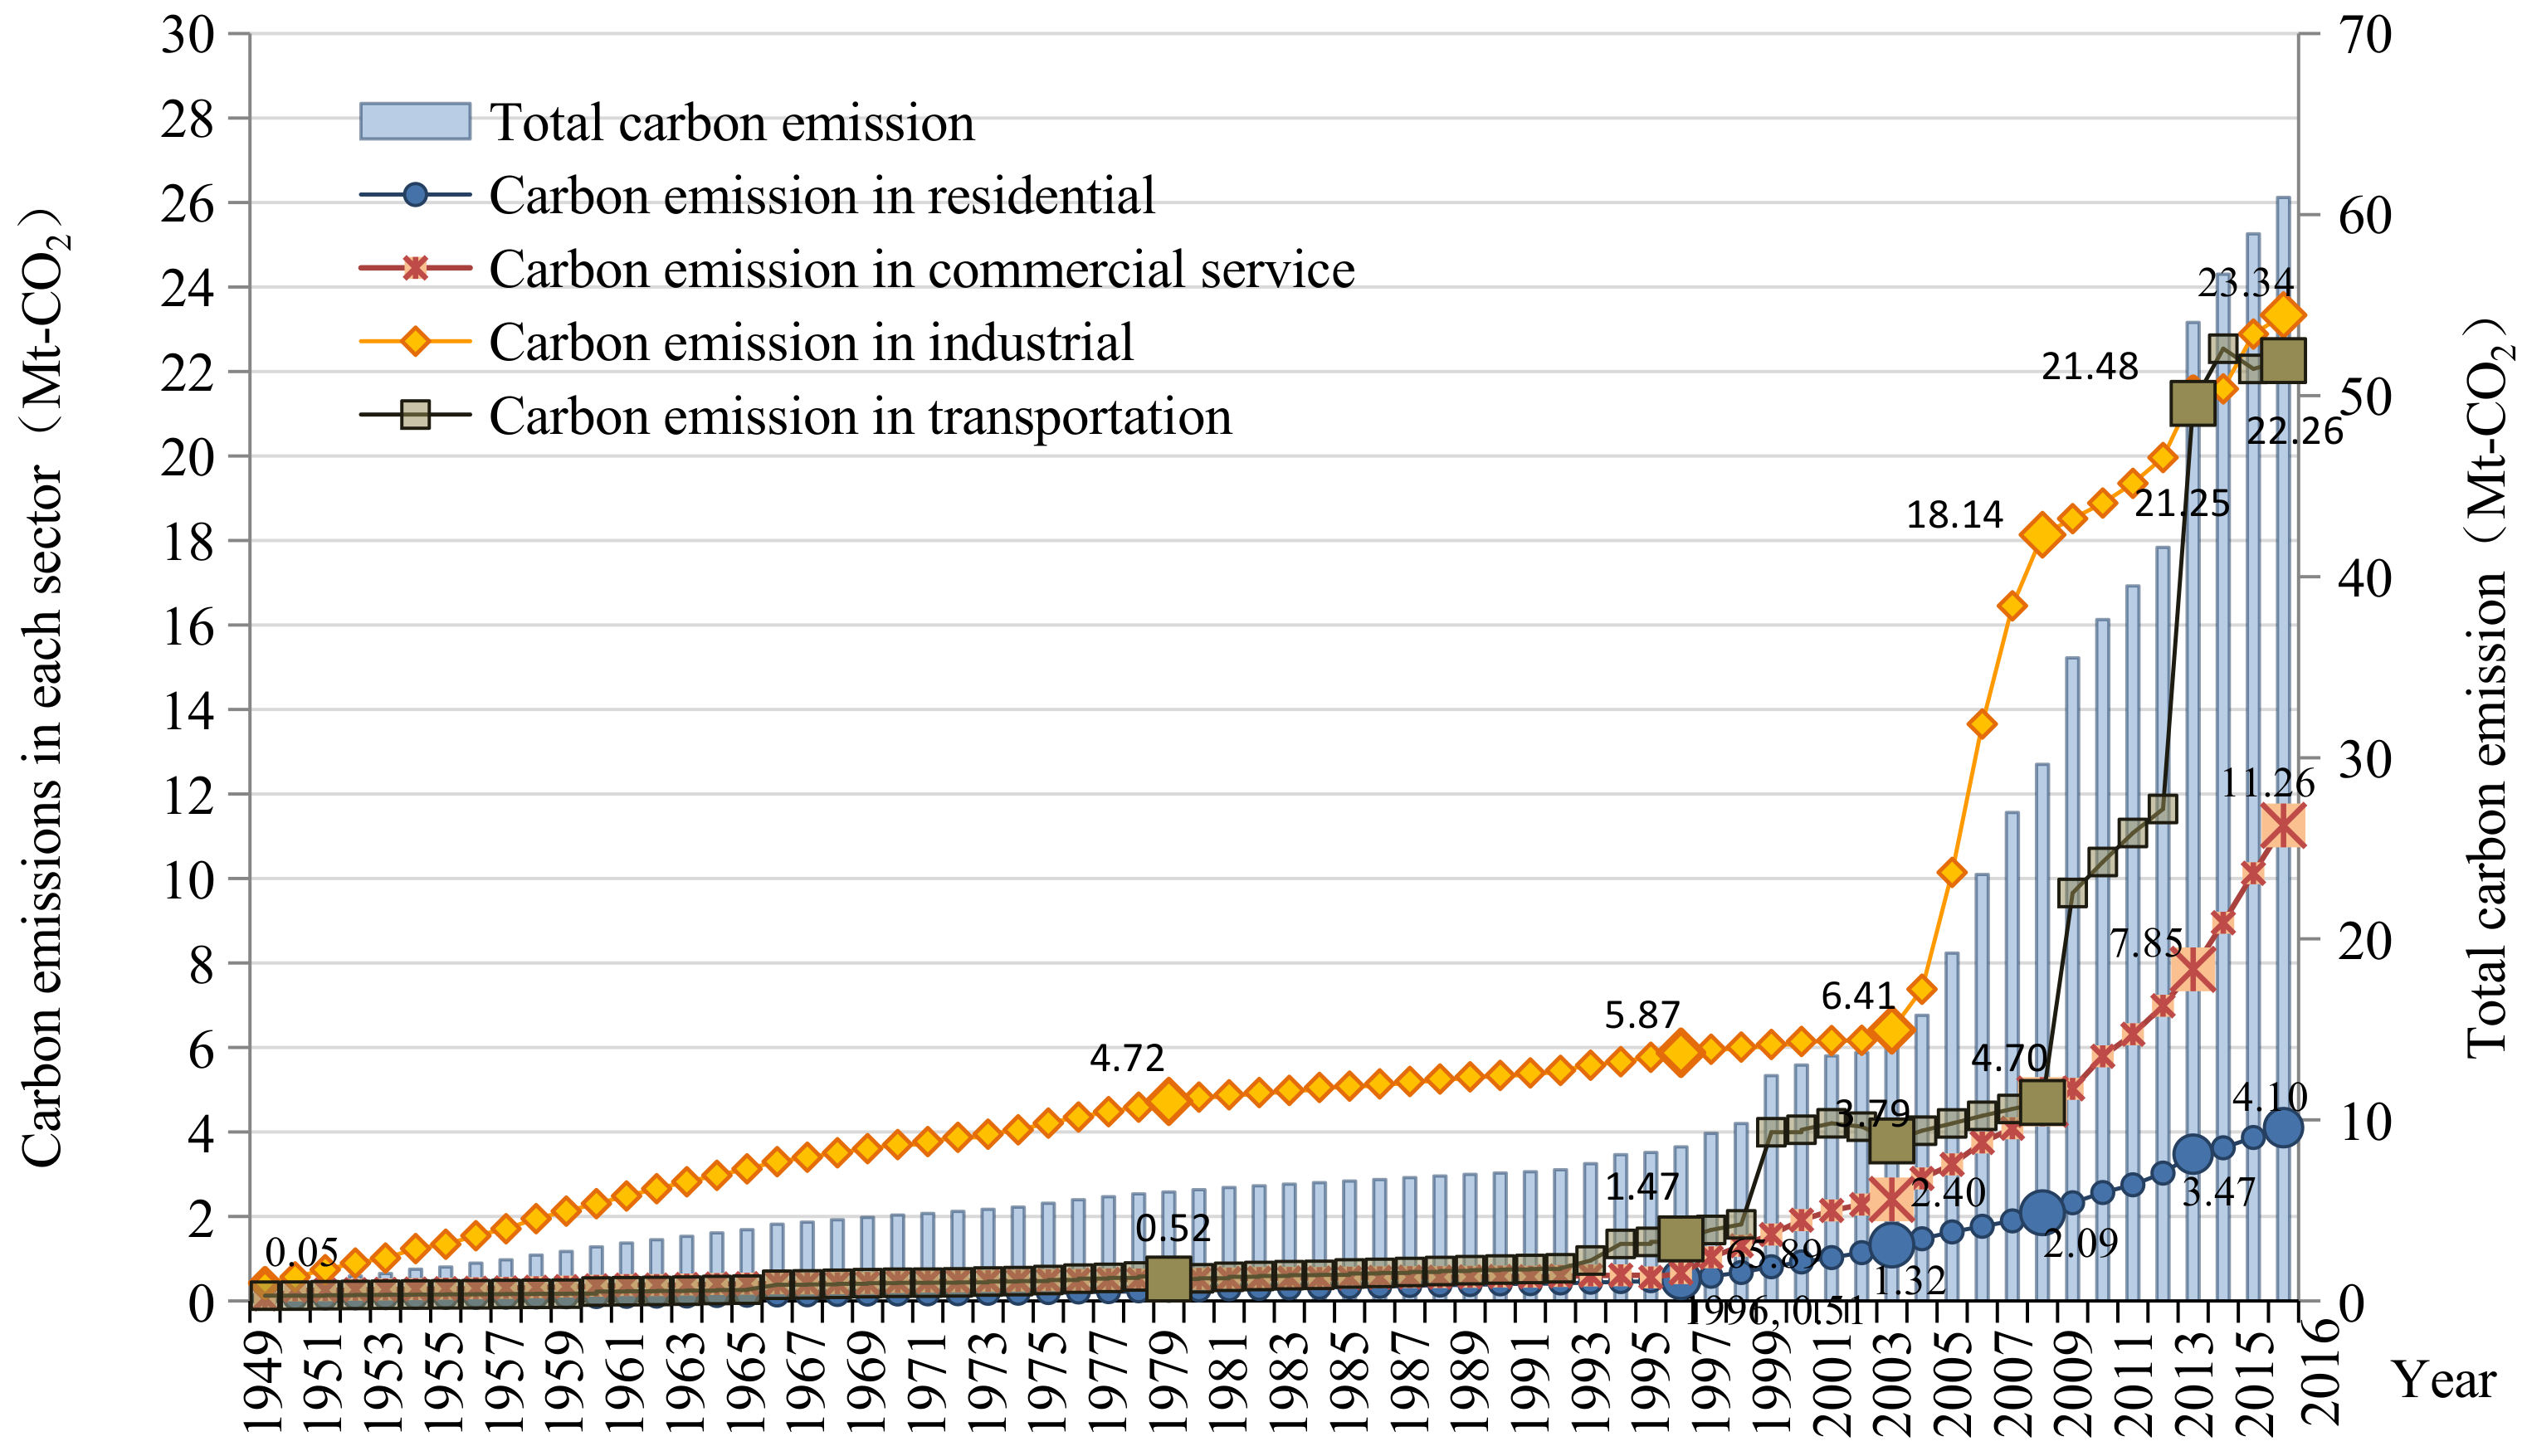
4.1. Total Carbon Emissions and Emissions in Each Sector
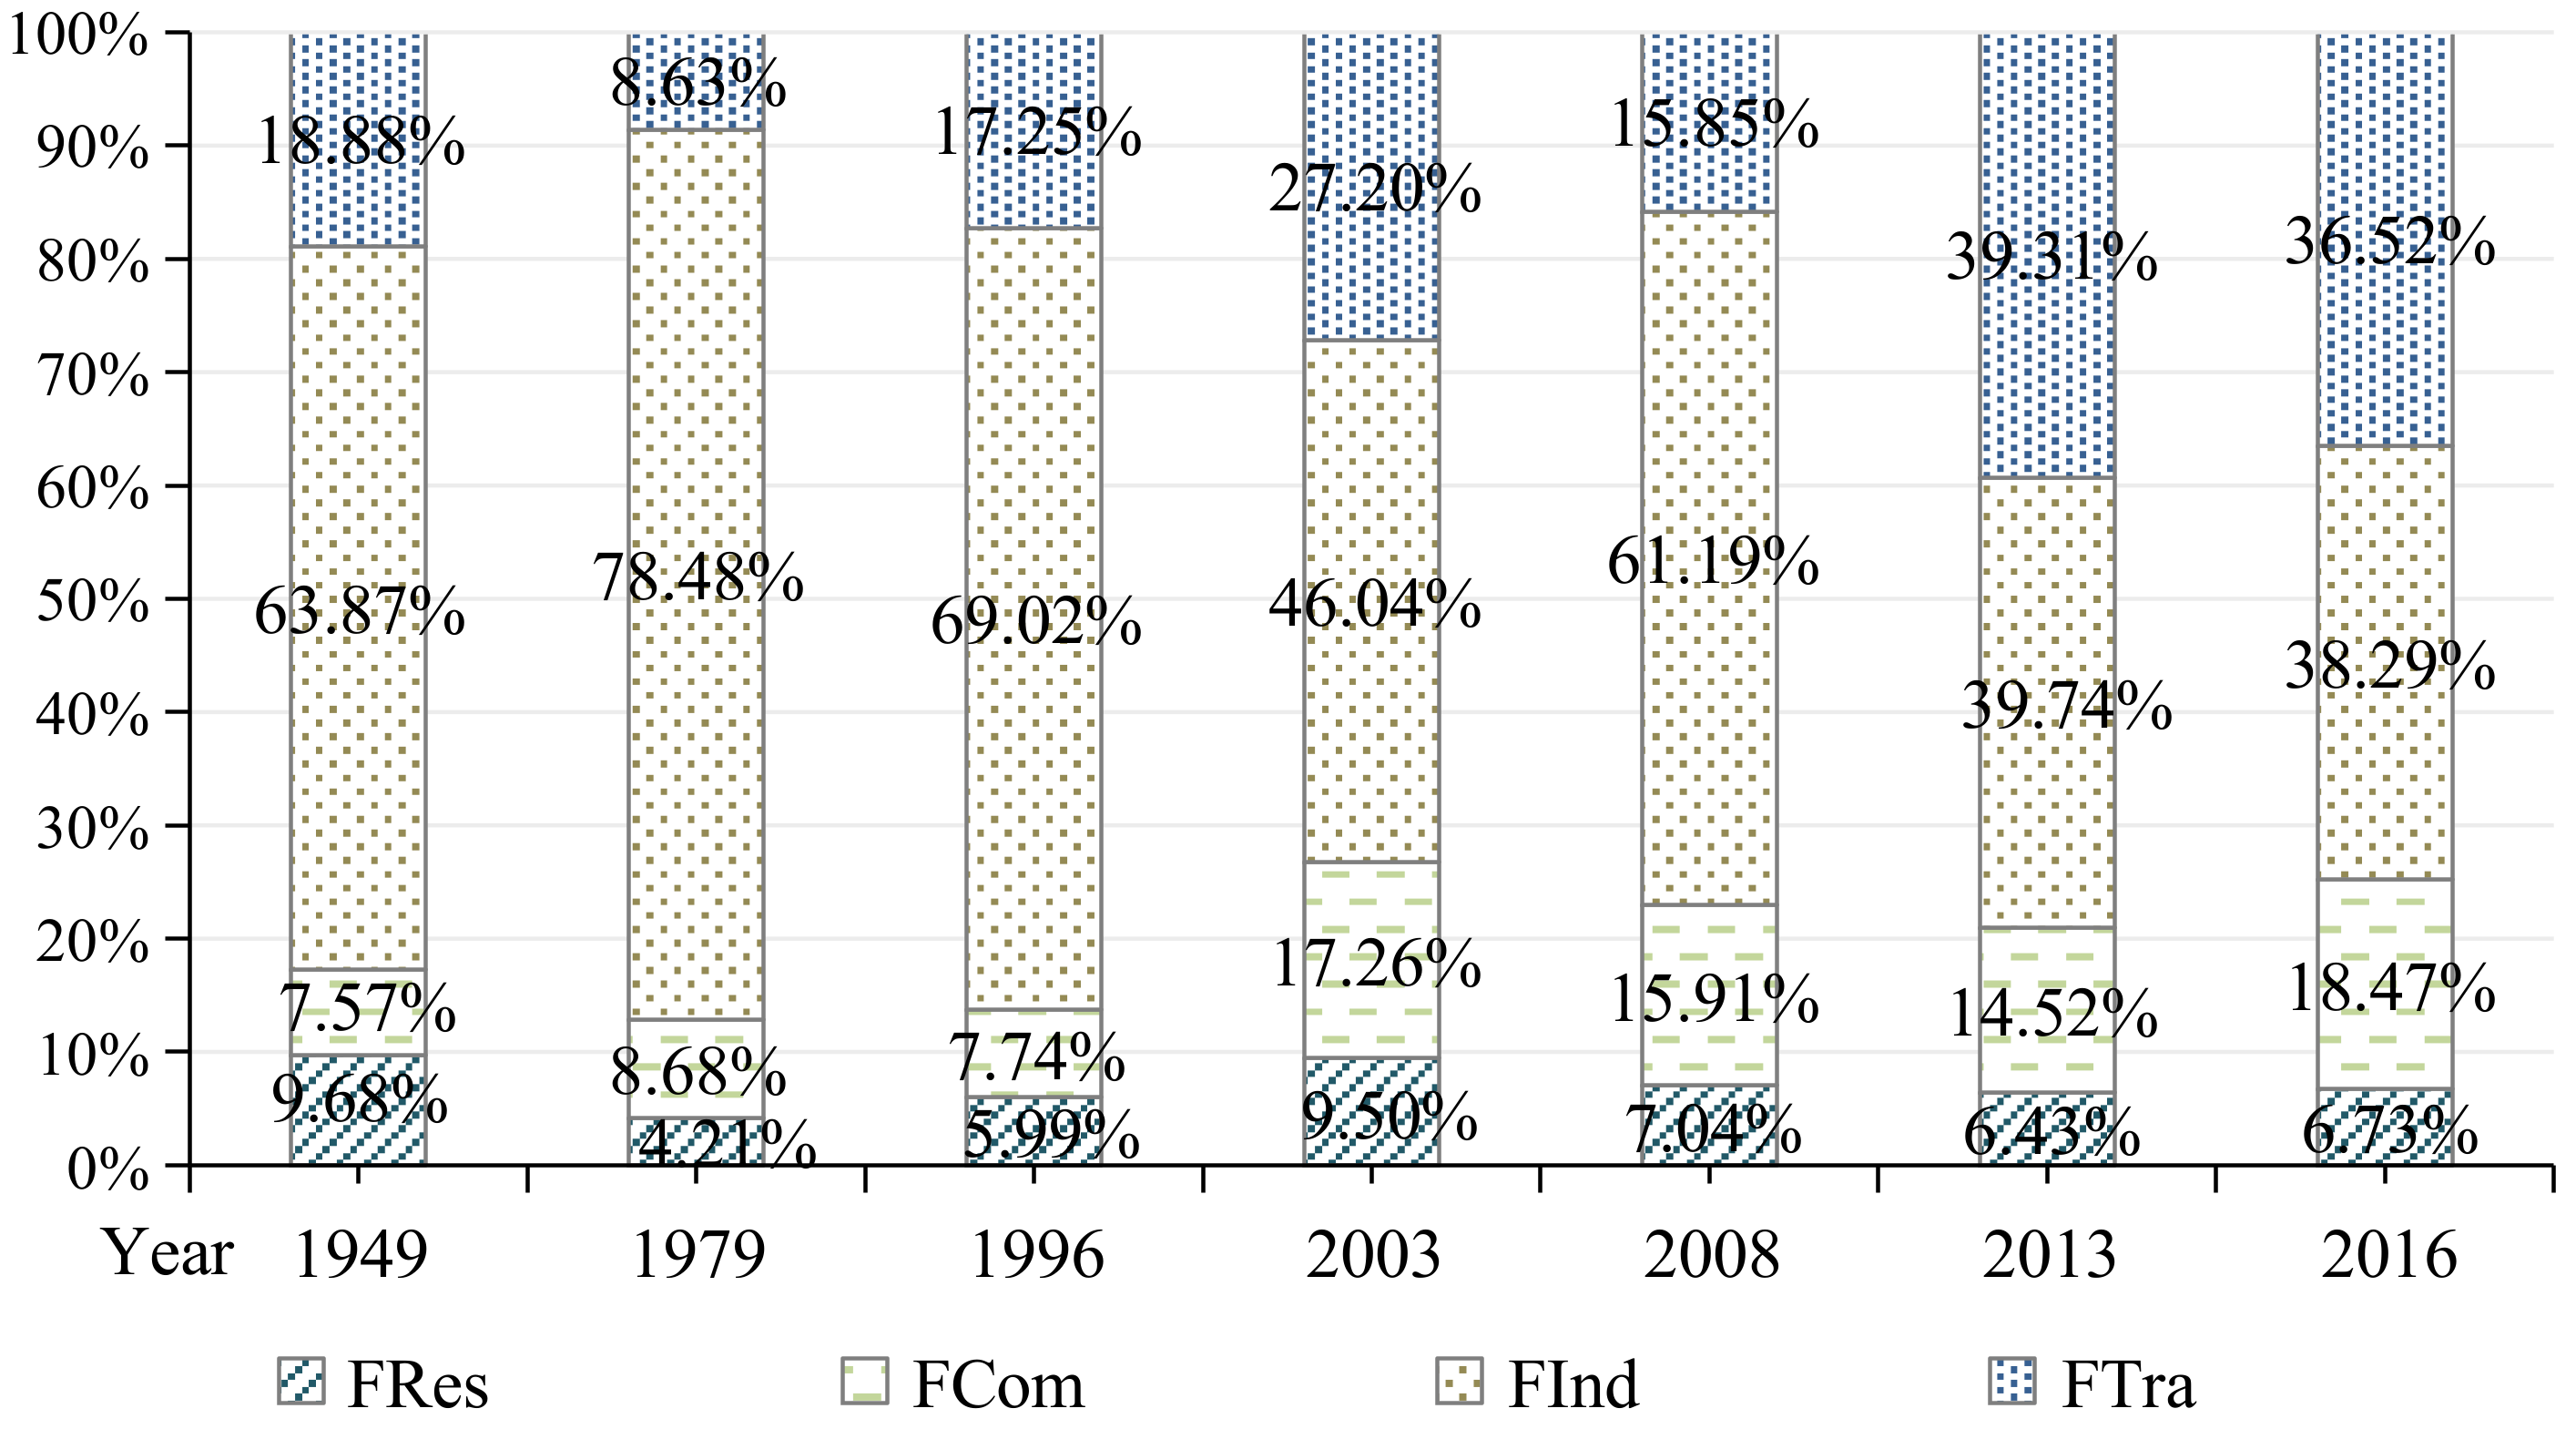
4.2. The Contribution of Each Sector
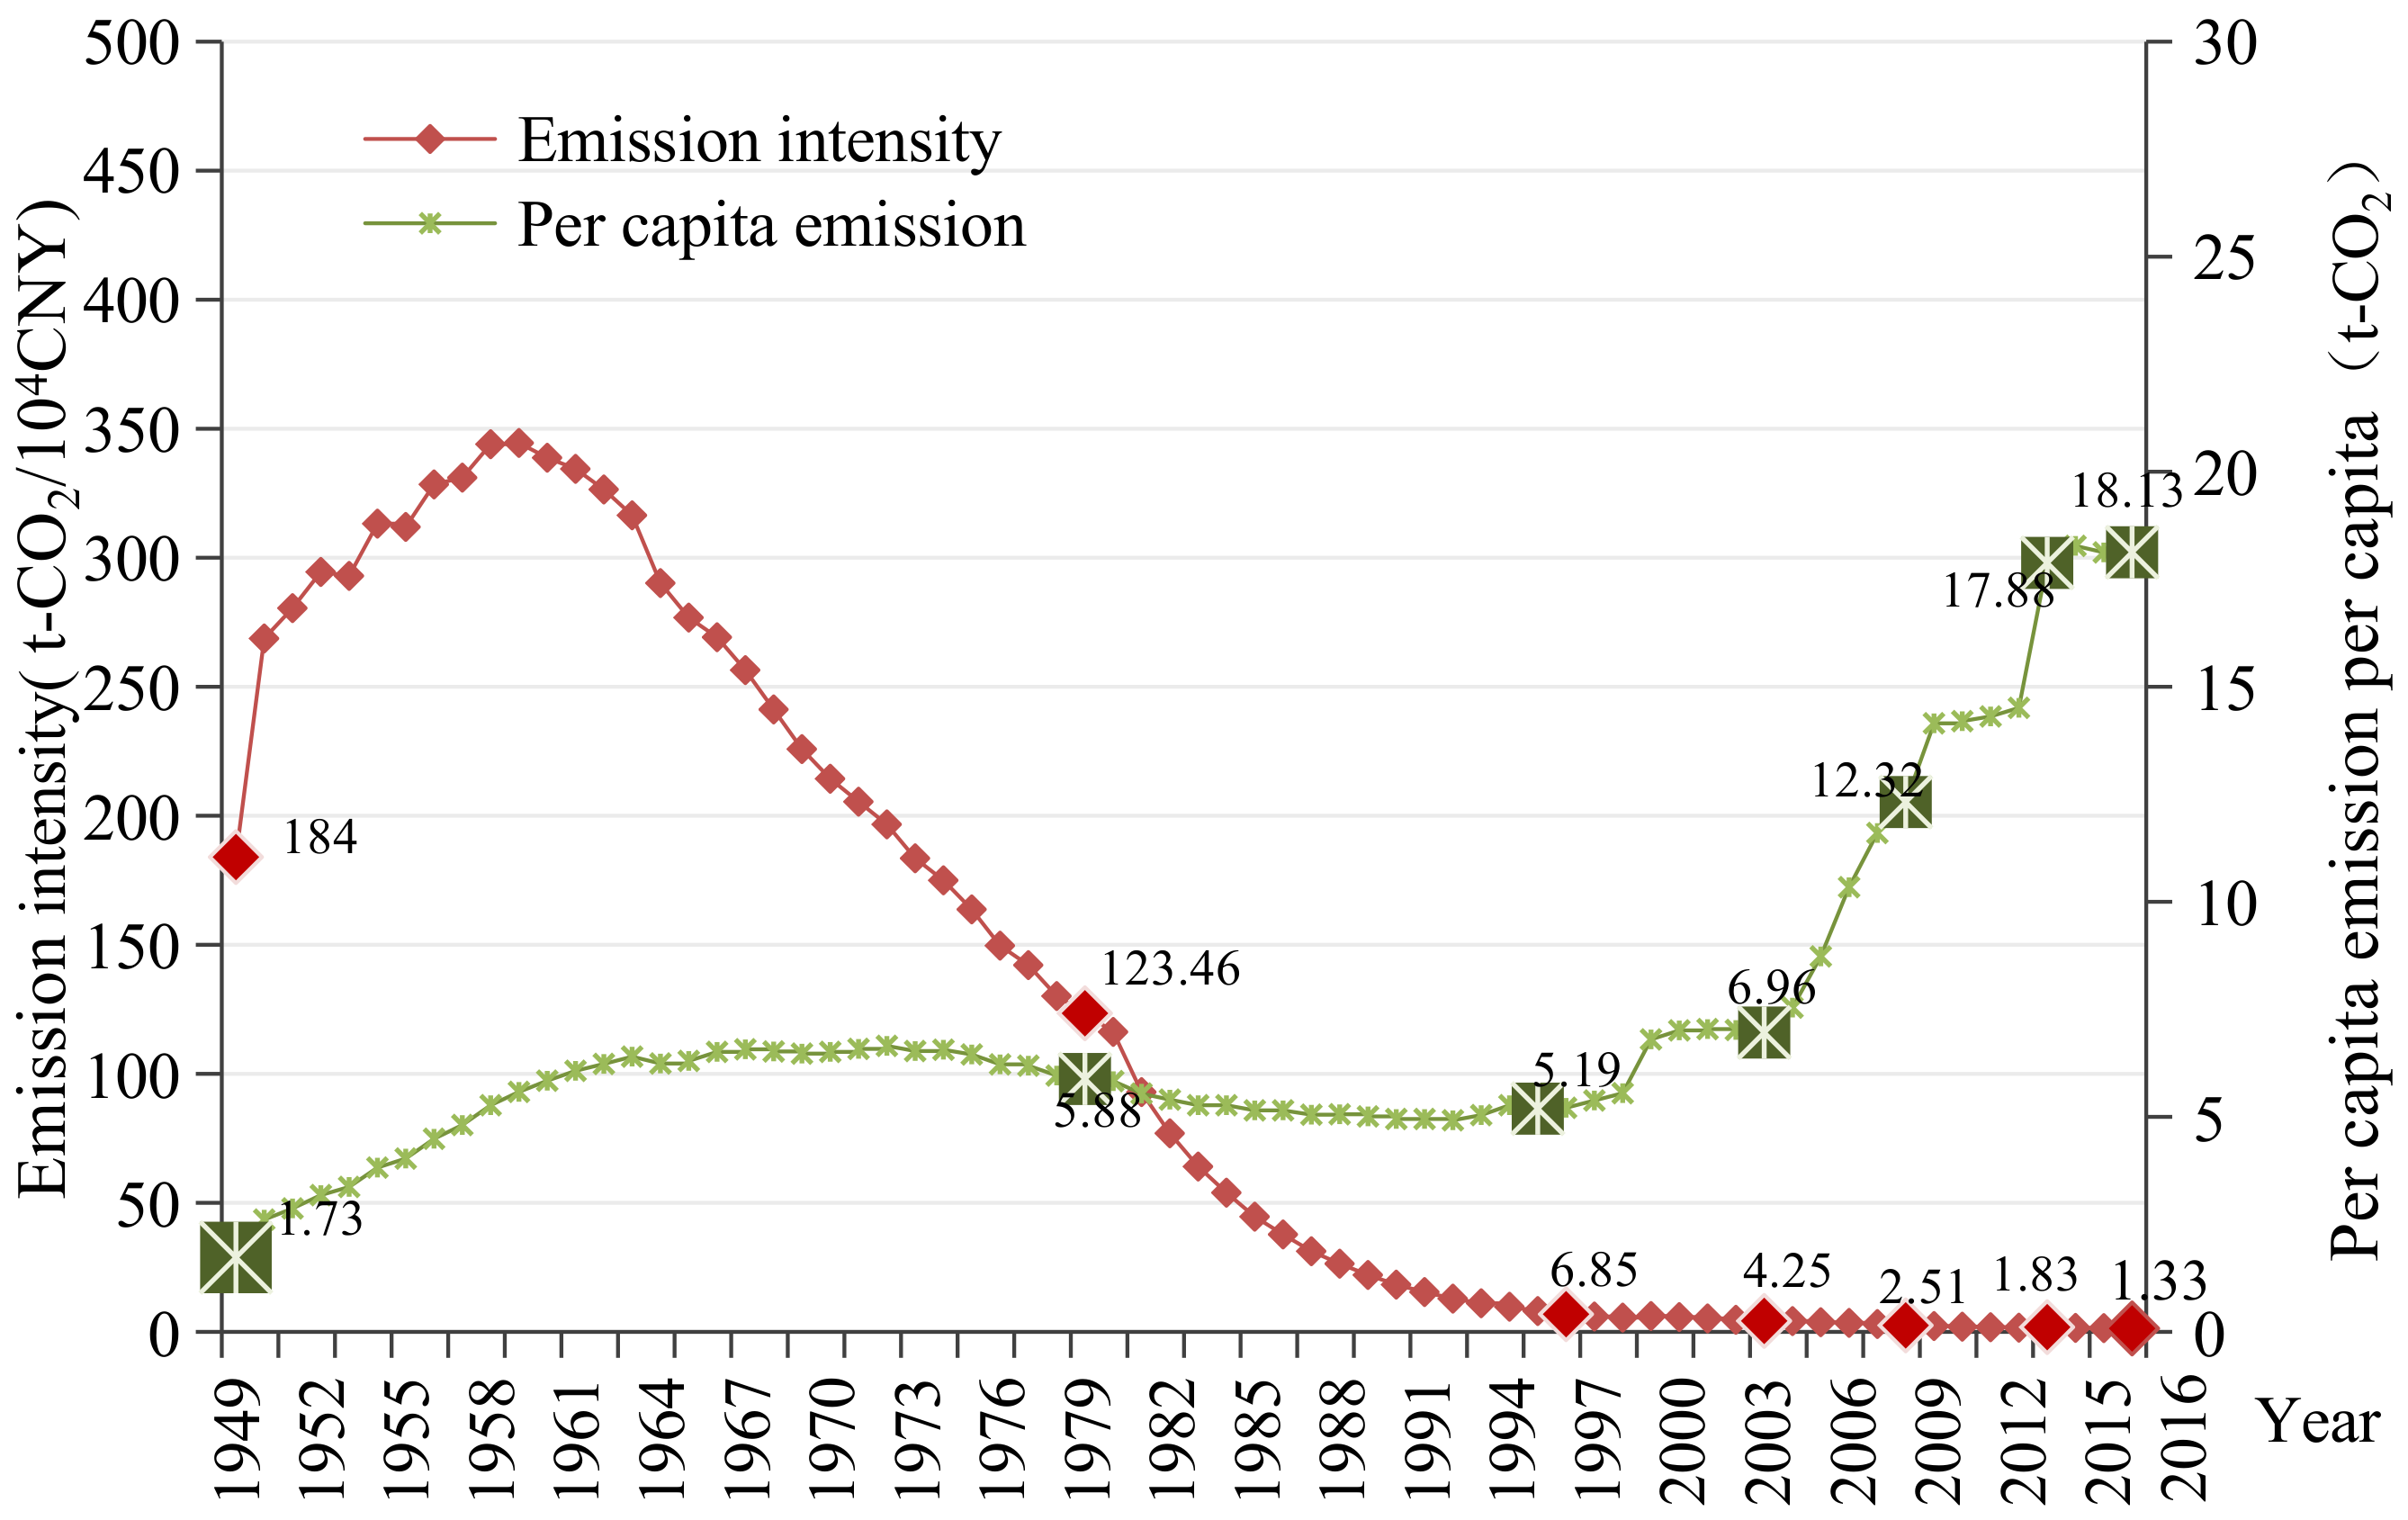
4.3. Emission Intensity and per Capita Emissions
4.4. Carbon Emissions per Unit Land Use
4.5. Correlation between Urban Spatial Evolution and Carbon Emissions
5. Discussion
- The total carbon emissions and rate of CO2 emissions per capita increase year by year. The per capita carbon emissions total was 6.96 t-CO2 per capita, which was lower than the national average before 2008 (7.2 t-CO2 in 2013), and became higher after 2008. In terms of emissions intensity, the carbon emissions per unit of GDP has decreased steadily from 344 t-CO2/CNY104 (1958) to 1.33 t-CO2/CNY104 (2016), while the carbon emissions per unit of land has generally declined, being stable in recent years only with a small fluctuation.
- There is a certain linear correlation between the compactness of urban form and the overall trend line of carbon emissions intensity, but the correlation is not absolute. The carbon emissions intensity has the greatest correlation with the expansion intensity of commercial land, followed by the expansion intensity of public green land, and has little correlation with the expansion intensity of industrial land.
- In terms of carbon emissions structure, the proportion of carbon emissions in the industrial sector is still important and accounts for up to 78%. Although, after 2008, with the increase in the intensity of industrial land expansion, the proportion of carbon emissions in the industrial sector had declined. However, the contribution rate is still close to 40%.
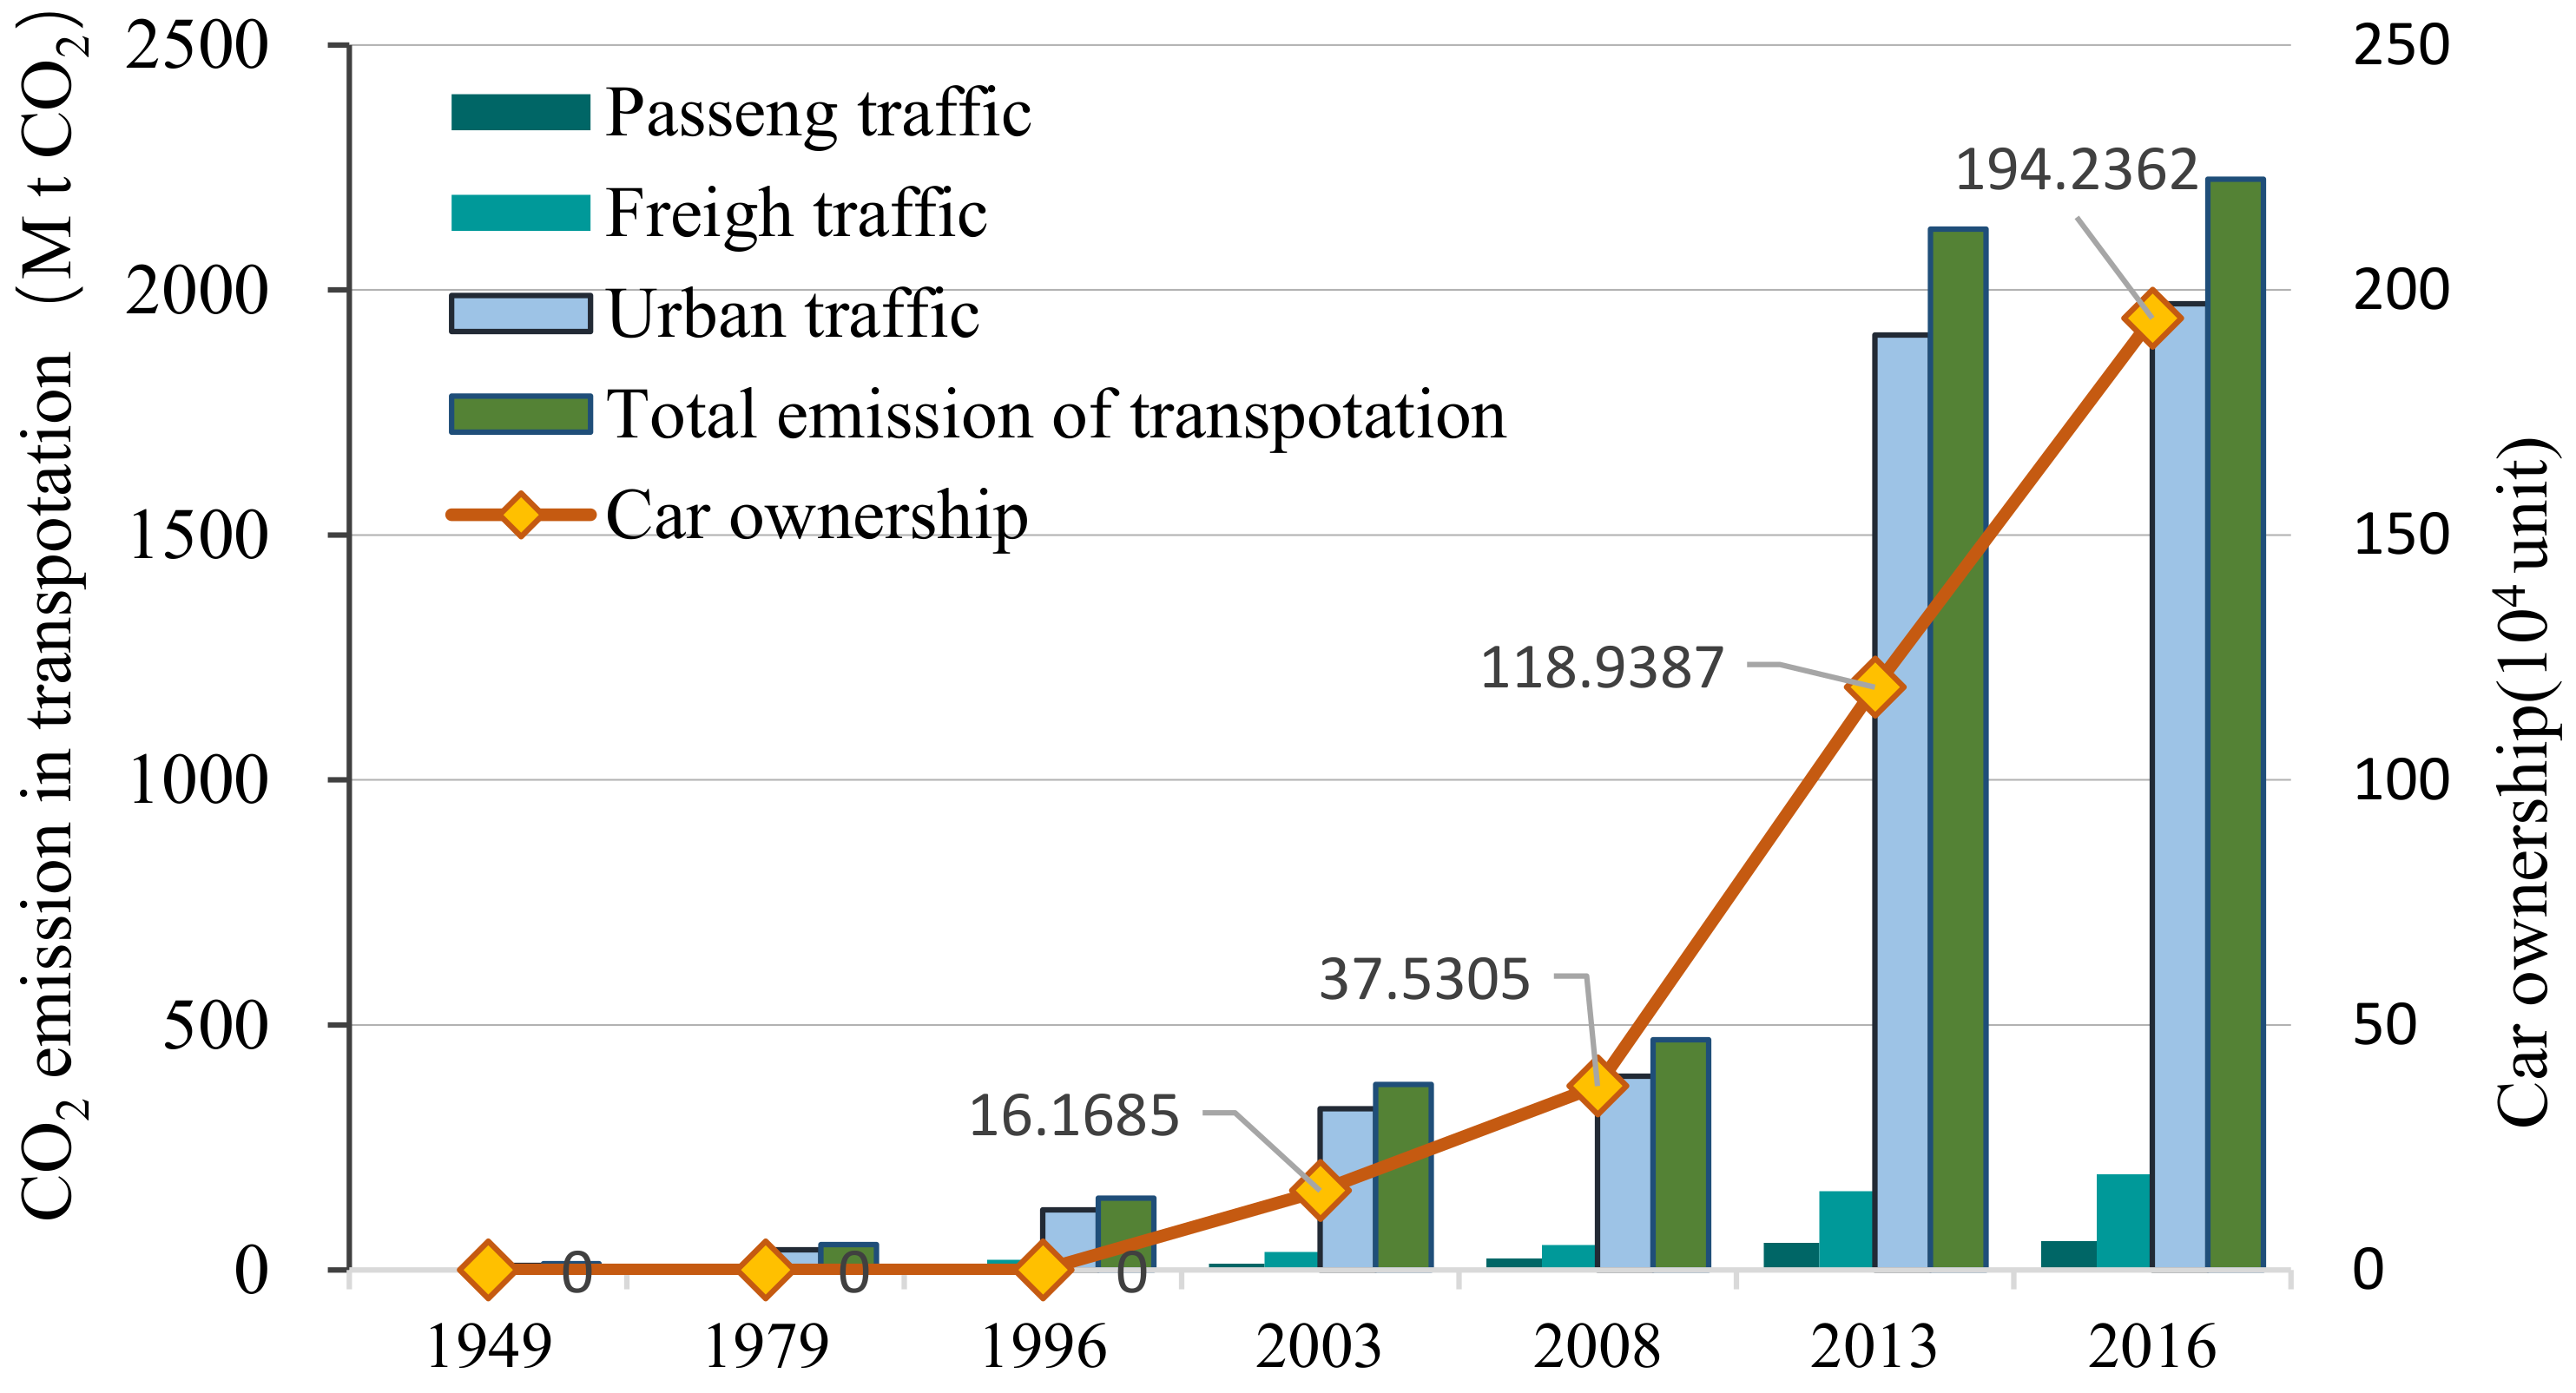
- Transportation carbon emissions have increased sharply with the increase of car ownership, accounting for more than 20% of the total emissions. Although Changsha rail transit began to operate in 2013, the growth trend of traffic carbon emissions has not been reduced. It shows that changes in the transportation structure cannot bring about rapid carbon reduction benefits.
- Nevertheless, the city is a huge system engineering. When using system dynamics for dynamic modeling, it is impossible to take all influencing factors into account. The urban form, patterns and neighborhood design issues (e.g., with respect to the same population density patterns, CO2 emissions can result quite differently depending on the urban building typology and assembly) are also important factors affecting carbon emissions. In order to avoid the complexity of the model, the carbon emissions system dynamics model established in this paper is mainly applicable to the urban scale, rather than the block scale, and pays more attention to the urban materials space. Therefore, the model considers the relationship between urban population scale, land scale, economic growth and other factors, and energy consumption and carbon emissions. The three trends themselves are complex. Due to the lack of urban energy consumption statistics in small and medium-sized cities in China, the model is only applicable to large cities or mega cities with urban energy consumption statistics.
6. Conclusions
- There may be a very important possible connection between carbon emissions and urban size. it is a remarkable issue, particularly in the southeastern city region settlements.
- It is necessary to strictly control the scale of cities, compact the urban spatial structure, and change the urban development model from “incremental development” to “stock development” to achieve smart urban growth. This move can promote the city of Changsha to achieve the 2030 carbon peak development goal as soon as possible.
- There is a need to speed up the adjustment and the optimization of the industrial and energy structures. Industrial development projects with low energy consumption and low emissions should be selected to settle in the industrial park so as to improve the energy use efficiency of industrial land. This is conducive to achieving the national policy goal of peaking carbon emissions in 2030 as soon as possible.
- Only by fundamentally reducing people’s dependence on cars for travel and reducing the number of motor vehicles can real carbon reduction be achieved. Therefore, future plans should fit more public transport into the land use, encourage mixed land development, and focus on the coordination of transportation planning and land use planning. With the convenience of transportation, people will naturally choose public transportation to travel, further advocating that green transportation cannot be forced by the government.
Author Contributions
Funding
Institutional Review Board Statement
Informed Consent Statement
Data Availability Statement
Conflicts of Interest
References
- Stella, T.; Katerina, T.; Theodoros, T.; Dimitrios, B. Urban Warming and Cities’ Microclimates: Investigation Methods and Mitigation Strategies—A Review. Energies 2020, 13, 1414. [Google Scholar]
- Minna, S. Energy Efficiency and Low-Carbon Technologies in Urban Renewal. Build. Res. Inf. 2006, 34, 521–533. [Google Scholar]
- Genice, K.; Grande, A.; Jorge, M.; Islas, S. Boosting Energy Efficiency and Solar Energy Inside the Residential, Commercial, and Public Services Sectors in Mexico. Energies 2020, 13, 5601. [Google Scholar]
- Flavio, R.; Arroyo, M.; Miguel, L.J. Low-Carbon Energy Governance: Scenarios to Accelerate the Change in the Energy Matrix in Ecuador. Energies 2020, 13, 4731. [Google Scholar]
- Geoffrey, S.Q.; Chen, Q.; Tang, B.; Stanley, Y. A System Dynamics Model for the Sustainable Land Use Planning and Development. Habitat Int. 2010, 33, 15–25. [Google Scholar]
- Sun, W.; Ren, C. Short-Term Prediction of Carbon Emissions Based on the Eemd-Psobp Model. Environ. Sci. Pollut. Res. 2021, 7, 56580–56594. [Google Scholar] [CrossRef]
- Li, Y. Forecasting Chinese Carbon Emissions Based on a Novel Time Series Prediction Method. Energy Sci. Eng. 2020, 8, 2274–2285. [Google Scholar] [CrossRef] [Green Version]
- Kabindra, A.; Phillip, R.O.; Zamir, L.; Skye, W. Assessing Soil Organic Carbon Stock of Wisconsin, USA and Its Fate under Future Land Use and Climate Change. Sci. Total Environ. 2019, 667, 833–845. [Google Scholar]
- Liu, Y.; Jin, S. Temporal and Spatial Evolution Characteristics and Influencing Factors of Energy Consumption Carbon Emissions in Six Provinces of Central China. Econ. Geogr. 2019, 39, 182–191. [Google Scholar]
- Su, X.; Lin, X. Analysis of Temporal and Spatial Evolution Characteristics and Influencing Factors of Carbon Emission in Beijing, Tianjin and Hebei Based on Night Light Data. J. Cap. Norm. Univ. 2019, 40, 48–57. [Google Scholar]
- Hanif, I. Impact of fossil fuels energy consumption, energy policies, and urban sprawl on carbon emissions in East Asia and the Pacific: A panel investigation. Energy Strategy Rev. 2018, 21, 16–24. [Google Scholar] [CrossRef]
- Fudge, S.; Peters, M. Behaviour Change in the UK Climate Debate: An Assessment of Responsibility, Agency and Political Dimensions. Sustainability 2011, 3, 789–808. [Google Scholar] [CrossRef] [Green Version]
- Pan, H.X.; Tang, Y.; Wu, J.Y.; Lu, Y.; Zhang, Y.F. Spatial planning strategy for Low Carbon Cities in China. Urban Plan. Forum 2008, 6, 57–64. [Google Scholar]
- Wee, K.F.; Hiroshi, M.; Chin, S.H. Energy Consumption and Carbon Dioxide Emission Considerations in the Urban Planning Process in Malaysia. J. Malays. Inst. Plan. 2008, 6, 101–130. [Google Scholar]
- Wee, K.F.; Hiroshi, M.; Yu, F.L. Application of System Dynamics Model as Decision Making Tool in Urban Planning Process toward Stabilizing Carbon Dioxide Emissions from Cities. Build. Environ. 2009, 44, 1528–1537. [Google Scholar]
- Chen, J.D.; Gao, M.; Cheng, S.L.; Liu, X.; Fan, W. China’s City-Level Carbon Emissions During 1992–2017 Based on the Inter-Calibration of Nighttime Light Data. Sci. Rep. 2021, 11, 1–13. [Google Scholar]
- Feng, Y.Y.; Chen, S.Q.; Zhang, L.X. System Dynamics Modeling for Urban Energy Consumption and CO2 Emissions: A Case Study of Beijing, China. Ecol. Model. 2013, 252, 44–52. [Google Scholar] [CrossRef]
- Yuan, Q.M.; Liu, Q.; Liu, J. On the Reduced Urban Carbon Emission and an Analysis of Such Reduced Emission Potential Based on the Dynamic System by Taking Tianjin as a Case Sample. J. Saf. Environ. 2009, 16, 256–261. [Google Scholar]
- Tong, H.F.; Cao, Y.; Yu, J.; Qu, W. The Urban Sustainable Development Based on System Dynamics Model: The Case of Beijing. Future Dev. 2010, 33, 10–17. [Google Scholar]
- Wu, M.; Ren, L.; Chen, Y.R. System Dynamics Simulation of Carbon Emission from Urban Land Use: A Case Study of Wuhan City. China Land Sci. 2017, 31, 29–39. [Google Scholar]
- Xu, J.; Kang, J. Comparison of Ecological Risk among Different Urban Patterns Based on System Dynamics Modeling of Urban Development. J. Urban Plan. Dev. 2017, 14, 04016034. [Google Scholar] [CrossRef]
- Sun, Y.H.; Liu, N.N.; Zhang, J.Y. The Urban Sustainable Development Based on System Dynamics Model: The Case of Dalian. China Econ. Stat. Q. 2016, 6, 135–148. [Google Scholar]
- Guo, J. The Coordination of Industrial Structure Adjustment and Spatial Structure Optimization of Urban under the Low Carbon Traget: Taking Hangzhou as an Example. Urban Dev. Stud. 2010, 17, 25–28. [Google Scholar]
- Li, Z.W.; Quan, S.J.; Yang, P.J. Energy Performance Simulation for Planning a Low Carbon Neighborhood Urban District: A Case Study in the City of Macau. Habitat Int. 2016, 53, 206–214. [Google Scholar] [CrossRef]
- Ewing, R.; Rong, F. The Impact of Urban Form on U.S. Residential Energy Use. Hous. Policy Debate 2008, 19, 1–30. [Google Scholar] [CrossRef]
- Chen, Z.Q.; Lin, X.B.; Li, L. Does Urban Spatial Morphology Affect Carbon Emission?: A Study Based on 110 Prefectural Cities. Ecol. Econ. 2016, 32, 22–26. [Google Scholar]
- Carpio, A.; Ponce-Lopez, R.; Lozano-García, D.F. Urban form, land use, and cover change and their impact on carbon emissions in the Monterrey Metropolitan area, Mexico. Urban Clim. 2021, 39, 100947. [Google Scholar] [CrossRef]
- Hong, Y.; Xiao, Y.H.; Yu, S. A sustainable urban form: The challenges of compactness from the viewpoint of energy consumption and carbon emission. Energy Build. 2015, 93, 90–98. [Google Scholar]
- Li, J.J. Study on Relationship between Urban Spatial form and Intensity of Urban Land use Carbon Emission—Taking Shanghai as an example. J. Shanxi Agric. Univ. 2016, 15, 110–114. [Google Scholar]
- Shao, Z.F.; Sumari, N.S.; Portnov, A. Urban sprawl and its impact on sustainable urban development: A combination of remote sensing and social media data. Geo-Spat. Inf. Sci. 2021, 2, 241–255. [Google Scholar] [CrossRef]
- Zhang, M.; Chen, Y.R.; Zhou, H. Study on the Relationship of the Level of Land Intensive Use and Land use Carbon Emission Based on Panel Data—A Case Study of Central Cities in HuBei Province From 1996 to 2010. Resour. Environ. Yangtze Basin 2015, 9, 1464–1470. [Google Scholar]
- Liu, L.Y.; Zheng, B.H.; Komi, B.B. Quantitative Analysis of Carbon Emissions for New Town Planning Based on the Aystem Dynamics Approach. Sustain. Cities Soc. 2018, 42, 38–546. [Google Scholar]
- Liu, L.Y.; Zheng, B.H.; Zheng, J. Simulation of Carbon Emission Scenario for New Town Based on Spatial Quantitative Analysis: A Case Study of Xishan Low Carbon Demonstration Region, China. Nat. Environ. Pollut. Technol. 2016, 15, 1055–1063. [Google Scholar]
- Thinh, N.X.; Arlt, G.; Heber, B. Evaluation of Urban Land-use Structures with a View to Sustainable Development. Environ. Impact Assess. Rev. 2002, 22, 475–492. [Google Scholar] [CrossRef]
- Joo, K.S. Changes of Built-up Areas of Korean Cities by Urbanization: 1920–1960. Ann. Tohoku Geogr. Asoc. 2010, 33, 212–223. [Google Scholar] [CrossRef] [Green Version]
- Tate, C.M.; Cuffney, T.F.; Mcmahon, G. Use of an urban intensity index to assess urban effects on streams in three contrasting environmental settings. Am. Fish. Soc. Symp. 2005, 47, 291–315. [Google Scholar]
- Jay, W.F.; John, N.W. World Dynamics. IEEE Trans. Syst. Man Cybern. 1972, 2, 558–559. [Google Scholar]
- Meadows, D.H. The Limits to Growth; Chelsea Green Pub: London, UK, 2013; pp. 101–112. [Google Scholar]
- Feng, Y.Y.; Zhang, L.X. Scenario Analysis of Urban Energy Saving and Carbon Emission Reduction Policies: A Case study of Beijing. Resour. Sci. 2013, 34, 541–550. [Google Scholar]
- Li, Z.H.; Dong, S.C.; Li, Y. The Improvement of CO2, Emission Reduction Policies Based on System Dynamics Method in Traditional Industrial Region with Large CO2 Emission. Energy Policy 2012, 51, 683–695. [Google Scholar]
- Yang, X.L.; Yin, J.H. Slope stability analysis with nonlinear failure criterion. J. Eng. Mech. 2004, 130, 267–273. [Google Scholar] [CrossRef]
- Chen, X.P.; Wang, G.K.; Guo, X.J.; Fu, J.X. An Analysis Based on SD Model for Energy-Related CO2 Mitigation in the Chinese Household Sector. Energies 2016, 9, 1062. [Google Scholar] [CrossRef] [Green Version]
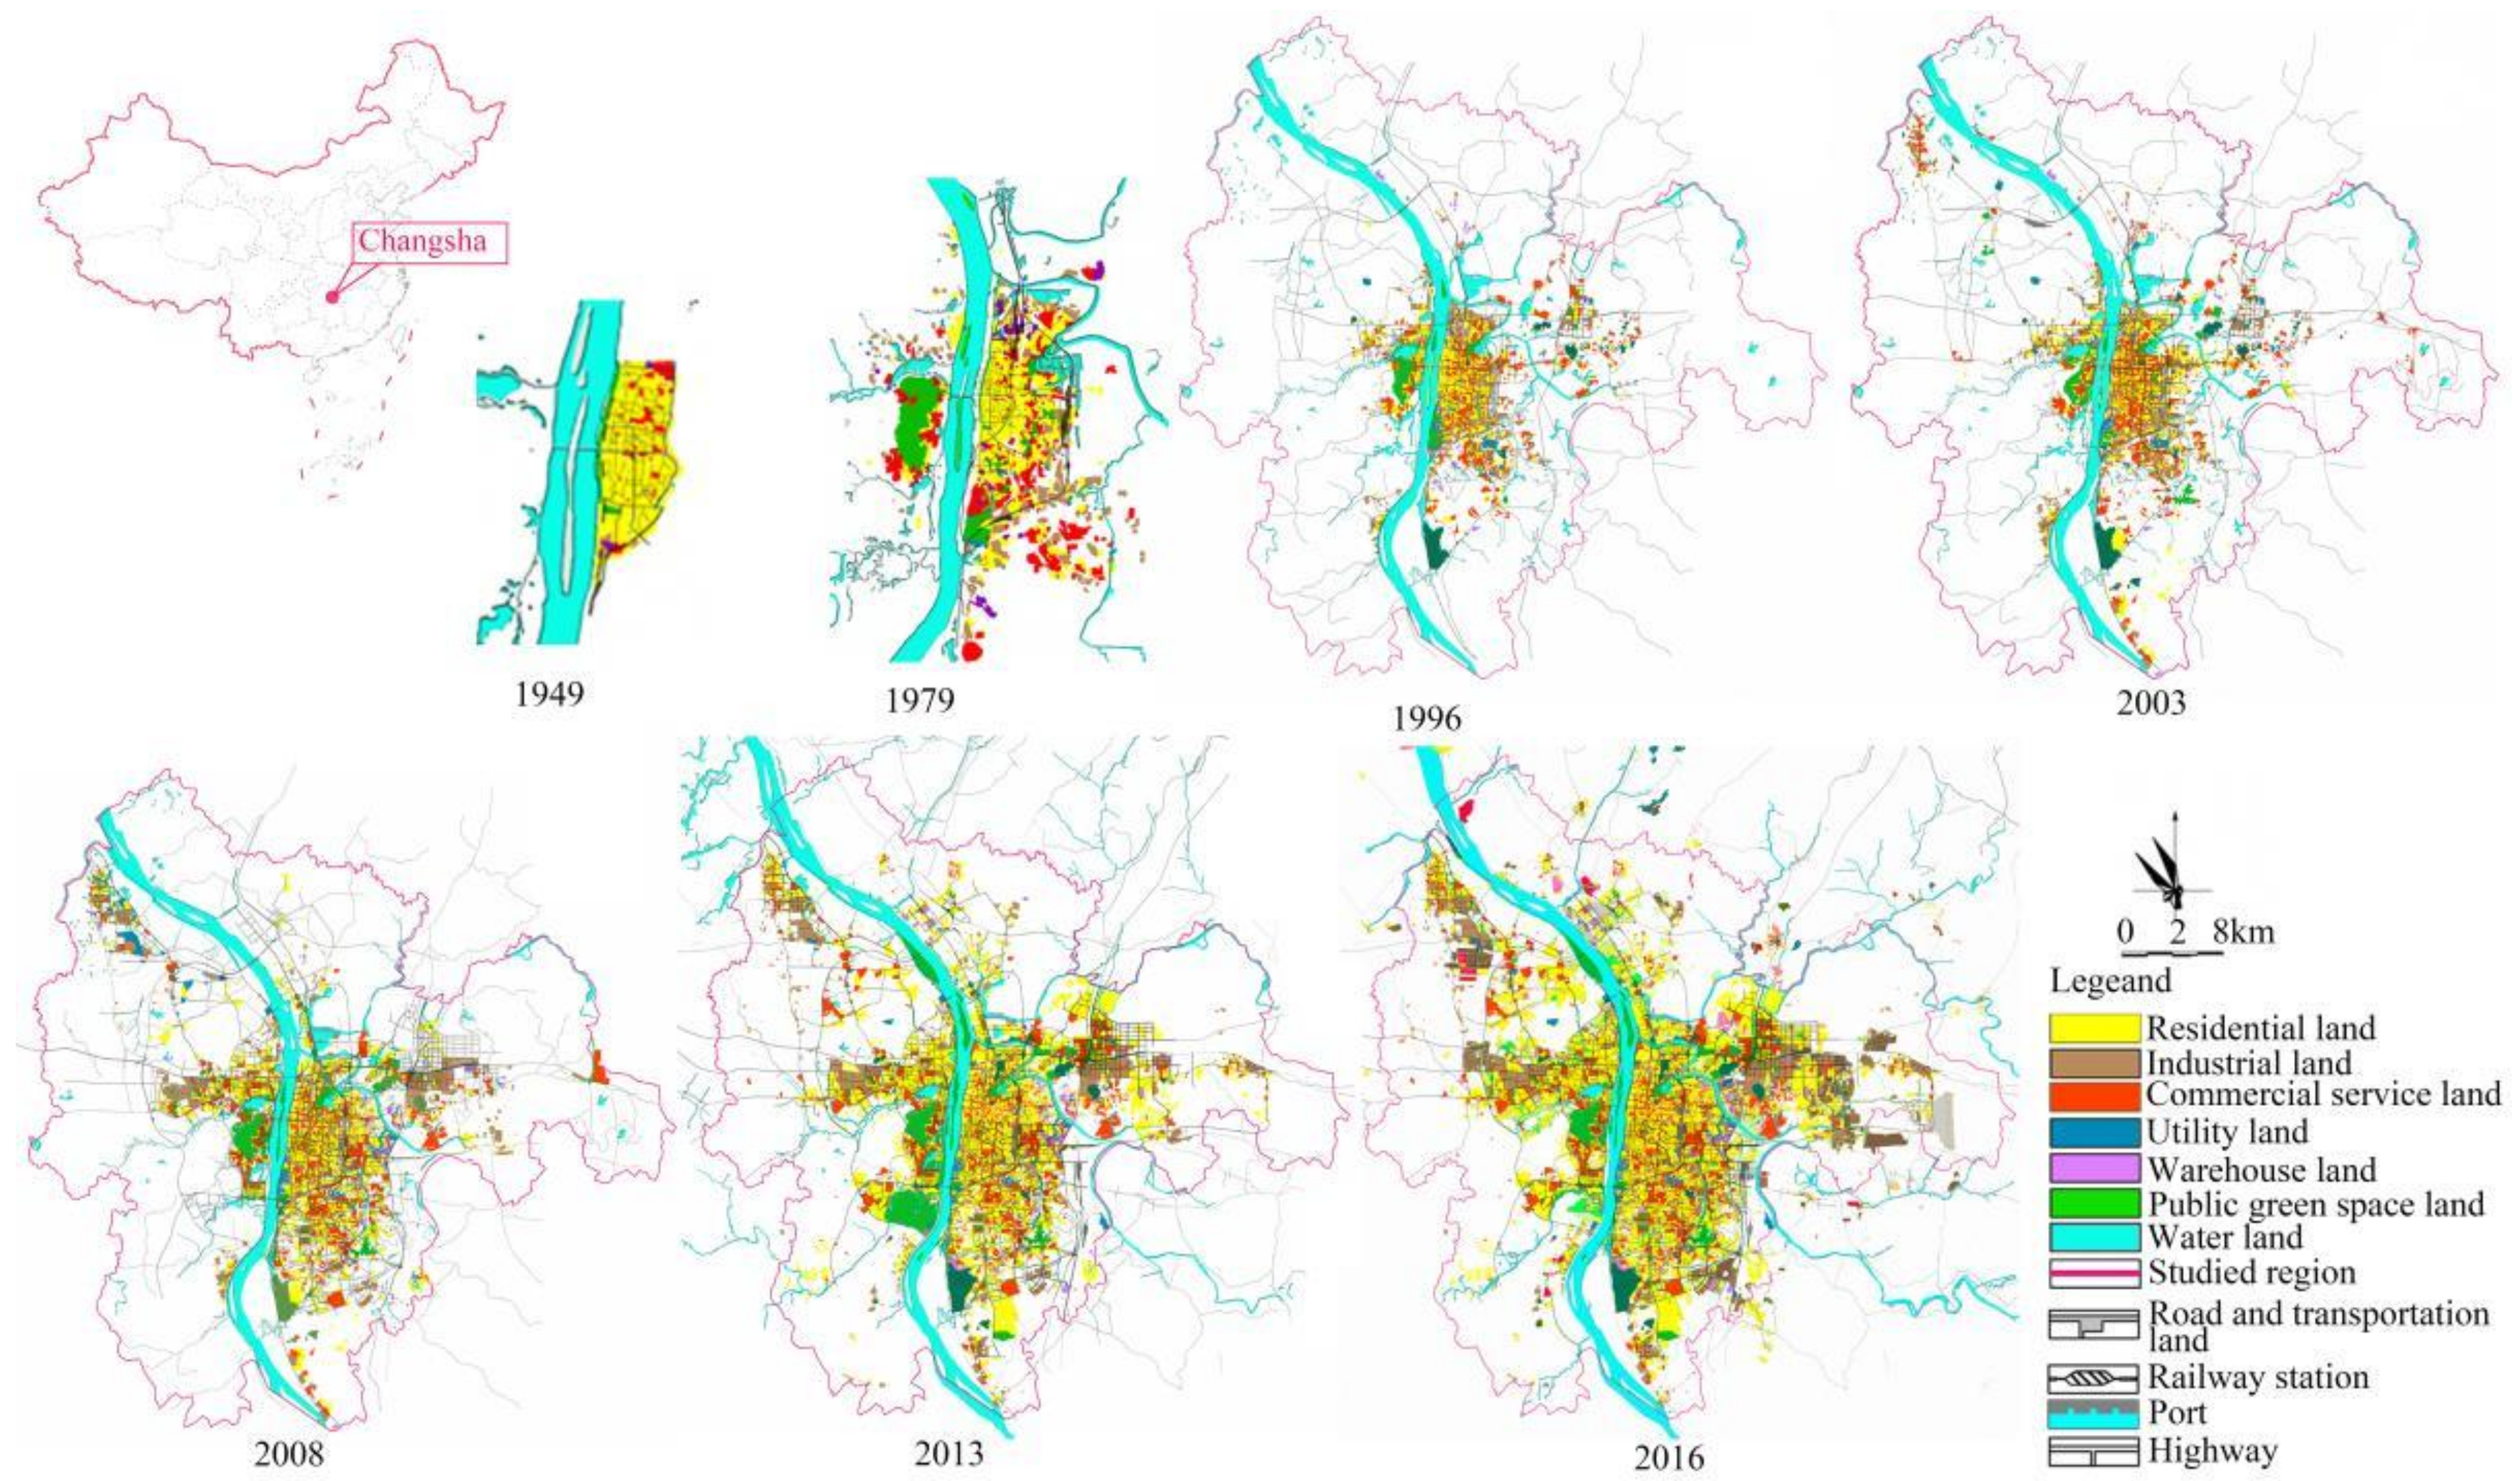


| Item | 1949 | 1979 | 1996 | 2003 | 2008 | 2013 | 2016 | |
|---|---|---|---|---|---|---|---|---|
| The built-up area | 6.7 | 51.8 | 104.93 | 96.26 | 209.63 | 393.78 | 476.34 | |
| Urban land area | Residential land (R) | 1.92 | 11.02 | 25.38 | 30.95 | 69.95 | 134.79 | 155.32 |
| Commercial service land (A and B) | 1.26 | 13.33 | 26.97 | 37.02 | 43.98 | 73.4 | 66.58 | |
| Industrial land (M) | 1.52 | 12.5 | 21.9 | 27.1 | 30.6 | 66.5 | 94.56 | |
| Road and transportation land (S) | 0.8 | 2.97 | 9.59 | 20.58 | 31.76 | 37.67 | 52.87 | |
| Public green space (G) | 0.6 | 4.8 | 7.94 | 12.29 | 21.42 | 29.13 | 34.13 | |
| Waters (E1) | 25.26 | 73.45 | 82.3 | 85.6 | 85.6 | 93 | 95.65 | |
| Arable land (E21) | 193.89 | 177.83 | 151.73 | 143.61 | 104.68 | 73.5 | 52.3 | |
| Garden land (E22) | 179.38 | 164.53 | 140.38 | 132.87 | 96.84 | 68 | 35.2 | |
| Forest land (E23) | 96.02 | 88.07 | 75.14 | 71.12 | 51.84 | 36.4 | 24.3 | |
| Urban compactness (U) 1 | 0.521 | 0.228 | 0.172 | 0.146 | 0.21 | 0.205 | 0.195 | |
| Urban morphology indices(I) 2 | 34.0 | 28.81 | 33.80 | 33.29 | 31.89 | 26.17 | 25.64 | |
| Item | 1949–1979 | 1979–1996 | 1996–2003 | 2003–2008 | 2008–2013 | 2003–2016 |
|---|---|---|---|---|---|---|
| Residential land (R) | 28.66 | 21.27 | 24.19 | 19.29 | 33.37 | 34.23 |
| Commercial service land (A and B) | 18.81 | 25.73 | 25.7 | 23.08 | 20.98 | 14.52 |
| Industrial land (M) | 22.69 | 24.13 | 20.87 | 16.89 | 14.6 | 16.89 |
| Road and transportation land (S) | 11.94 | 5.73 | 9.14 | 12.83 | 15.15 | 9.57 |
| Public green space (G) | 8.96 | 9.27 | 7.57 | 7.66 | 10.22 | 7.4 |
| Correlation Index | R | A&B | M | S | G |
|---|---|---|---|---|---|
| Carbon emissions and land use area | 0.6708 | 0.5358 | 0.5695 | 0.6274 | 0.7463 |
| The emissions intensity and urban sprawl intensity | 0.4619 | 0.6085 | 0.3866 | 0.3632 | 0.5521 |
Publisher’s Note: MDPI stays neutral with regard to jurisdictional claims in published maps and institutional affiliations. |
© 2022 by the authors. Licensee MDPI, Basel, Switzerland. This article is an open access article distributed under the terms and conditions of the Creative Commons Attribution (CC BY) license (https://creativecommons.org/licenses/by/4.0/).
Share and Cite
Liu, L.; Tang, Y.; Chen, Y.; Zhou, X.; Bedra, K.B. Urban Sprawl and Carbon Emissions Effects in City Areas Based on System Dynamics: A Case Study of Changsha City. Appl. Sci. 2022, 12, 3244. https://doi.org/10.3390/app12073244
Liu L, Tang Y, Chen Y, Zhou X, Bedra KB. Urban Sprawl and Carbon Emissions Effects in City Areas Based on System Dynamics: A Case Study of Changsha City. Applied Sciences. 2022; 12(7):3244. https://doi.org/10.3390/app12073244
Chicago/Turabian StyleLiu, Luyun, Yanli Tang, Yuanyuan Chen, Xu Zhou, and Komi Bernard Bedra. 2022. "Urban Sprawl and Carbon Emissions Effects in City Areas Based on System Dynamics: A Case Study of Changsha City" Applied Sciences 12, no. 7: 3244. https://doi.org/10.3390/app12073244
APA StyleLiu, L., Tang, Y., Chen, Y., Zhou, X., & Bedra, K. B. (2022). Urban Sprawl and Carbon Emissions Effects in City Areas Based on System Dynamics: A Case Study of Changsha City. Applied Sciences, 12(7), 3244. https://doi.org/10.3390/app12073244


