
Enhanced Adsorption of Methyl Orange by Mongolian Montmorillonite after Aluminum Pillaring

 , , ,
, , ,
Abstract
:1. Introduction
2. Materials and Methods
2.1. Chemicals and Materials
2.2. Synthesis of Al-Intercalated and Al-Pillared Montmorillonite
2.3. Characterization
2.3.1. X-ray Diffraction
2.3.2. Specific Surface Area (SSA)
2.3.3. Thermogravimetric Analysis (TGA)
2.3.4. Field Emission Scanning Electron Microscope (FE-SEM)
2.4. Methyl Orange Adsorption
2.5. Adsorption Kinetic and Isotherm Models
2.5.1. Adsorption Kinetic Models
2.5.2. Adsorption Isotherm
3. Results
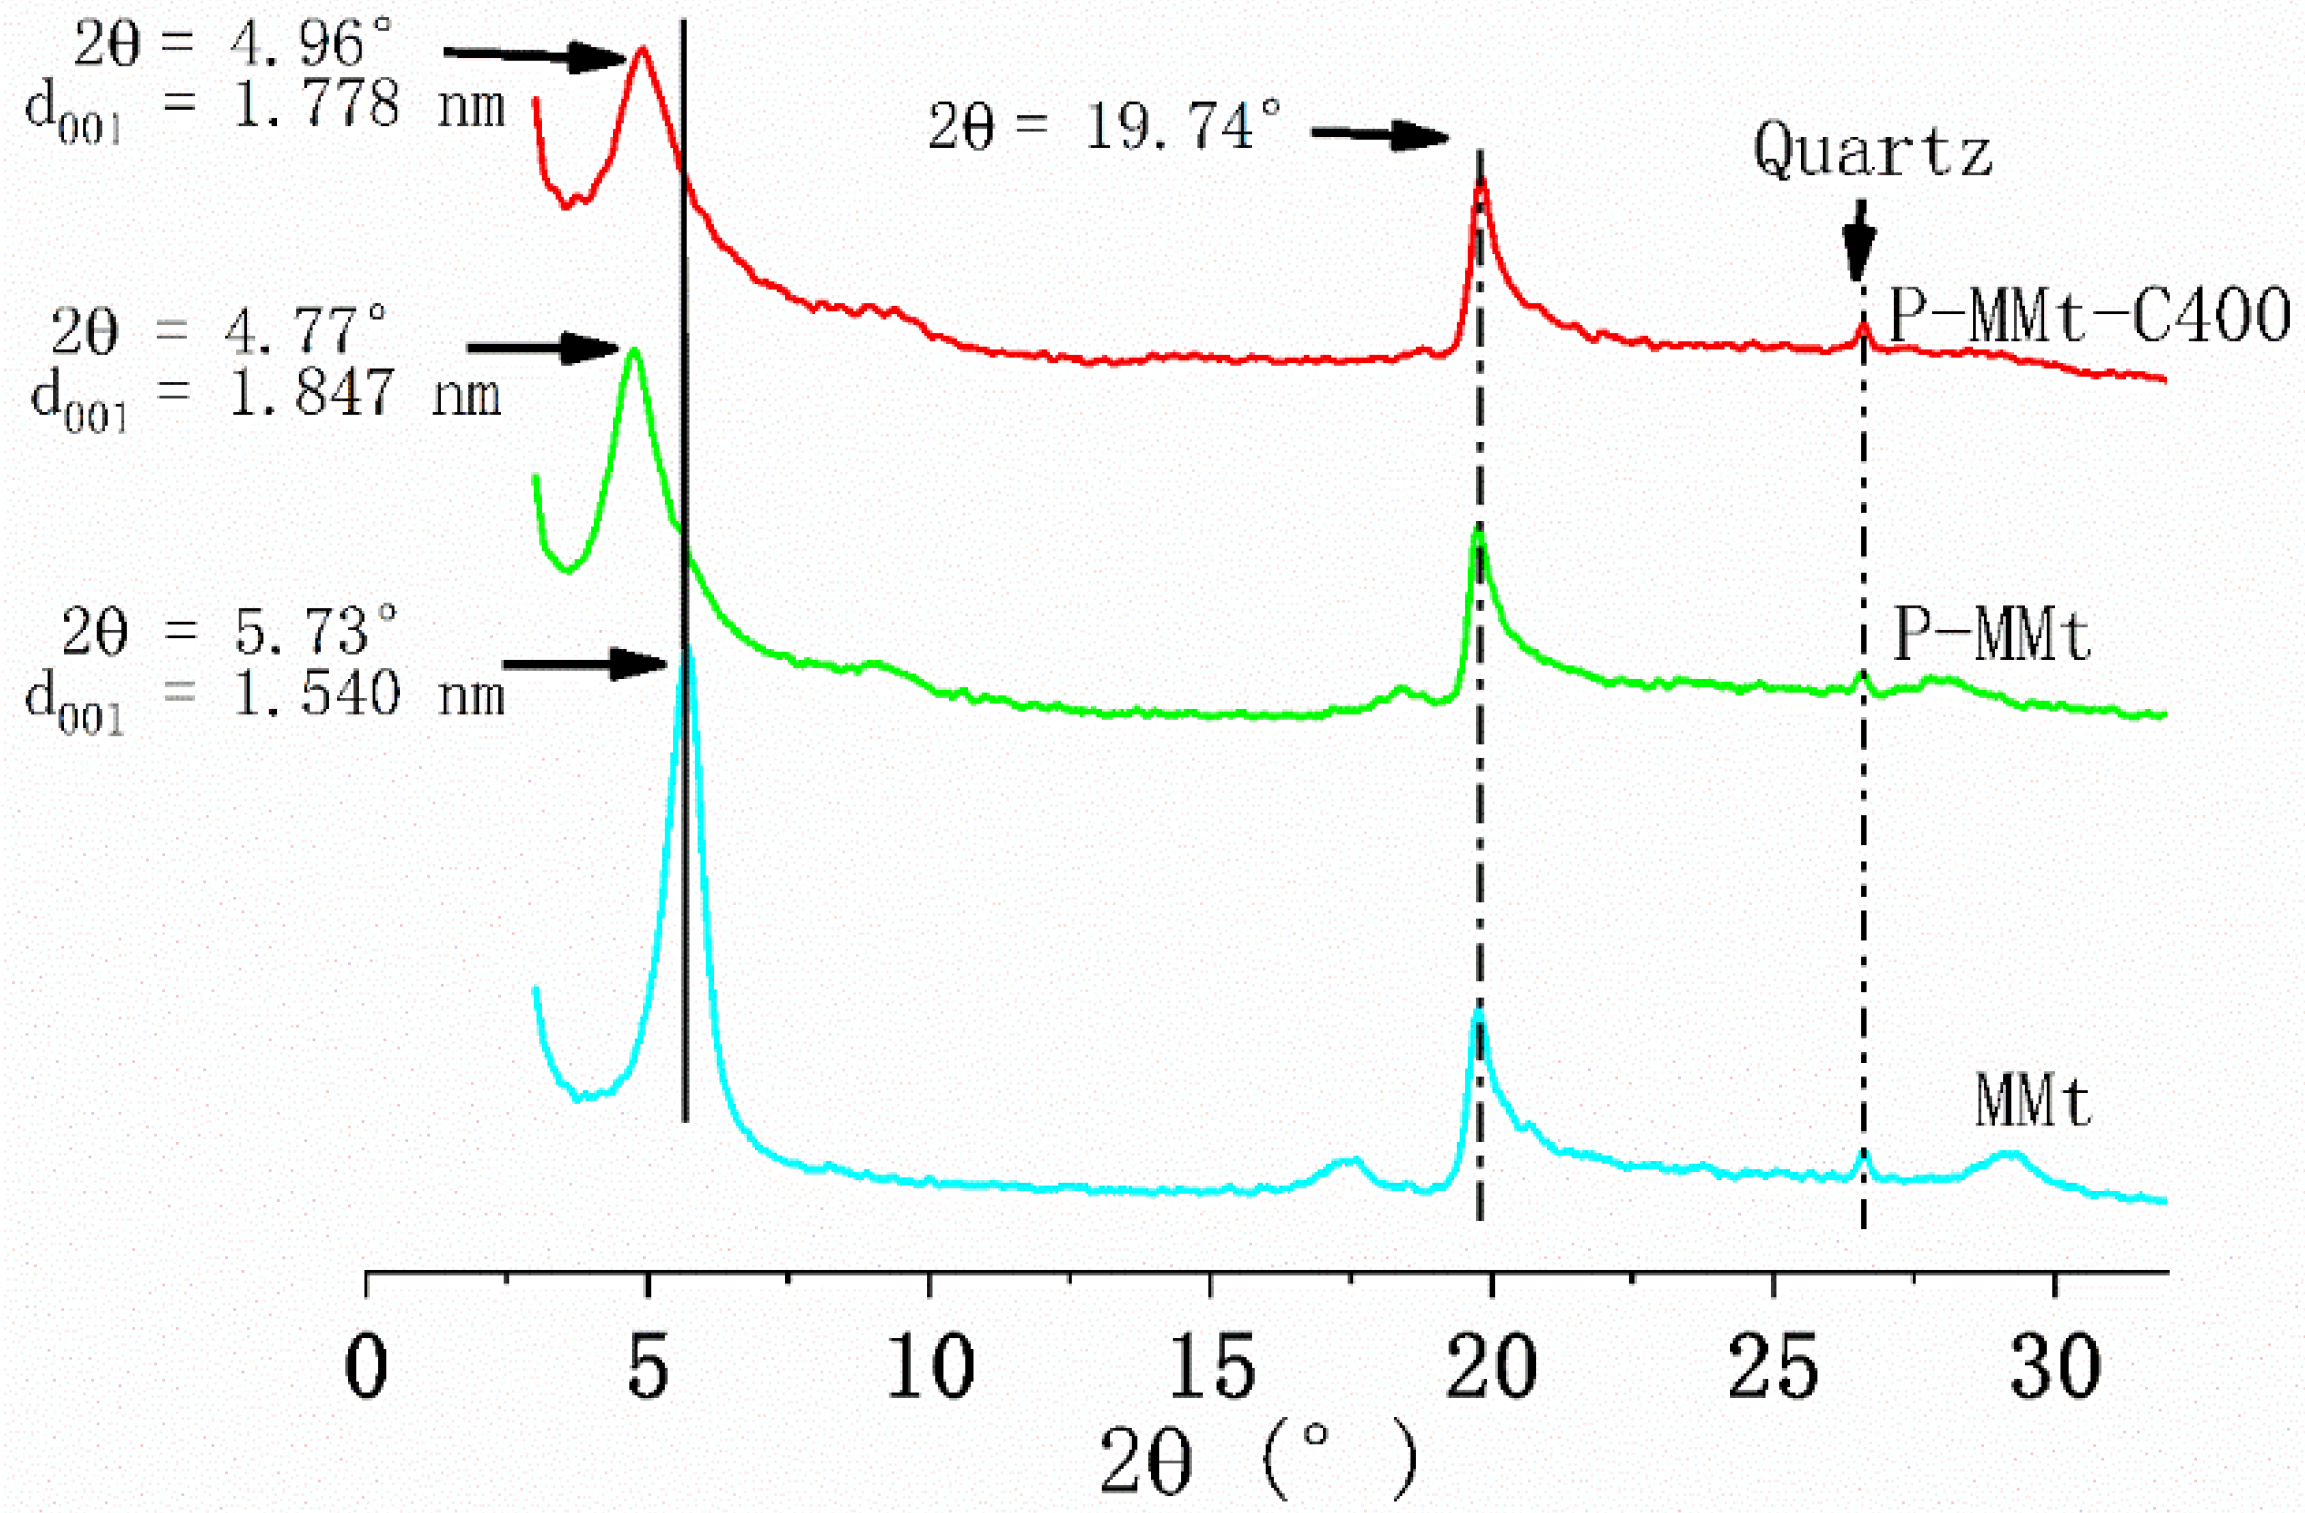
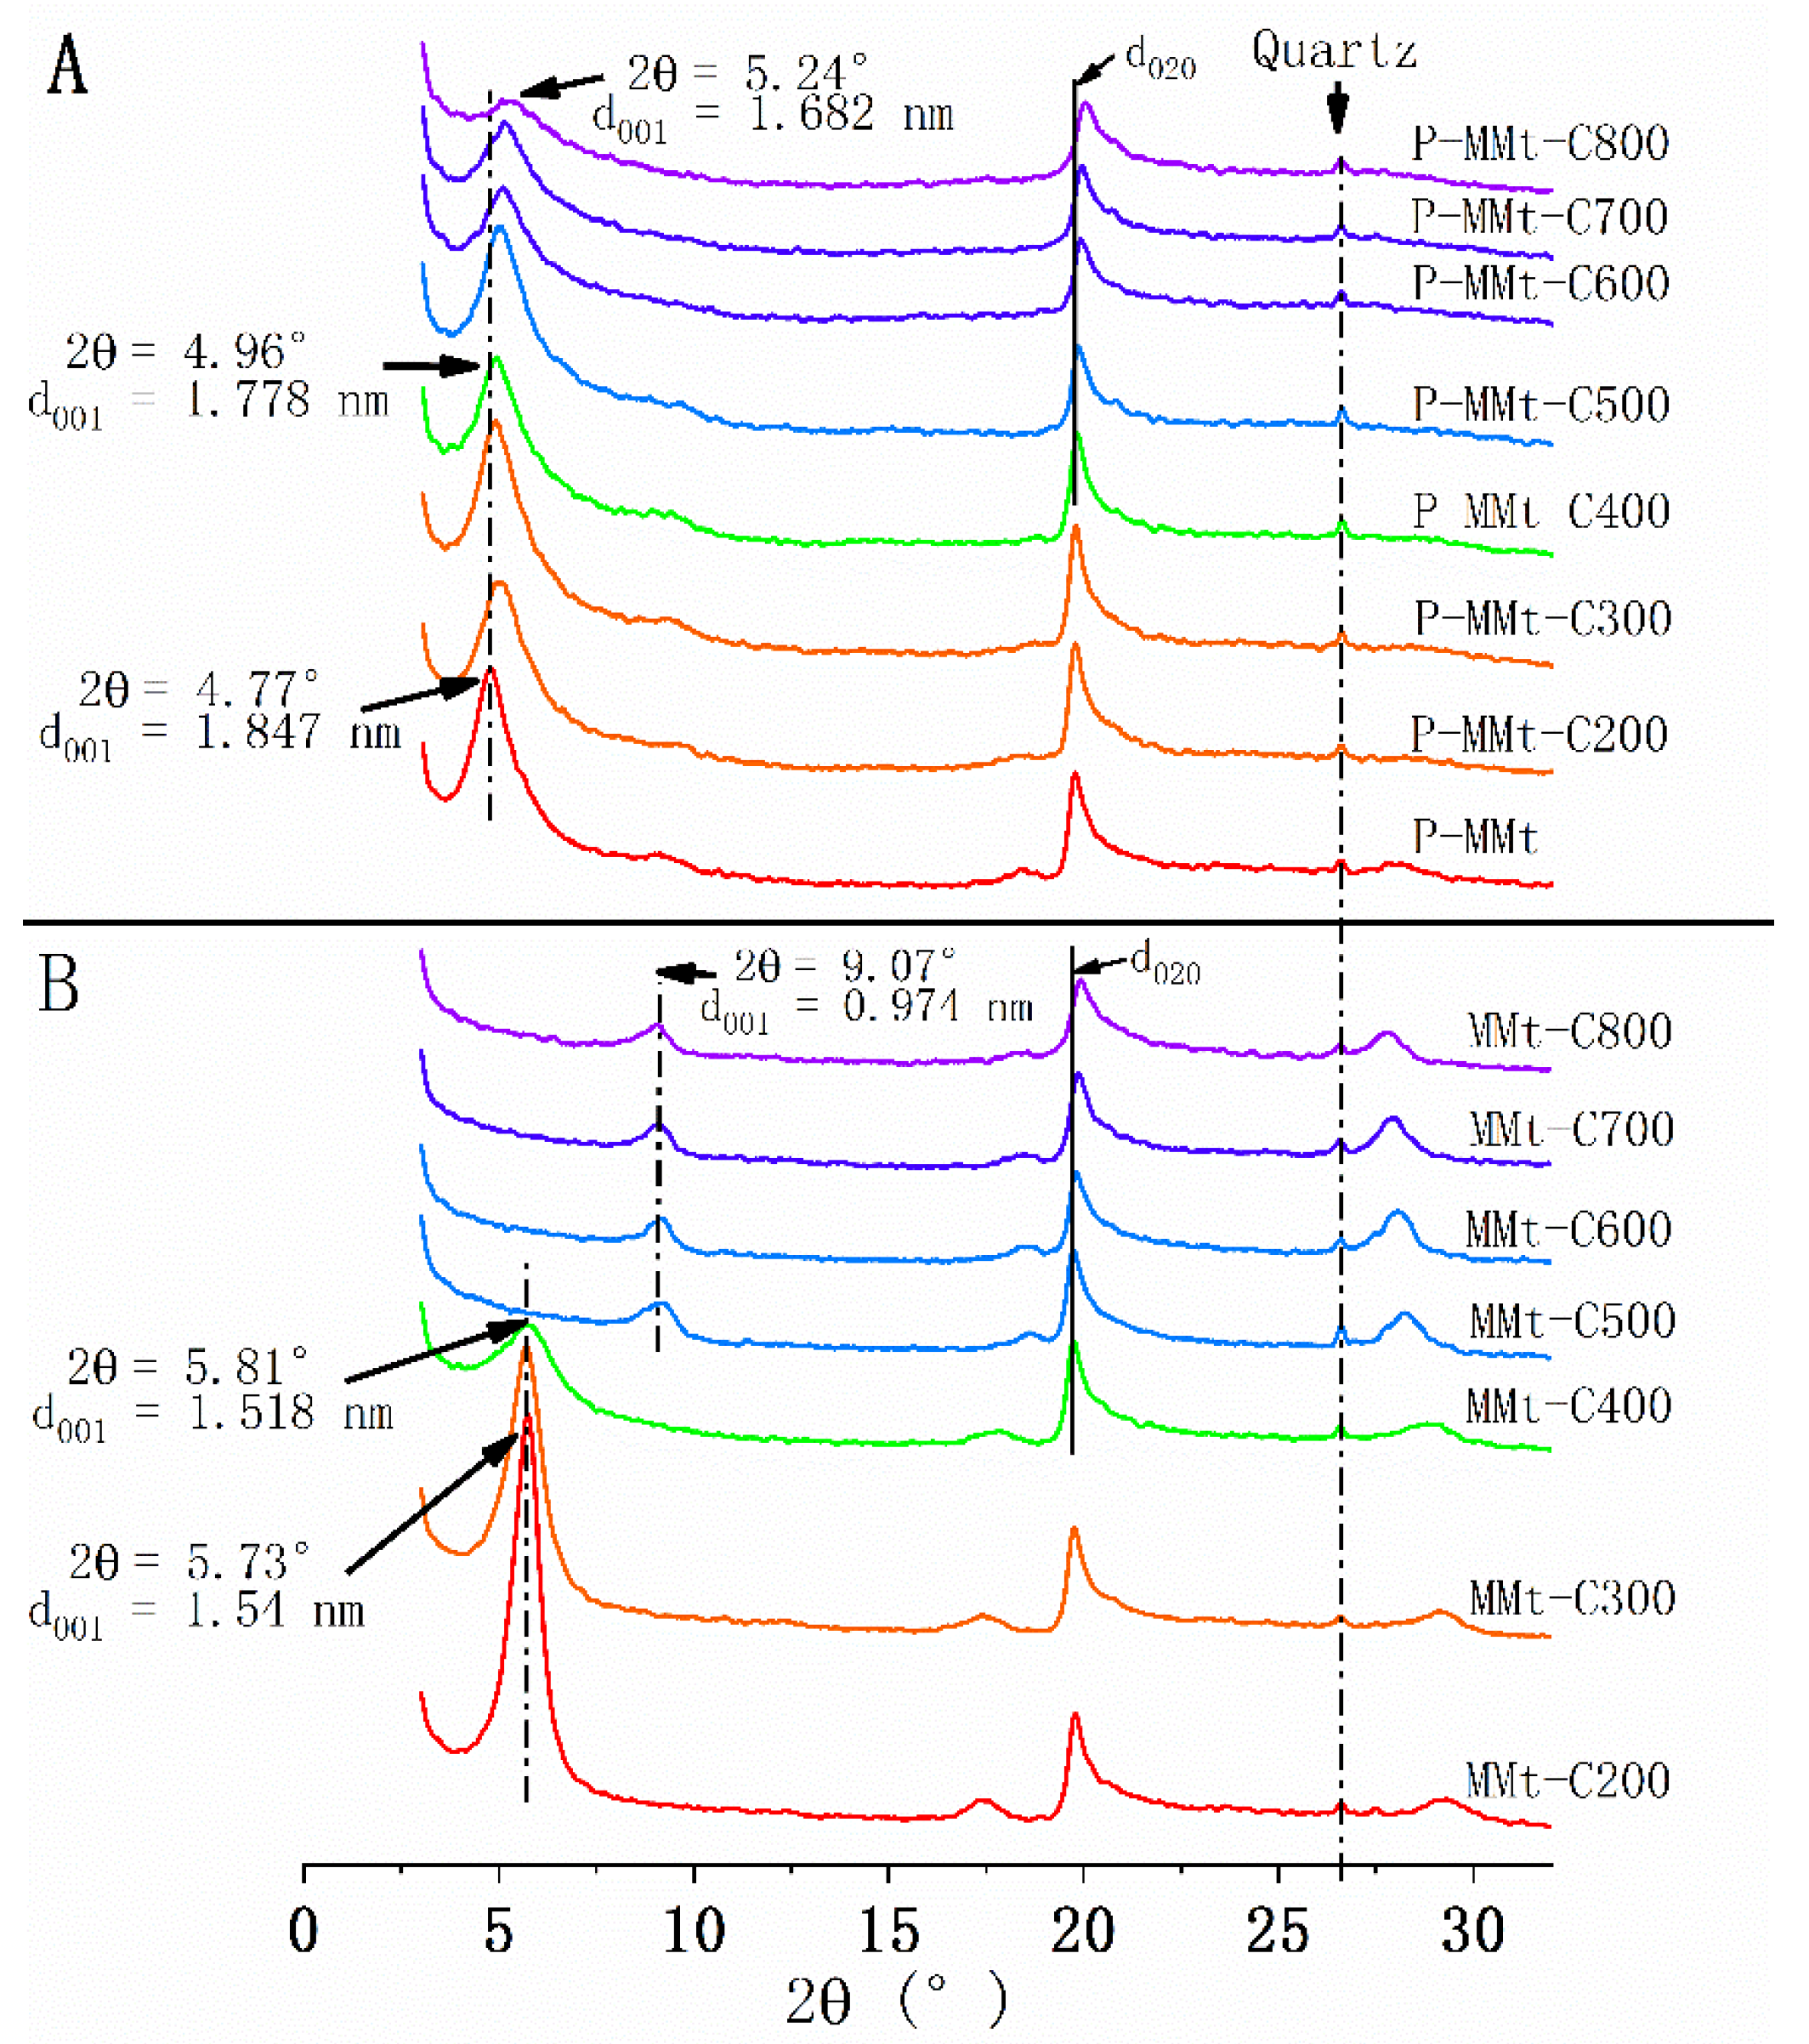
3.1. X-ray Diffraction Analysis
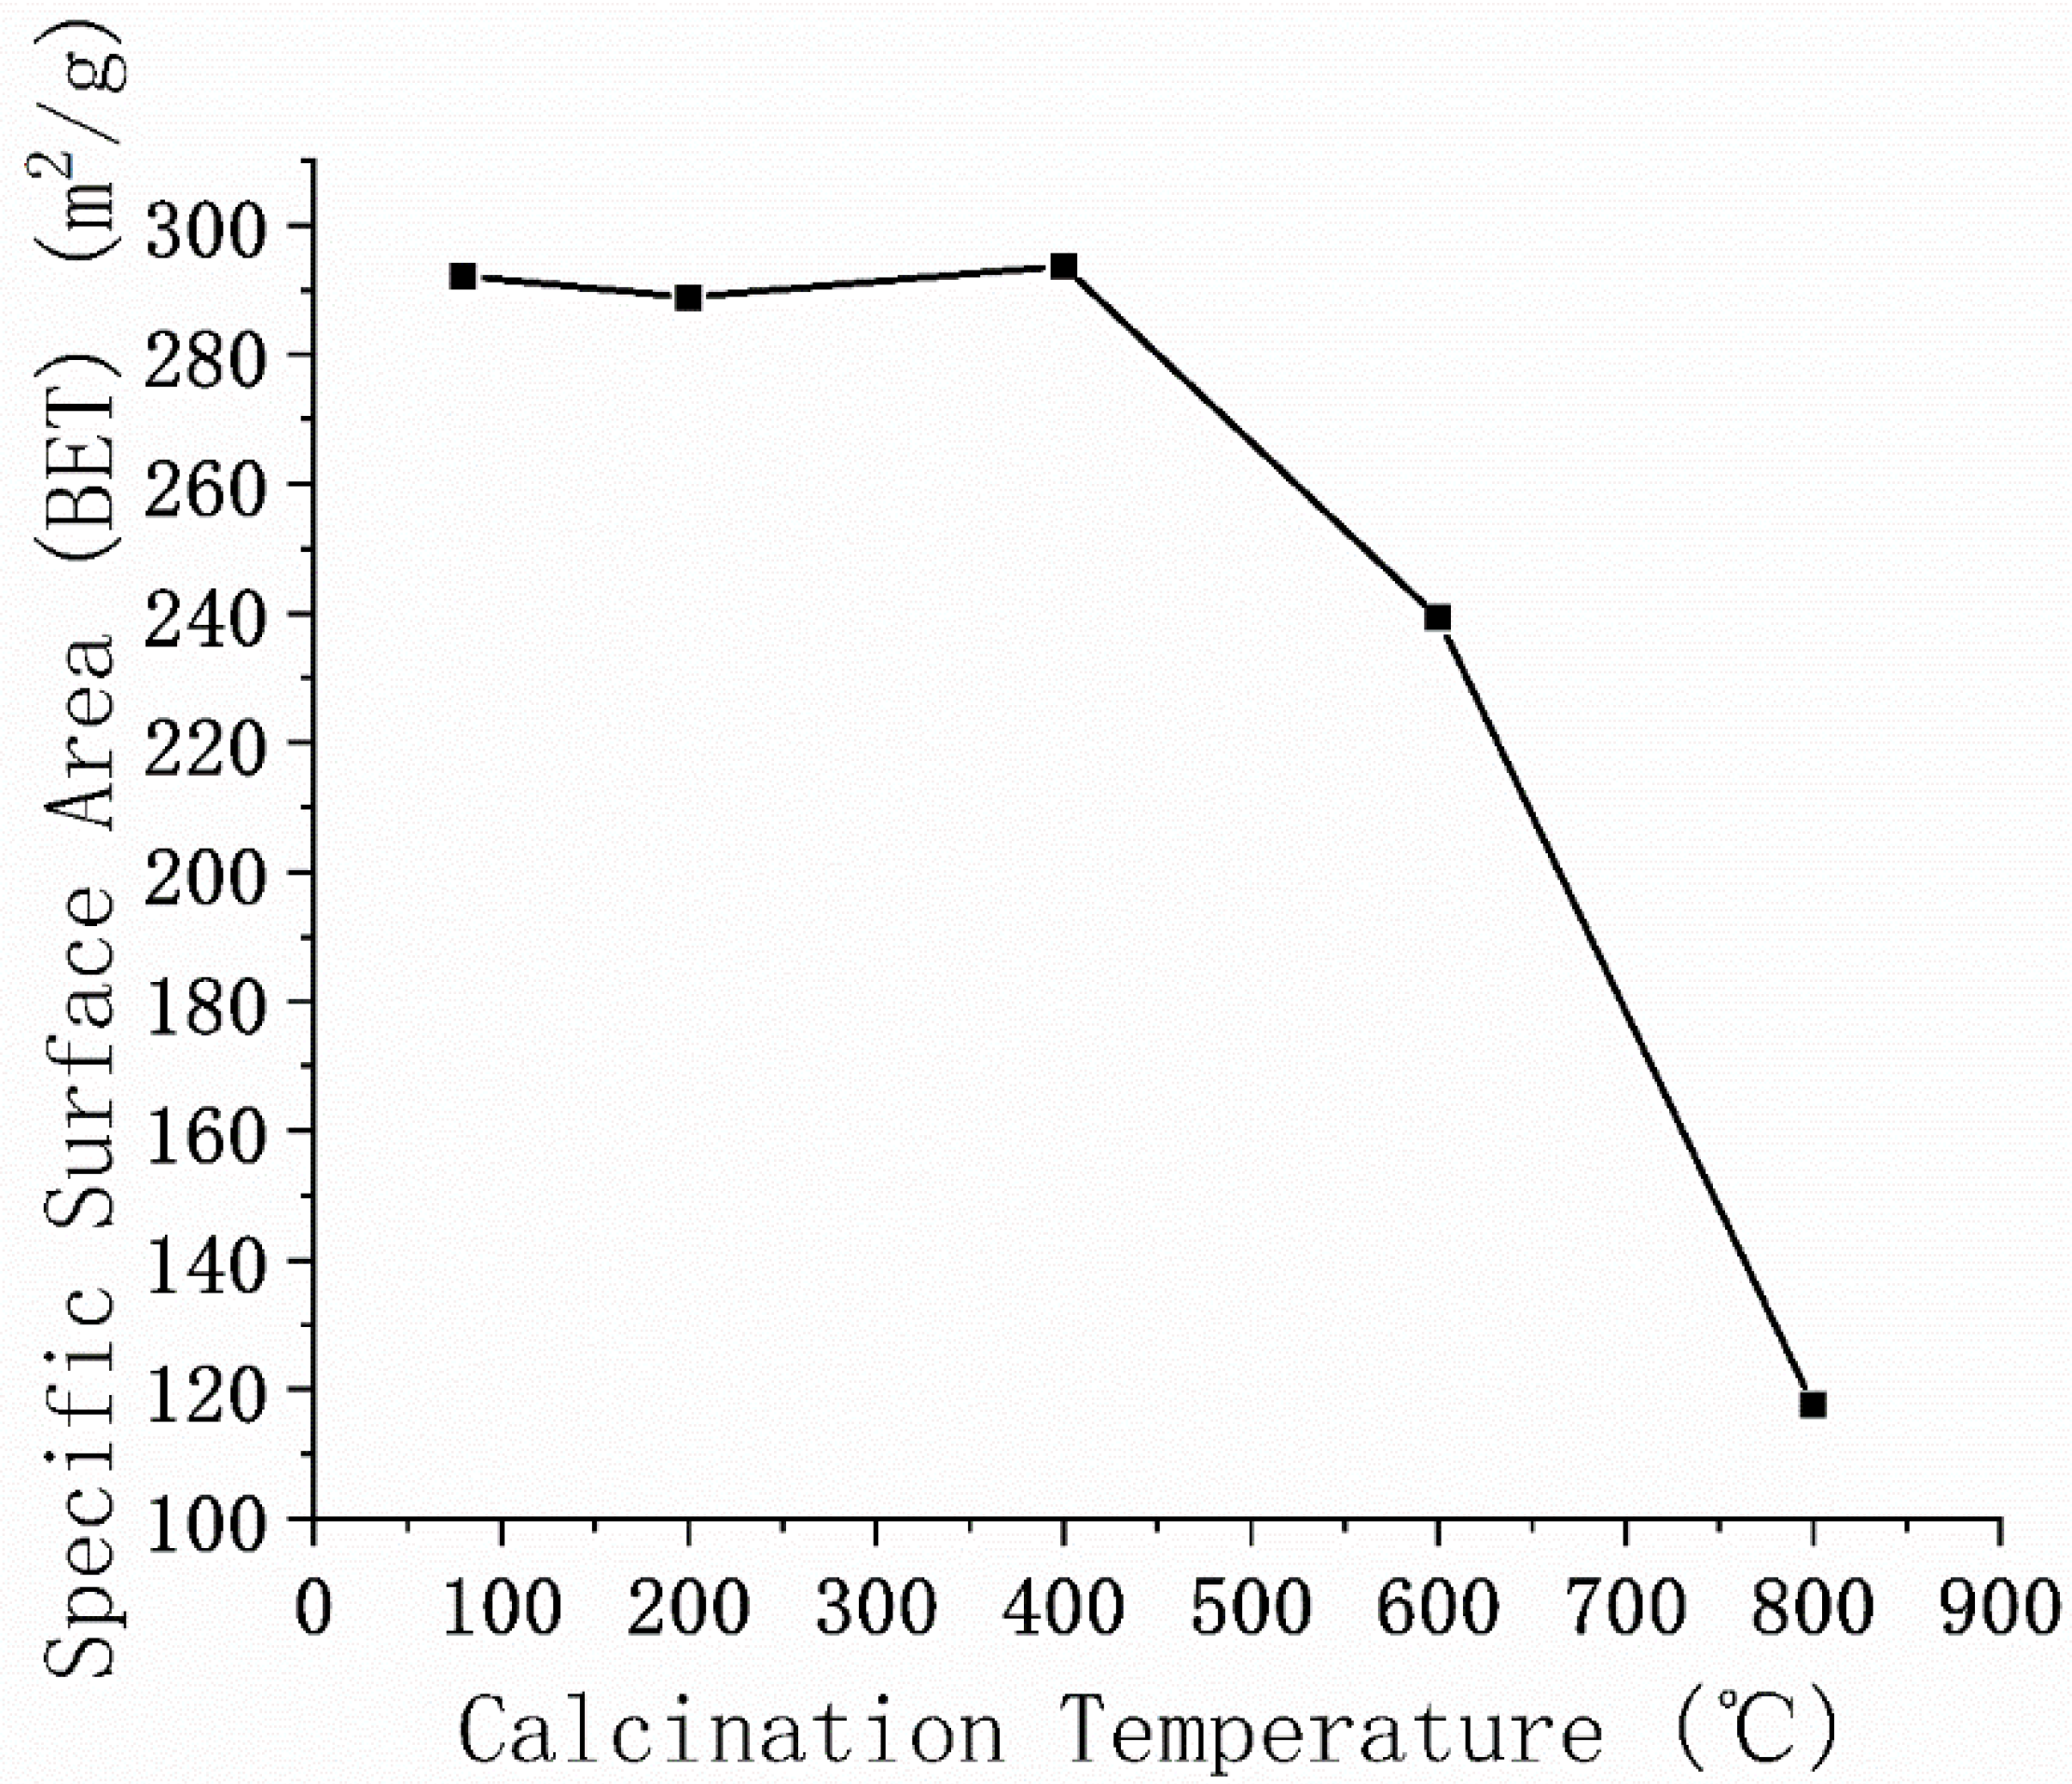
3.2. Specific Surface Area and BET Adsorption–Desorption Isotherm
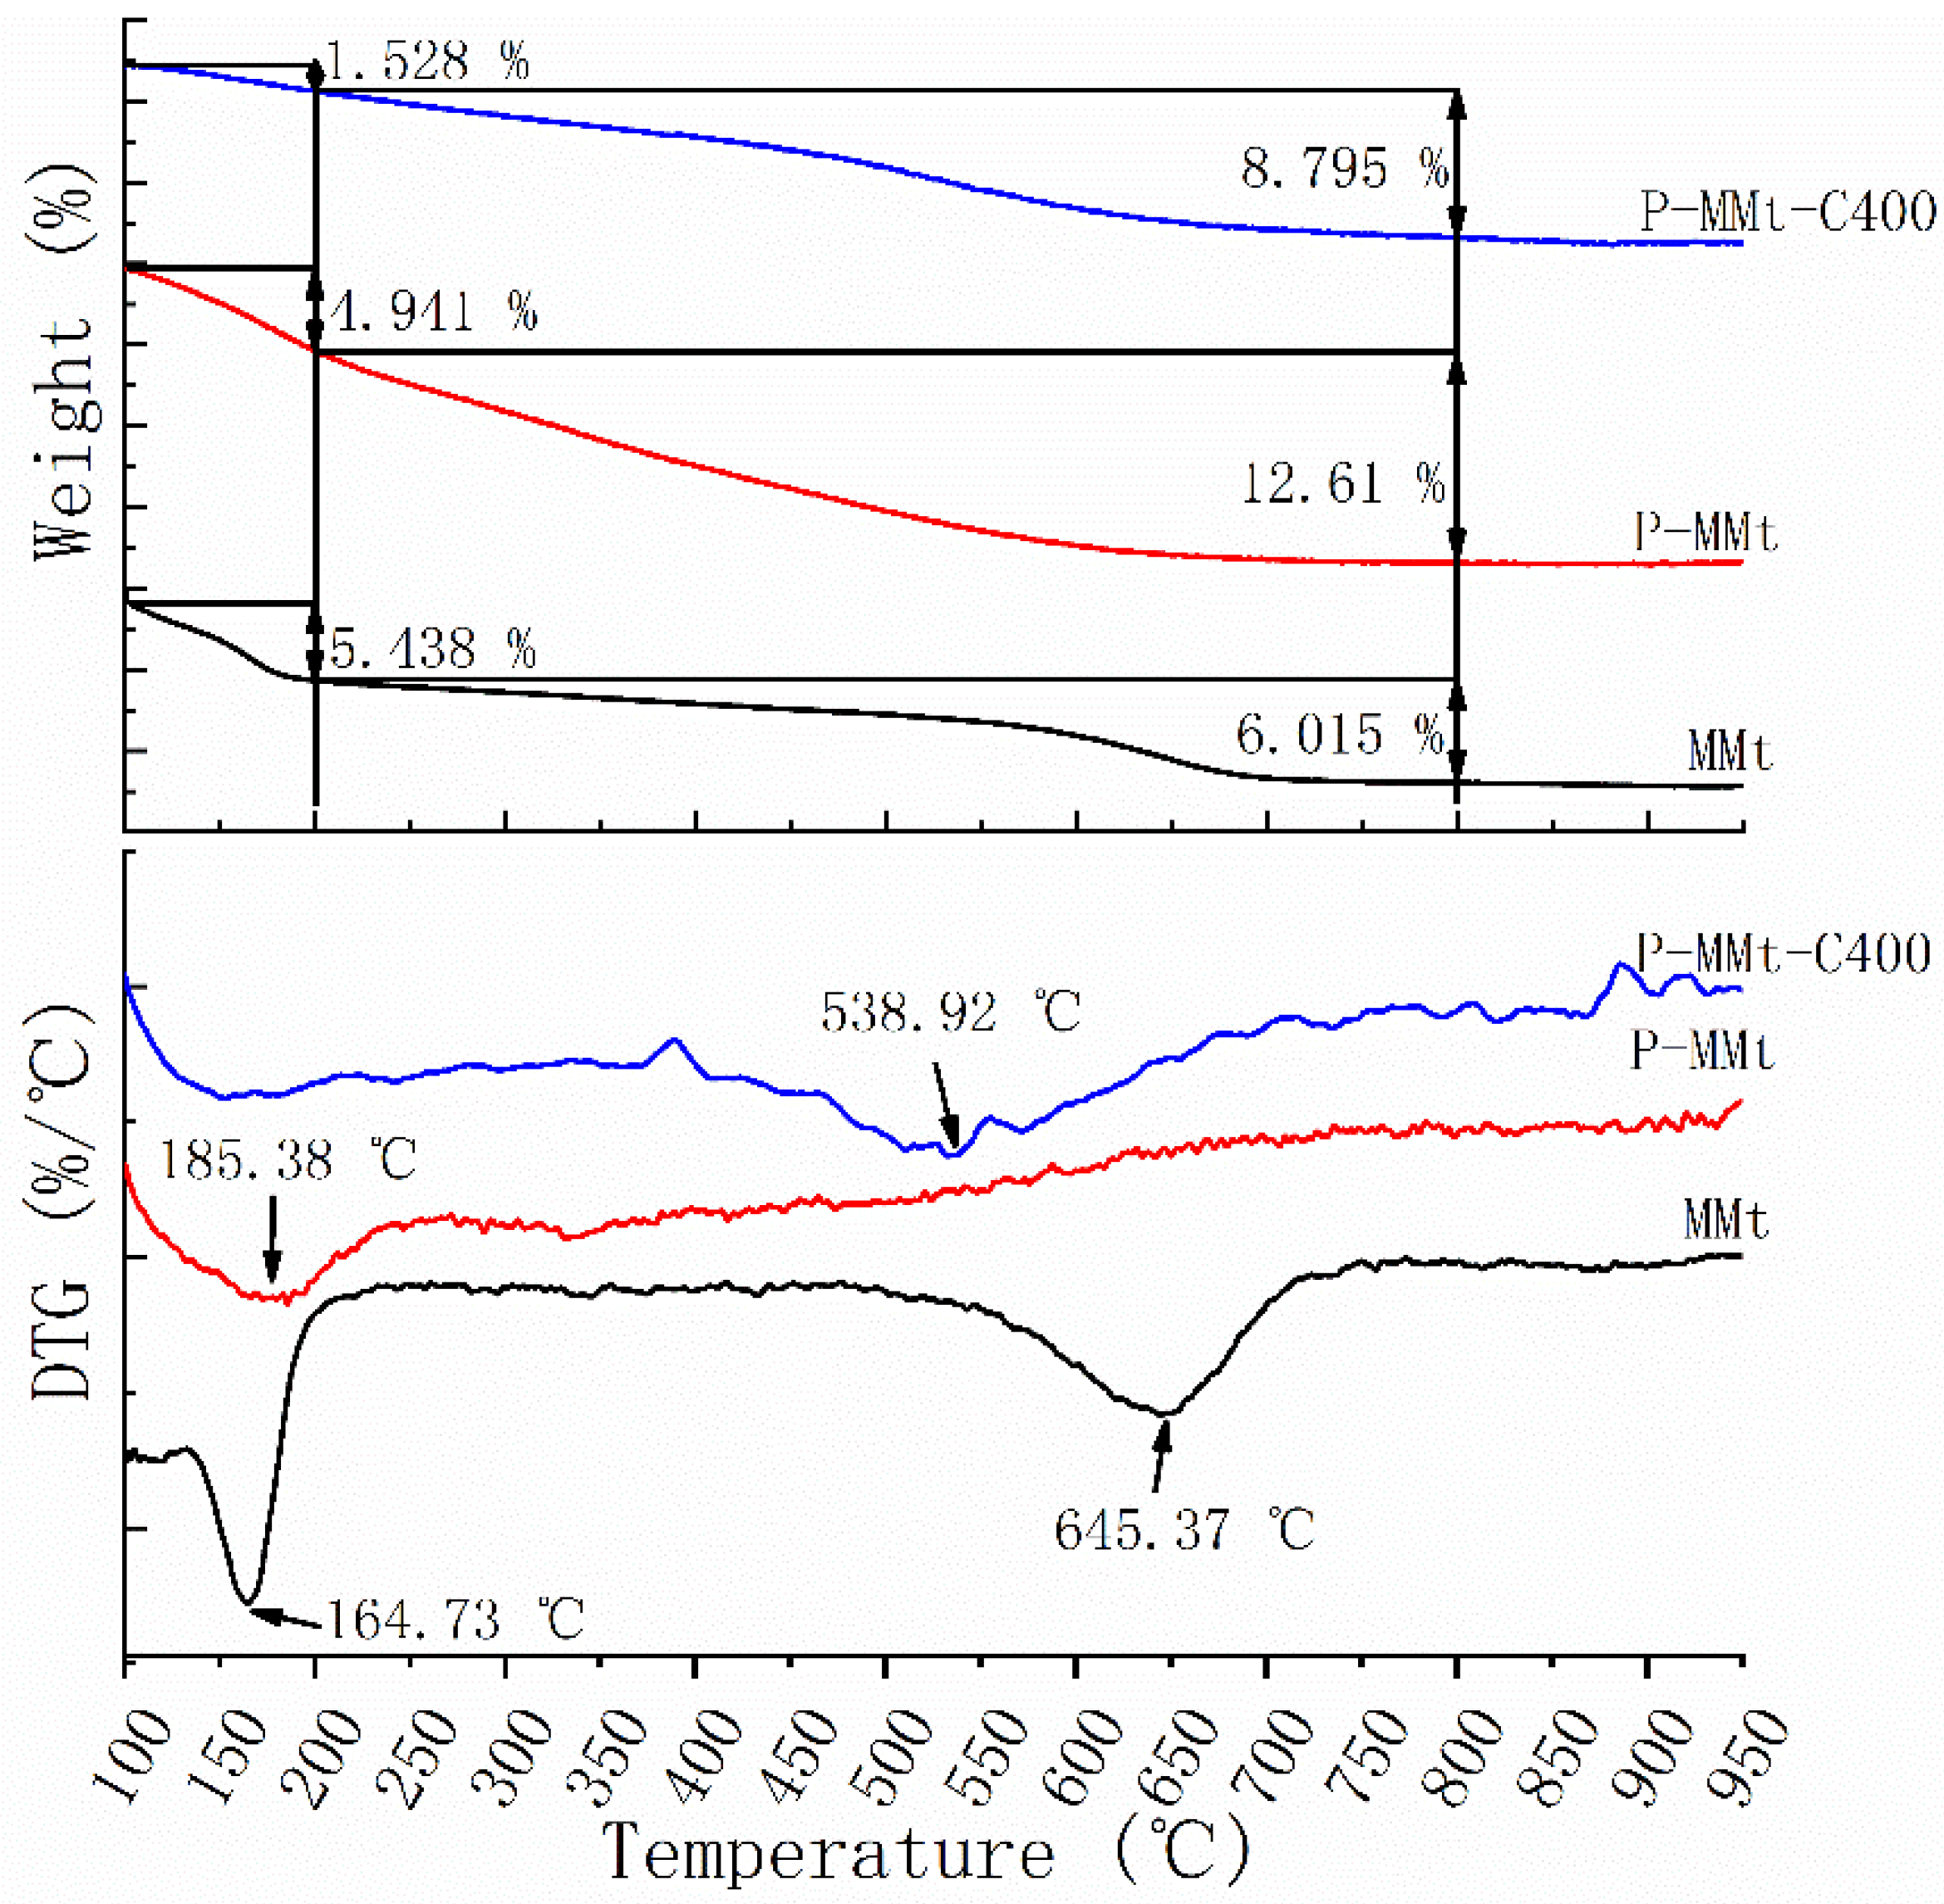
3.3. Thermogravimetric Analysis
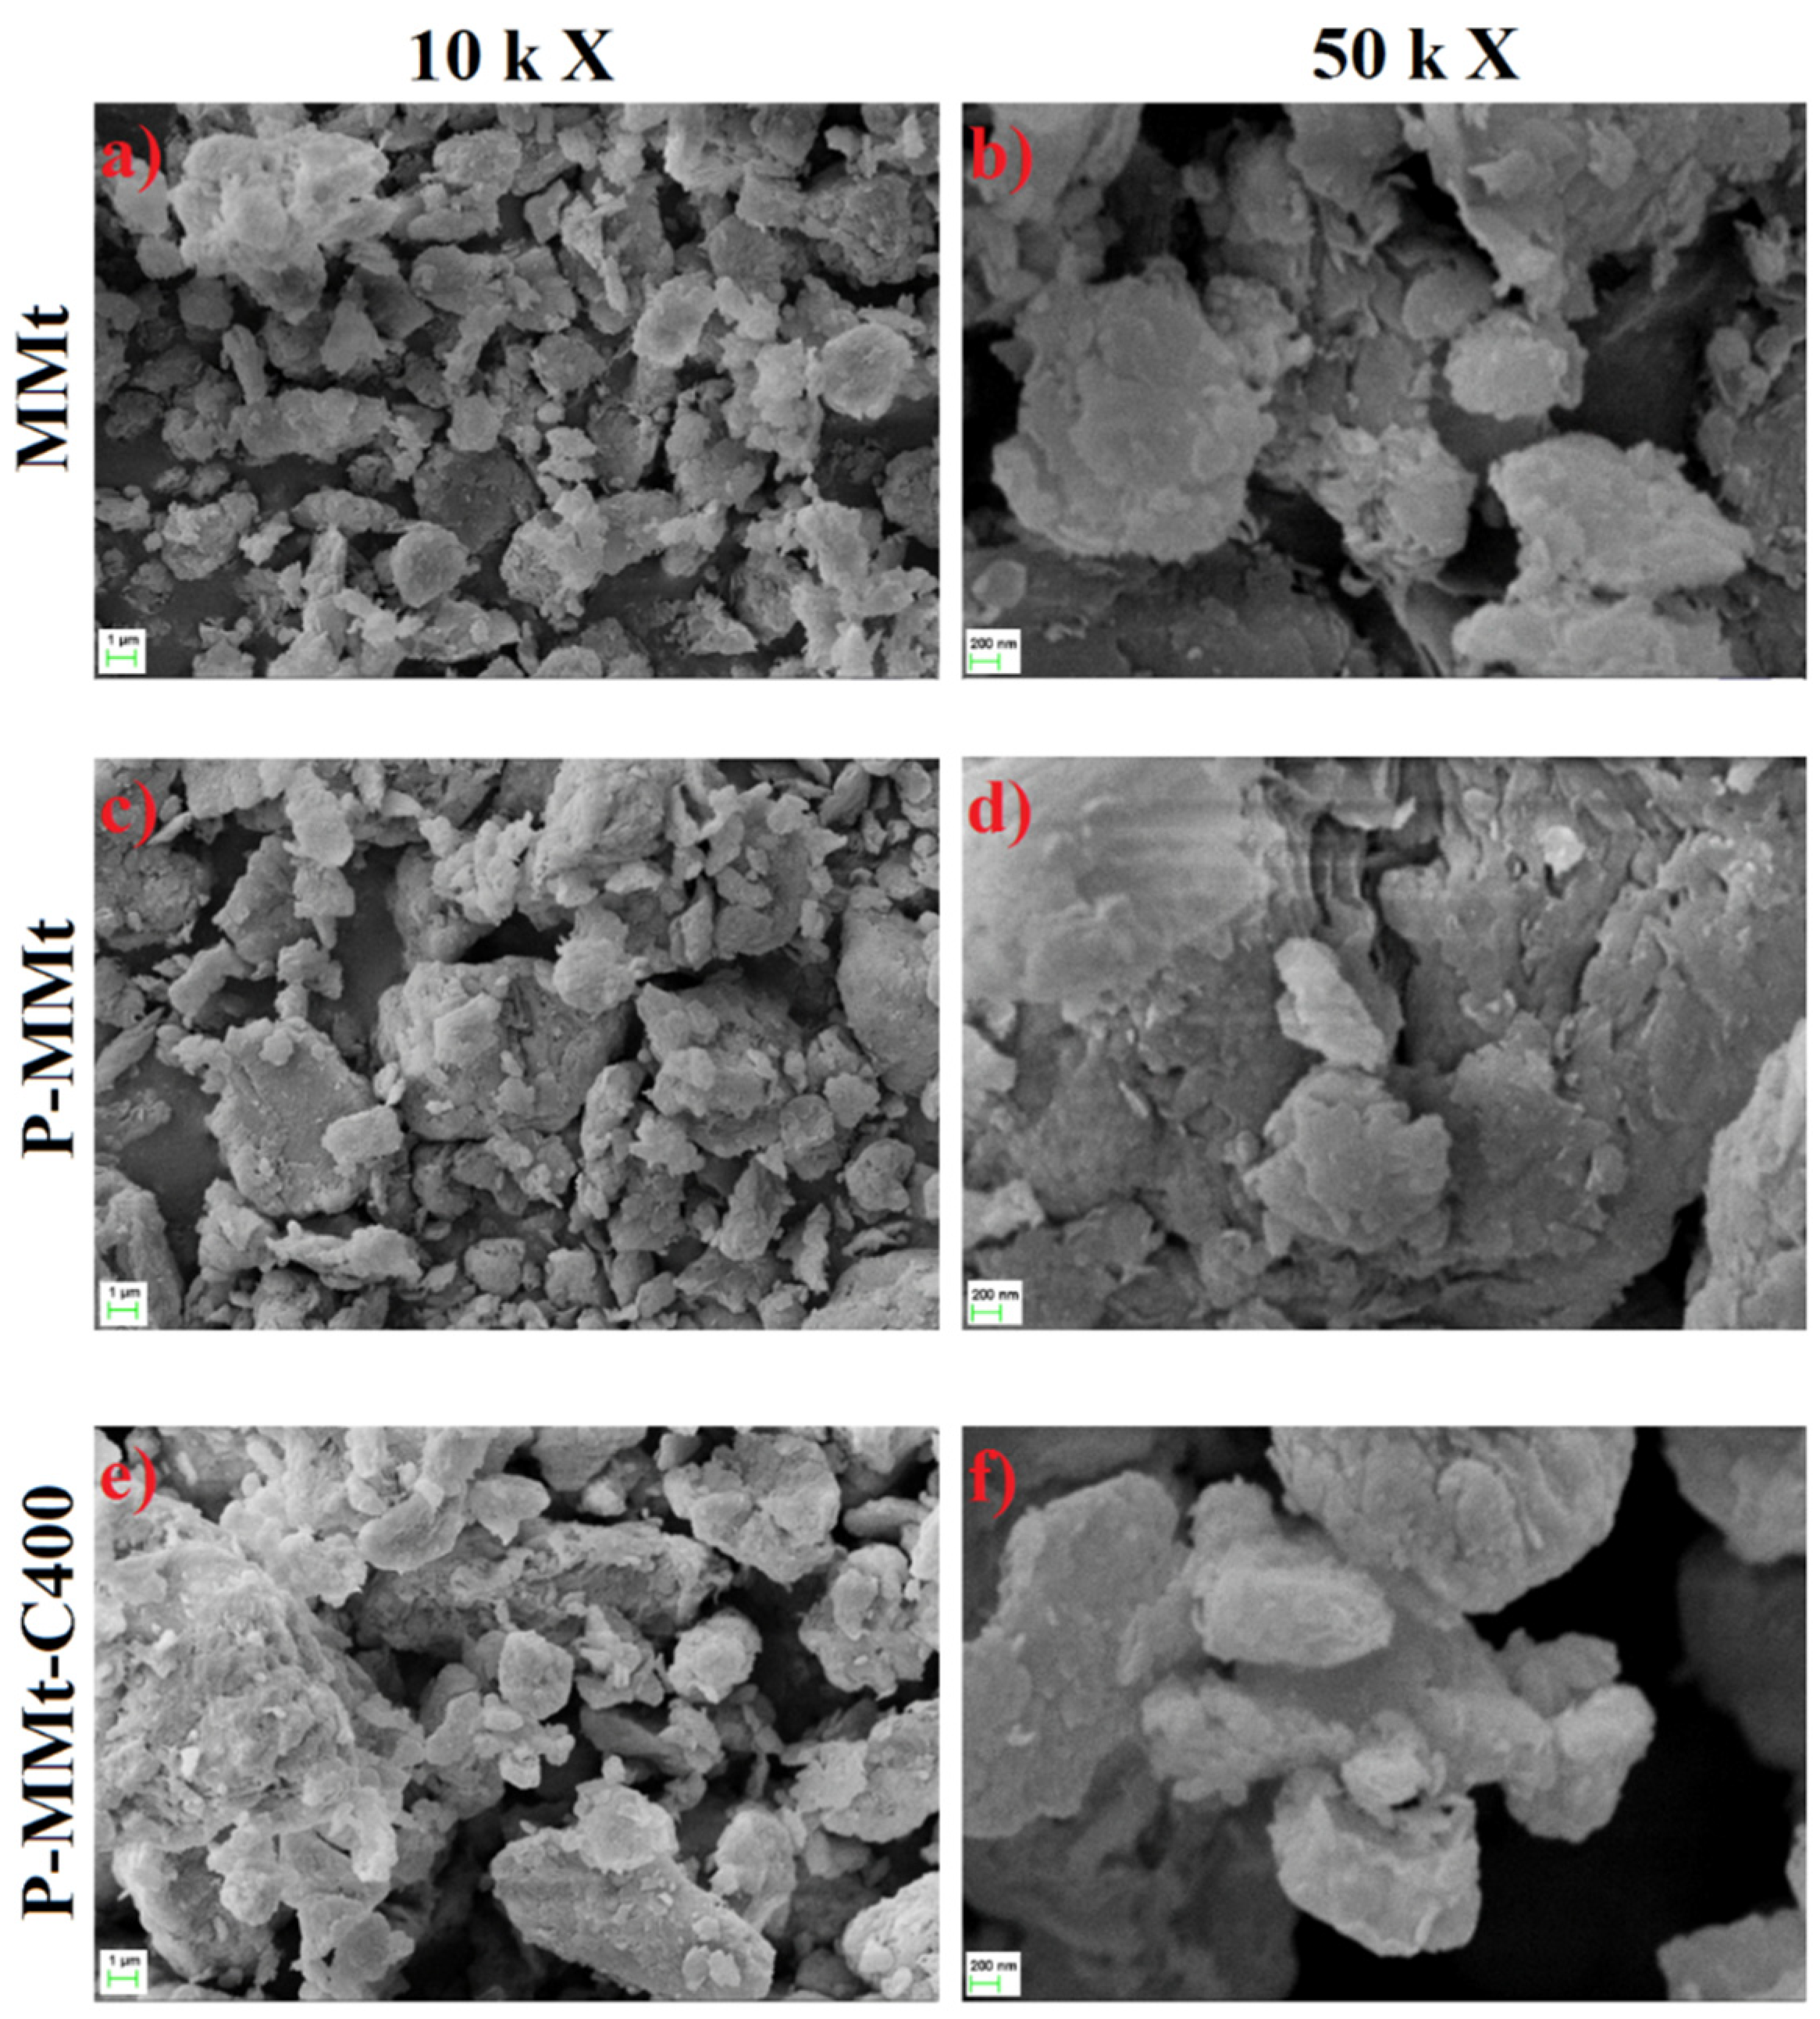
3.4. Micrographs of the Field Emission Scanning Electron Microscopy
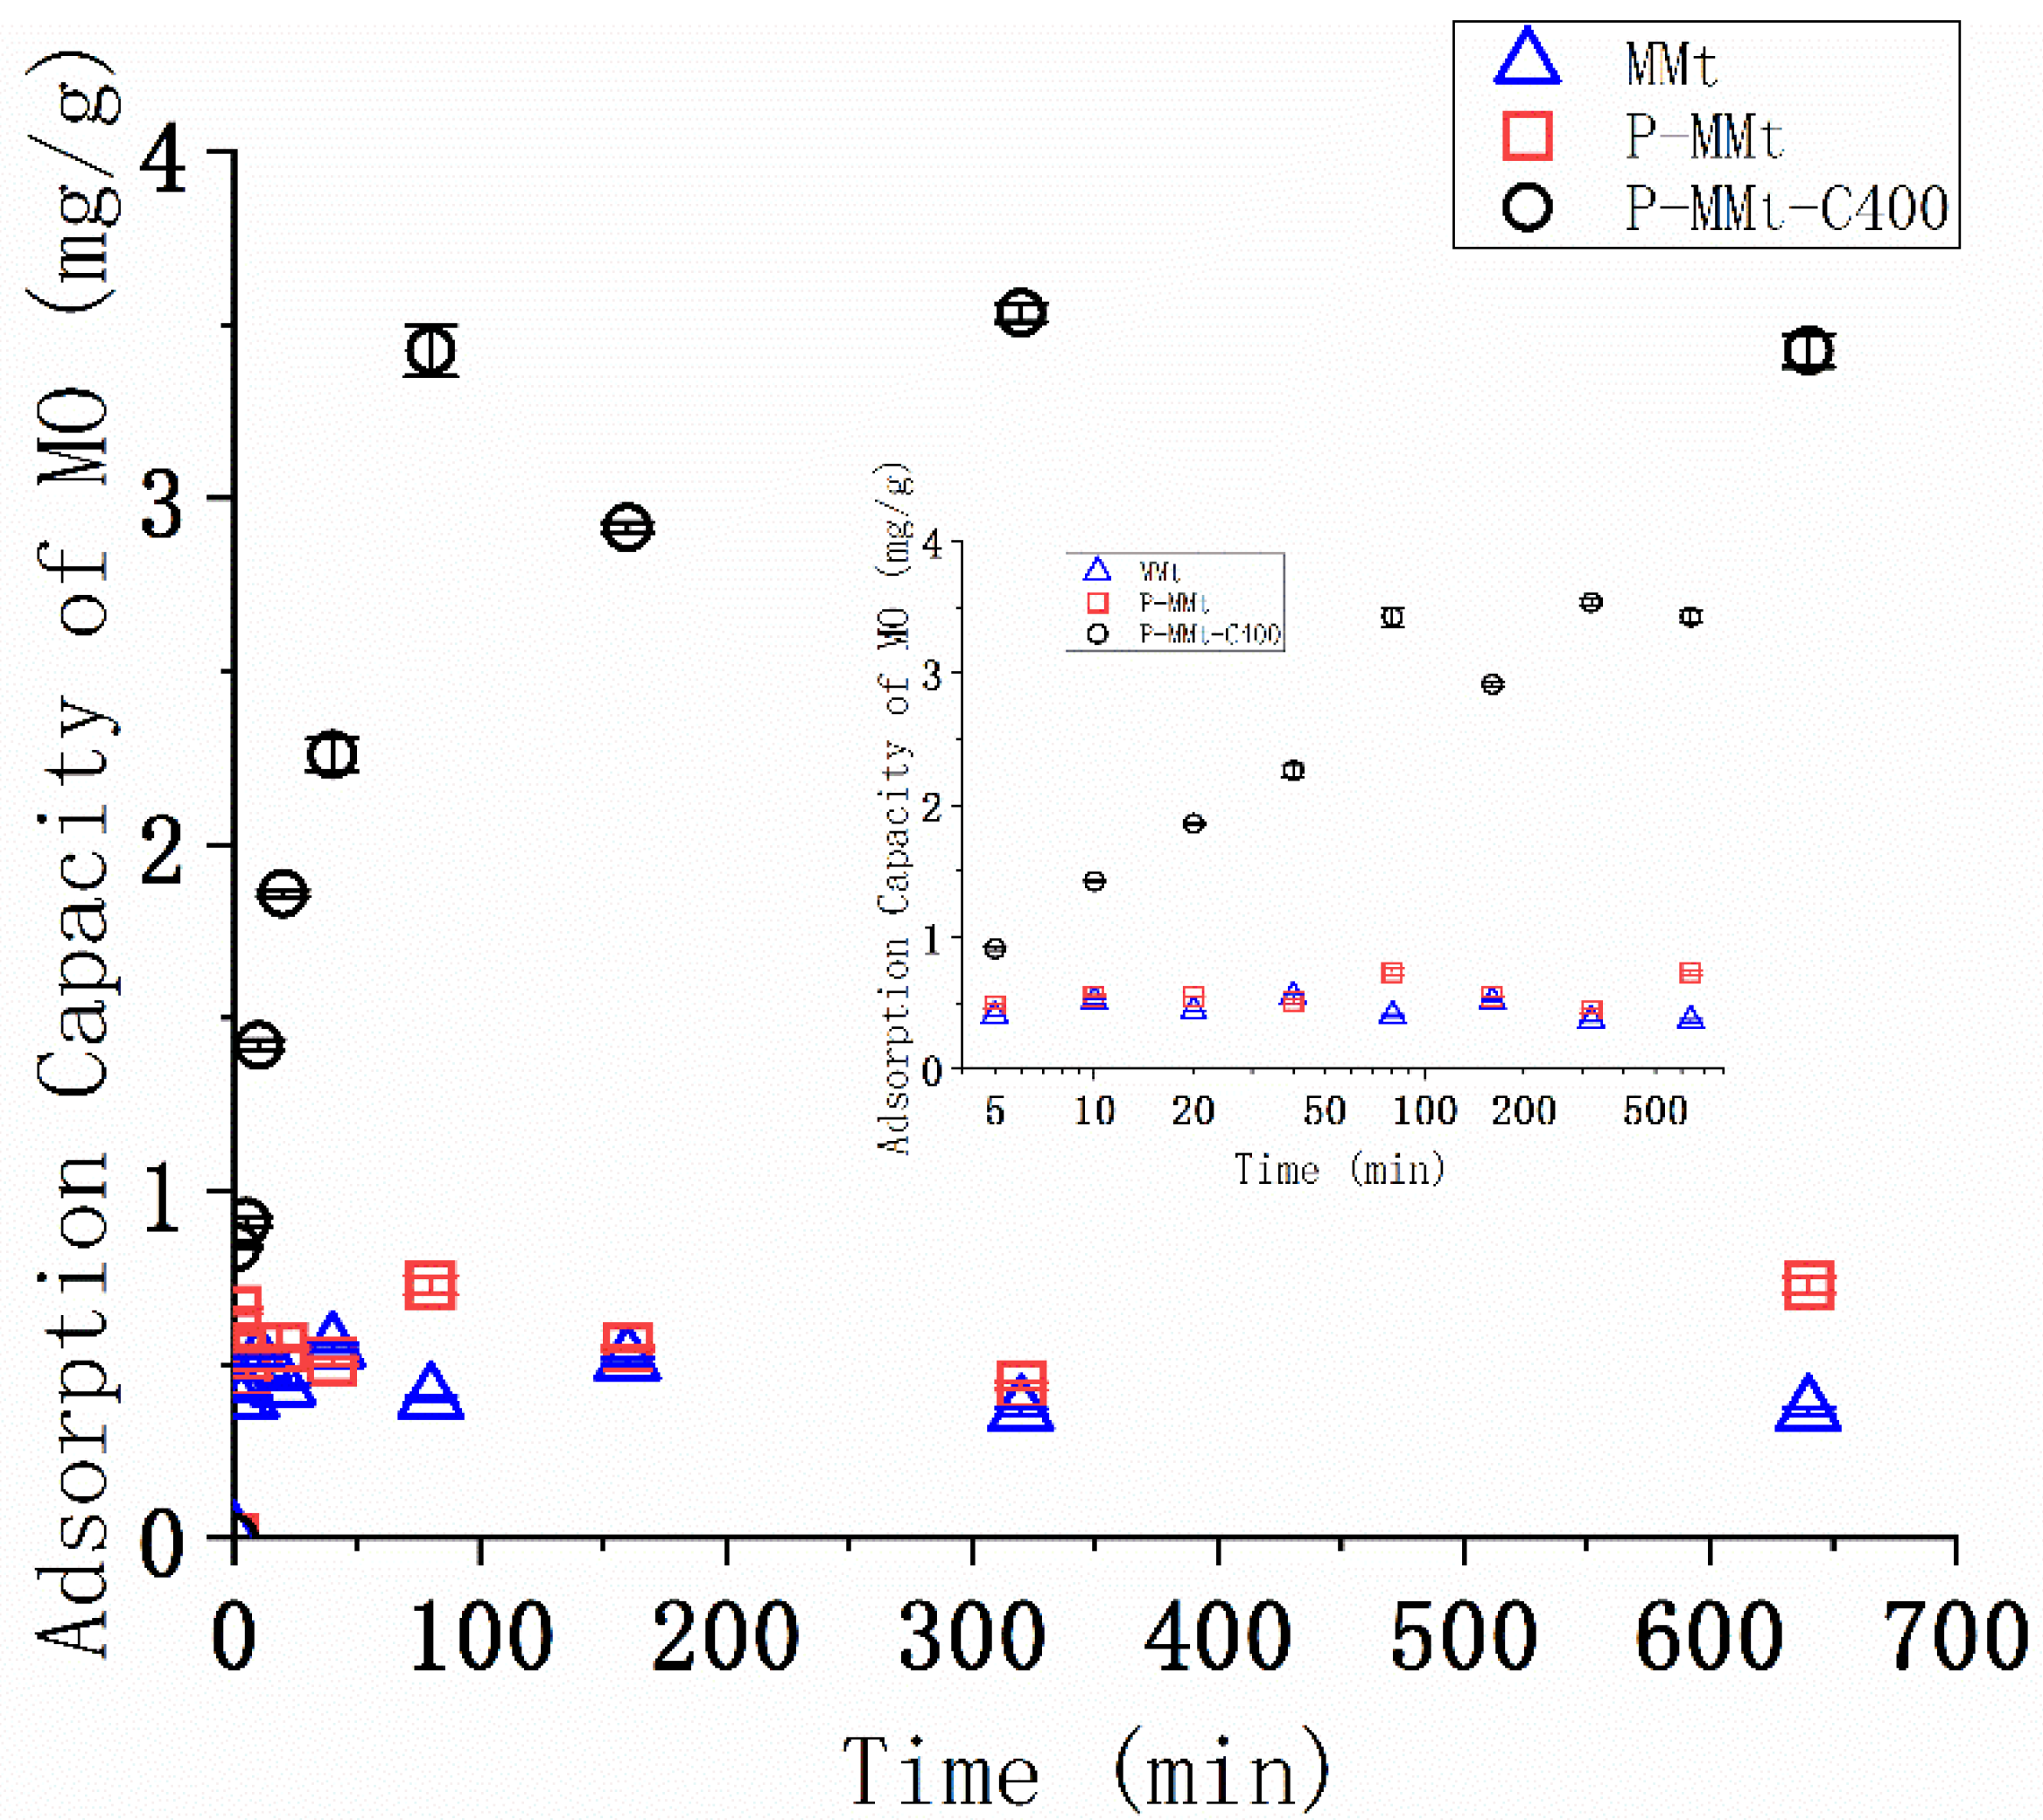
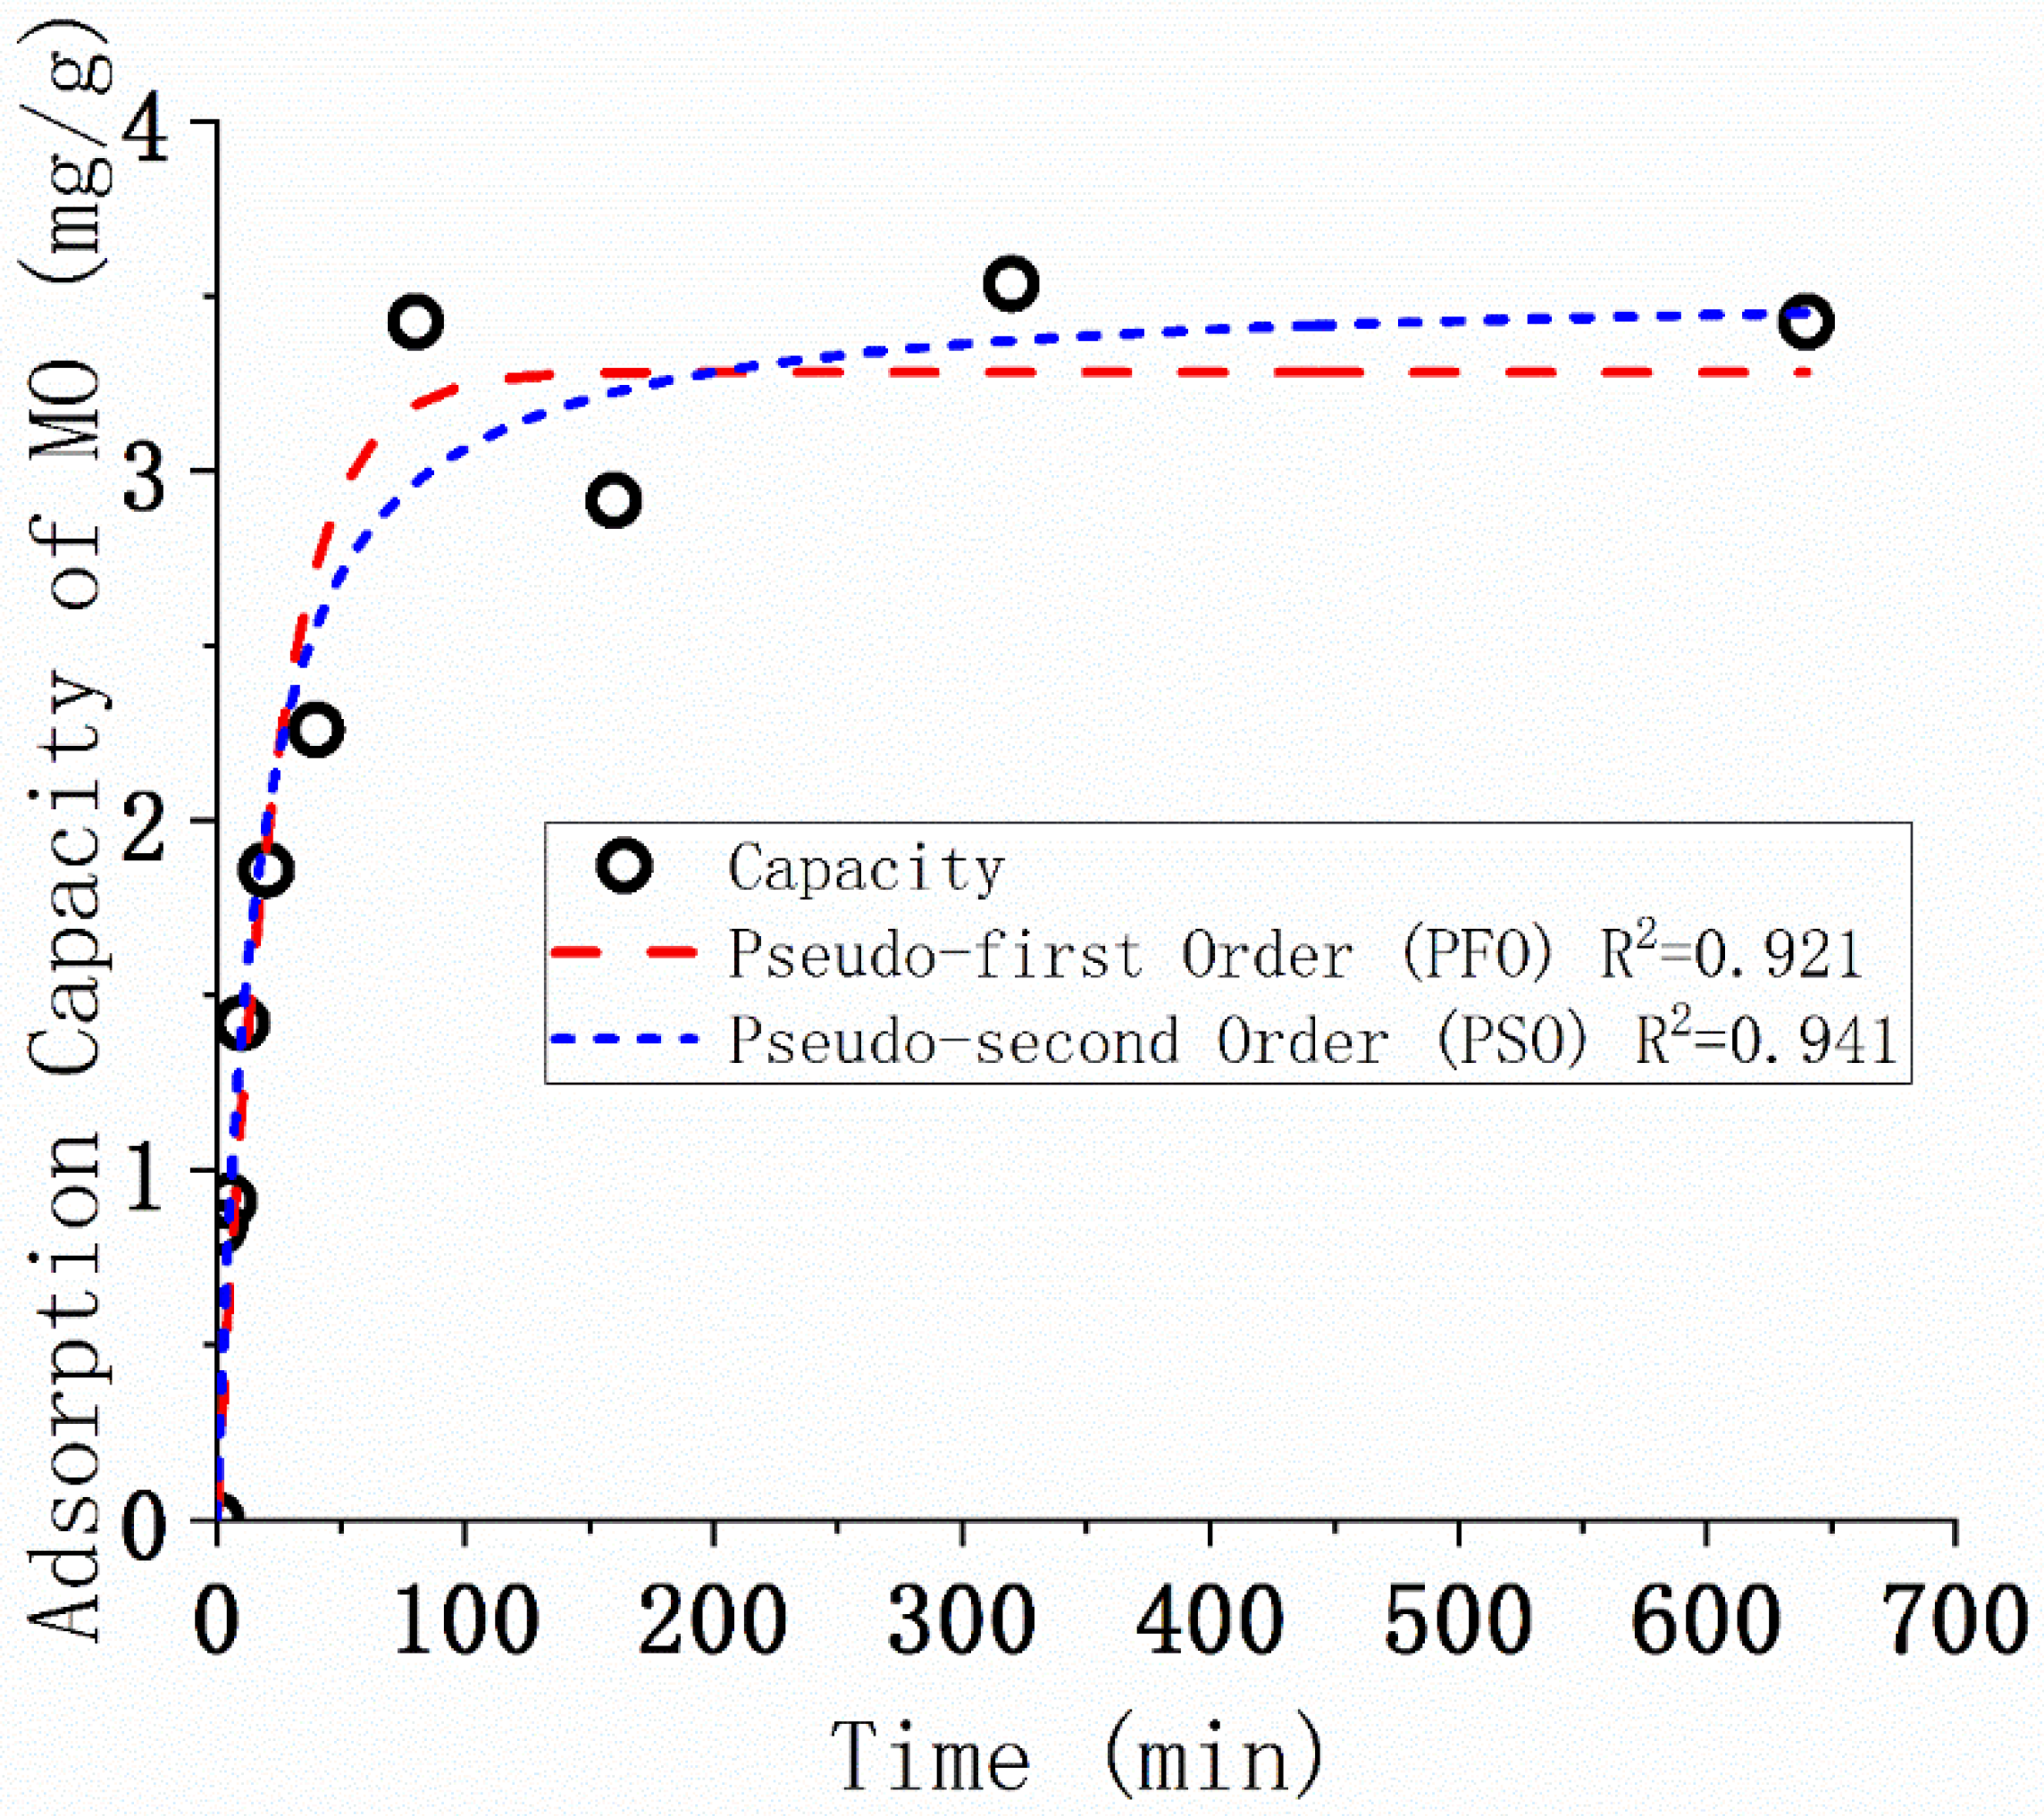
3.5. Kinetics of the MO Adsorption
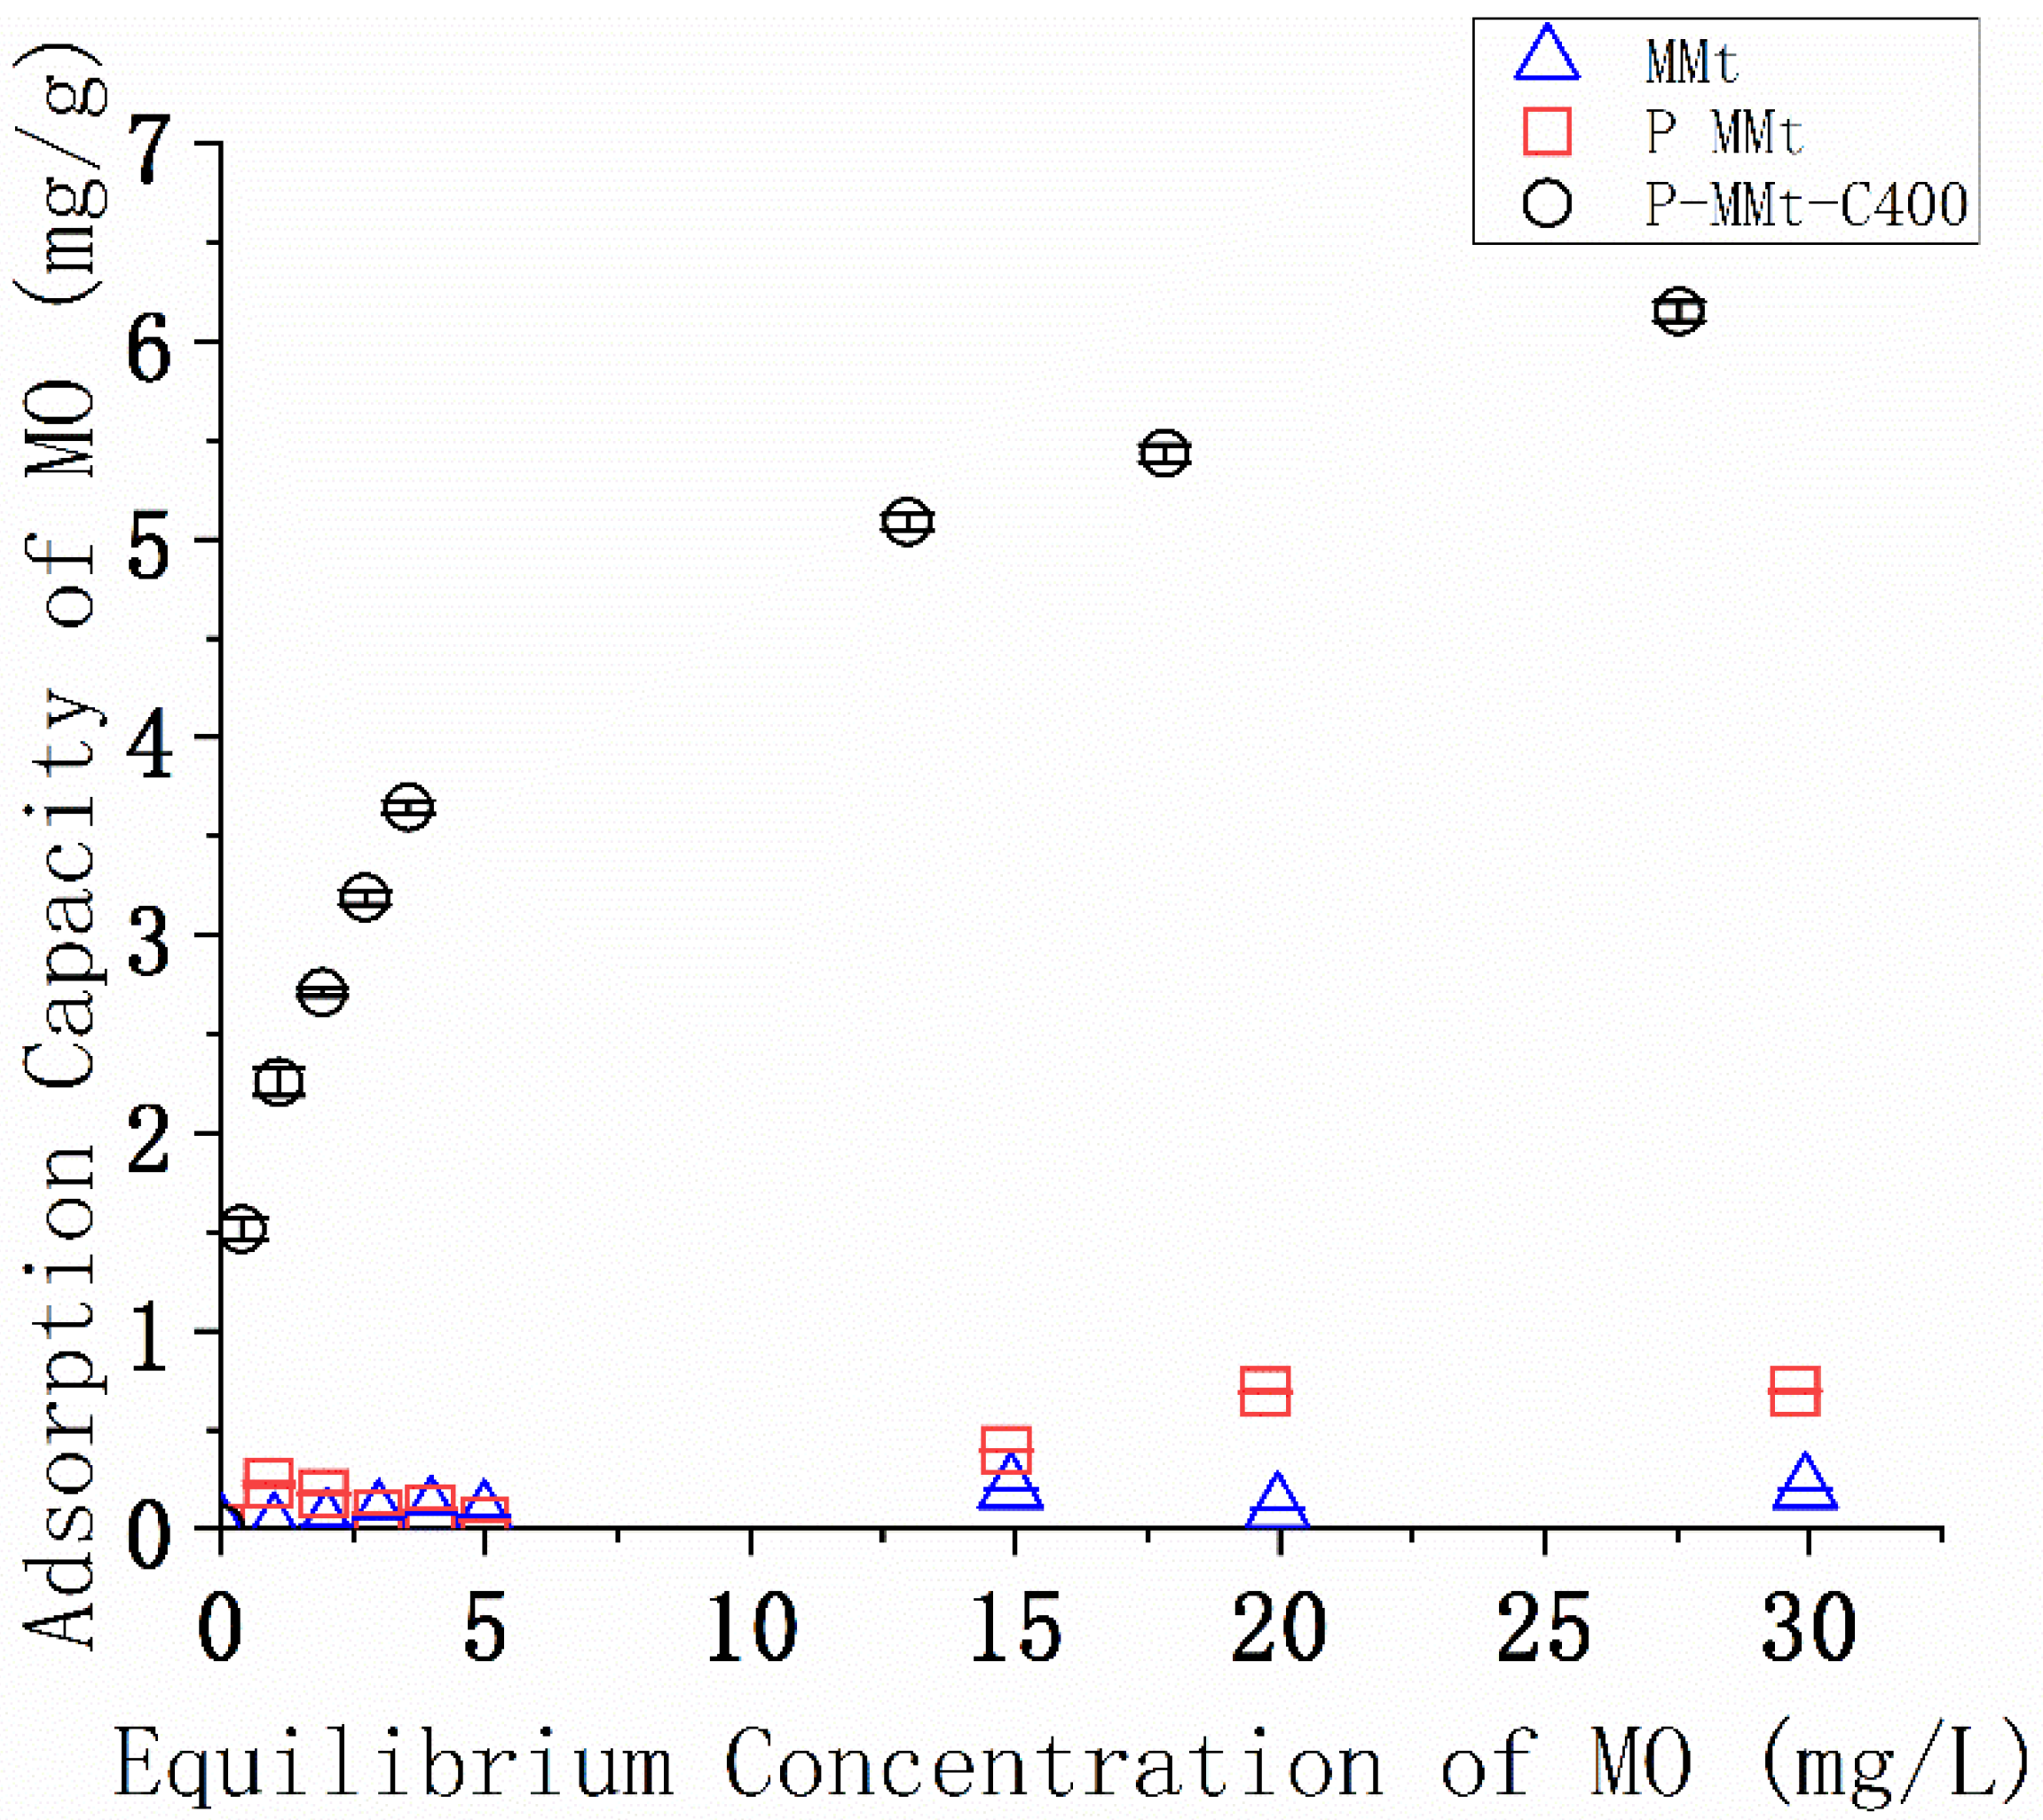
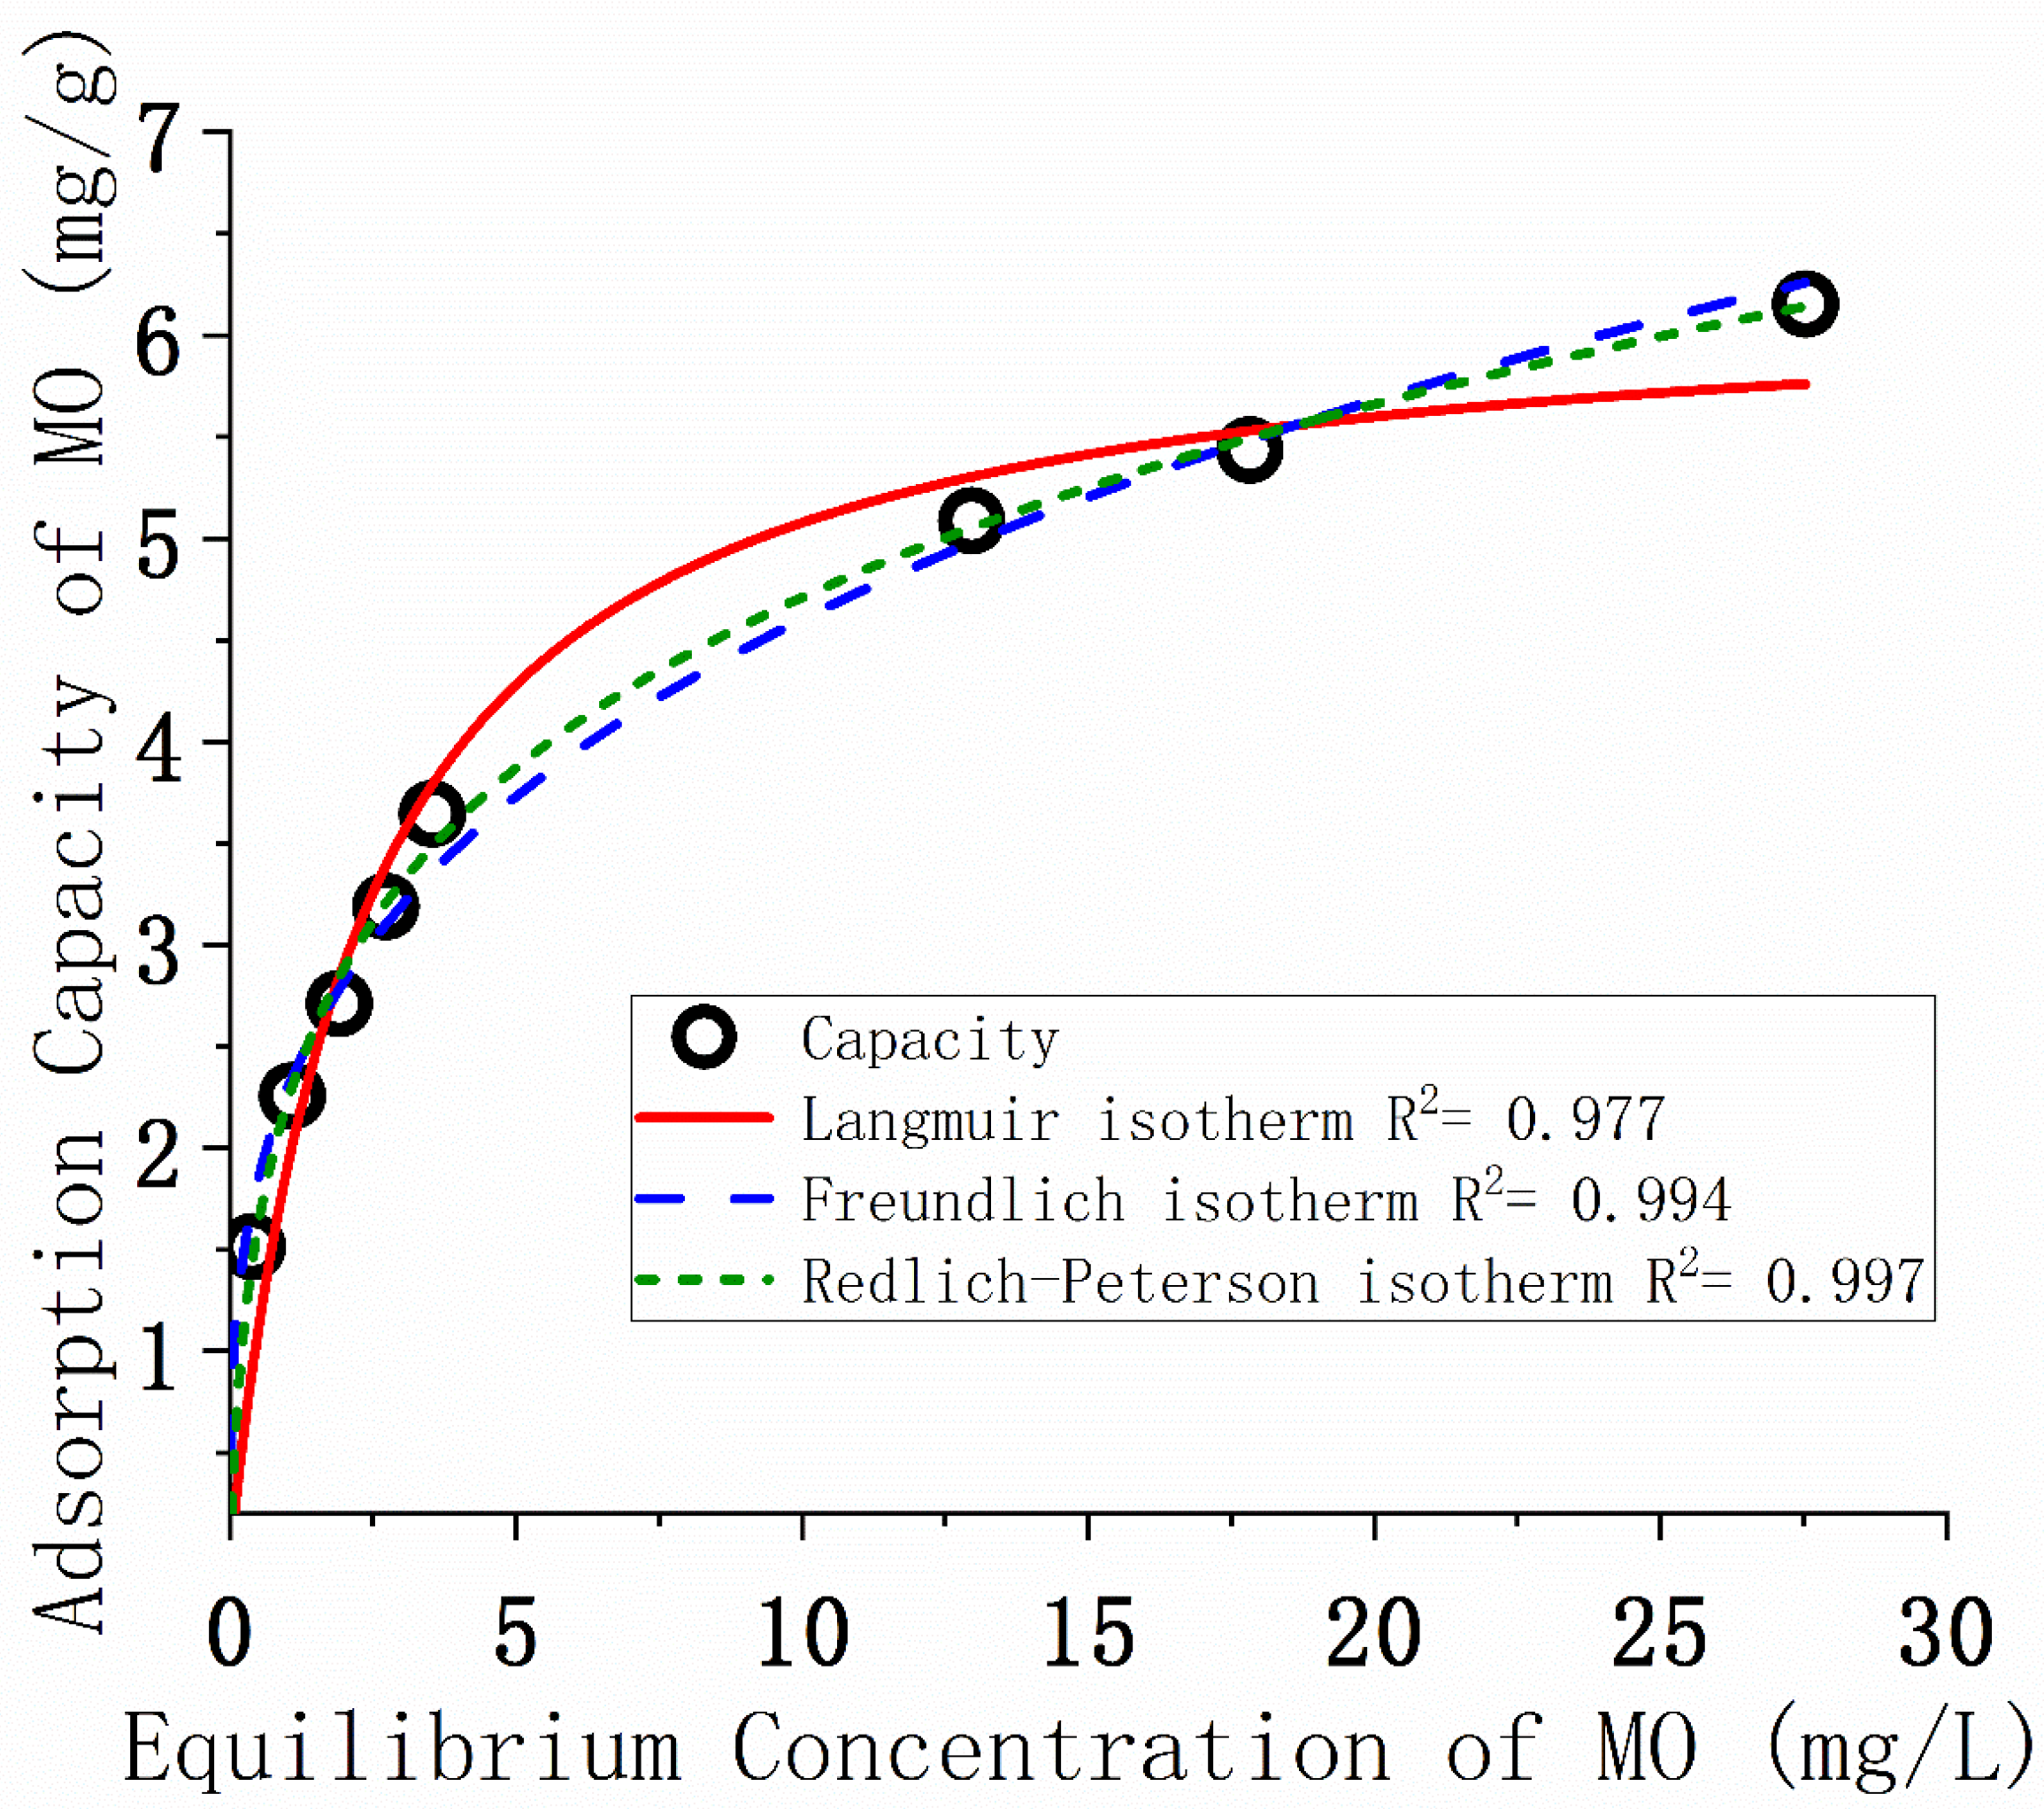
3.6. Isotherms of MO Adsorption
4. Discussion
4.1. Intercalation of the Modifier into MMt
4.2. Thermal Stability of Modified MMt
4.3. Surface Area of Modified MMt
4.4. MO Adsorption of Modified MMt
4.5. Comparison of the Anionic Dye Removal with Other Adsorbents
5. Conclusions
Author Contributions
Funding
Institutional Review Board Statement
Informed Consent Statement
Data Availability Statement
Conflicts of Interest
Appendix A

| Sample | Element Weight % | Al/Si | ||||||||
|---|---|---|---|---|---|---|---|---|---|---|
| C | O | Mg | Al | Si | Ca | Ti | Fe | Other | ||
| MMt | 3.7 | 47.44 | 2.48 | 6.31 | 21.28 | 1.88 | 0.30 | 3.57 | 13.05 | 0.29 |
| P-MMt | 20.31 | 41.42 | 1.35 | 6.67 | 12.45 | 1.56 | 16.24 | 0.53 | ||
| P-MMt-C400 | 10.55 | 41.03 | 1.68 | 7.95 | 14.8 | 2.1 | 21.90 | 0.53 | ||
| Time (min) | MO Adsorption Capacity | |||||
|---|---|---|---|---|---|---|
| MMt | P-MMt | P-MMt-C400 | ||||
| SD | SD | SD | ||||
| 1 | 0.40087 | 0.00549 | 0.65598 | 0.00969 | 0.83819 | 0.00289 |
| 5 | 0.40087 | 0.00615 | 0.47376 | 0.01141 | 0.91108 | 0.01427 |
| 10 | 0.51020 | 0.01151 | 0.54665 | 0.00906 | 1.42128 | 0.01547 |
| 20 | 0.43732 | 0.00677 | 0.54665 | 0.00664 | 1.85860 | 0.01003 |
| 40 | 0.54665 | 0.01006 | 0.51020 | 0.01104 | 2.25948 | 0.04722 |
| 80 | 0.40087 | 0.00835 | 0.72886 | 0.02620 | 3.42566 | 0.07279 |
| 160 | 0.51020 | 0.00886 | 0.54665 | 0.00747 | 2.91545 | 0.01501 |
| 320 | 0.36443 | 0.00848 | 0.43732 | 0.01080 | 3.53499 | 0.02636 |
| 640 | 0.36443 | 0.00997 | 0.72886 | 0.02367 | 3.42566 | 0.04676 |
| MMt | P-MMt | P-MMt-C400 | ||||||
|---|---|---|---|---|---|---|---|---|
| Ce | qe | SD | Ce | qe | SD | Ce | qe | SD |
| 1.0076 | - | - | 0.90845 | 0.22887 | 0.01042 | 0.39437 | 1.5140 | 0.05608 |
| 1.9920 | 0.02000 | 3.4077 × 10⁻⁴ | 1.92913 | 0.17717 | 0.00419 | 1.09693 | 2.2576 | 0.06830 |
| 2.9758 | 0.06048 | 2.3179 × 10⁻⁴ | 2.96875 | 0.07813 | 4.3908 × 10⁻⁴ | 1.91549 | 2.7112 | 0.02008 |
| 3.9673 | 0.08163 | 2.4489 × 10⁻⁴ | 3.96000 | 0.10000 | 7.0265 × 10⁻⁴ | 2.72422 | 3.1894 | 0.03525 |
| 4.9754 | 0.06127 | 1.4228 × 10⁻⁴ | 4.98408 | 0.03981 | 2.3133 × 10⁻⁴ | 3.54167 | 3.6458 | 0.03390 |
| 14.920 | 0.19947 | 5.9841 × 10⁻⁴ | 14.8412 | 0.39683 | 0.00218 | 12.965 | 5.0872 | 0.04070 |
| 19.959 | 0.10040 | 8.5706 × 10⁻⁴ | 19.7233 | 0.69170 | 0.00572 | 17.826 | 5.4347 | 0.04348 |
| 29.920 | 0.19947 | 0.00160 | 29.7214 | 0.69629 | 0.00557 | 27.539 | 6.1523 | 0.04922 |
References
- Zhou, Y.; Lu, J.; Zhou, Y.; Liu, Y. Recent advances for dyes removal using novel adsorbents: A review. Environ. Pollut. 2019, 252, 352–365. [Google Scholar] [CrossRef] [PubMed]
- Darwish, A.A.A.; Rashad, M.; AL-Aoh, H.A. Methyl orange adsorption comparison on nanoparticles: Isotherm, kinetics, and thermodynamic studies. Dye. Pigment. 2019, 160, 563–571. [Google Scholar] [CrossRef]
- Gong, R.; Ye, J.; Dai, W.; Yan, X.; Hu, J.; Hu, X.; Li, S.; Huang, H. Adsorptive removal of methyl orange and methylene blue from aqueous solution with finger-citron-residue-based activated carbon. Ind. Eng. Chem. Res. 2013, 52, 14297–14303. [Google Scholar] [CrossRef]
- Nasar, A.; Mashkoor, F. Application of polyaniline-based adsorbents for dye removal from water and wastewater—A review. Environ. Sci. Pollut. Res. 2019, 26, 5333–5356. [Google Scholar] [CrossRef]
- Bhatia, D.; Sharma, N.R.; Singh, J.; Kanwar, R.S. Biological methods for textile dye removal from wastewater: A review. Crit. Rev. Environ. Sci. Technol. 2017, 47, 1836–1876. [Google Scholar] [CrossRef]
- Gil, A.; Assis, F.C.C.; Albeniz, S.; Korili, S.A. Removal of dyes from wastewaters by adsorption on pillared clays. Chem. Eng. J. 2011, 168, 1032–1040. [Google Scholar] [CrossRef]
- Katheresan, V.; Kansedo, J.; Lau, S.Y. Efficiency of various recent wastewater dye removal methods: A review. J. Environ. Chem. Eng. 2018, 6, 4676–4697. [Google Scholar] [CrossRef]
- Kausar, A.; Iqbal, M.; Javed, A.; Aftab, K.; Nazli, Z.I.H.; Bhatti, H.N.; Nouren, S. Dyes adsorption using clay and modified clay: A review. J. Mol. Liq. 2018, 256, 395–407. [Google Scholar] [CrossRef]
- Adebajo, M.O.; Frost, R.L.; Kloprogge, J.T.; Carmody, O.; Kokot, S. Porous Materials for Oil Spill Cleanup: A Review of Synthesis. J. Porous Mater. 2003, 10, 159–170. [Google Scholar] [CrossRef] [Green Version]
- Liu, C.; Wu, P.; Zhu, Y.; Tran, L. Simultaneous adsorption of Cd2+and BPA on amphoteric surfactant activated montmorillonite. Chemosphere 2016, 144, 1026–1032. [Google Scholar] [CrossRef]
- Rathnayake, S.I.; Xi, Y.; Frost, R.L.; Ayoko, G.A. Structural and thermal properties of inorganic-organic montmorillonite: Implications for their potential environmental applications. J. Colloid Interface Sci. 2015, 459, 17–28. [Google Scholar] [CrossRef] [Green Version]
- De Pablo, L.; Chávez, M.L.; Abatal, M. Adsorption of heavy metals in acid to alkaline environments by montmorillonite and Ca-montmorillonite. Chem. Eng. J. 2011, 171, 1276–1286. [Google Scholar] [CrossRef]
- Chen, C.; Liu, H.; Chen, T.; Chen, D.; Frost, R.L. Applied Clay Science An insight into the removal of Pb (II), Cu (II), Co (II), Cd (II), Zn (II), Ag (I), Hg (I), Cr (VI) by Na (I) -montmorillonite and Ca (II) -montmorillonite. Appl. Clay Sci. 2015, 118, 239–247. [Google Scholar] [CrossRef]
- Uddin, M.K. A review on the adsorption of heavy metals by clay minerals, with special focus on the past decade. Chem. Eng. J. 2017, 308, 438–462. [Google Scholar] [CrossRef]
- Almeida, C.A.P.; Debacher, N.A.; Downs, A.J.; Cottet, L.; Mello, C.A.D. Removal of methylene blue from colored effluents by adsorption on montmorillonite clay. J. Colloid Interface Sci. 2009, 332, 46–53. [Google Scholar] [CrossRef]
- Roca Jalil, M.E.; Baschini, M.; Sapag, K. Influence of pH and antibiotic solubility on the removal of ciprofloxacin from aqueous media using montmorillonite. Appl. Clay Sci. 2015, 114, 69–76. [Google Scholar] [CrossRef]
- Wu, Q.; Li, Z.; Hong, H.; Yin, K.; Tie, L. Adsorption and intercalation of ciprofloxacin on montmorillonite. Appl. Clay Sci. 2010, 50, 204–211. [Google Scholar] [CrossRef]
- Hui, C.; Keeling, J. Applied Clay Science Fundamental and applied research on clay minerals: From climate and environment to nanotechnology. Appl. Clay Sci. 2013, 74, 3–9. [Google Scholar] [CrossRef]
- Liu, Y.; Dong, C.; Wei, H.; Yuan, W.; Li, K. Adsorption of levofloxacin onto an iron-pillared montmorillonite (clay mineral): Kinetics, equilibrium and mechanism. Appl. Clay Sci. 2015, 118, 301–307. [Google Scholar] [CrossRef]
- Okoye, I.P.; Obi, C. Synthesis and Characterization of Al-Pillared Bentonite Clay Minerals. Res. J. Appl. Sci. 2011, 6, 447–450. [Google Scholar] [CrossRef]
- Qin, Z.; Yuan, P.; Yang, S.; Liu, D.; He, H.; Zhu, J. Silylation of Al13-intercalated montmorillonite with trimethylchlorosilane and their adsorption for Orange II. Appl. Clay Sci. 2014, 99, 229–236. [Google Scholar] [CrossRef]
- Kasama, T.; Watanabe, Y.; Yamada, H.; Murakami, T. Sorption of phosphates on Al-pillared smectites and mica at acidic to neutral pH. Appl. Clay Sci. 2004, 25, 167–177. [Google Scholar] [CrossRef]
- Lenoble, V.; Bouras, O.; Deluchat, V.; Serpaud, B.; Bollinger, J.C. Arsenic adsorption onto pillared clays and iron oxides. J. Colloid Interface Sci. 2002, 255, 52–58. [Google Scholar] [CrossRef] [PubMed]
- Hao, Y.F.; Yan, L.G.; Yu, H.Q.; Yang, K.; Yu, S.J.; Shan, R.R.; Du, B. Comparative study on adsorption of basic and acid dyes by hydroxy-aluminum pillared bentonite. J. Mol. Liq. 2014, 199, 202–207. [Google Scholar] [CrossRef]
- Aguiar, J.E.; Bezerra, B.T.C.; Siqueira, A.C.A.; Barrera, D.; Sapag, K.; Azevedo, D.C.S.; Lucena, S.M.P.; Silva, I.J. Improvement in the Adsorption of Anionic and Cationic Dyes from Aqueous Solutions: A Comparative Study using Aluminium Pillared Clays and Activated Carbon. Sep. Sci. Technol. 2014, 49, 741–751. [Google Scholar] [CrossRef] [Green Version]
- Trabelsi, H.; Khadhraoui, M.; Hentati, O.; Ksibi, M. Titanium dioxide mediated photo-degradation of methyl orange by ultraviolet light. Toxicol. Environ. Chem. 2013, 95, 543–558. [Google Scholar] [CrossRef]
- Wu, Q.Y.; Liang, H.Q.; Li, M.; Liu, B.T.; Xu, Z.K. Hierarchically porous carbon membranes derived from PAN and their selective adsorption of organic dyes. Chin. J. Polym. Sci. (Engl. Ed.) 2016, 34, 23–33. [Google Scholar] [CrossRef]
- Song, S.; Hao, C.; Zhang, X.; Zhang, Q.; Sun, R. Sonocatalytic degradation of methyl orange in aqueous solution using Fe-doped TiO2 nanoparticles under mechanical agitation. Open Chem. 2018, 16, 1283–1296. [Google Scholar] [CrossRef] [Green Version]
- Roca Jalil, M.E.; Vieira, R.S.; Azevedo, D.; Baschini, M.; Sapag, K. Improvement in the adsorption of thiabendazole by using aluminum pillared clays. Appl. Clay Sci. 2013, 71, 55–63. [Google Scholar] [CrossRef]
- Kumararaja, P.; Manjaiah, K.M.; Datta, S.C.; Sarkar, B. Remediation of metal contaminated soil by aluminium pillared bentonite: Synthesis, characterisation, equilibrium study and plant growth experiment. Appl. Clay Sci. 2017, 137, 115–122. [Google Scholar] [CrossRef]
- Tan, K.L.; Hameed, B.H. Insight into the adsorption kinetics models for the removal of contaminants from aqueous solutions. J. Taiwan Inst. Chem. Eng. 2017, 74, 25–48. [Google Scholar] [CrossRef]
- Lagergren, S.K. About the theory of so-called adsorption of soluble substances. Sven. Vetenskapsakad. Handingarl 1898, 24, 1–39. [Google Scholar]
- Ho, Y.S. Review of second-order models for adsorption systems. J. Hazard. Mater. 2006, 136, 681–689. [Google Scholar] [CrossRef] [PubMed] [Green Version]
- Ho, Y.; McKay, G. Pseudo-second order model for sorption processes. Process Biochem. 1999, 34, 451–465. [Google Scholar] [CrossRef]
- Rathnayake, S.I.; Xi, Y.; Frost, R.L.; Ayoko, G.A. Environmental applications of inorganic-organic clays for recalcitrant organic pollutants removal: Bisphenol A. J. Colloid Interface Sci. 2016, 470, 183–195. [Google Scholar] [CrossRef] [Green Version]
- Langmuir, I. The constitution and fundamental properties of solids and liquids. part I. solids. J. Am. Chem. Soc. 1916, 38, 2221–2295. [Google Scholar] [CrossRef] [Green Version]
- Langmuir, I. The constitution and fundamental properties of solids and liquids. Part II.—Liquids. J. Franklin Inst. 1917, 184, 721. [Google Scholar] [CrossRef]
- Freundlich, H.M.F. Over the Adsorption in Solution. J. Phys. Chem. 1906, 57, 384–470. [Google Scholar]
- Ayawei, N.; Ebelegi, A.N.; Wankasi, D. Modelling and Interpretation of Adsorption Isotherms. J. Chem. 2017, 2017, 1–11. [Google Scholar] [CrossRef]
- Choudhary, B.; Paul, D. Isotherms, kinetics and thermodynamics of hexavalent chromium removal using biochar. J. Environ. Chem. Eng. 2018, 6, 2335–2343. [Google Scholar] [CrossRef]
- Redlich, O.; Peterson, D.L. A Useful Adsorption Isotherm. J. Phys. Chem. 1959, 63, 1024. [Google Scholar] [CrossRef]
- Barakan, S.; Aghazadeh, V. Synthesis and characterization of hierarchical porous clay heterostructure from Al, Fe -pillared nano-bentonite using microwave and ultrasonic techniques. Microporous Mesoporous Mater. 2019, 278, 138–148. [Google Scholar] [CrossRef]
- Zhu, J.; Wen, K.; Wang, Y.; Ma, L.; Su, X.; Zhu, R.; Xi, Y.; He, H. Superior thermal stability of Keggin-Al30pillared montmorillonite: A comparative study with Keggin-Al13pillared montmorillonite. Microporous Mesoporous Mater. 2018, 265, 104–111. [Google Scholar] [CrossRef] [Green Version]
- Sartor, L.R.; De Azevedo, A.C.; Andrade, G.R.P. Study of colloidal properties of natural and Al-pillared smectite and removal of copper ions from an aqueous solution. Environ. Technol. 2015, 36, 786–795. [Google Scholar] [CrossRef]
- Zhu, J.; Wen, K.; Zhang, P.; Wang, Y.; Ma, L.; Xi, Y.; Zhu, R.; Liu, H.; He, H. Keggin-Al30pillared montmorillonite. Microporous Mesoporous Mater. 2017, 242, 256–263. [Google Scholar] [CrossRef]
- Sing, K.S.W.; Everett, D.H.; Haul, R.A.W.; Moscou, L.; Pierotti, R.A.; Rouquerol, J.; Siemieniewska, T. Reporting Physisorption Data for Gas/Solid Systems with Special Reference to the Determination of Surface Area and Porosity. Pure Appl. Chem. 1985, 57, 603–619. [Google Scholar] [CrossRef]
- Occelli, M.; Bertrand, J.; Gould, S.A.; Dominguez, J. Erratum to: Physicochemical characterization of a Texas montmorillonite pillared with polyoxocations of aluminum. Part I: The microporous structure [Microporous and Mesoporous Materials 34 (2000) 195–206]. Microporous Mesoporous Mater. 2000, 40, 351. [Google Scholar] [CrossRef]
- Ge, Z.; Li, D.; Pinnavaia, T.J. Preparation of alumina-pillared montmorillonites with high thermal stability, regular microporosity and Lewis/Brönsted acidity. Microporous Mater. 1994, 3, 165–175. [Google Scholar] [CrossRef]
- Mnasri, S.; Frini-srasra, N. Infrared Physics & Technology Evolution of Brönsted and Lewis acidity of single and mixed pillared bentonite. Infrared Phys. Technol. 2013, 58, 15–20. [Google Scholar] [CrossRef]
- Wang, K.; Zhang, Y.; Qi, R.; Yang, M.; Deng, R. Effects of activated carbon surface chemistry and pore structure on adsorption of HAAs from water. Huagong Xuebao/J. Chem. Ind. Eng. 2006, 57, 1659–1663. [Google Scholar]
- Huang, R.; Hu, C.; Yang, B.; Zhao, J. Zirconium-immobilized bentonite for the removal of methyl orange (MO) from aqueous solutions. Desalin. Water Treat. 2016, 57, 10646–10654. [Google Scholar] [CrossRef]
- Bouberka, Z.; Khenifi, A.; Benderdouche, N.; Derriche, Z. Removal of Supranol Yellow 4GL by adsorption onto Cr-intercalated montmorillonite. J. Hazard. Mater. 2006, 133, 154–161. [Google Scholar] [CrossRef] [PubMed]


| Chemical composition | SiO2: 60.34%, Al2O3: 16.83%, MgO: 5.43%, Fe2O3: 4.45%, CaO: 2.83%, TiO2: 0.29%, K2O: 0.09%, Na2O: 0.06%. (LOI: 9.76%) |
| Structural formula * | |
| Particle size distribution | 0.227–2.289 μm, Dx (50) = 1.221 μm |
| Structure |  |
| Molecular Weight (g/mol) | 327.3 |
| Molecular size (nm) | 1.19 × 0.67 × 0.38 [26] |
| S(BET) | S(Langmuir) | S(t-plot) | S(micro) * | |
|---|---|---|---|---|
| m2/g | m2/g | m2/g | m2/g | |
| MMt | 61.1 | 66.1 | 42.7 | 18.6 |
| P-MMt | 292.1 | 358.3 | 59.5 | 238.1 |
| P-MMt-C400 | 293.7 | 339.1 | 70.7 | 223.0 |
| Kinetic Model | Parameter | |
|---|---|---|
| qexp (mg/g) at 640 min | 3.42 ± 0.04 | |
| Pseudo-first-order (PFO) | qe (mg/g) | 3.28 ± 0.19 |
| k1 (min−1) | 0.0443 ± 0.0100 | |
| R2 | 0.921 | |
| Pseudo-second-order (PSO) | qe (mg/g) | 3.53 ± 0.20 |
| k2 (mg/g)/min | 0.0184 ± 0.0056 | |
| R2 | 0.941 | |
| Isotherm Model | Parameter | P-MMt-C400 |
|---|---|---|
| Langmuir | qm (mg/g) | 6.23 ± 0.27 |
| KL (L/mg) | 0.436 ± 0.066 | |
| R2 | 0.977 | |
| Freundlich | KF ((mg/g)/(mg/L)n) | 2.29 ± 0.07 |
| 1/n | 0.30 ± 0.01 | |
| R2 | 0.994 | |
| Redlich-Peterson | KR (L/g) | 9.87 ± 2.81 |
| αR (L/mg) | 3.43 ± 1.21 | |
| β | 0.76 ± 0.02 | |
| R2 | 0.998 |
| Absorbent | Anionic Dye | qmax (mg/g) | qmax (mmol/g) | Reference |
|---|---|---|---|---|
| Al-pillared montmorillonite | Methyl Orange | 6.23 | 0.0190 | this study |
| Zr-pillared bentonite (without calcination) | Methyl Orange | 44.13 | 0.1348 | [51] |
| Al-pillared montmorillonite | Reactive Black 5 | 40.8 | 0.0411 | [25] |
| Al-pillared bentonite (without calcination) | Acid Turquoise Blue A | 2.639 | 0.0038 | [24] |
| Al-pillared montmorillonite | Orange II | 4.1 | 0.0117 | [6] |
| Zr-pillared montmorillonite | Orange II | 4.3 | 0.0123 | [6] |
| Cr-pillared montmorillonite | Supranol Yellow 4GL | 58.47 | 0.0526 | [52] |
Publisher’s Note: MDPI stays neutral with regard to jurisdictional claims in published maps and institutional affiliations. |
© 2022 by the authors. Licensee MDPI, Basel, Switzerland. This article is an open access article distributed under the terms and conditions of the Creative Commons Attribution (CC BY) license (https://creativecommons.org/licenses/by/4.0/).
Share and Cite
Chen, J.; Lu, J.; Su, L.; Ruan, H.; Zhao, Y.; Lee, C.; Cai, Z.; Wu, Z.; Jiang, Y. Enhanced Adsorption of Methyl Orange by Mongolian Montmorillonite after Aluminum Pillaring. Appl. Sci. 2022, 12, 3182. https://doi.org/10.3390/app12063182
Chen J, Lu J, Su L, Ruan H, Zhao Y, Lee C, Cai Z, Wu Z, Jiang Y. Enhanced Adsorption of Methyl Orange by Mongolian Montmorillonite after Aluminum Pillaring. Applied Sciences. 2022; 12(6):3182. https://doi.org/10.3390/app12063182
Chicago/Turabian StyleChen, Jiajun, Jianzun Lu, Lingcheng Su, Huada Ruan, Yijia Zhao, Chiuhong Lee, Zongwei Cai, Zhihui Wu, and Yanan Jiang. 2022. "Enhanced Adsorption of Methyl Orange by Mongolian Montmorillonite after Aluminum Pillaring" Applied Sciences 12, no. 6: 3182. https://doi.org/10.3390/app12063182
APA StyleChen, J., Lu, J., Su, L., Ruan, H., Zhao, Y., Lee, C., Cai, Z., Wu, Z., & Jiang, Y. (2022). Enhanced Adsorption of Methyl Orange by Mongolian Montmorillonite after Aluminum Pillaring. Applied Sciences, 12(6), 3182. https://doi.org/10.3390/app12063182