Article

Performance Assessment of Low-Temperature Solar Collector with Fullerenes C60 Manufactured at Low Cost in an Emerging Country

by
Esteban Eduardo Barrera
1,2,
Abraham Medina
2,
Lucía Graciela Díaz-Barriga
3,
Alejandro Zacarías
2,*,
José de Jesús Rubio
2,
Geydy Luz Gutiérrez
4,
José Michael Cruz
2,5,
Mercedes De Vega
6,
Néstor García
6 and
María Venegas
6
1
ITQ, Tecnológico Nacional de México, Av. Tecnológico s/n, Esq. Gral. Mariano Escobedo, Mexico City 76000, Mexico
2
ESIME Azcapotzalco, Instituto Politécnico Nacional, Av. de las Granjas 682, Santa Catarina, Mexico City 02250, Mexico
3
ESIQUIE, Instituto Politécnico Nacional, UPALM, Mexico City 07738, Mexico
4
Departamento de Ingeniería Mecánica-Eléctrica, Universidad Autónoma de San Luis Potosí, Dr. Manuel Nava No. 8, Zona Universitaria Poniente, San Luis Potosí 78290, Mexico
5
ITA, Tecnológico Nacional de México, Carretera Apizaco Tzompantepec, Esq. Con Av. Instituto Tecnológico s/n, Apizaco-Tzompantepec, Apizaco 90300, Mexico
6
Departamento de Ingeniería Térmica y de Fluidos, Universidad Carlos III de Madrid, Avda. Universidad 30, Leganés, 28911 Madrid, Spain
*
Author to whom correspondence should be addressed.
Appl. Sci. 2022, 12(6), 3161; https://doi.org/10.3390/app12063161
Submission received: 20 February 2022 / Revised: 11 March 2022 / Accepted: 16 March 2022 / Published: 20 March 2022
(This article belongs to the Special Issue Recent Progress in Solar Thermal Technologies and Applications)

Abstract

:

Featured Application

Solar thermal collectors with nanofluids.

Abstract

In this work, the performance of a low-temperature solar collector (LTSC) is evaluated, using carbon nanoparticles in water as working fluid. The nanoparticles used are crystallized fullerenes, with a red parameter of 1.42 nm ± 0.5 nm, with different volume fractions in water. The thickness of the carbon film was approximately 140 to 520 nm. The study is divided into three parts: modeling and simulation of an LTSC, low-cost production and characterization of nanoparticles, and thermal evaluation of the LTSC. For the study, fullerenes were produced by microwave synthesis from a terpenoid resin (Camphor) and the nanoparticles were characterized by scanning electron microscopy (SEM) and High-Resolution Transmission (HRTEM). Tests were carried out with different volumetric flow rates, 0.0111 LT/s, 0.0166 LT/s and 0.0194 L/s, and two volumetric concentrations, 0.035% and 0.063%. The results obtained from the fullerene nanofluid showed an improvement in the thermophysical properties compared to the properties of water. The performance results showed that the efficiency increases up to 47.2% compared to that of water, with a volume fraction of 0.063%, and a flow rate of 0.0194 LT/s.

1. Introduction

According to [1], it is predicted that by 2100, solar technologies will supply approximately 70% of the world’s energy consumption. Conventional low- and medium-temperature collectors are used to collect heat, for space heating or hot water supply [2,3]. The absorber of the solar collector has a solid surface of thermally stable polymers, aluminum, steel or copper, to which a matte black or wavelength selective coating is applied. This solid surface is supported by a fluid pipe coil, placed in an insulated casing with transparent glazing. The working fluid circulates through the tube and absorbs heat indirectly from the absorber, through conduction and convection. Therefore, a large amount of heat is lost to the environment by radiation and convection and other components by conduction, as stated by [4].
Due to the existing thermal resistance, to convert the incoming radiation into the internal energy of the transport medium, an alternative design idea is proposed, in which the working fluid is directly exposed to the incident radiation and the heat is absorbed volumetrically within the transport medium, rather than within a thin surface layer. With this, the thermal resistance, when converting solar energy into thermal energy of the working fluid, is significantly reduced in a direct absorption system.
The direct absorption solar collector concept was first proposed by Minardi and Chuang in 1975 [5]. It consists of a container with a transparent cover, a channel where the thermal liquid circulates, and insulation to reduce heat loss; it is easy to build and has low cost [6]. Unlike other collectors, the working fluid directly absorbs radiation instead of an absorber plate or tube, so it must have the ability to absorb broadly in the solar spectrum (ultraviolet, visible and infrared) [6,7]. Various works have been developed to improve the performance of direct absorption solar collectors, as can be seen in [8,9,10]. Arai et al. [11] developed a volumetric solar collector, in which three types of semi-transparent liquid suspensions of microparticles were used: graphite (black), carborundum (grey), and silicon dioxide (white), in diethyl phthalate (colorless liquid). Measurements of the absorption coefficient of each suspension demonstrated the effectiveness of the use of fine particle additives. Further investigations on a high flux direct absorption collector, using salt, demonstrated the need to add particles to salt, which is a relatively weak absorber in the visible and near-infrared regions of the solar spectrum, to increase its absorption capacity [12]. Meanwhile, it was shown that the addition of organic and inorganic micron-sized chromophores, such as black dyes or carbon black in low-flow collectors, to salt eutectics in high-flow systems, caused thermal and photochemical degradation [13], which can lead to several practical drawbacks, such as reduced absorption, fouling and clogging of surfaces, erosion and abrasion of pipes and pumps over time [14].
The stability of nanofluids is a fundamental criterion for choosing a thermal fluid, because if the nanofluid is unstable, the nanoparticles will agglomerate, so that they will have a greater tendency to settle, which will produce a reduction in thermal and radiative properties [15,16]. There are various factors that affect the stability of a nanofluid; for example, the concentration, characteristics of the nanoparticle (such as shape and size), the base fluid used, pH, among others. At a higher concentration of nanoparticles, the distance between them is smaller, so it is more likely that they will collide and, therefore, agglomerate. Forms of nanoparticles that have a larger surface area tend to agglomerate more easily, due to their greater possibility for collisions. Base fluids, which are polar, contain ions that allow the formation of electrical layers in each nanoparticle, which allows repulsion between two neighboring nanoparticles. The use of surfactants that induce changes in the surface also allows one to obtain stable nanofluids. In the case of nanofluids synthesized by the two-step method, which are usually more unstable than those of the one-step method [17], dispersion using mechanical agitation and ultrasonication is recommended, the latter being more effective in achieving that nanofluids remain stable for a longer period of time.
Various authors, such as [18,19,20], have shown that the use of water-based nanofluids improves the efficiency of solar thermal collectors. In the case of the direct absorption solar collectors, the improvement in thermal efficiency using nanofluids has also been demonstrated [21,22].
The advantage of heating within the volume of the liquid is mentioned in [23], where the authors studied the efficiency of the direct absorption solar collector using nanofluids. The configuration had dimensions of 3 × 5 cm, with a channel depth of 150 μm. Three different types of nanoparticles were used for the study: graphite (30 nm in diameter), carbon nanotube (6–20 nm in diameter and 1000–5000 in length), and silver (20 and 40 nm in diameter). Measurements were taken by varying particle size or volume fraction. They found that variability in size, shape and volume fraction can lead to maximum spectral absorption. Efficiency improvement of up to 5% was seen using the nanofluid. The experimental and numerical results showed a rapid initial increase in efficiency with an increase in volume fraction; however, a slight reduction in efficiency was observed for a further increase in volume fraction. Using this method, the need for a hot surface that only transfers heat to a small area of the liquid is eliminated. In [24], the authors observed that the presence of nanoparticles increases the absorption of incident radiation by more than 9 times, with respect to pure water. In [25], the authors noted that, depending on the particle material, size, shape, and volume fraction, a fluid can change from being nearly transparent to sunlight (in the case of water, alcohols, oils, and glycols), to being a very efficient volumetric absorber of sunlight. They present some benefits, including the improvement of thermophysical properties of conventional working fluids. The system considered can absorb more than 90% of the incident radiant energy, in addition to improving the performance of the collector by up to 10%. Gupta et al. [26] experimentally investigated the efficiency of a low-temperature solar collector under outdoor conditions, using various concentrations of water-based Al2O3 nanoparticle suspensions (0.001% to 0.05% vol.) as working fluid. The researchers reported an improvement in solar collector efficiency compared to using water. Instantaneous efficiency versus reduced temperature plots showed that increasing the concentration of nanoparticles beyond 0.005% vol. had an inverse effect on efficiency. A maximum improvement in efficacy of 39.6% was observed using 0.005% vol. of nanofluid. Karami et al. [27] experimentally studied the efficiency of a low-temperature solar collector with applicability for domestic hot water systems, using CuO nanoparticles in water as the base fluid, under real outdoor conditions. The effect of the emissivity of the inner surface of the bottom wall, the inlet temperature of the nanofluid, the flow rate and the concentration, on the efficiency of the collector was evaluated. The use of a black background inner surface was shown to increase efficiency up to approximately 11.4% more than the reflective inner surface. Collector efficiency was reported to have a direct relationship with nanofluid concentration and flow rate. Nanofluids with volumetric fractions of 25,100 ppm could improve collector efficiency by 91.7% compared to base fluid.
Water-based carbon nanoparticles improve the efficiency of solar collectors, as shown in [28,29]. On the other hand, as seen in [30], carbon nanomaterial can be obtained at low cost. For the preparation of carbon films, different methods are currently used, such as: magnetron sputtering, chemical vapor synthesis, physical vapor deposition or electric discharge [31,32]. In these methods, carbon films are obtained at temperatures of 950 °C–1250 °C using inert atmospheres or carbon gases as control atmospheres, continuously, to obtain films with thicknesses from 500 nm to 10 microns and crystalline or amorphous structure, which makes the process more expensive [33]. Furthermore, Refs. [34,35,36] reported that C10H16O camphor resin has been successfully used in the synthesis of carbon nanomaterials and carbon films. On the other hand, Microwave-Assisted Synthesis (MOAS), as reported in [37,38], can produce materials and microstructures at low cost, with low energy consumption, which contributes to reducing global warming.
The objective of this work is to evaluate the performance of a direct absorption solar collector, in order to improve the performance of photothermal solar collectors and use them for heating in emerging countries. The influence of volume fraction, temperature and solar radiation on the performance of a direct absorption solar collector, using carbon nanofluid for residential application, is analyzed. First, the modeling and simulation of a direct absorption solar collector and the manufacturing procedure and characterization of carbon nanoparticles are presented. Then, the installation and experimental procedure are detailed. In the results section, the results obtained from the simulation, microscopy and experimentation are presented.

2. Materials and Methods

2.1. Modeling and Simulating of the Solar Collector

2.1.1. Modeling

The modeling of a direct absorption solar collector, such as the one shown in Figure 1 was carried out as in [39,40]. In the figure, the direction of the fluid flow, the incident solar radiation and the proportional relationship between the dimensions of the solar collector are indicated.
For the development of this model, the following assumptions were made:
Assumption 1.
The flow is assumed to be in a steady state, incompressible, laminar and fully developed in the collector.
Assumption 2.
Top, bottom and lateral thermal losses are determined as recommended in [41].
Assumption 3.
The side walls and the bottom of the collector are considered adiabatic.
Assumption 4.
Nanofluid properties change with temperature, even with the base fluid.
The useful heat in a direct absorption collector is calculated as:
  Q ˙ u = A c F R [ I U L T i T a ]
where FR is evaluated from:
F R = m ˙ Cp nf T o T i A c [ I U L T i T a ]
In this equation, FR is the removal factor in the direct absorption collector, Cpnf is the specific heat of the nanofluid, UL defines the heat losses, I is the solar radiation, Ac is the collector area, m ˙ is the mass flow rate of the fluid, while To, Ti and Ta are the outlet, inlet and ambient temperatures, respectively.
The heat transfer coefficient, h, is the combination of radiative and convective heat transfer and is determined experimentally from [7]:
U L = h =   Q ˙ sol T s T a
where Ts is the stagnation temperature, equal to 65 taken from [7]. The steady-state stagnation temperature is measured when the flow of nanofluids with various concentrations in the collector is performed at zero flow rate. To test the collector system, the overall heat transfer coefficient can be varied from 19.2 to 24.3 W/m2 K.
The efficiency of a direct absorption collector is defined by [41]. In this equation, FR is the removal factor in the direct absorption collector, Cpnf is the specific heat of the nanofluid, UL defines the heat losses, I is the solar radiation, Ac is the collector area, m ˙ is the mass flow rate of the fluid, while To, Ti and Ta are the outlet, inlet and a
η i = F R τ α F R U L T i T a I
where τ is the transmittance of the glass and α is the absorptance of the nanofluid. Since the collector has a reflective background, α is calculated by [7]:
α = 1 exp ( 2 Abs H )
In Equation (5), Abs is the mean of the absorption coefficient of the working fluid and H is the height of the direct absorption solar collector in cm.
The nanoparticles are normally metallic or metal oxide in nature, while the base fluids are usually water, oils and ethylene glycol. The general objective of nanofluid development is to improve the properties of the base fluid with the minimum addition of nanoparticles, normally with a volume fraction (fv) of less than 1% of the base fluid. The volume fraction (fv) is defined as:
f v = V np V fb + V nf
where Vnp is the volume of the nanoparticle and Vfb is the volume of the base fluid.
The thermophysical properties of the nanofluid are determined based on the physical principle of the mixing rule. The effective density of the nanofluid can be determined from [42]:
ρ nf = 1 fv ρ fb + fv ρ np
where the subscripts nf, fb and np refer to nanofluid, base fluid and nanoparticles, respectively. Assuming thermal equilibrium between the nanoparticles and the base fluid, the specific heat can be obtained from [42]:
Cp nf = 1 fv ρ fb Cp fb + fv ρ np Cp np ρ nf
The viscosity is determined by:
μ nf = 1 + 2.5 fv + 6.2 fv 2 μ fb
The effective thermal conductivity of the nanofluid is calculated as follows [42]:
k nf = k np + 2 k fb 2 fv k fb k np k np + 2 k fb + fv k fb k np k fb + ρ nf fvCp nf 2 k B T 3 π d p / 2 μ fb
where dp is the apparent diameter of the clusters of nanoparticles. Assuming no agglomeration, dp is equal to the diameter of the nanoparticles and kB is Boltzmann’s constant.

2.1.2. Simulation

The model developed in Section 2.1.1 was programmed in the specialized software Engineering Equation Solver, EES [43], which is useful for the evaluation of different energy systems such as those shown in [44]. The properties of water and Fullerene C60, the base fluid and nanoparticles respectively, are presented in Table 1.

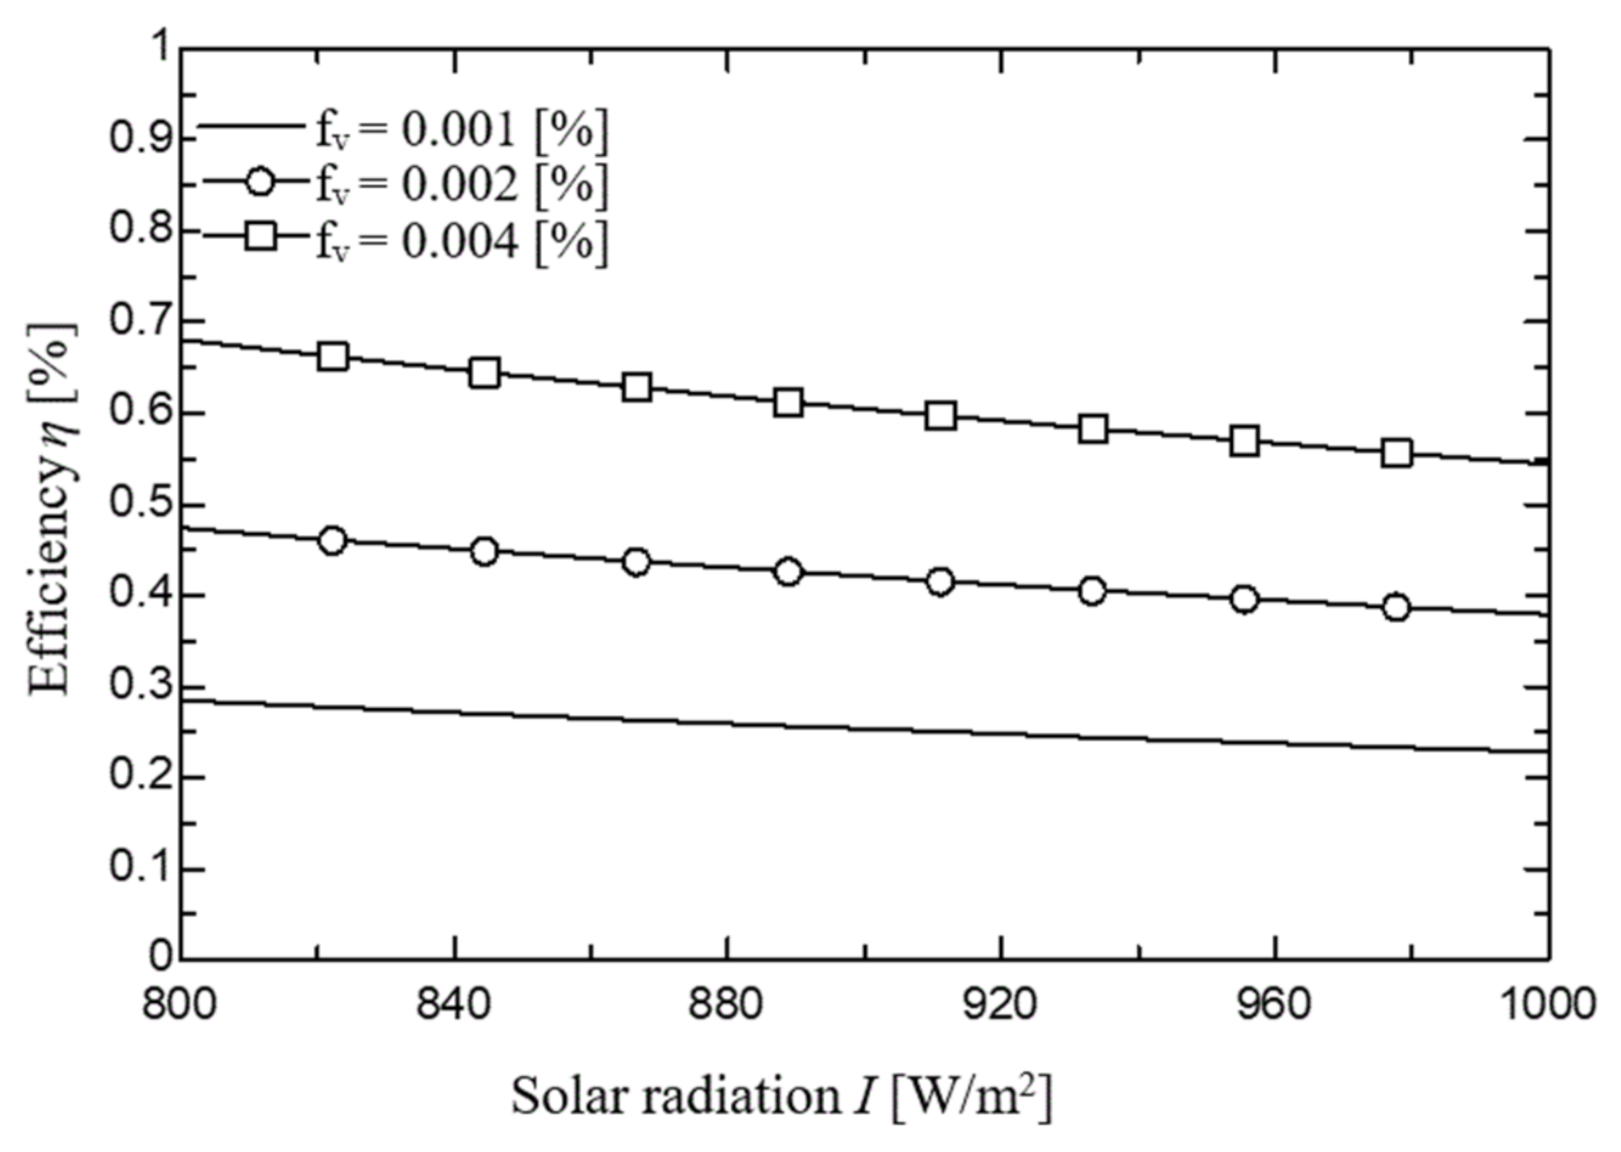
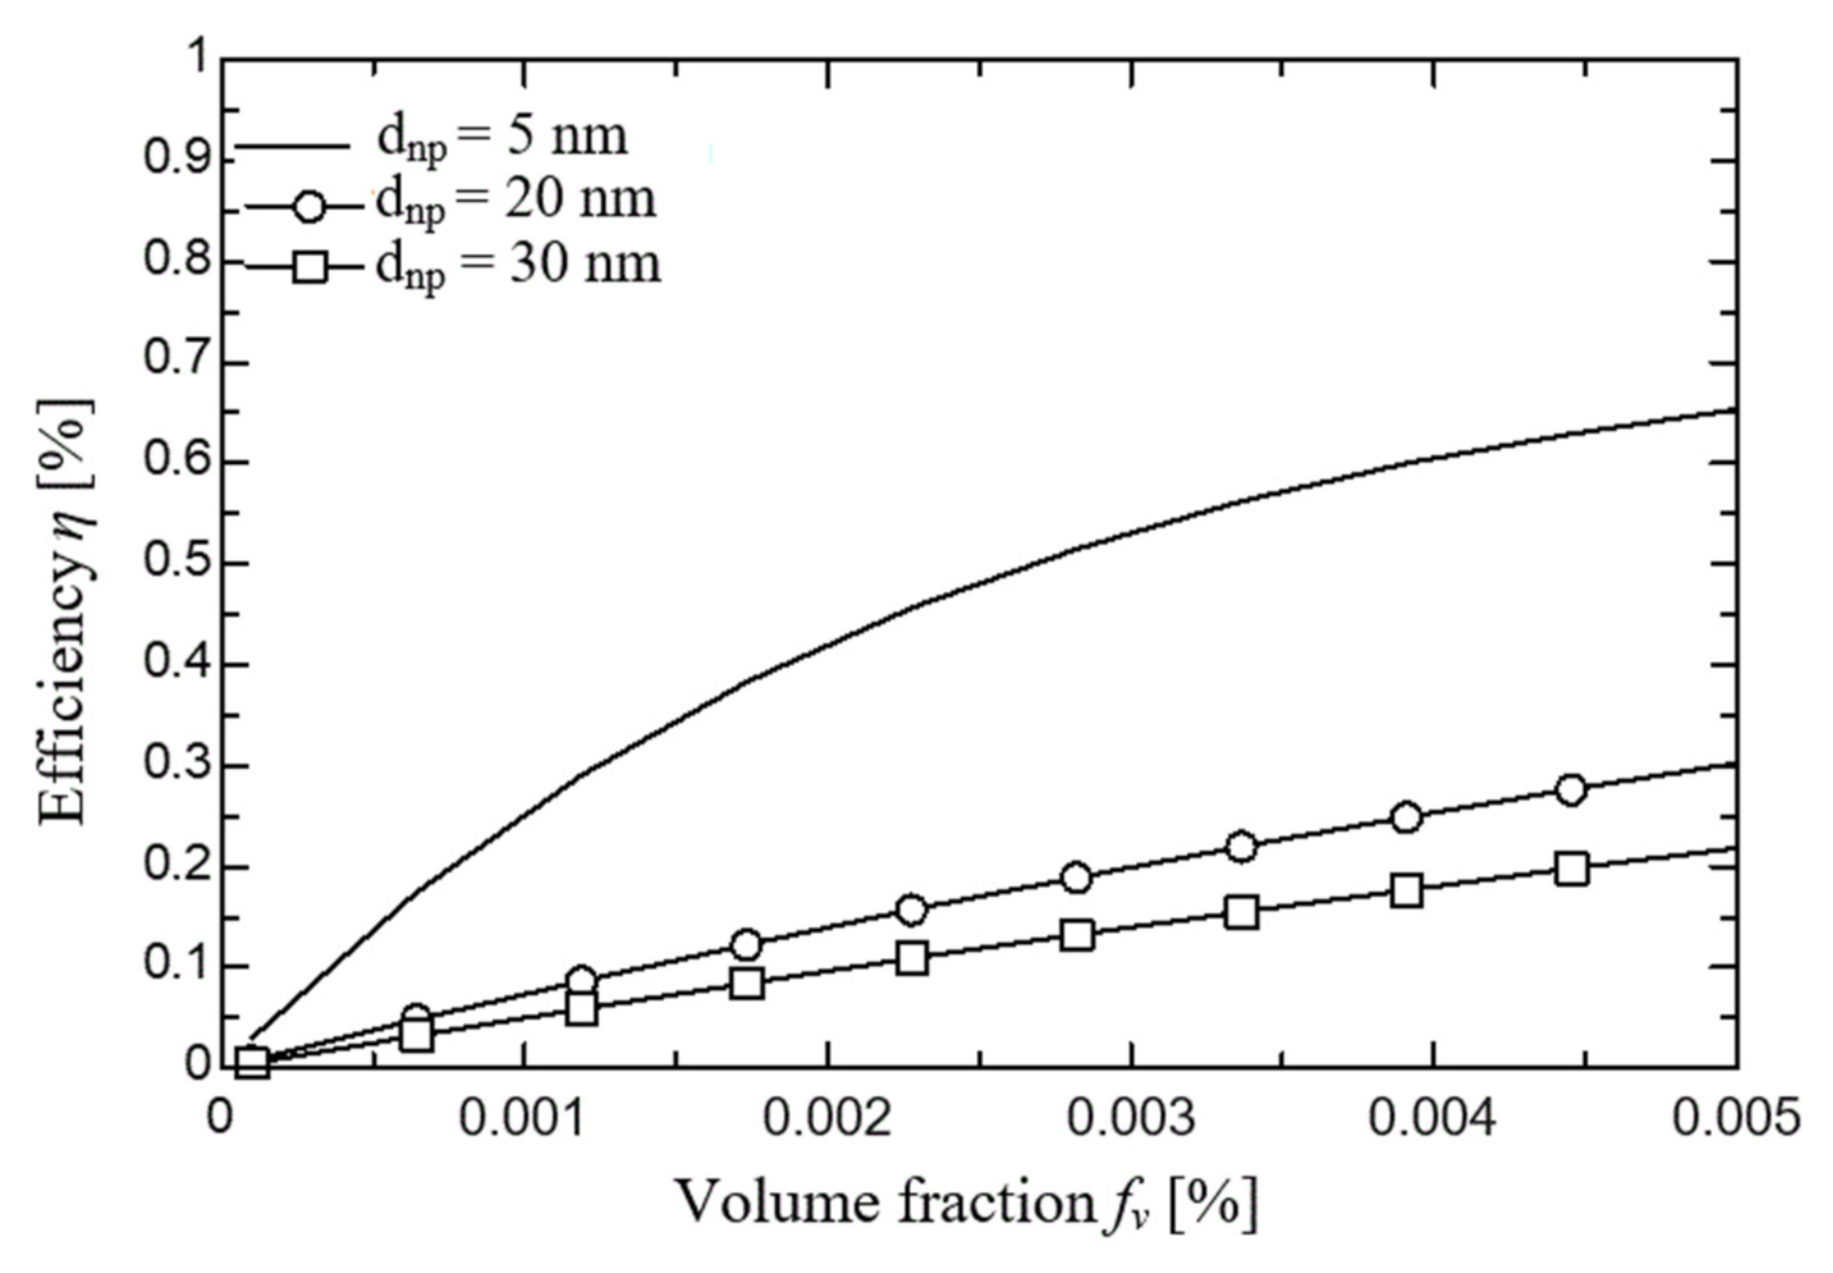
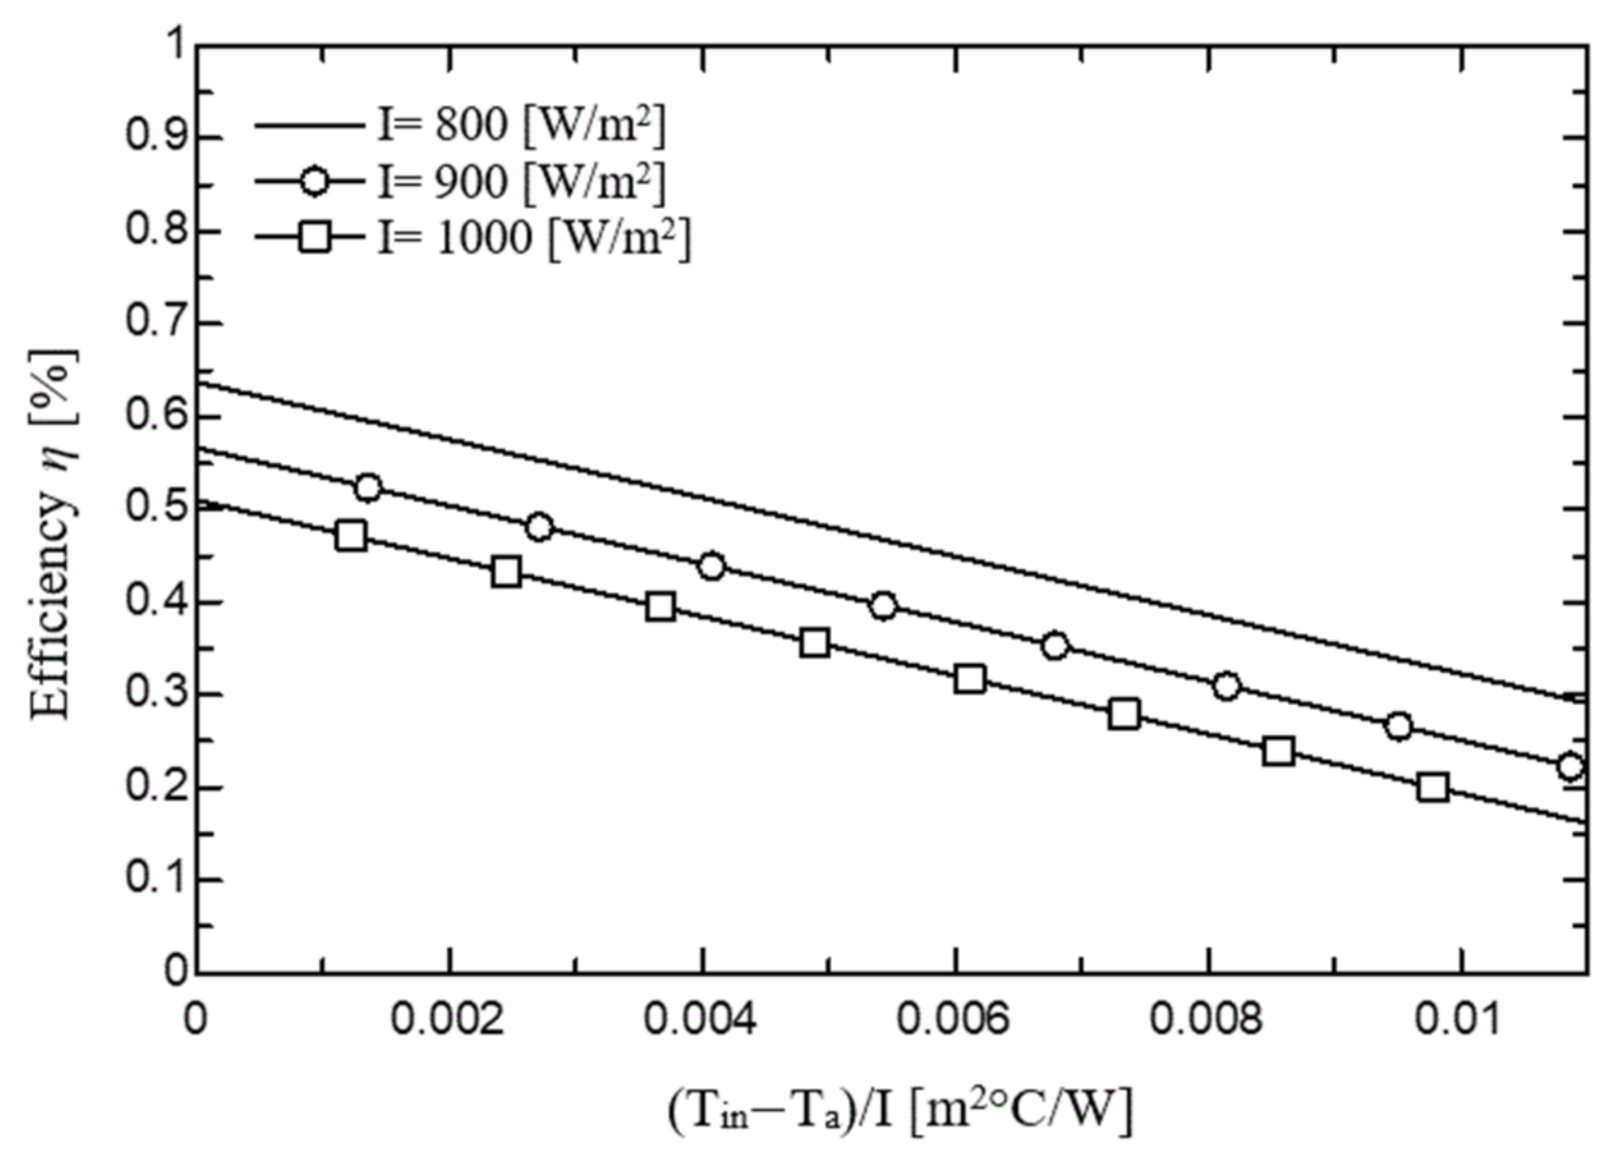
2.1.3. Simulation Results

Using carbon-based and water-based nanofluid, the efficiency results of a direct absorption solar collector were obtained. Figure 2 shows the efficiency of the LTSC with respect to the volume fraction for 3 different sizes of nanoparticles at a fixed radiation of 800 W/m2 and a mass flow rate of 9 × 10⁻⁵ kg/s. From the figure, it can be seen that the efficiency increases with a higher volume fraction. Likewise, it can be seen that the efficiency improves by reducing the size of the nanoparticles.
Figure 3 shows the efficiency of LTSC with respect to solar irradiation at different volume fractions using a nanoparticle diameter of 5 nm and a mass flow rate of 9 × 10⁻⁵ kg/s. From the figure, it can be seen that as solar irradiation increases, the efficiency decreases linearly. Likewise, it can be seen that as the volume fraction increases, the efficiency of the LTSC increases.
In Figure 4, the intersection with the vertical axis, efficiency, is equal to FR(τα) and at this point the temperature of the fluid entering the collector is equal to the ambient temperature. The slope of the curve is equal to FRUL and indicates how much energy is lost from the solar collector. The stagnation point occurs when there is no flow circulating through the collector. With this efficiency curve, the results obtained in the direct absorption collector (LTSC) are compared.
From the simulation, the efficiency is negatively affected when the diameter of the nanoparticle increases because the global heat transfer area between the nanoparticle and the base fluid decreases. Further, the efficiency decreases when the solar radiation and the inlet temperature rise. Likewise, the efficiency enlarges when the volume fraction is higher.

2.2. Low-Cost Fabrication and Characterization of Nanoparticles

The microwave synthesis method is very cheap, as all you need is a household microwave, a glass reactor, and a terpenoid resin (camphor or other aromatic resin with many carbon atoms). For the extraction of CO2 and water vapor, only an extraction hood is required [50]. In addition, the main advantage of the method over the others is that materials with fewer impurities and other carbon phases are produced. Most of the material is C60 (between 92 and 95%) and it is not necessary to spend time on the separation of amorphous carbons and other phases. The carbon sheets that are obtained in the microwave oven are made up of fine nanocrystalline sheets of fullerene of around 4 cm in length. In this work, the fullerenes are produced in such a way that they form a crystal and the free rings serve as a link to join these spheres and form the thin crystalline sheets that can be seen in the figures in this section. On an industrial scale, this method is not the most widely used, since microwaves require technology and conditions that make the mass production of the material more expensive. In these cases, other types of methods are used, such as arc discharge or chemical vapor deposition.
The process of production and fragmentation (grinding) of the carbon thin films, as well as the characterization of the nanoparticles and preparation of the nanofluid, are shown in this section.

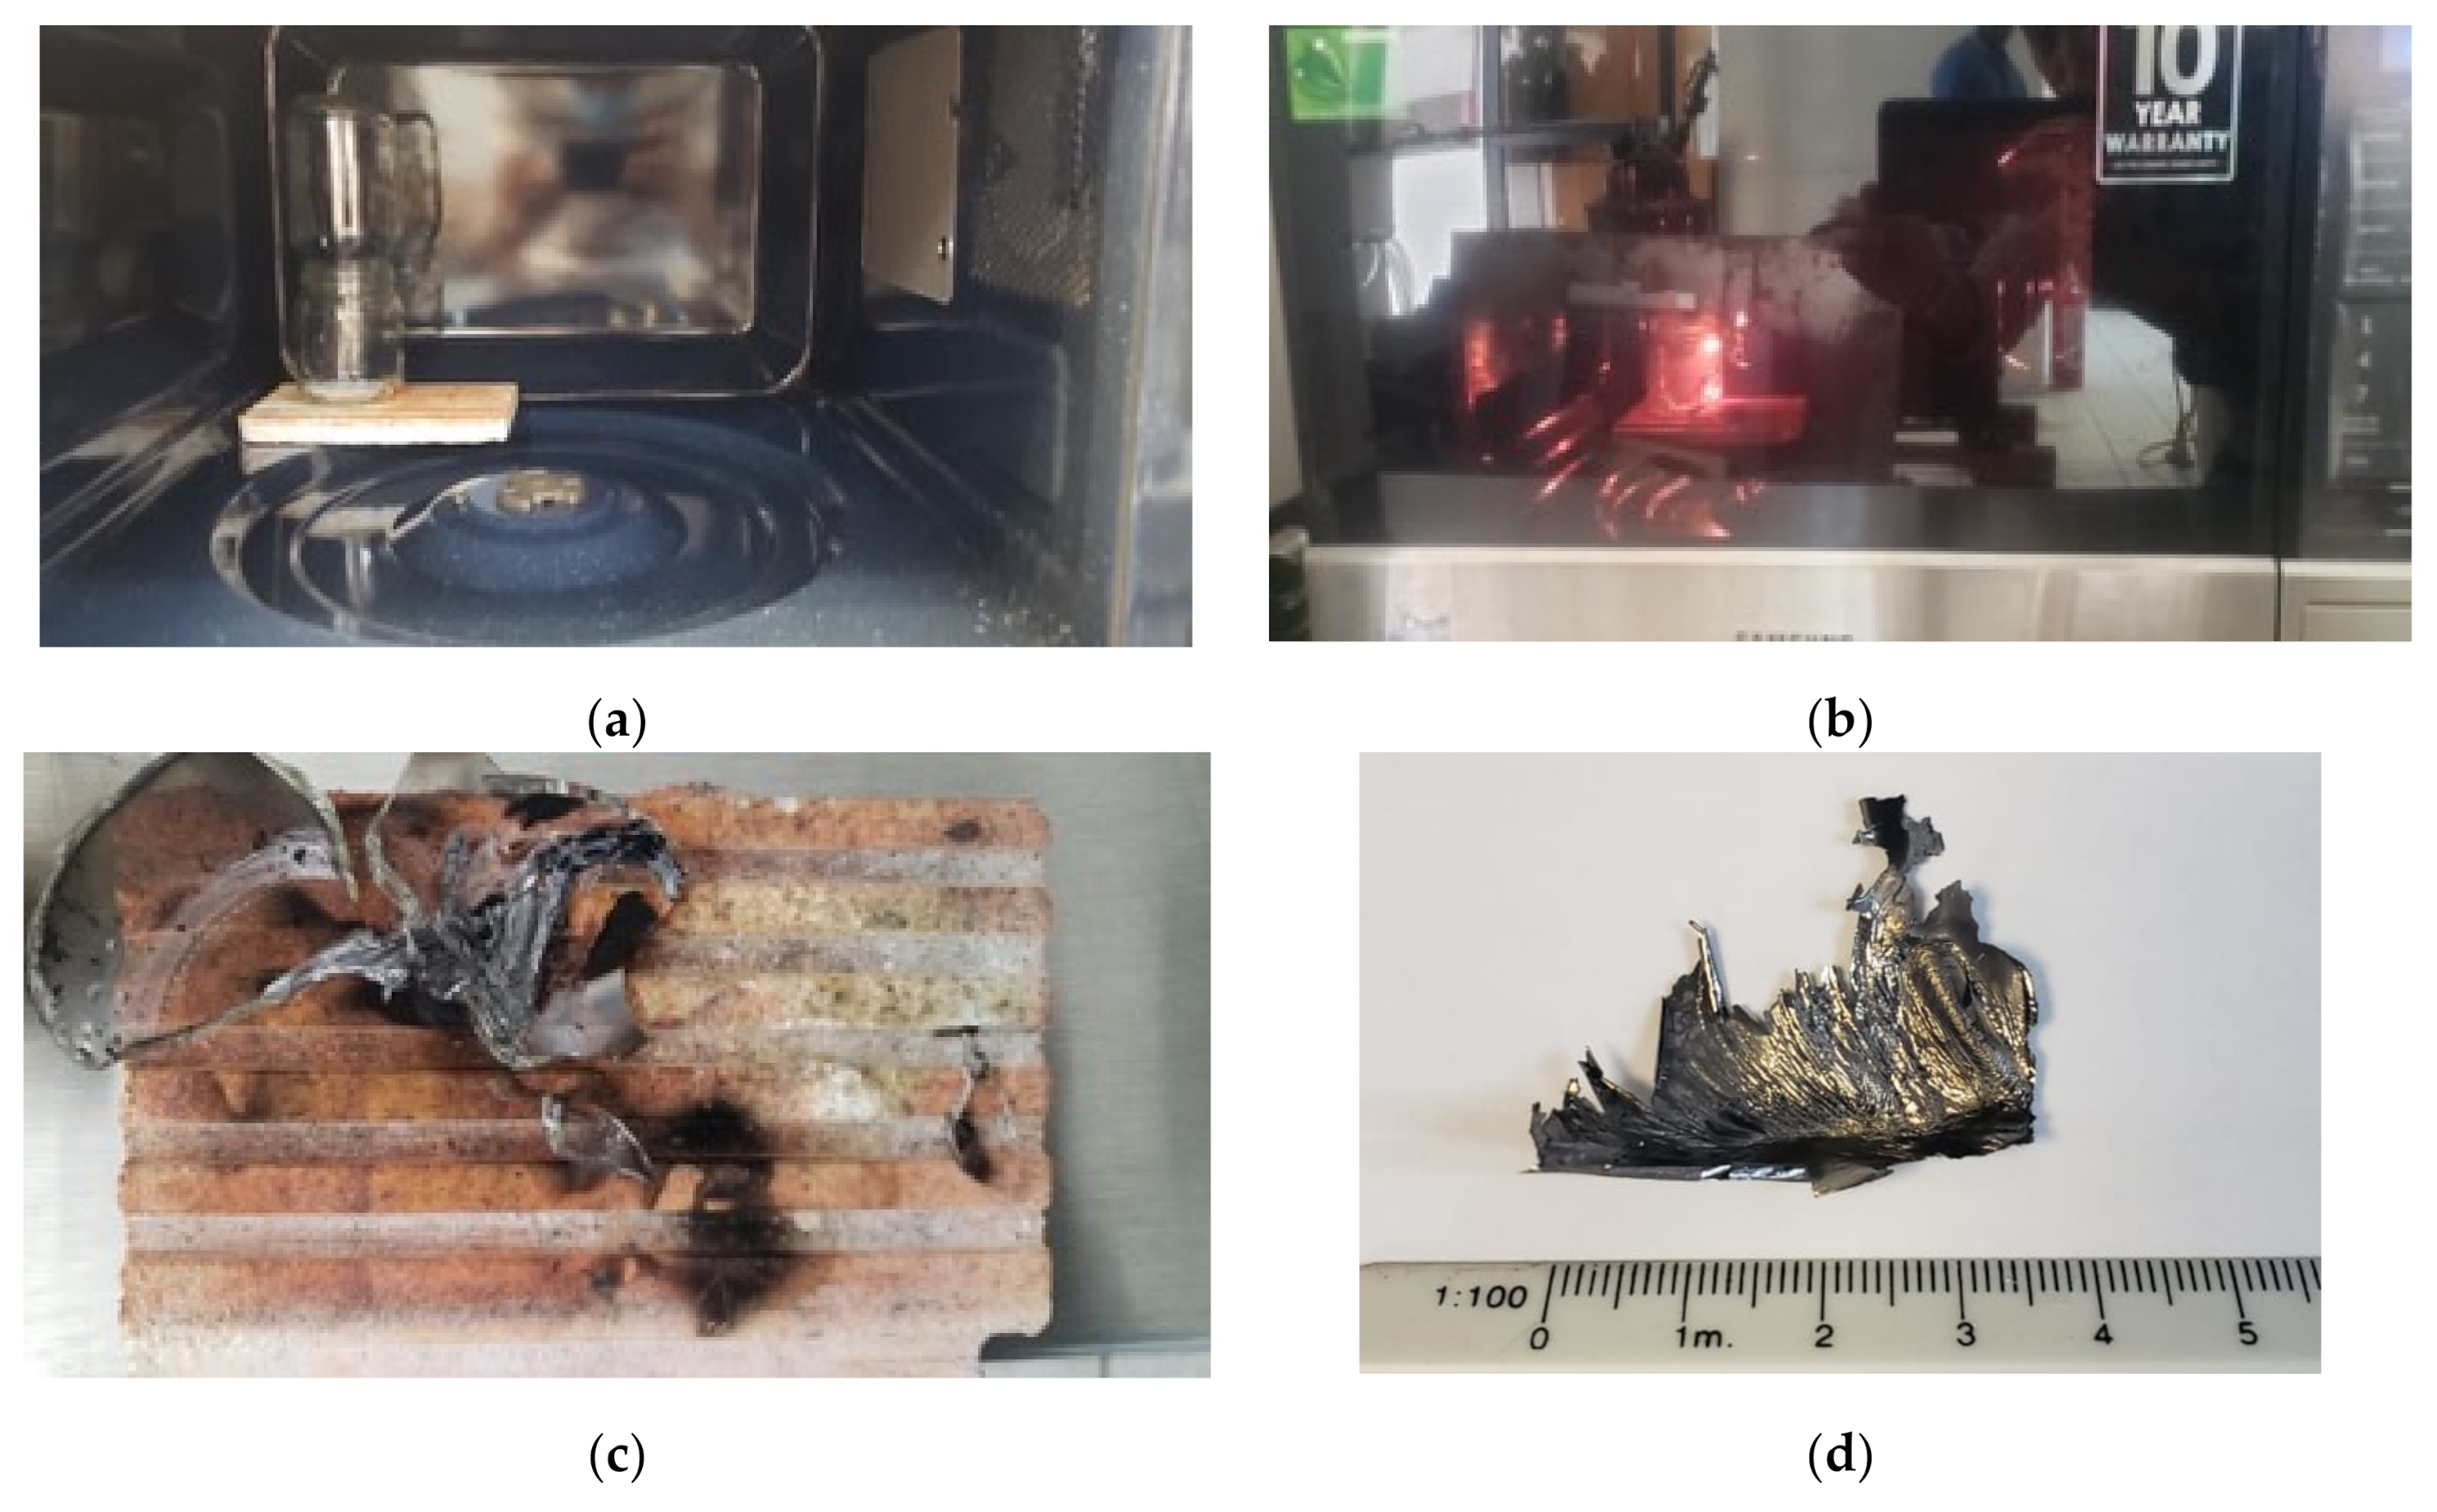
2.2.1. Production of Fullerene C60 Thin Films

The C60 molecules used in the present work were produced by the microwave synthesis method described in Mattínez-Reyes [51]. The fabrication was carried out in a conventional SAMSUNG microwave oven with a frequency of 2450 MHz, a wavelength of 12 cm and a maximum power of 1480 W. Prior to the synthesis, the temperature profiles of the oven were evaluated, for which the turntable was removed from the microwave to establish its maximum temperature points. Subsequently, in one of these high temperature points, 250 mg of terpenoid resin (commercial camphor C10H16O) was introduced in a glass reactor with a capacity of 113 mL and placed inside the oven with a heating time of 5 min, as observed in Figure 5a). In the heating process, the resin decomposes, forming a plasma that is visible by the emission of a very bright light (Figure 5b). When the decomposition process ends and the plasma disappears in the upper part of the glass reactor, a silver-gray layer and a characteristic soot of the formation of macromolecules are observed (Figure 5c,d).

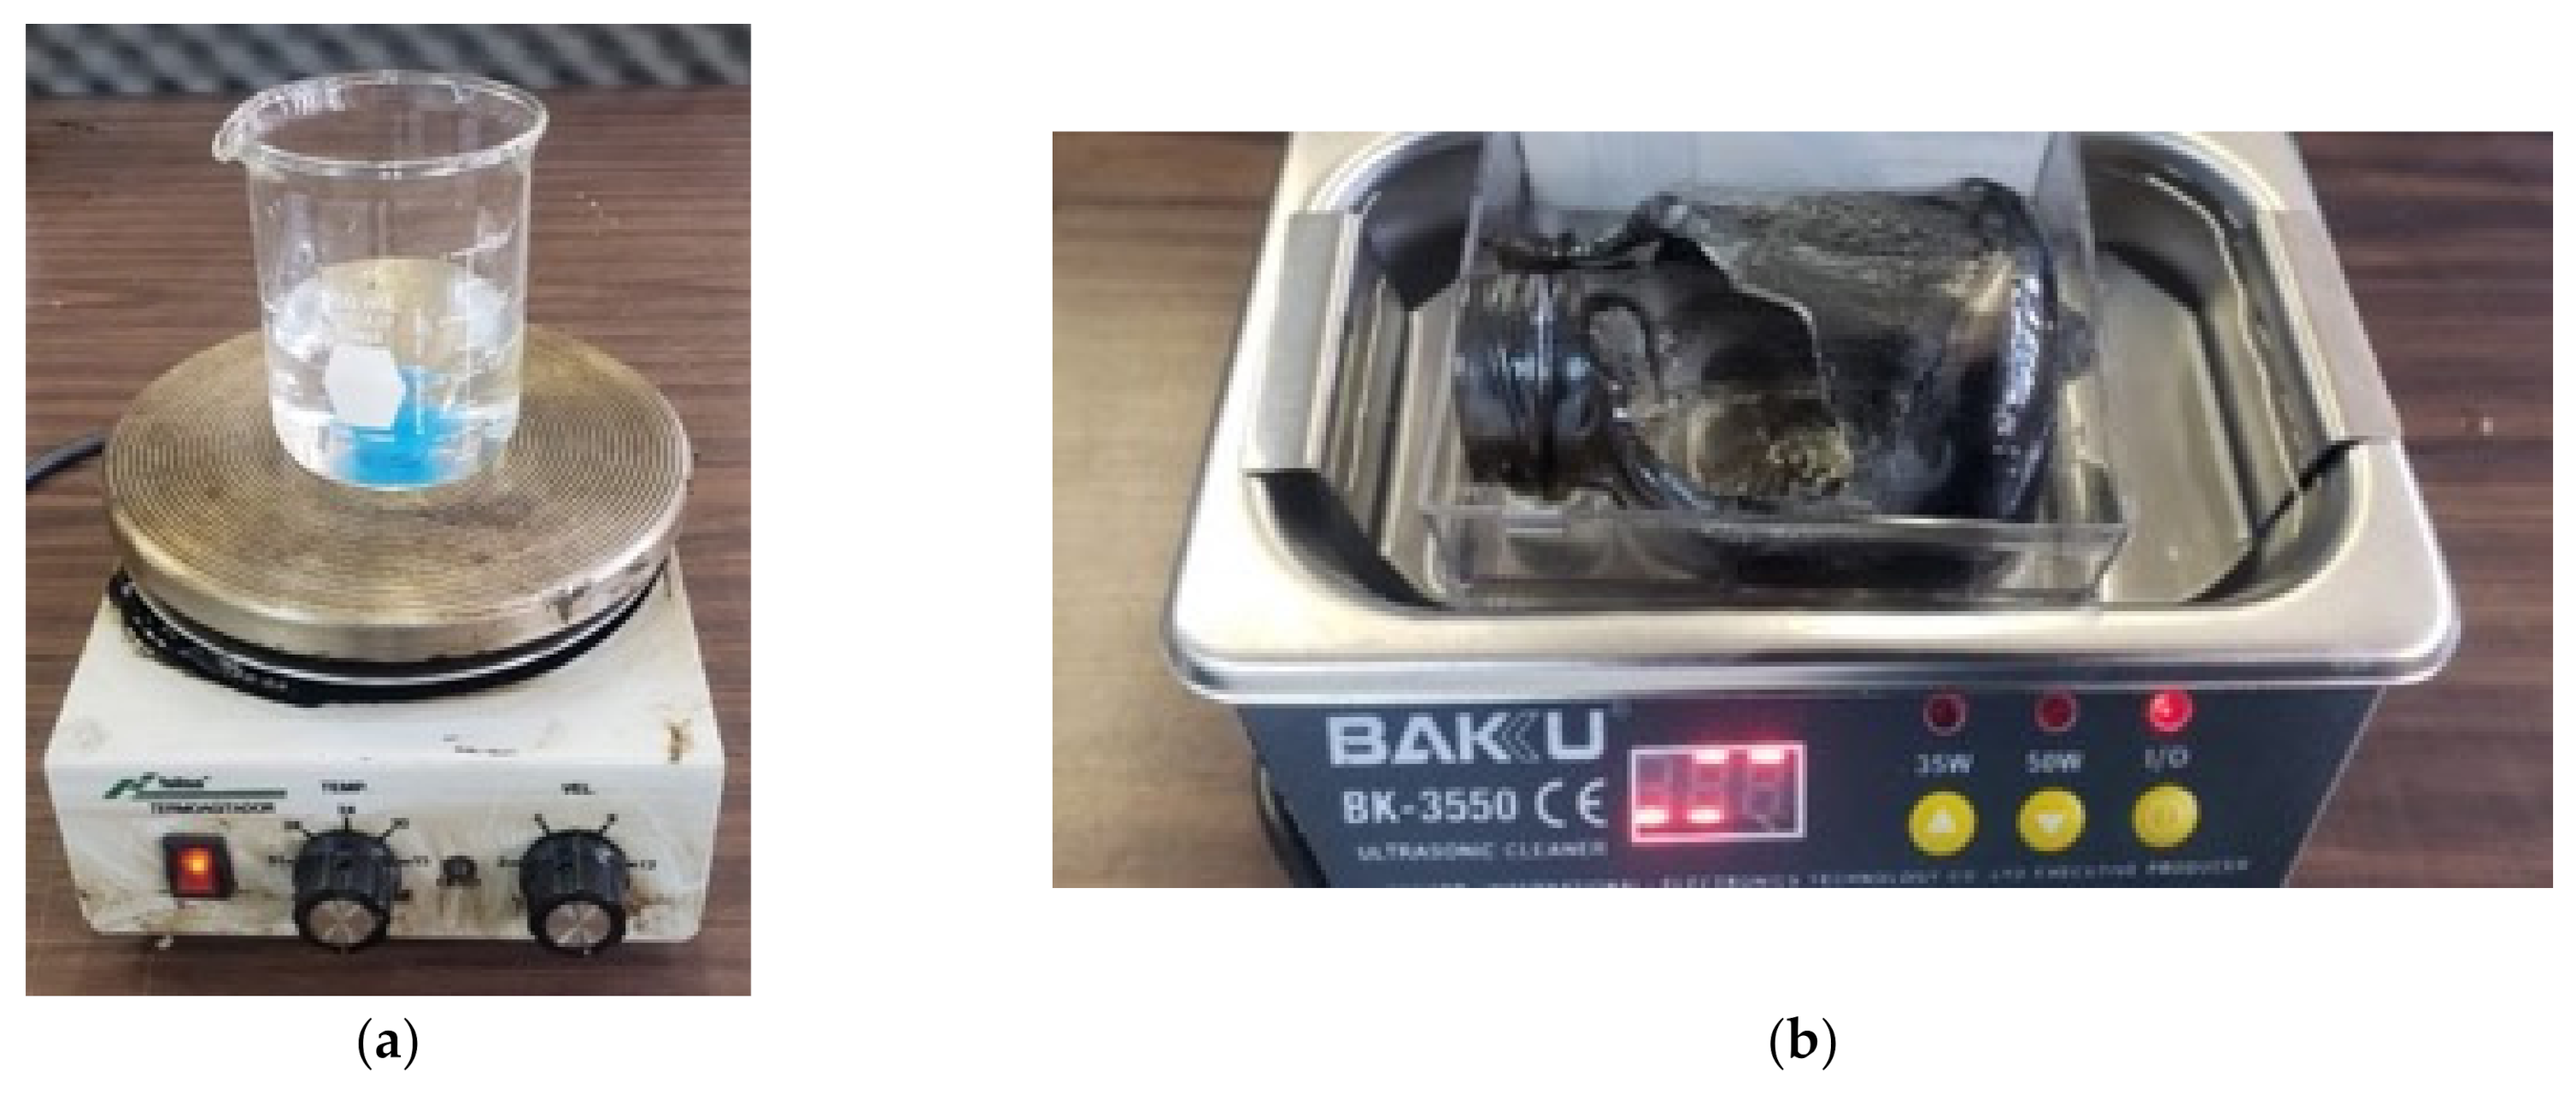
2.2.2. Production of Fullerene C60 Nanoparticles

The nanocrystalline carbon thin films formed by the microwave synthesis method are fragmented to sizes from microns to hundreds of nanometers in a grinding process, in order to reduce the dilution time during the preparation of the nanofluid. Fullerene is a very resistant particle to mechanical processes; it is not destroyed by grinding or ultrasound treatment. What happens is that this molecule is separated from its crystal until it ends up diluted in the fluid.
For the production of Fullerene C60 nanoparticles, it was necessary to use a mill or mortar, which consists of a ceramic pot, such as a molcajete with a handle. With this device, thin sheets of C60 macromolecules (Fullerene C60 nanomaterial) are produced by hand. At this stage of the process, the nanoparticles clumped together. To separate them, they are placed in a container with alcohol inside an ultrasonic tub, to facilitate dispersion. To detect the molecule and determine the diameter of the fullerene, the fragments of the carbon nanocrystalline sheets were diluted in alcohol. With this sample, an infrared spectroscopy of the liquid was performed and the vibrations of the fluid were analyzed. The ultrasonic bath allows the molecules of the sheets to separate individually or into nanocrystals and disperse homogeneously in the fluid. In addition, in this process high-energy shock waves are produced that reduce the size of the thin sheets to a minimum. The measured diameter of fullerene is 7 Å (0.7 nm) and the lattice parameter of its crystal is 14.17 Å (1.417 nm), as shown in Section 2.2.3. The procedure followed here appears in [50], where it is described that the sample was analyzed by electron microscopy, X-ray diffraction and infrared and Raman spectroscopy. In that reference, Fullerene C60 was compared with a commercial standard sample and its behavior was the same.
Fullerene is a very active macromolecule when it is free. A nanomaterial usually exhibits flammability or violent reactions when some of the substances with which it interacts decompose and energy is released. Grinding done by hand does not generate such high energy. It might be easier to react in the ultrasonic bath, but the interaction with the liquid does not allow for a violent reaction.

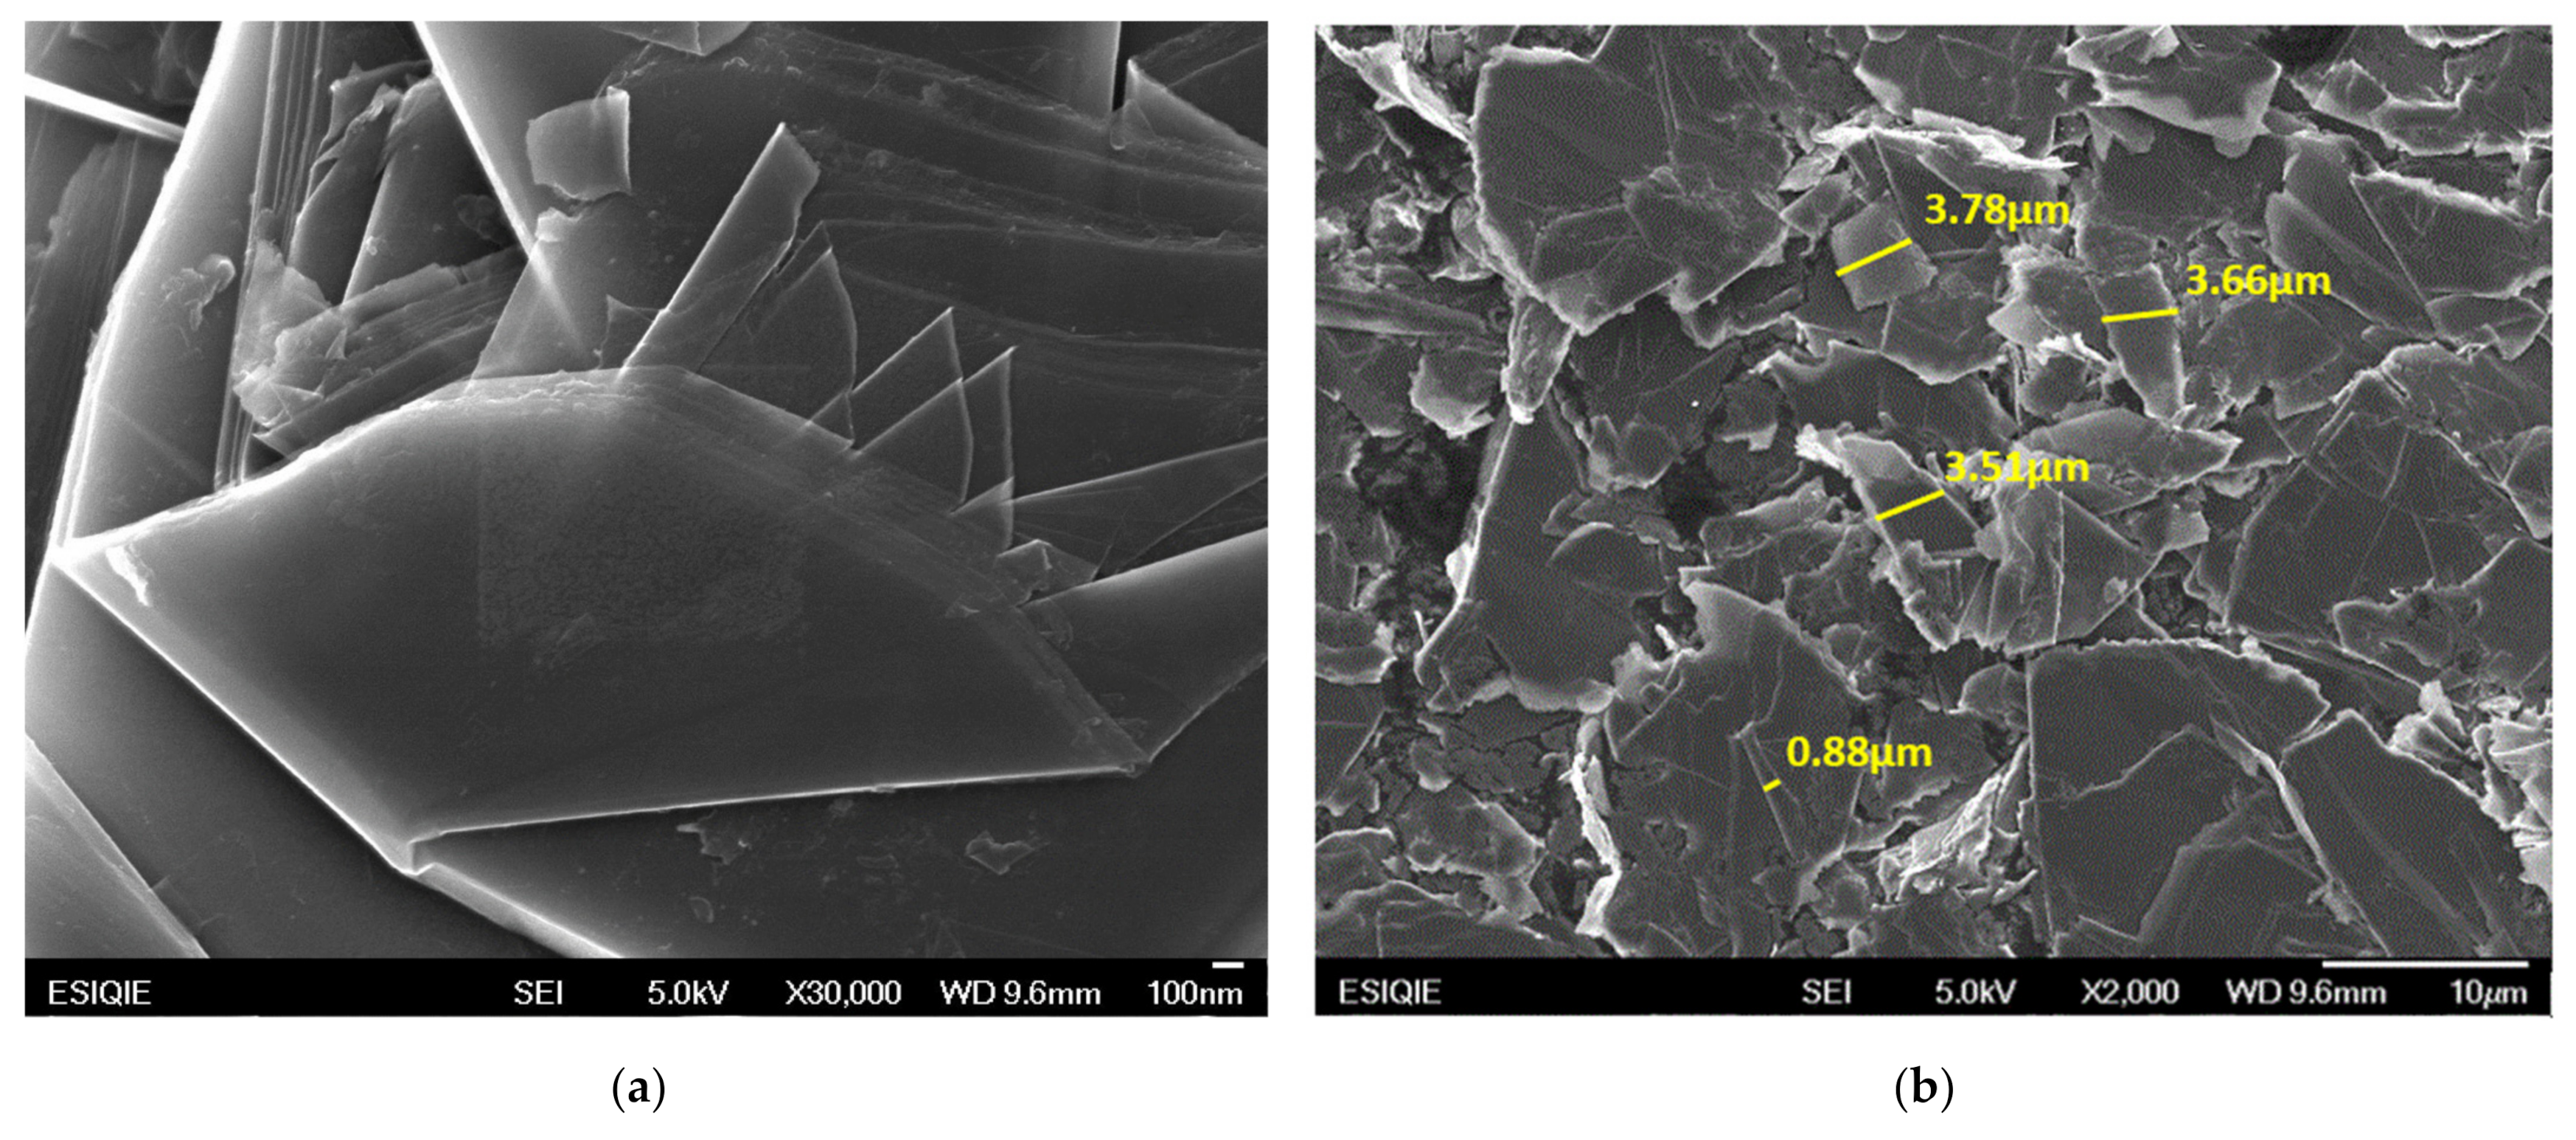
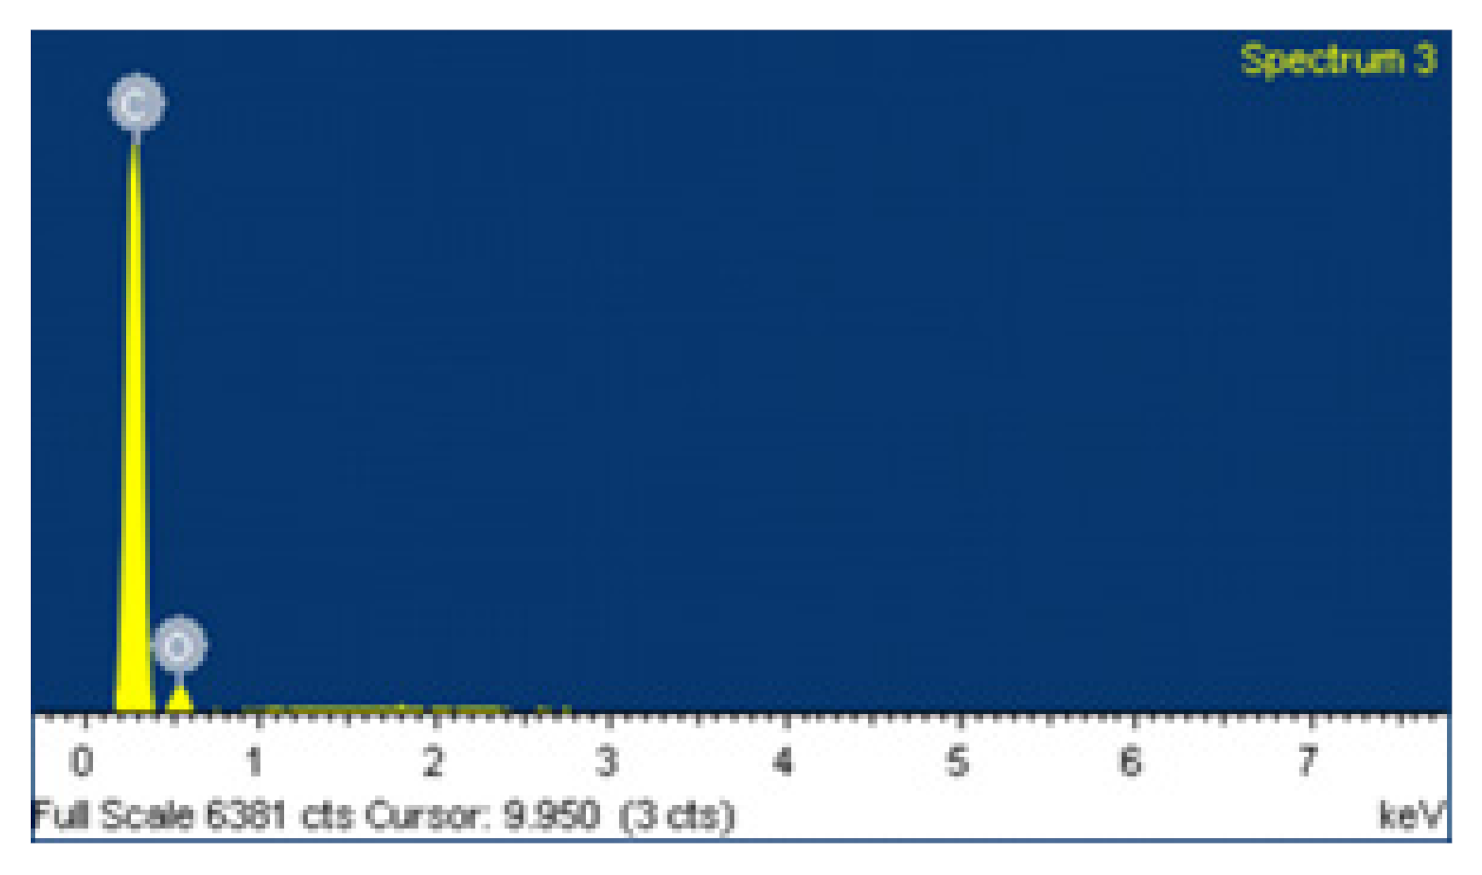
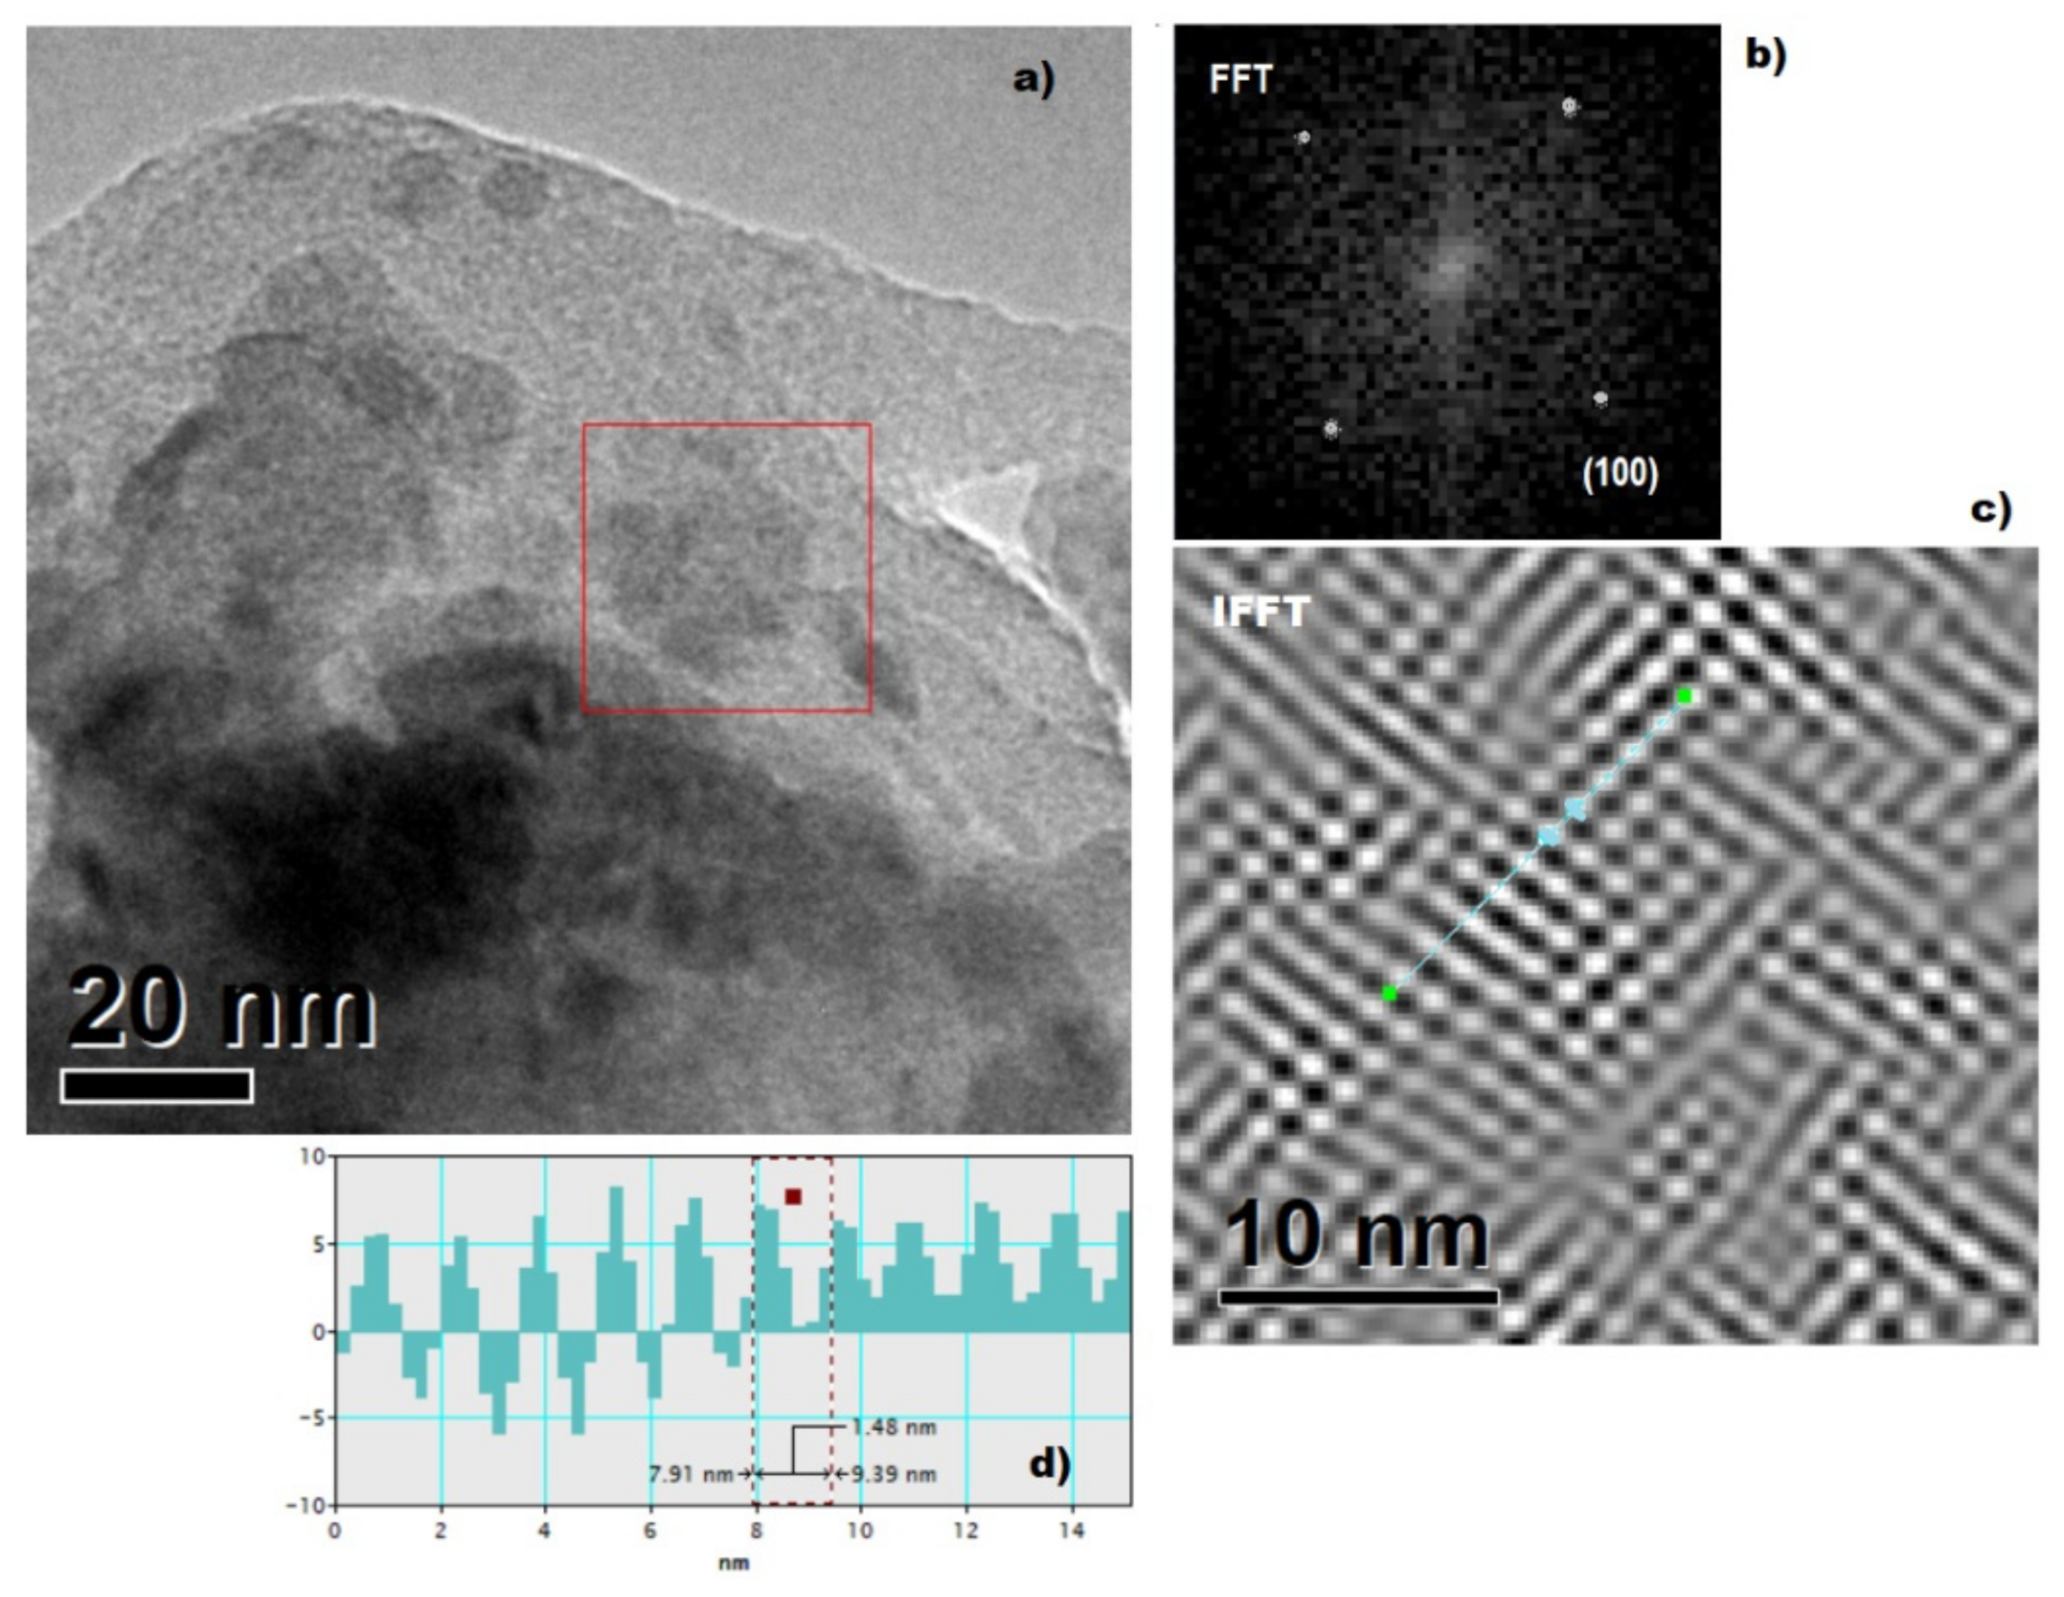
2.2.3. Characterization of the Nanoparticles

The morphology of the surface of the film and the thickness of the samples were characterized by High-Resolution Transmission Electron Microscopy, HRTEM (Figure 6) in a DUAL BEAM SEM/FIB equipment, Nova Nanolab200 from FEI Company, with a resolution of 2 nm at a working distance of 5.0 mm. The voltage used to analyze the sample was in the range of 18 to 25 kV with a current of 15 nA. The elemental chemical analysis of the sample was performed by Energy Dispersive X-rays (EDS) and is shown in Table 2. The film observed in Figure 6a,b consists of a series of layers stacked one on top of the other, identifying a continuous surface with randomly distributed film fragments as shown in Figure 6a. The thickness of the carbon film is variable with a range from 140.8 to 523.3 nm, Figure 6b. In addition, the thickness of the film is made up of thin intercalated layers in the form of a stack, with a range from 40.6 to 686.5 nm.
The chemical analysis performed on the samples was carried out by dispersive X-ray spectroscopy, whose spectrum is observed in Figure 7, and from which the elements that make up these thin films were quantified. Table 2 shows that the majority of the material is composed of carbon and shows slight oxidation.
In order to establish the phase formed by carbon, high-resolution transmission microscopy was carried out in a High-Resolution Transmission Electron Microscopy FEI Tecnai G-30 microscope at 200 kV. In Figure 8a the bright field image of the films observed in scanning is shown. It is clearly seen that the films consist of fine particles with sizes less than 20 nm. Figure 8b shows the digital processing of the image, with the help of the Digital Micrograph Software version 3.7 for GMS 1.2 Gatan Company program, for the region delimited in Figure 8a with a red box. In Figure 8b, the Fast Fourier transform (FFT) of that area was obtained and the simulated diffraction pattern is observed. The plane (100) of the FCC structure of Fullerene corresponds to this simulated diffraction pattern. Taking out the inverse Fourier transform, Figure 8c is formed where it is possible to observe the periodic arrangement of the Fullerene molecules. On the blue line between the blue points, the interplanar distance measurement was carried out, Figure 8d, obtaining the value of 1.48 nm = 1.42 ± 6 nm, which corresponds to the Fullerene lattice parameter crystallized in a face-centered cubic structure reported in References [52,53].

2.2.4. Preparation of the Nanofluid

To obtain the required amount of nanofluids, it is essential to ensure that the method used to disperse the nanoparticles is acceptable and provides the expected results in terms of thermophysical properties and quality of the nanofluid.
Next, the methodology used to disperse the nanoparticles is presented, where ϕVol represents the volumetric concentration. The concentration is the amount of solute (nanoparticle) diluted in a solvent (distilled water) and this can be in weight or volume. Here, the weight concentration is used, which is determined by Equation (11) and represents the percentage of the concentration for a certain total volume (solute plus solvent). The weight of the base substance is obtained by multiplying the density of the water obtained (in g/mL) by the volume of the substance to be used to make the mixture (in mL). According to Chavda et al. [54]:
vol = w np ρ np w np ρ np + w bf ρ bf × 100
Equation (11) was compared with the proposal by Pak and Cho [55], to verify that the results obtained were correct. As the authors suggest, the calculation is made based on the concentration by weight, to be more precise. Equation (12) suggests using volumetric concentration based on concentration by weight.
vol = 1 100 m + w bf ρ bf × 100
Equations (11) and (12) are used to determine the volumetric concentration of the mixture in the one-step method; however, the two-step method is used in this research. Once the mixture with the desired concentration is obtained, the nanoparticles are dispersed using an ultrasonic tank, which consists of stirring the mixture in such a way that the nanoparticles are dispersed homogeneously throughout the base fluid as shown in Figure 9.

2.3. Experimental Procedure of the Solar Collector

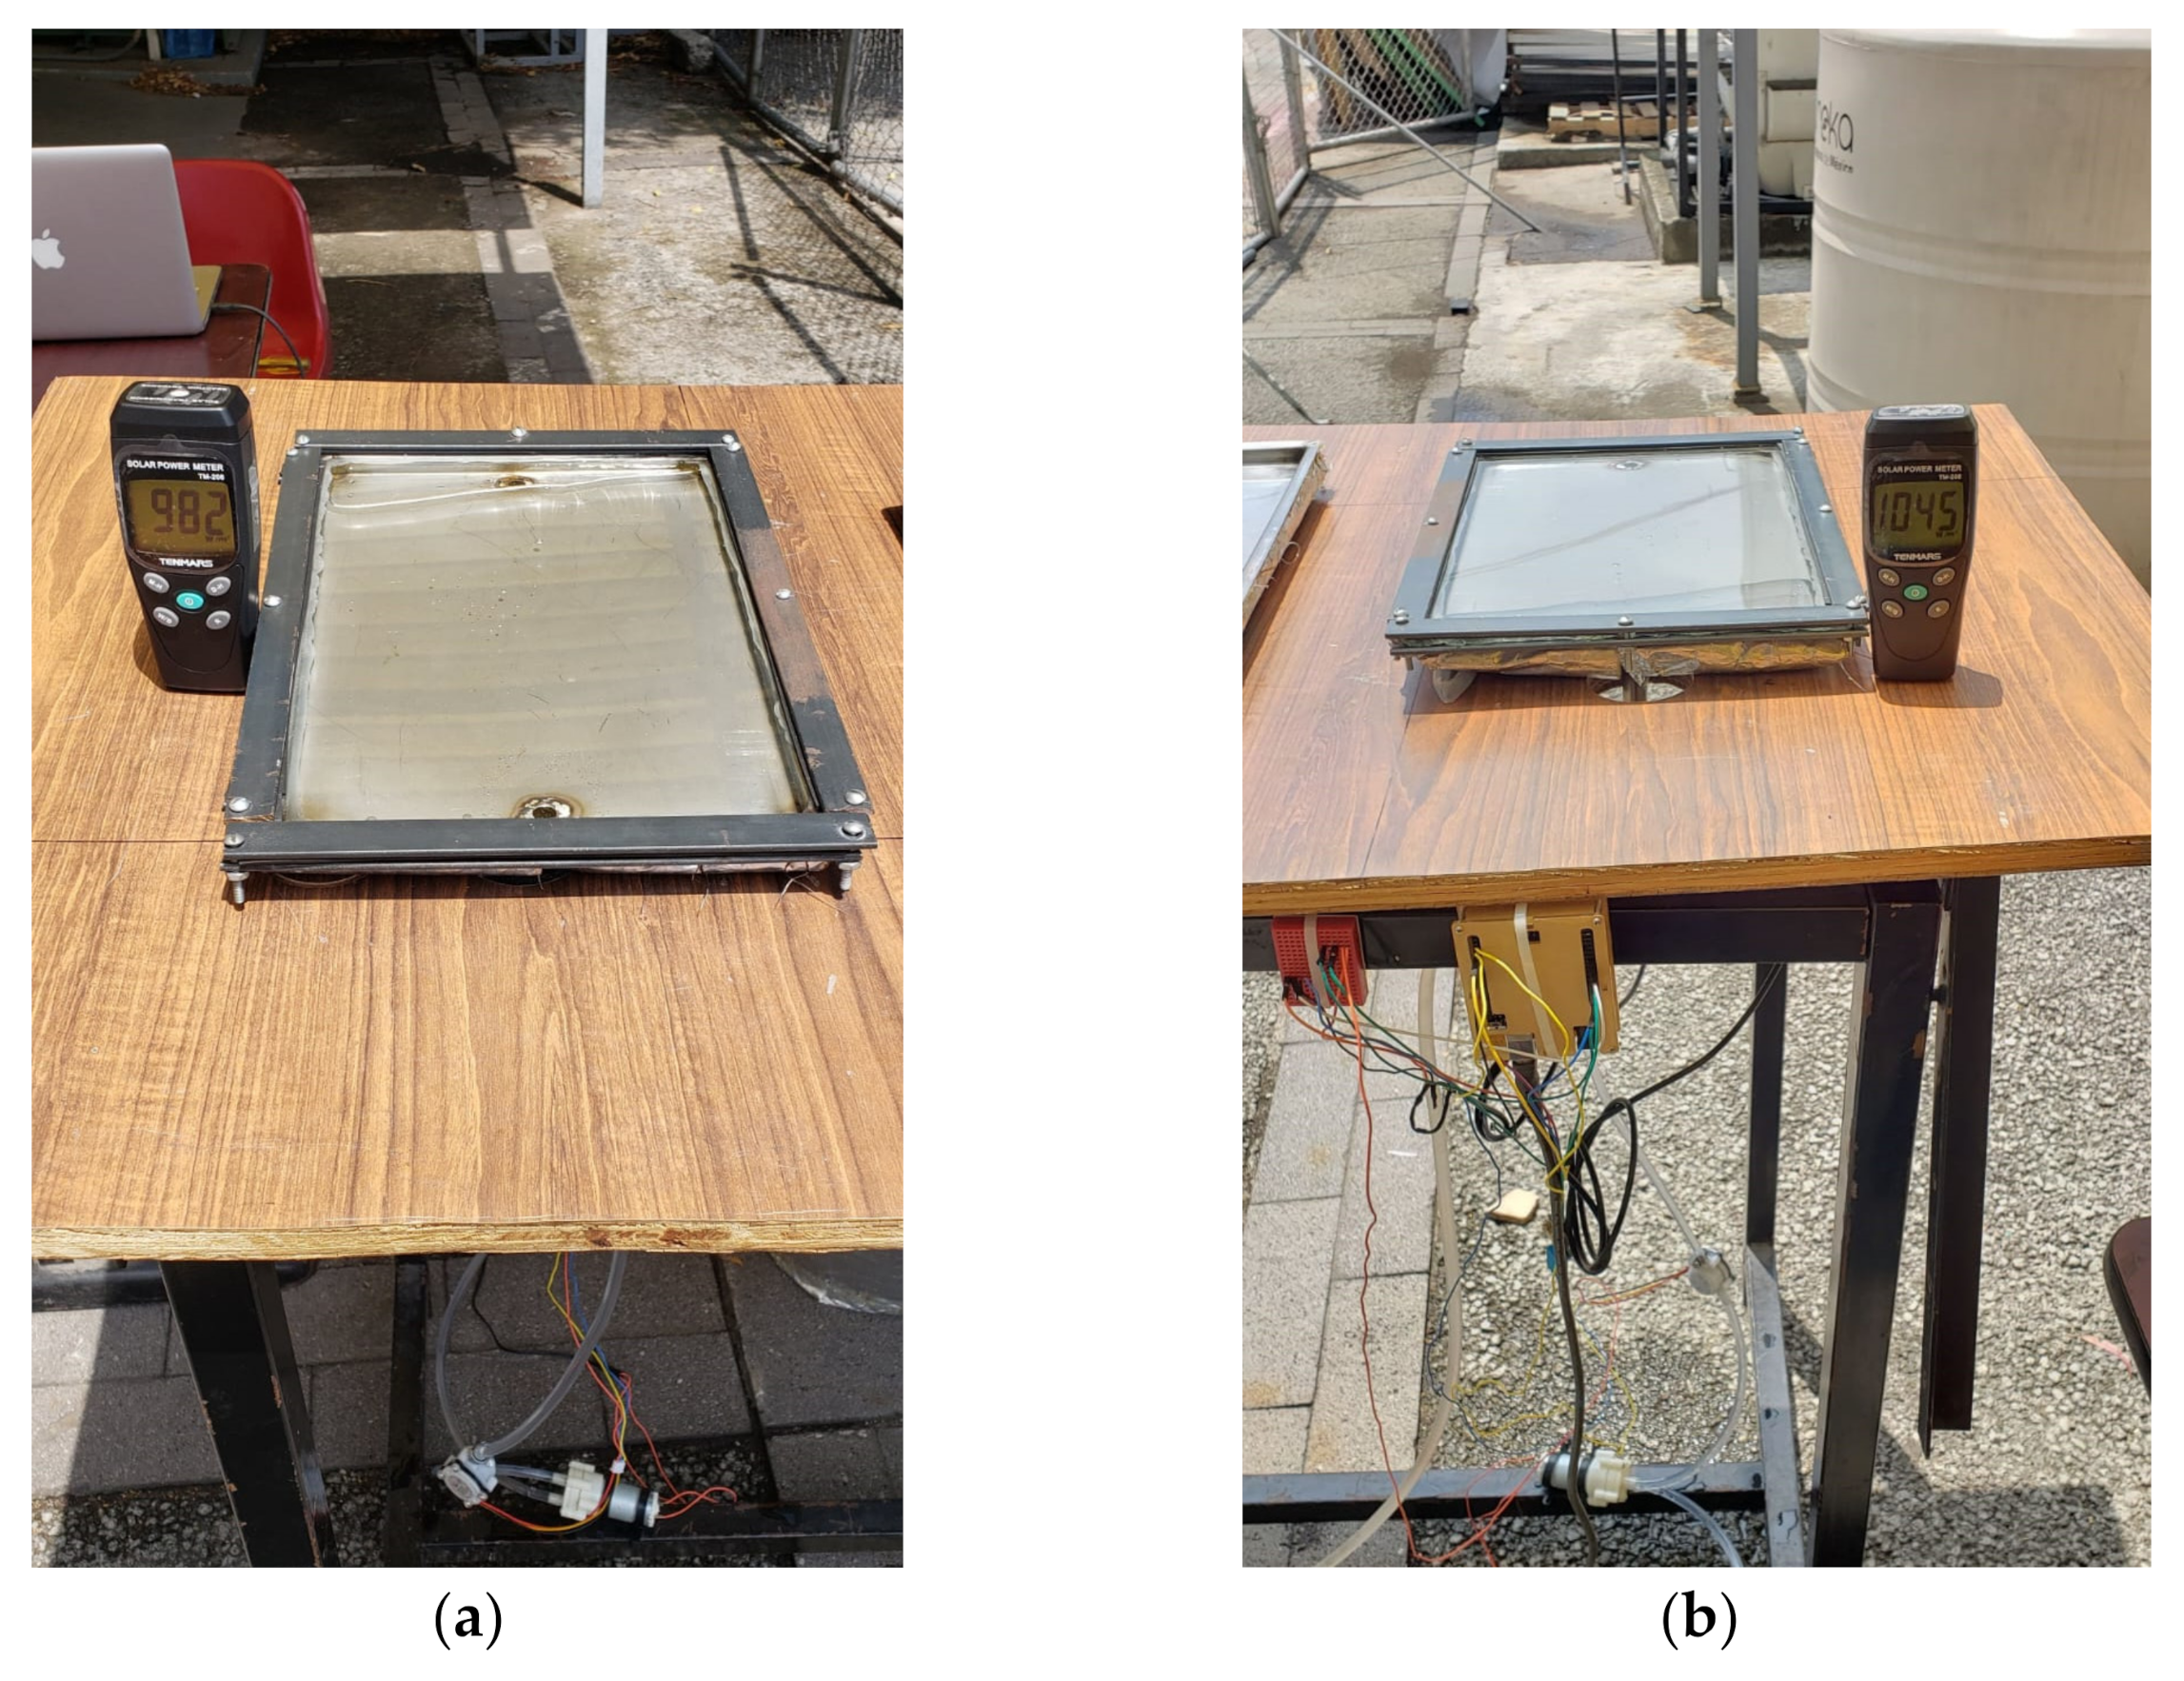
2.3.1. Test Rig of the Solar Collector

For the development of this project, a stainless steel low-temperature solar collector, LTSC prototype was built mainly due to its relatively low thermal conductivity. The dimensions of the solar collector are 20 cm × 30 cm × 1 cm as an application for domestic solar heaters. The inner surface of the bottom wall is made of reflective stainless steel. Fiberglass was used to insulate the outer surface of the solar collector as well as the piping system. In Figure 10, the main components of the experimental configuration are shown. It is integrated by the direct absorption solar collector, the centrifugal pump and the collection tank. The installation has temperature, flow and solar radiation meters. Except for the latter, the sensors are connected to a data acquisition system on a PC.
A photograph of the experimental setup presented in Figure 11 shows the direct absorption collector, a storage tank and instrumentation. The collector consists of a 20 cm × 30 cm × 3 mm flat glass, mounted on a wooden base. The fluid velocity is measured with the help of a flow sensor, model Yf-s401, from 0.3 to 6 LT/min, ±5% of full scale. A centrifugal pump circulates the fluid collected in the system. Two thermocouples were installed to measure the temperature data of the inlet and outlet fluid in the collector and one of the ambient temperature. The data were collected and stored on a PC through an Arduino Uno data logger. Total solar radiation intensity was recorded using a TM-206 MCA TENMARS digital solar meter, from 1 to 1999 W/m2, ±5% of full scale. The experiments were carried out at the same inlet temperature of the fluid. Before each test, the circuit was cleaned with distilled water to remove nanoparticle oxides and scale residues that could affect the collector. The specifications of each sensor are shown in Table 3.

2.3.2. Data Reduction

For the analysis of the direct absorption solar collector, the useful heat was determined by means of the equation:
Q ˙ u =   m ˙ · Cp ·   T o T i
where To and Ti are the outlet and inlet temperatures, respectively, of the solar collector. The mass flow was determined by:
m ˙ = ρ   Q
where Q is the volumetric flow rate measured during experimentation.
The efficiency of the solar collector was determined by:
η c = Q u ˙ I · A C
where the radiation, I, was measured experimentally and the collector area AC is 0.06 m2. These variables were calculated for all measured radiation, temperature and flow data.

2.3.3. Uncertainty of Measuring Instruments

To determine the uncertainty of the measured variables provided by the aforementioned instruments, the concept of relative uncertainty is used, which is defined as the propagation of uncertainty (u) calculated with the method of the square root of the sum of the uncertainties of each measured variable squared, as shown in Equation (16).
u = u 1 2 + u 2 3 + u 3 2 u n 2
Knowing this parameter (u) allows us to have a factor that indicates the propagation of errors that may occur in the measurable variables of each instrument and thus consider the error that may occur in the results.

3. Results and Discussion

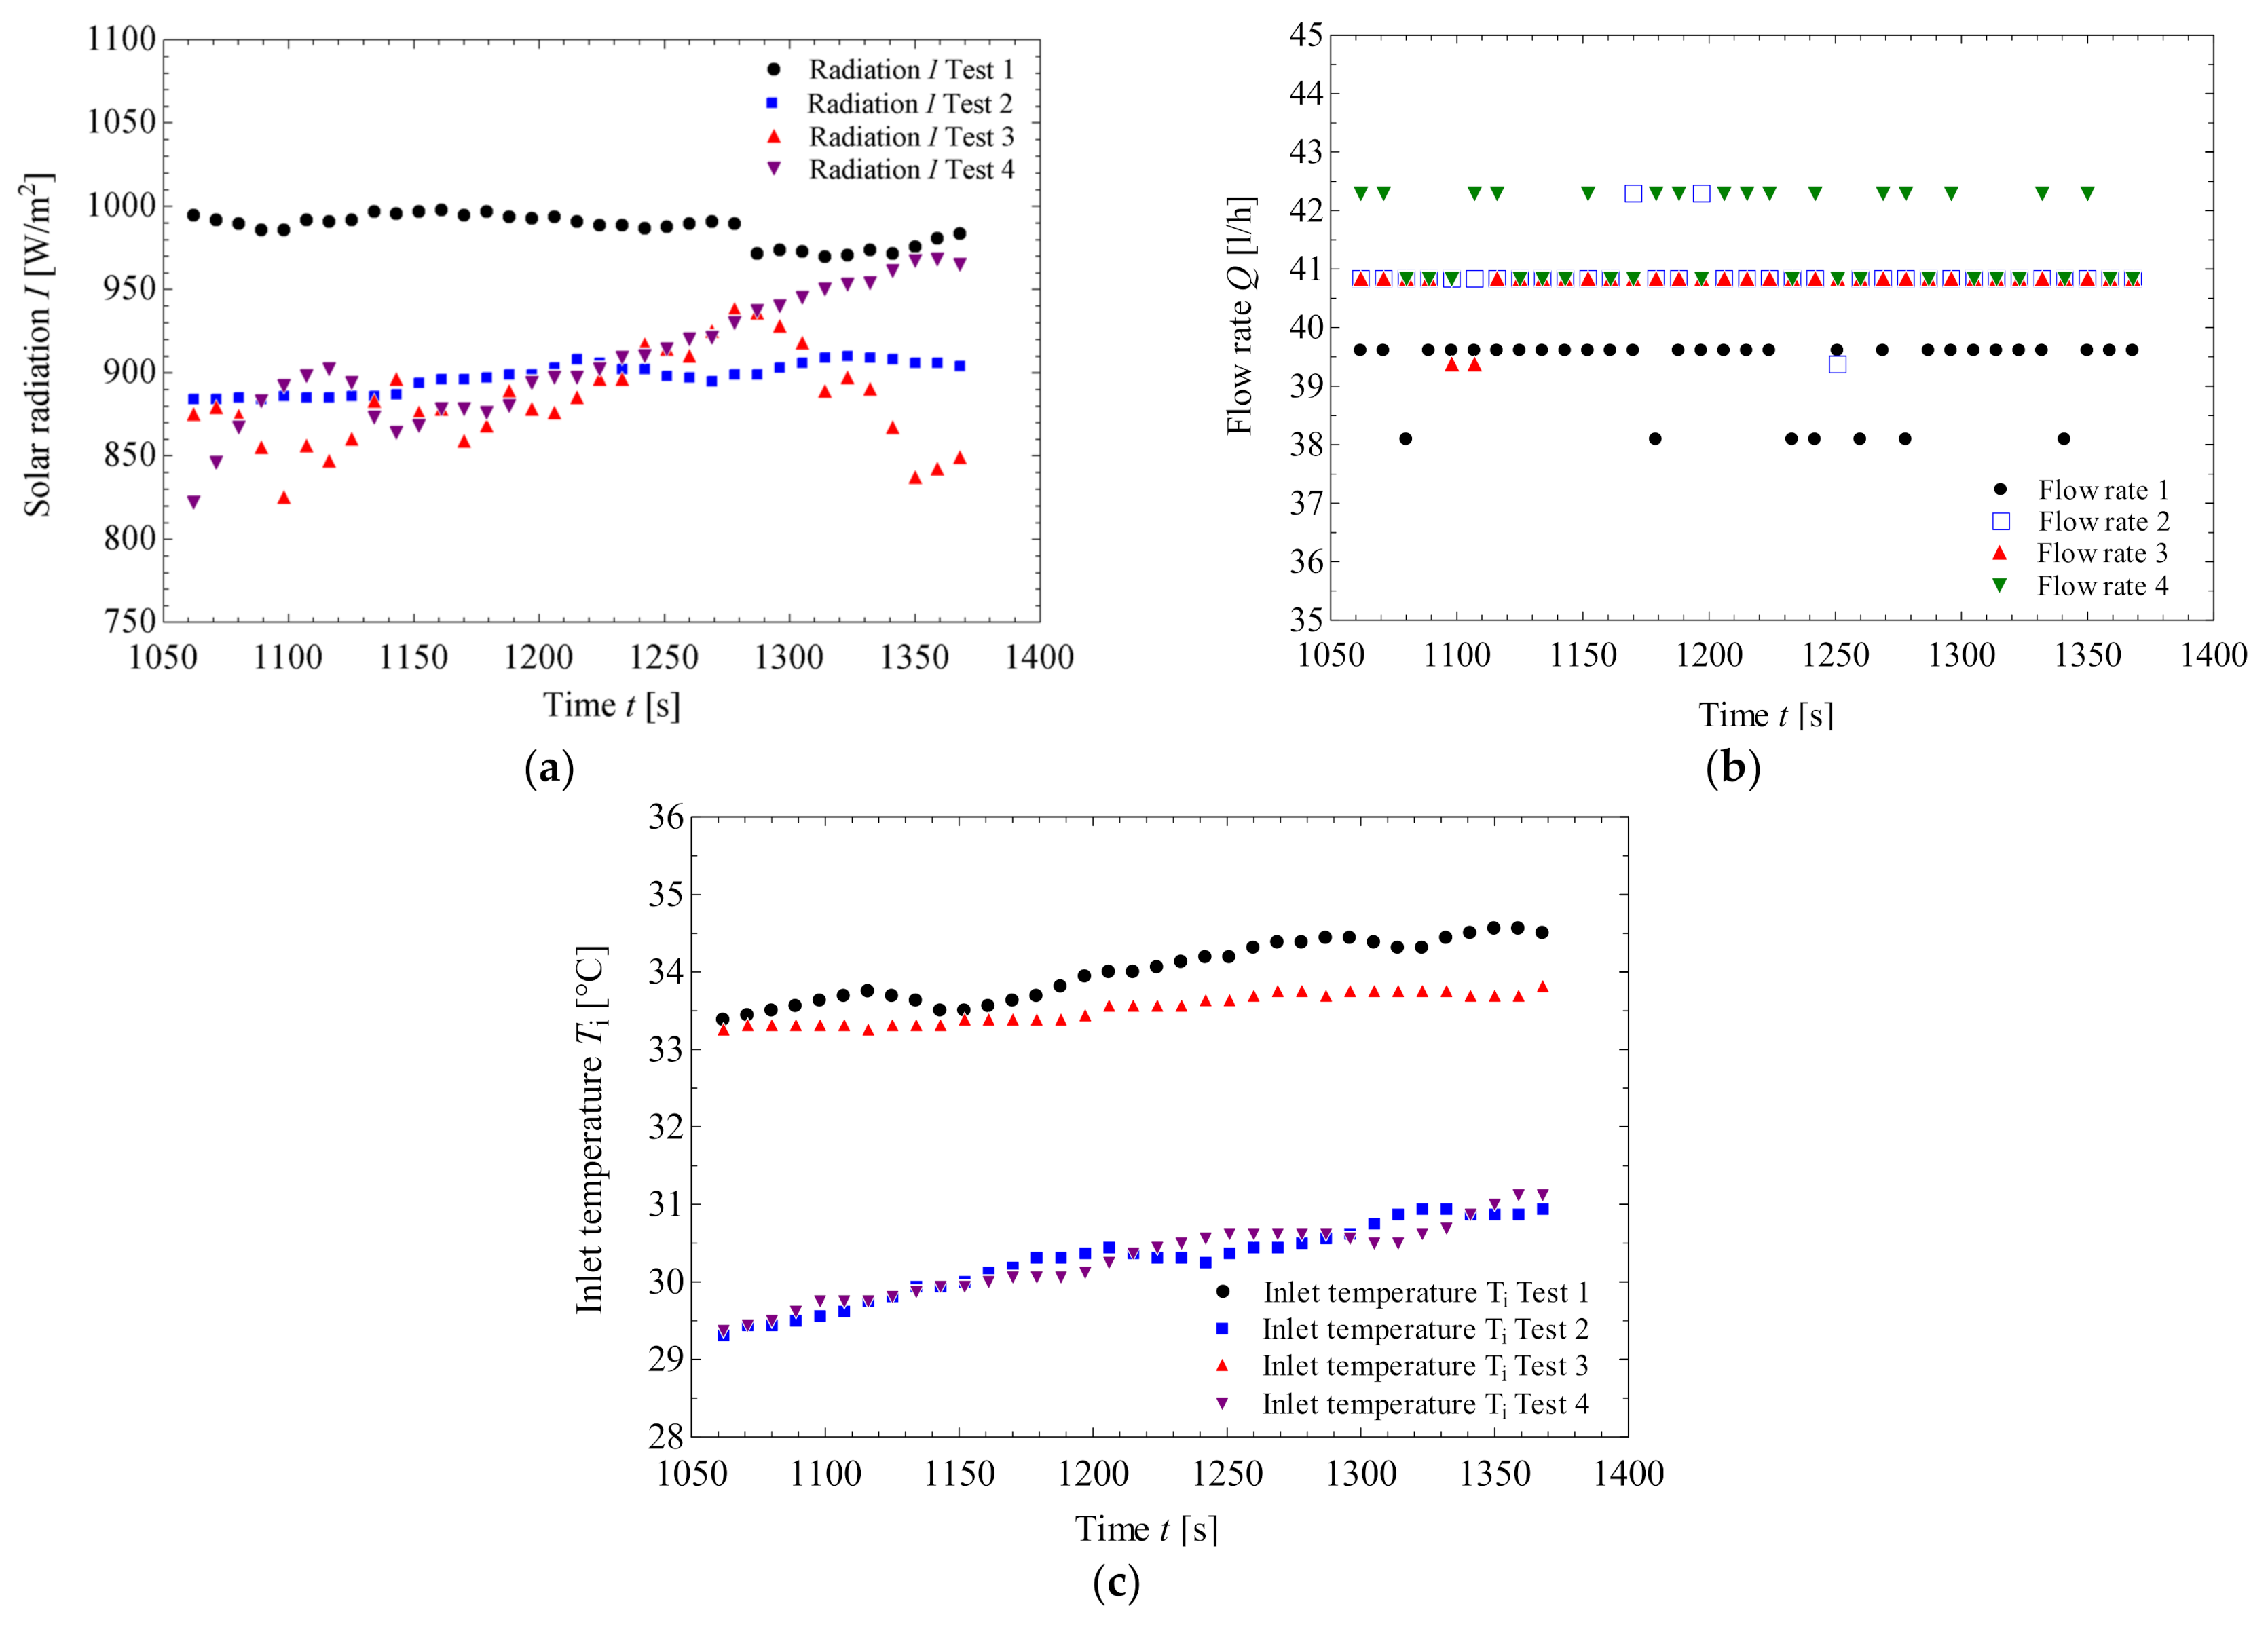
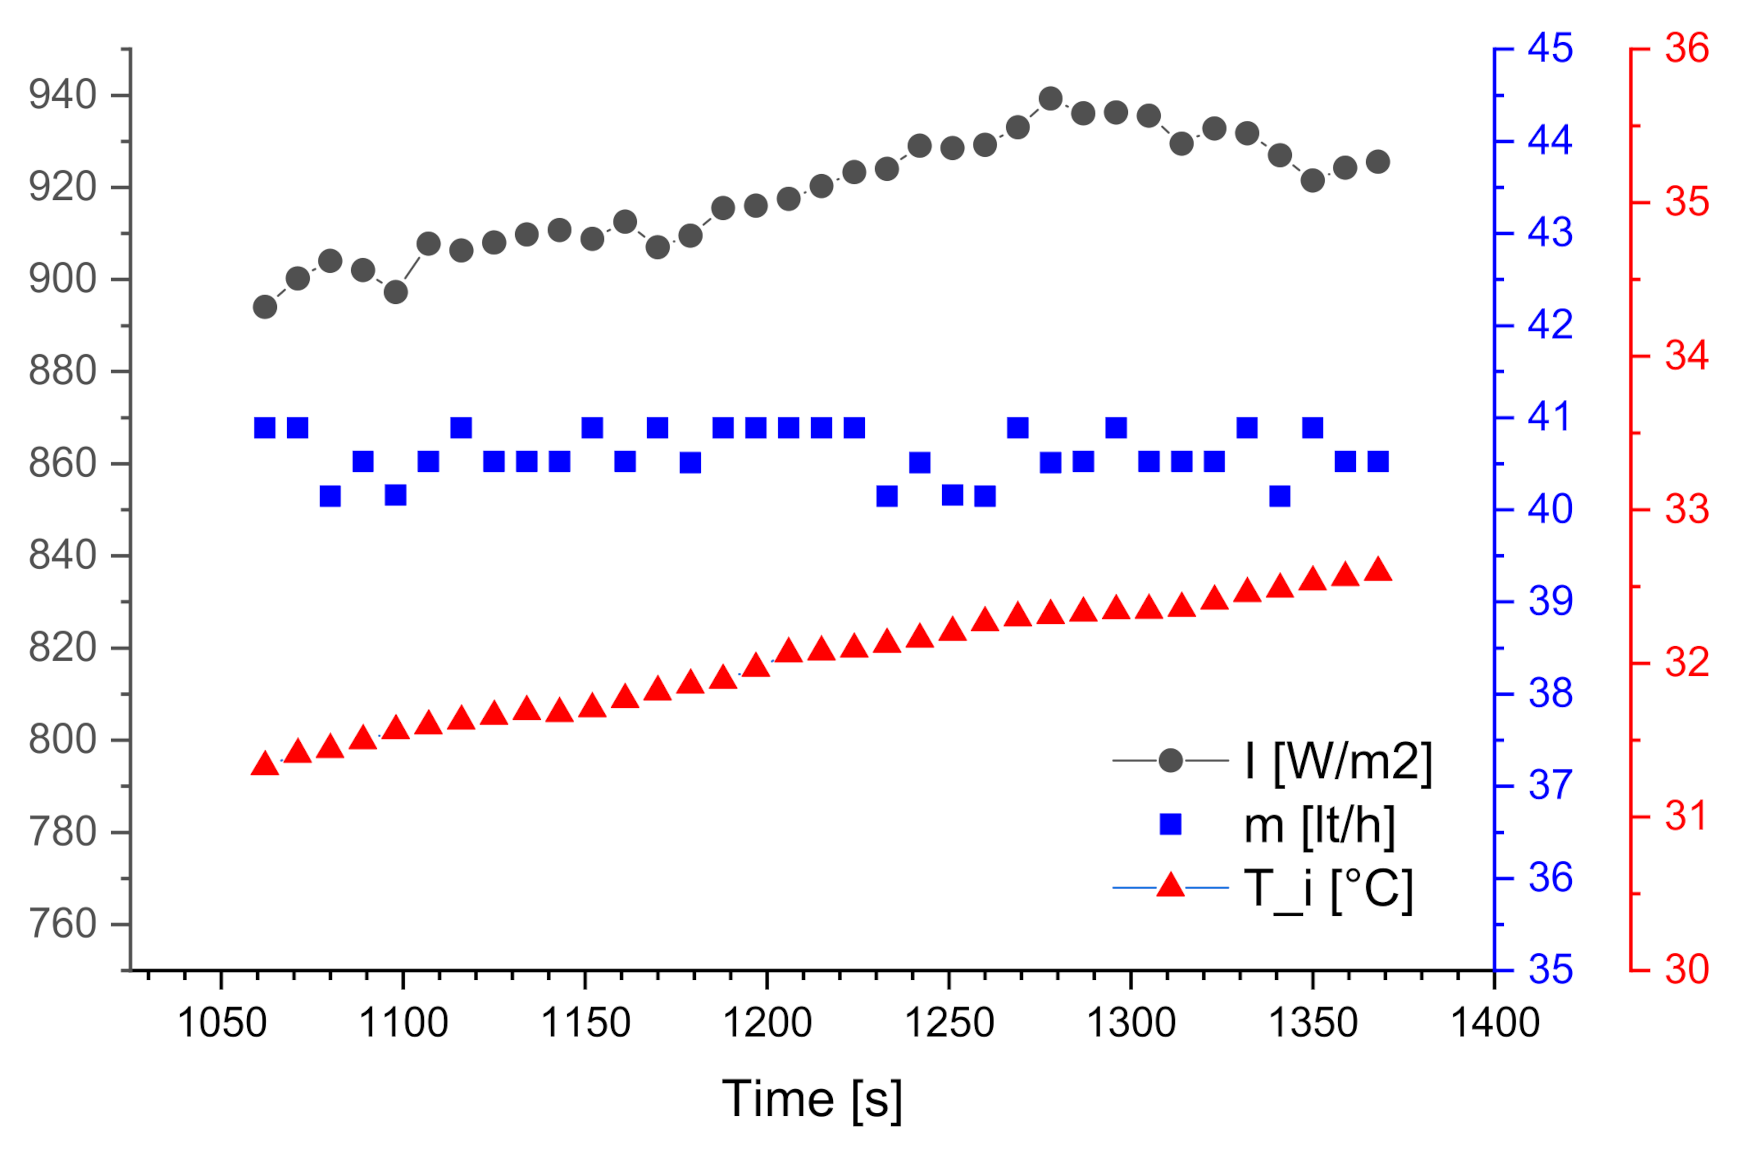
3.1. Steady State Results

In the measurements made in this work, the solar radiation meter used only measures direct radiation, which means that it provides minimum values when the sun is obstructed by a cloud, for example. This causes the measured radiation values to vary between 100 W/m2 and 1200 W/m2 in a few seconds. To solve this problem, between 3 to 5 measurements were made for each established volumetric flow, at the same time of the day and during days in summer and autumn that normally have close radiation values. Once such considerations were made and the measurements were performed, values of each variable were extracted during an interval of approximately 5 min and in which both the radiation and the volumetric flow were kept constant (Figure 12). The temperatures normally increased, however, and for the analysis, an average of each variable was used.
An example of these tests is shown in Figure 13. The complete group of measurements, made for all flows and volume fractions analyzed, is shown in [56]. From the figure, it can be seen that the values of each variable can be considered stable, because the maximum deviations were 37 W/m2, 0.012 LT/s and 0.48 °C for radiation, flow rate and inlet temperature.

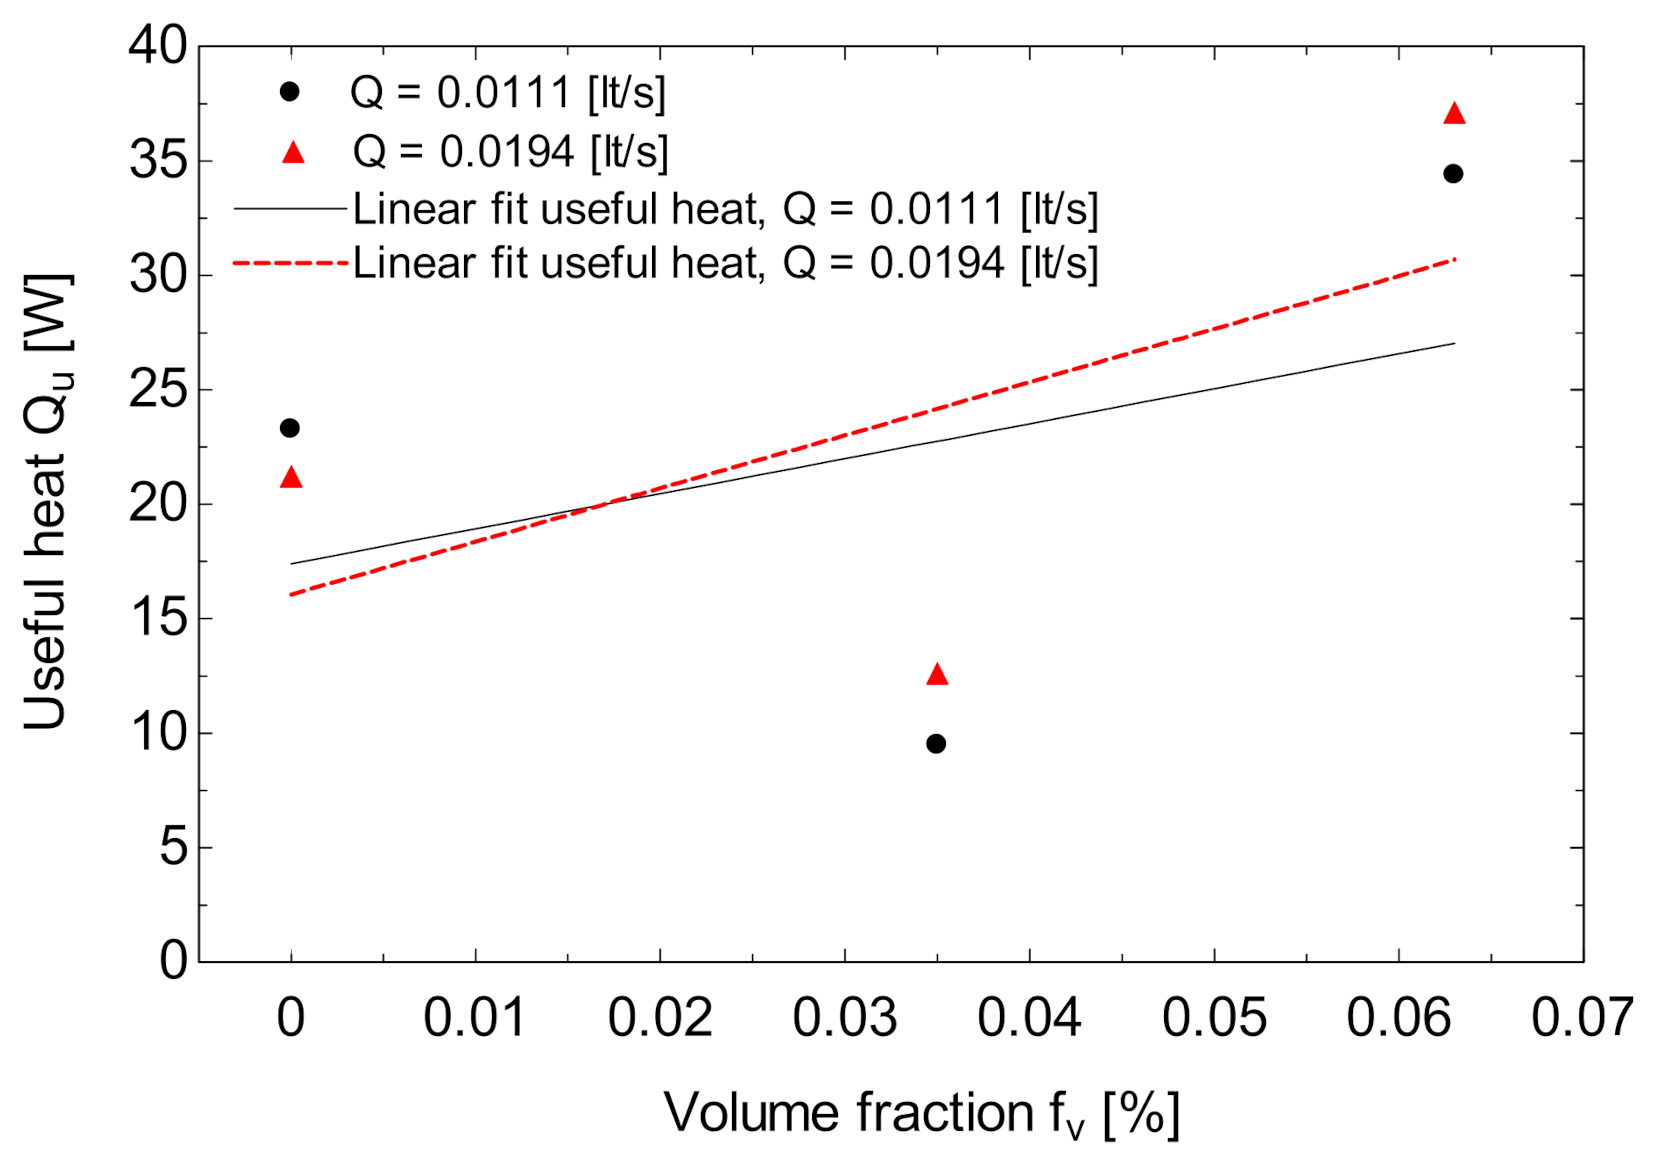
3.2. Solar Collector Performance Assessment

This section describes the results obtained from the different tests carried out throughout this research. The experimental and analytical results of the nanofluid samples, using an LTSC, are presented. Thirty-four tests were carried out, varying the volumetric flow: 0.0111 LT/s, 0.0166 LT/s and 0.0194 LT/s. Two different samples of nanofluids, with concentrations of 0.035% and 0.063% were made. The tests were carried out during the summer and fall of the year 2019, from 12 a.m. to 3 p.m., in intervals of 5 min per trial, performing three to five measurements for each volumetric flow and volume fraction, throughout the week, observing constant radiation. This has been made with the aim to compare using radiation values as similar as possible. Figure 14 shows the useful heat results of the LTSC, with two different concentrations compared to the base fluid. From the figure, it can be seen that at 0.035%, the heat produced by the collector is less than that of the base fluid. This may be because, at low concentrations, nanoparticles not only absorb energy, but also emit heat. From the same figure, it can be seen that at 0.063% concentration, the useful heat of the LTSC increases up to 47.22% with the flow of 0.0194 LT/s. The decrease in useful heat at a low concentration can be explained because the flow regime, represented by the Reynolds number (Re), is lower, which indicates that the effect of viscous forces predominates as the volumetric flow approaches zero and, therefore, less heat exchange is generated between the receiving tube and the flow.
Figure 15 shows the efficiency results of the LTSC using carbon nanoparticles, compared with the base fluid at two nanofluid flows. From the figure, like the useful heat, the efficiency decreases at a low concentration of 0.035%, while at a concentration of 0.063%, the efficiency increases up to 47.2%, with respect to that of the base fluid. The increase in efficiency at a higher nanoparticle concentration can also be due to the higher saturation energy of the thin films.

4. Conclusions

Based on the work presented here, the following conclusions have been derived:
From the simulation, the efficiency is negatively affected when the diameter of the nanoparticle increases, because the global heat transfer area between the nanoparticle and the base fluid decreases. Furthermore, the efficiency decreases when the solar radiation and the inlet temperature rise. Likewise, the efficiency enlarges when the volume fraction is higher.
For the production of Fullerene C60, it is important to first evaluate the temperature profile inside the microwave oven, to identify the maximum temperature points. To ensure that the thin carbon film obtained is useful, a silver-gray layer and a characteristic soot of macromolecule formation should be visualized. The separation of carbon molecules can be accelerated by the manual grinding and sonication of carbon diluted in alcohol. Using high-resolution electron microscopy, it can be verified that the thin film contains up to approximately 90% of Fullerene C60, with a diameter of less than 20 nm.
From the evaluation of the low-temperature solar collector performance using carbon nanofluids, it can be concluded that the efficiency of the low-temperature collector, using C60 fullerene nanofluids, can be improved by up to 47.22%, at 0.063% volume fraction and 0.0194 LT/s, with respect to one that uses water as the working fluid.

Author Contributions

Conceptualization, E.E.B., A.M., L.G.D.-B. and A.Z.; methodology, E.E.B. and A.M., L.G.D.-B. and A.Z.; software, J.d.J.R., J.M.C. and A.Z.; validation, J.d.J.R., M.D.V., N.G., M.V. and A.Z.; formal analysis, A.M., L.G.D.-B., G.L.G., M.D.V., N.G., M.V. and A.Z.; investigation, E.E.B., A.M., L.G.D.-B., M.V. and A.Z.; resources, A.M., L.G.D.-B. and A.Z.; data curation, E.E.B., J.d.J.R. and A.Z.; writing—original draft preparation, E.E.B. and A.Z.; writing—review and editing, E.E.B., L.G.D.-B., J.d.J.R., J.M.C., M.V. and A.Z.; visualization, G.L.G., M.D.V. and N.G.; supervision, A.Z.; project administration, A.Z.; funding acquisition, A.M., L.G.D.-B. and A.Z. All authors have read and agreed to the published version of the manuscript.

Funding

This research was funded by the National Polytechnic Institute of Mexico (IPN), Project (SIP20220182). E.E.B. thanks CONACYT for the scholarship granted.

Institutional Review Board Statement

Not applicable.

Informed Consent Statement

Not applicable.

Data Availability Statement

Data are contained within the article.

Conflicts of Interest

The authors declare no conflict of interest. The funders had no role in the design of the study; in the collection, analyses, or interpretation of data; in the writing of the manuscript, or in the decision to publish the results.

References

  1. Justo, J.J.; Mwasilu, F.; Lee, J.; Jung, J.W. AC-microgrids versus DC-microgrids with distributed energy resources: A review. Renew. Sustain. Energy Rev. 2013, 24, 387–405. [Google Scholar] [CrossRef]
  2. Venegas, M.; García-Hernando, N.; Zacarías, A.; de Vega, M. Performance of a solar absorption cooling system using nanofluids and a membrane-based microchannel desorber. Appl. Sci. 2020, 10, 2761. [Google Scholar] [CrossRef] [Green Version]
  3. Romage, G.; Jiménez, C.; de Jesús, R.J.; Zacarías, A.; Carvajal, I.; Jiménez, J.A.; Pineda, J.; Venegas, M. Modeling and simulation of a hybrid compression/absorption chiller driven by stirling engine and solar dish collector. Appl. Sci. 2020, 10, 9018. [Google Scholar] [CrossRef]
  4. Hewakuruppu, Y.L.; Taylor, R.A.; Tyagi, H.; Khullar, V.; Otanicar, T.; Coulombe, S.; Hordy, N. Limits of selectivity of direct volumetric solar absorption. Sol. Energy 2015, 114, 206–216. [Google Scholar] [CrossRef]
  5. Minardi, J.E.; Chuang, H.N. Performance of a “black” liquid flat-plate solar collector. Sol. Energy 1975, 17, 179–183. [Google Scholar] [CrossRef]
  6. Muhammad, M.J.; Muhammad, I.A.; Sidik, N.A.C.; Yazid, M.N.A.W.M.; Mamat, R.; Najafi, G. The use of nanofluids for enhancing the thermal performance of stationary solar collectors: A review. Renew. Sustain. Energy Rev. 2016, 63, 226–236. [Google Scholar] [CrossRef]
  7. Gorji, T.B.; Ranjbar, A.A. A review on optical properties and application of nanofluids in direct absorption solar collectors (DASCs). Renew. Sustain. Energy Rev. 2017, 72, 10–32. [Google Scholar] [CrossRef]
  8. Delfani, S.; Esmaeili, M.; Karami, M. Application of artificial neural network for performance prediction of a nanofluid-based direct absorption solar collector. Sustain. Energy Technol. Assess. 2019, 36, 100559. [Google Scholar] [CrossRef]
  9. Guo, C.; Liu, C.; Jiao, S.; Wang, R.; Rao, Z. Introducing optical fiber as internal light source into direct absorption solar collector for enhancing photo-thermal conversion performance of MWCNT-H2O nanofluids. Appl. Therm. Eng. 2020, 173, 115207. [Google Scholar] [CrossRef]
  10. Struchalin, P.G.; Yunin, V.S.; Kutsenko, K.V.; Nikolaev, O.V.; Vologzhannikova, A.A.; Shevelyova, M.P.; Gorbacheva, O.S.; Balakin, B.V. Performance of a tubular direct absorption solar collector with a carbon-based nanofluid. Int. J. Heat Mass Transf. 2021, 179, 121717. [Google Scholar] [CrossRef]
  11. Arai, N.; Itaya, Y.; Hasatani, M. Development of a “volume heat-trap” type solar collector using a fine-particle semitransparent liquid suspension (FPSS) as a heat vehicle and heat storage medium Unsteady, one-dimensional heat transfer in a horizontal FPSS layer heated by thermal radiatio. Sol. Energy 1984, 32, 49–56. [Google Scholar] [CrossRef]
  12. Webb, B.W.; Viskanta, R. Analysis of heat transfer and solar radiation absorption in an irradiated thin, falling molten salt film. J. Sol. Energy Eng. Trans. ASME 1985, 107, 113–119. [Google Scholar] [CrossRef]
  13. Bueke, A.R.; Etter, D.E.; Hudgens, C.R.; Wiedenheft, C.J.; Wittenberg, L.J. Thermal and Photochemical Studies of Solar Energy. Sol. Energy Mater. 1982, 6, 481–490. [Google Scholar]
  14. Das, S.K.; Choi, S.U.S.; Patel, H.E. Heat transfer in nanofluids—A review. Heat Transf. Eng. 2006, 27, 3–19. [Google Scholar] [CrossRef]
  15. Yu, F.; Chen, Y.; Liang, X.; Xu, J.; Lee, C.; Liang, Q.; Tao, P.; Deng, T. Dispersion stability of thermal nanofluids. Prog. Nat. Sci. Mater. Int. 2017, 27, 531–542. [Google Scholar] [CrossRef]
  16. Martínez, V. Estudio del Tratamiento a Altas Presiones en la Estabilidad de un Nanofluido. Master’s Thesis, Universidad de Santiago de Chile, Santiago, Chile, 2016. [Google Scholar]
  17. Wu, D.; Zhu, H.; Wang, L.; Liu, L. Critical Issues in Nanofluids Preparation, Characterization and Thermal Conductivity. Curr. Nanosci. 2009, 5, 103–112. [Google Scholar] [CrossRef]
  18. Hosseini, S.M.S.; Shafiey Dehaj, M. Assessment of TiO2 water-based nanofluids with two distinct morphologies in a U type evacuated tube solar collector. Appl. Therm. Eng. 2021, 182, 116086. [Google Scholar] [CrossRef]
  19. Rubbi, F.; Das, L.; Habib, K.; Aslfattahi, N.; Saidur, R.; Rahman, M.T. State-of-the-art review on water-based nanofluids for low temperature solar thermal collector application. Sol. Energy Mater. Sol. Cells 2021, 230, 111220. [Google Scholar] [CrossRef]
  20. Ahbabi Saray, J.; Heyhat, M.M. Modeling of a direct absorption parabolic trough collector based on using nanofluid: 4E assessment and water-energy nexus analysis. Energy 2022, 244, 123170. [Google Scholar] [CrossRef]
  21. Behura, A.K.; Gupta, H.K. Efficient Direct Absorption Solar Collector Using Nanomaterial Suspended Heat Transfer Fluid. Mater. Today Proc. 2019, 22, 1664–1668. [Google Scholar] [CrossRef]
  22. Vakili, M.; Yahyaei, M.; Ramsay, J.; Aghajannezhad, P.; Paknezhad, B. Adaptive neuro-fuzzy inference system modeling to predict the performance of graphene nanoplatelets nanofluid-based direct absorption solar collector based on experimental study. Renew. Energy 2021, 163, 807–824. [Google Scholar] [CrossRef]
  23. Otanicar, T.P.; Phelan, P.E.; Prasher, R.S.; Rosengarten, G.; Taylor, R.A. Nanofluid-based direct absorption solar collector. J. Renew. Sustain. Energy 2010, 2, 033102. [Google Scholar] [CrossRef] [Green Version]
  24. Tyagi, H.; Phelan, P.; Prasher, R. Predicted efficiency of a Low-temperature Nanofluid-based direct absorption solar collector. J. Sol. Energy Eng. Trans. ASME 2009, 131, 0410041–0410047. [Google Scholar] [CrossRef]
  25. Taylor, R.; Coulombe, S.; Otanicar, T.; Phelan, P.; Gunawan, A.; Lv, W.; Rosengarten, G.; Prasher, R.; Tyagi, H. Small particles, big impacts: A review of the diverse applications of nanofluids. J. Appl. Phys. 2013, 113, 011301. [Google Scholar] [CrossRef]
  26. Gupta, H.K.; Agrawal, G.D.; Mathur, J. An experimental investigation of a low temperature Al2O3-H2O nanofluid based direct absorption solar collector. Sol. Energy 2015, 118, 390–396. [Google Scholar] [CrossRef]
  27. Karami, M.; Akhavan-Bahabadi, M.A.; Delfani, S.; Raisee, M. Experimental investigation of CuO nanofluid-based Direct Absorption Solar Collector for residential applications. Renew. Sustain. Energy Rev. 2015, 52, 793–801. [Google Scholar] [CrossRef]
  28. Huang, J.; Chen, Z.; Du, Z.; Xu, X.; Zhang, Z.; Fang, X. A highly stable hydroxylated graphene/ethylene glycol-water nanofluid with excellent extinction property at a low loading for direct absorption solar collectors. Thermochim. Acta 2020, 684, 178487. [Google Scholar] [CrossRef]
  29. Joseph, A.; Thomas, S. Energy, exergy and corrosion analysis of direct absorption solar collector employed with ultra-high stable carbon quantum dot nanofluid. Renew. Energy 2022, 181, 725–737. [Google Scholar] [CrossRef]
  30. Sreehari, S.; Joseph, A.; Thomas, S. Development of a low cost nanofluid based direct absorption solar collector. Mater. Today Proc. 2019, 22, 2424–2430. [Google Scholar] [CrossRef]
  31. Dall’Asén, A.G.; Verdier, M.; Huck, H.; Halac, E.B.; Reinoso, M. Nanoindentation on carbon thin films obtained from a C 60 ion beam. Appl. Surf. Sci. 2006, 252, 8005–8009. [Google Scholar] [CrossRef]
  32. Rusop, M.; Tian, X.M.; Kinugawa, T.; Soga, T.; Jimbo, T.; Umeno, M. Preparation and characterization of boron-incorporated amorphous carbon films from a natural source of camphoric carbon as a precursor material. Appl. Surf. Sci. 2005, 252, 1693–1703. [Google Scholar] [CrossRef]
  33. Somani, P.R.; Somani, S.P.; Umeno, M. Planer nano-graphenes from camphor by CVD. Chem. Phys. Lett. 2006, 430, 56–59. [Google Scholar] [CrossRef]
  34. Kumar, M.; Okazaki, T.; Hiramatsu, M.; Ando, Y. The use of camphor-grown carbon nanotube array as an efficient field emitter. Carbon N. Y. 2007, 45, 1899–1904. [Google Scholar] [CrossRef]
  35. Kar, S.; Chaudhuri, S. Optical properties of diamond films deposited by low temperature microwave plasma CVD from camphor. Mater. Lett. 2004, 58, 3029–3033. [Google Scholar] [CrossRef]
  36. Kalita, G.; Masahiro, M.; Uchida, H.; Wakita, K.; Umeno, M. Few layers of graphene as transparent electrode from botanical derivative camphor. Mater. Lett. 2010, 64, 2180–2183. [Google Scholar] [CrossRef]
  37. Lew, A.; Krutzik, P.O.; Hart, M.E.; Chamberlin, A.R. Increasing rates of reaction: Microwave-assisted organic synthesis for combinatorial chemistry. J. Comb. Chem. 2002, 4, 95–105. [Google Scholar] [CrossRef]
  38. Martínez-Palou, R. Microwave-assisted synthesis using ionic liquids. Mol. Divers. 2010, 14, 3–25. [Google Scholar] [CrossRef]
  39. Valencia, A. Evaluación numérica del rendimiento de un colector solar de absorción directa usando nanopartículas de grafito. Master’s Thesis, Instituto Politécnico Nacional, Mexico City, Mexico, 2018. [Google Scholar]
  40. Valencia, A.; Zacarías, A.; Eduardo, E.; De Jesús, J.; Jiménez, C.; Gustavo, J. Tema A4 Termofluidos “ Evaluación numérica del rendimiento de un colector solar de absorción directa usando nanopartículas de grafito”. Congr. SOMIM 2021, 194–200. [Google Scholar]
  41. Deceased, J.A.D.; Beckman, W.A. Solar Engineering of Thermal Processes; Wiley: Hoboken, NJ, USA, 1982; Volume 3, ISBN 9780470873663. [Google Scholar]
  42. Gorji, T.B.; Ranjbar, A.A. A numerical and experimental investigation on the performance of a low-flux direct absorption solar collector (DASC) using graphite, magnetite and silver nanofluids. Sol. Energy 2016, 135, 493–505. [Google Scholar] [CrossRef]
  43. Klein, S.A. Engineering Equation Solver, 1992–2015, f-Chart Software. 2018. Available online: https://fchartsoftware.com/ees/ (accessed on 10 March 2022).
  44. Zacarías, A.; Quiroz, J.A.; Gutiérrez-Urueta, G.L.; Venegas, M.; Carvajal, I.; Rubio, J. Comparison between adiabatic and non-adiabatic absorption chillers using ammonia-lithium nitrate and water-lithium bromide solutions. Heat Transf. Res. 2020, 51, 609–621. [Google Scholar] [CrossRef]
  45. Cengel, Y.A.; Ghajar, A.J. Transferencia de Calor y Masa, 4th ed.; Mc Graw Hill: Mexico City, Mexico, 2011; ISBN 978-607-15-0540-8. [Google Scholar]
  46. Dresselhaus, M.S.; Dresselhaus, G.; Eklund, P.C. Science of Fullerenes and Carbon Nanotubes; Academic Press: New York, NY, USA, 1996; ISBN 9780080540771. [Google Scholar]
  47. Olson, J.R.; Topp, K.A.; Pohl, R.O. Specific heat and thermal conductivity of of solid Fullerenes. Science 1993, 259, 1145–1148. [Google Scholar] [CrossRef] [PubMed]
  48. Diky, V.V.; Zhura, L.S.; Kabo, A.G.; Markov, V.Y.; Kabo, G.J.; Zhelezny, V.P.; Khanchych, K.Y.; Motovoy, I.V.; Nikulina, A.S. High-temperature heat capacity of C60 fullerene. J. Mol. Liq. 2001, 328, 115416. [Google Scholar] [CrossRef]
  49. Zhelezny, V.P.; Khanchych, K.Y.; Motovoy, I.V.; Nikulina, A.S. Viscous behaviour of o-xylene/fullerene C60 solutions. J. Mol. Liq. 2021, 328, 115416. [Google Scholar] [CrossRef]
  50. Martínez, J. Caracterización de Película Delgada de Carbono Obtenida vía Radiación de Microondas. Ph.D. Thesis, Instituto Politécnico Nacional, Mexico City, Mexico, 2013. [Google Scholar]
  51. Martínez-Reyes, J.; Barriga-Arceo, L.G.D.; Rendón-Vazquez, L.; Martínez-Guerrero, R.; Romero-Partida, N.; Palacios-González, E.; Garibay-Febles, V.; Ortiz-López, J. Microstructural Characterization of Large Area C60 Films Obtained by Conventional Microwave Oven Irradiation. World J. Nano Sci. Eng. 2012, 2, 213–218. [Google Scholar] [CrossRef] [Green Version]
  52. Serebryanayaa, N.R.; Blanka, V.D.; Ivdenkoa, V.A.; Chernozatonskiib, L.A. Pressure-induced superhard phase of C60. Solid State Commun. 2001, 118, 183–187. [Google Scholar] [CrossRef]
  53. Serebryanaya, N.R. X-ray Reference Patterns with PDF Number 49-1717 and 49-1718 database PDF-2 (2003) Produced for Superhard Pressure-Induced Phases of Fullerite C60. Available online: https://www.icdd.com/pdf-2/ (accessed on 10 March 2022).
  54. Chavda, V.P. Nanobased Nano Drug Delivery; Elsevier Inc.: Rajkot, India, 2019; ISBN 9780128140291. [Google Scholar]
  55. Bock Choon Pak, Y.I.C. Hydrodynamic and Heat Transfer Study of Dispersed Fluids With Submicron Metallic Oxide. Exp. Heat Transf. A J. Therm. Energy Transp. Storage Convers. 2013, 37–41. Available online: http://www.tandfonline.com/loi/ueht20 (accessed on 10 March 2022).
  56. Barrera, E.E. Análisis Experimental de un Colector Solar de Absorción Directa Utilizando Nanopartículas de Grafito. Master’s Thesis, Instituto Politécnico Nacional, Mexico City, Mexico, 2020. [Google Scholar]
Figure 1. Diagram of the direct absorption solar collector. (a) Isometric, (b) side view.
Applsci 12 03161 g001
Figure 2. Simultaneous analysis of the effect of nanoparticle size and volume fraction on LTSC performance.
Applsci 12 03161 g002
Figure 3. Analysis of the efficiency of the LTSC with increasing solar irradiation.
Applsci 12 03161 g003
Figure 4. Instantaneous efficiency as a function of reduced temperature for different irradiation in a flat plate collector.
Applsci 12 03161 g004
Figure 5. (a) Placement of the container, (b) generation of the electric arc in the microwave cavity, (c) detachment of the carbon film from the substrate, (d) comparison of the carbon film.
Applsci 12 03161 g005
Figure 6. (a) Morphology of the carbon thin film, (b) particles precipitated in the thickness of the carbon film.
Applsci 12 03161 g006
Figure 7. Spectrum processing.
Applsci 12 03161 g007
Figure 8. High-resolution transmission micrograph seen in an HRTEM. (a) Bright field, (b) Fast Fourier Transform (FFT), (c) Inverse Fourier Transform, (d) interplanar distance measurement.
Applsci 12 03161 g008
Figure 9. (a) Dispersion of nanoparticles, (b) ultrasonic bath agitation.
Applsci 12 03161 g009
Figure 10. Scheme of the test rig.
Applsci 12 03161 g010
Figure 11. Direct Absorption Solar Collector used in the experimental tests, (a) front view, (b) back view.
Applsci 12 03161 g011
Figure 12. Steady state of (a) solar radiation, (b) flow rate, (c) temperatures.
Applsci 12 03161 g012
Figure 13. Steady state performance of the radiation, flow rate and inlet temperature.
Applsci 12 03161 g013
Figure 14. Average useful heat with base fluid and nanoparticles at 0.035% and 0.063% (H2O–C).
Applsci 12 03161 g014
Figure 15. Efficiency of the CSAD using Fullerenes C60, with respect to the concentration at two flow rates.
Applsci 12 03161 g015
Table 1. Thermophysical properties of water and nanoparticles at 300 K.
Thermophysical PropertyWater [45]Fullerene
Density, kg/m39971720 [46]
Specific heat, J/kg K4180506.1 [47,48]
Thermal conductivity, W/m K0.6070.4 [46]
Viscosity, kg/m s0.007980.133231 [49]
Table 2. Spectrum processing.
StandardElementsWeight [%]Atomic [%]
CC K84.0587.53
OO K15.9512.47
Totals100100
Table 3. Specifications of measuring instruments.
Thermophysical PropertiesRangePrecision
Flowmeter, LT/min0.3–6±5% FS
Pyranometer, W/m21–1999±5% FS
Inlet temperature, Ti, °C−20–1001
Outlet temperature, To, °C−20–1501.5
Environment temperature, Ta, °C−20–1001
Publisher’s Note: MDPI stays neutral with regard to jurisdictional claims in published maps and institutional affiliations.

